Efficacy profile of the CYD-TDV dengue vaccine revealed by Bayesian survival analysis of individual-level phase III data
- MRC Centre for Global Infectious Disease Analysis, School of Public Health, Imperial College London, Faculty of Medicine, United Kingdom
- Sanofi Pasteur, France
Figures
Figure 1
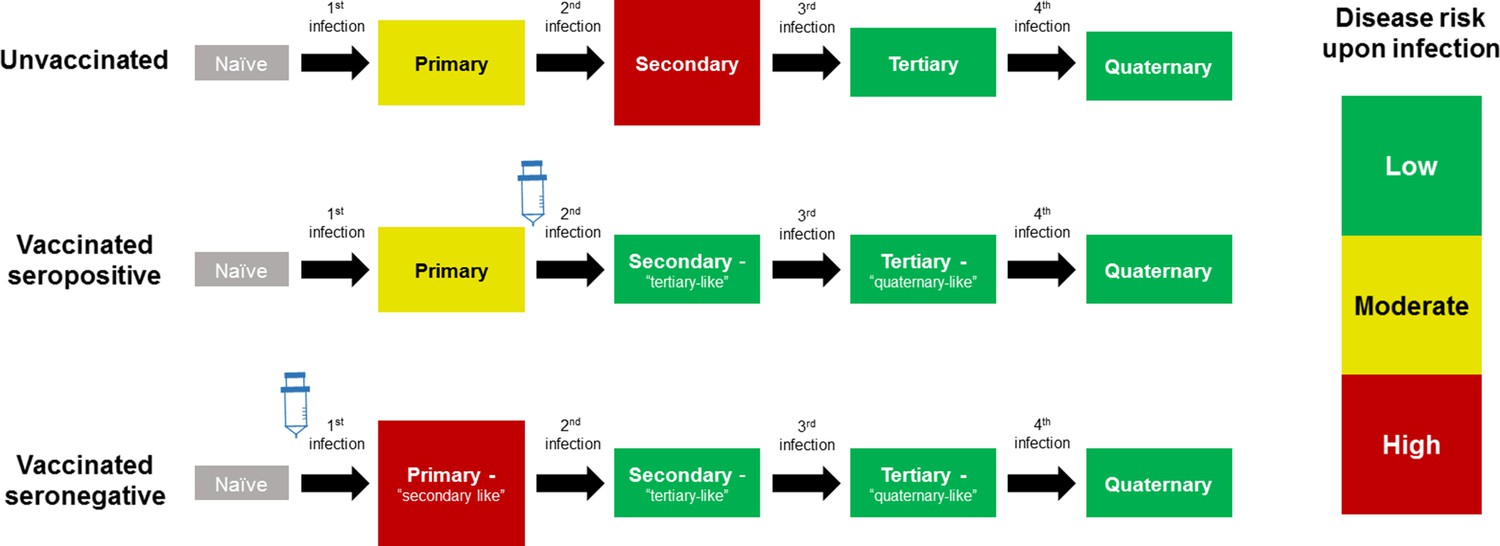
Model Schematic 1: vaccine as silent infection.
Top row: unvaccinated individuals are naive, or infected with either: their first dengue infection with moderate disease risk; their second higher risk infection; or their third or fourth lower risk infection. Middle row: vaccinating seropositive individuals with a single prior infection lowers the disease risk associated with secondary infection to that associated with tertiary and quaternary infection. Bottom row: vaccinating naive (seronegative) individuals increases disease risk upon their first natural infection. Figure adapted from Ferguson et al., 2016 with permission.
Figure 2
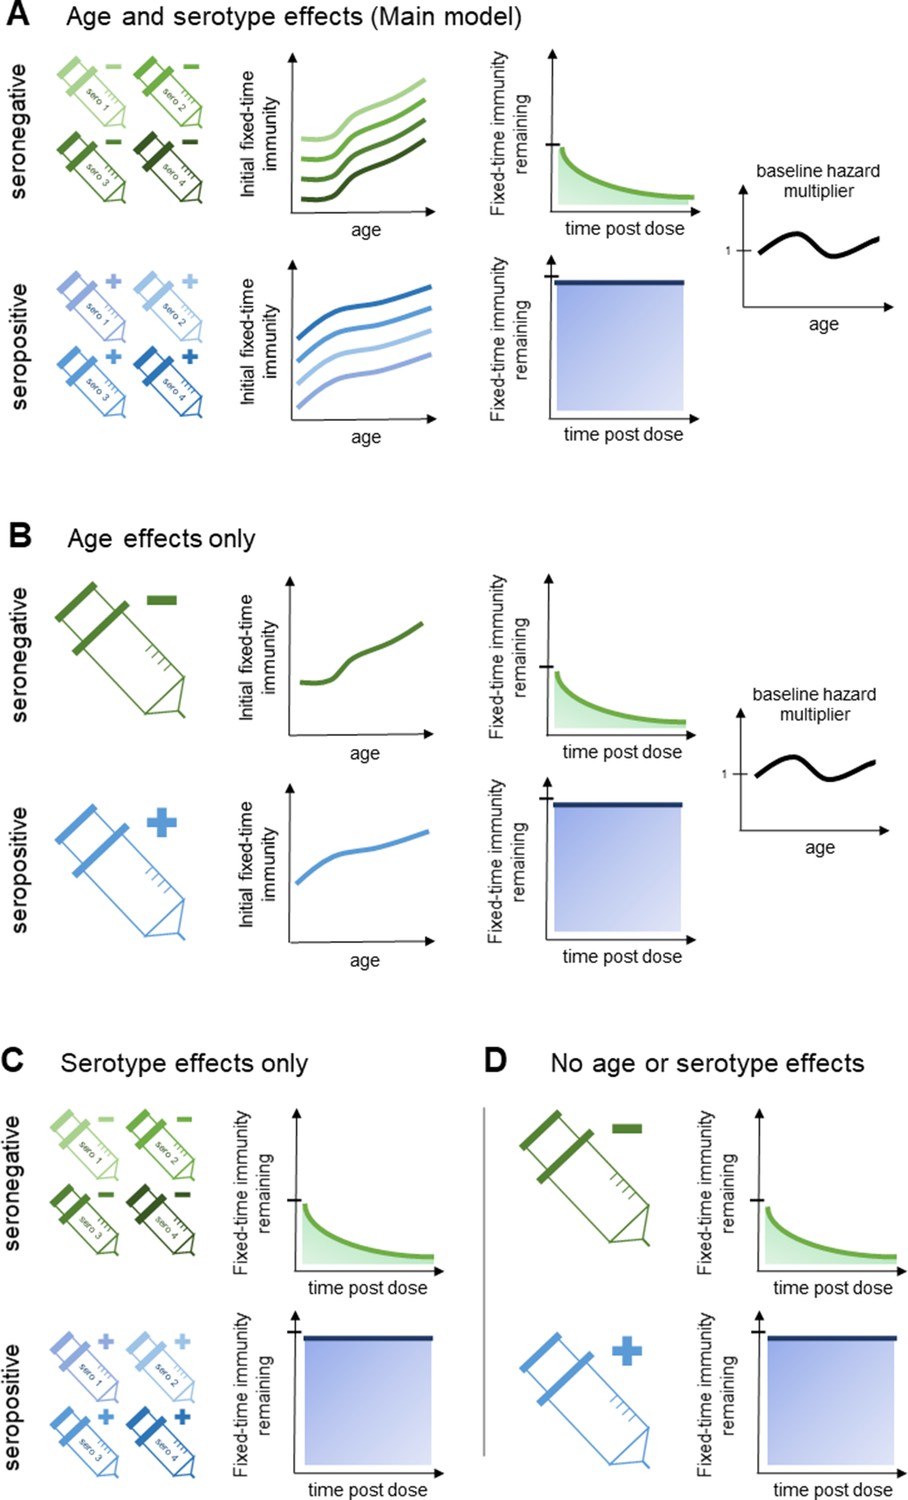
Model schematic 2: vaccine-induced transient immunity model hierarchy.
In all model variants, we allow the initial magnitude and mean duration of transient immunity to vary by baseline serostatus (exponential waning is assumed). (A) Our main model allows transient immunity magnitude to vary by age and serotype, as well as baseline serostatus. For each serostatus, we model transient immunity with age, and serotype effects are incorporated additively (see Materials and methods for details). We further include an age-specific multiplier of the baseline hazard. (B) and (C) show reduced model variants that dispense with serotype and age effects, respectively. (D) Shows our simplest model variant without explicit age or serotype effects.
Figure 3

Summary of trial data.
Figure 4 with 4 supplements
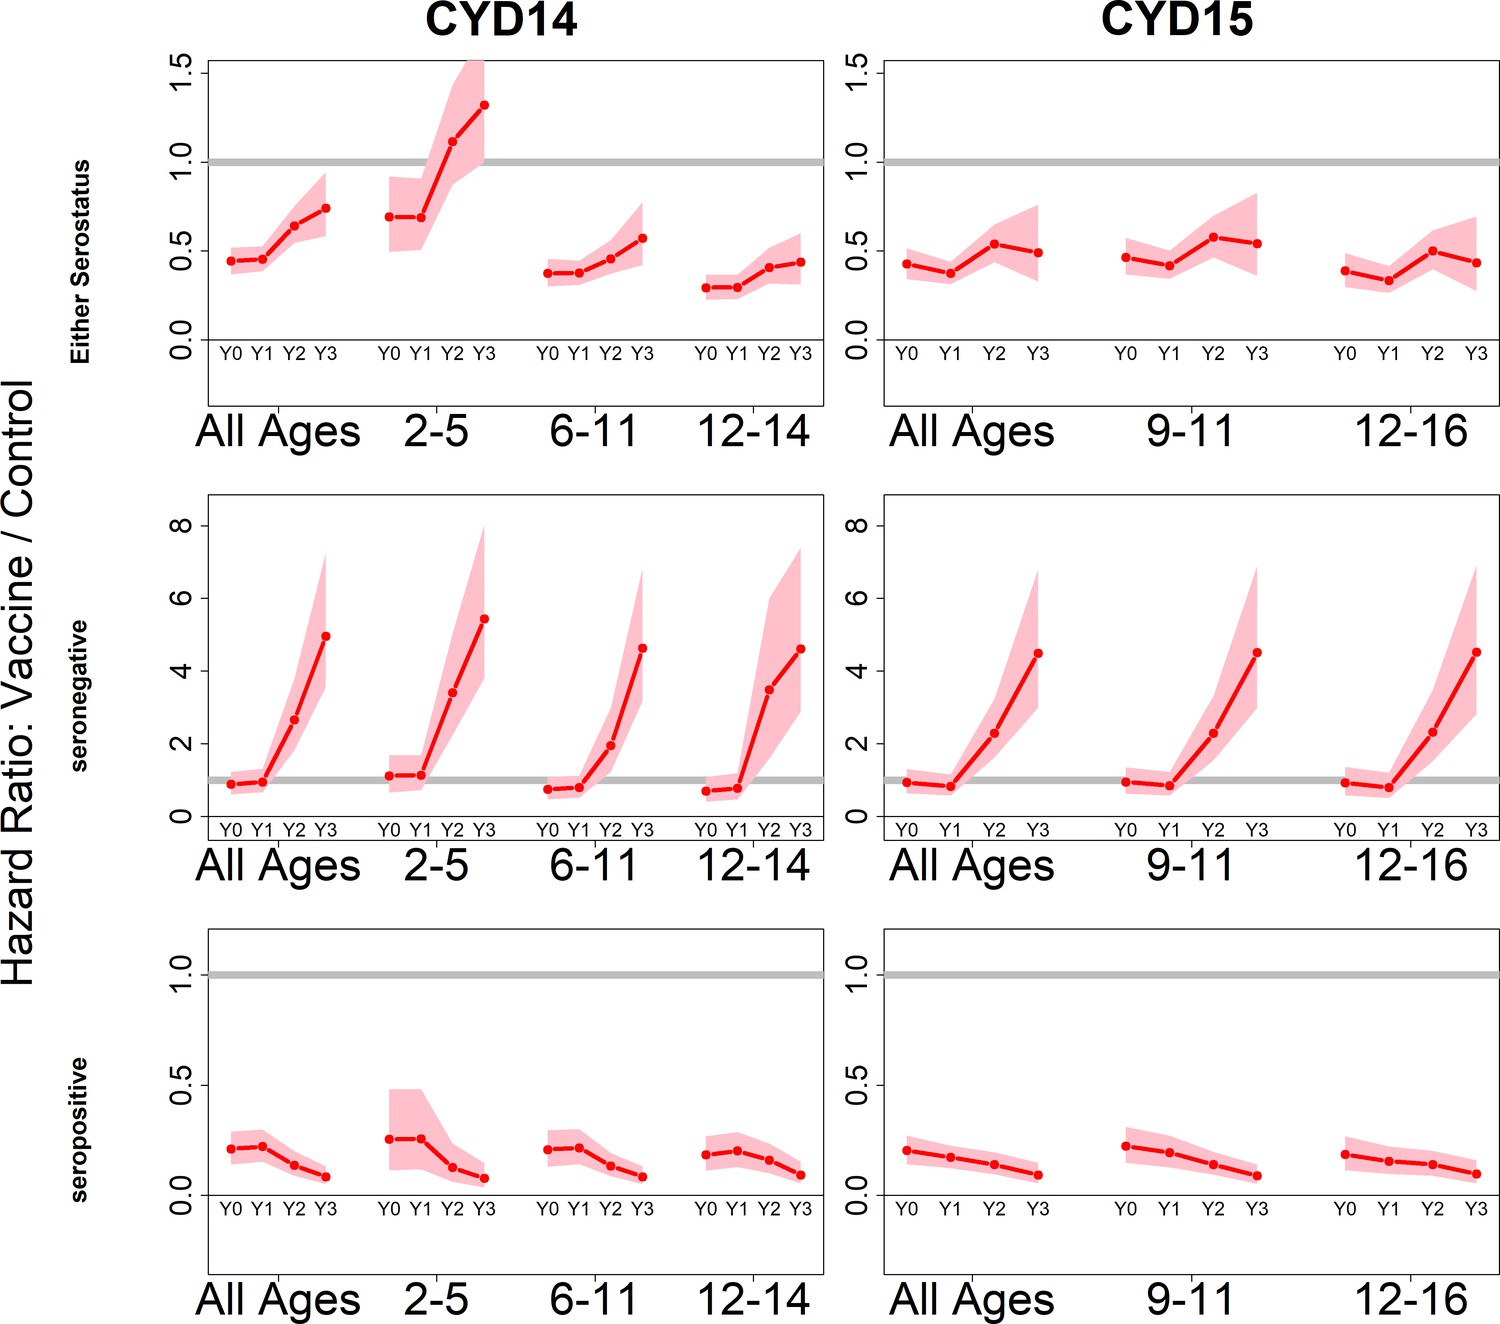
Posterior hazard ratios by trial, age group and baseline serostatus over time (main model).
Each plot shows posterior hazard ratios (vaccine: control) for each age group at 0, 12, 25 and 36 months (0, 1, 2 or 3 years) of follow-up. Hazard ratios consider symptomatic disease regardless of serotype or hospitalisation status. Grey line indicates a ratio of 1, that is, no difference between the trial arms. Red line is the mean posterior estimate, and pink intervals represent 95% credible intervals of posterior samples. Rows show ratios when not broken down by serostatus (top row), for seronegatives (middle row) and seropositives (bottom row), for CYD14 (left column) and CYD15 (right column).
Figure 4—figure supplement 1
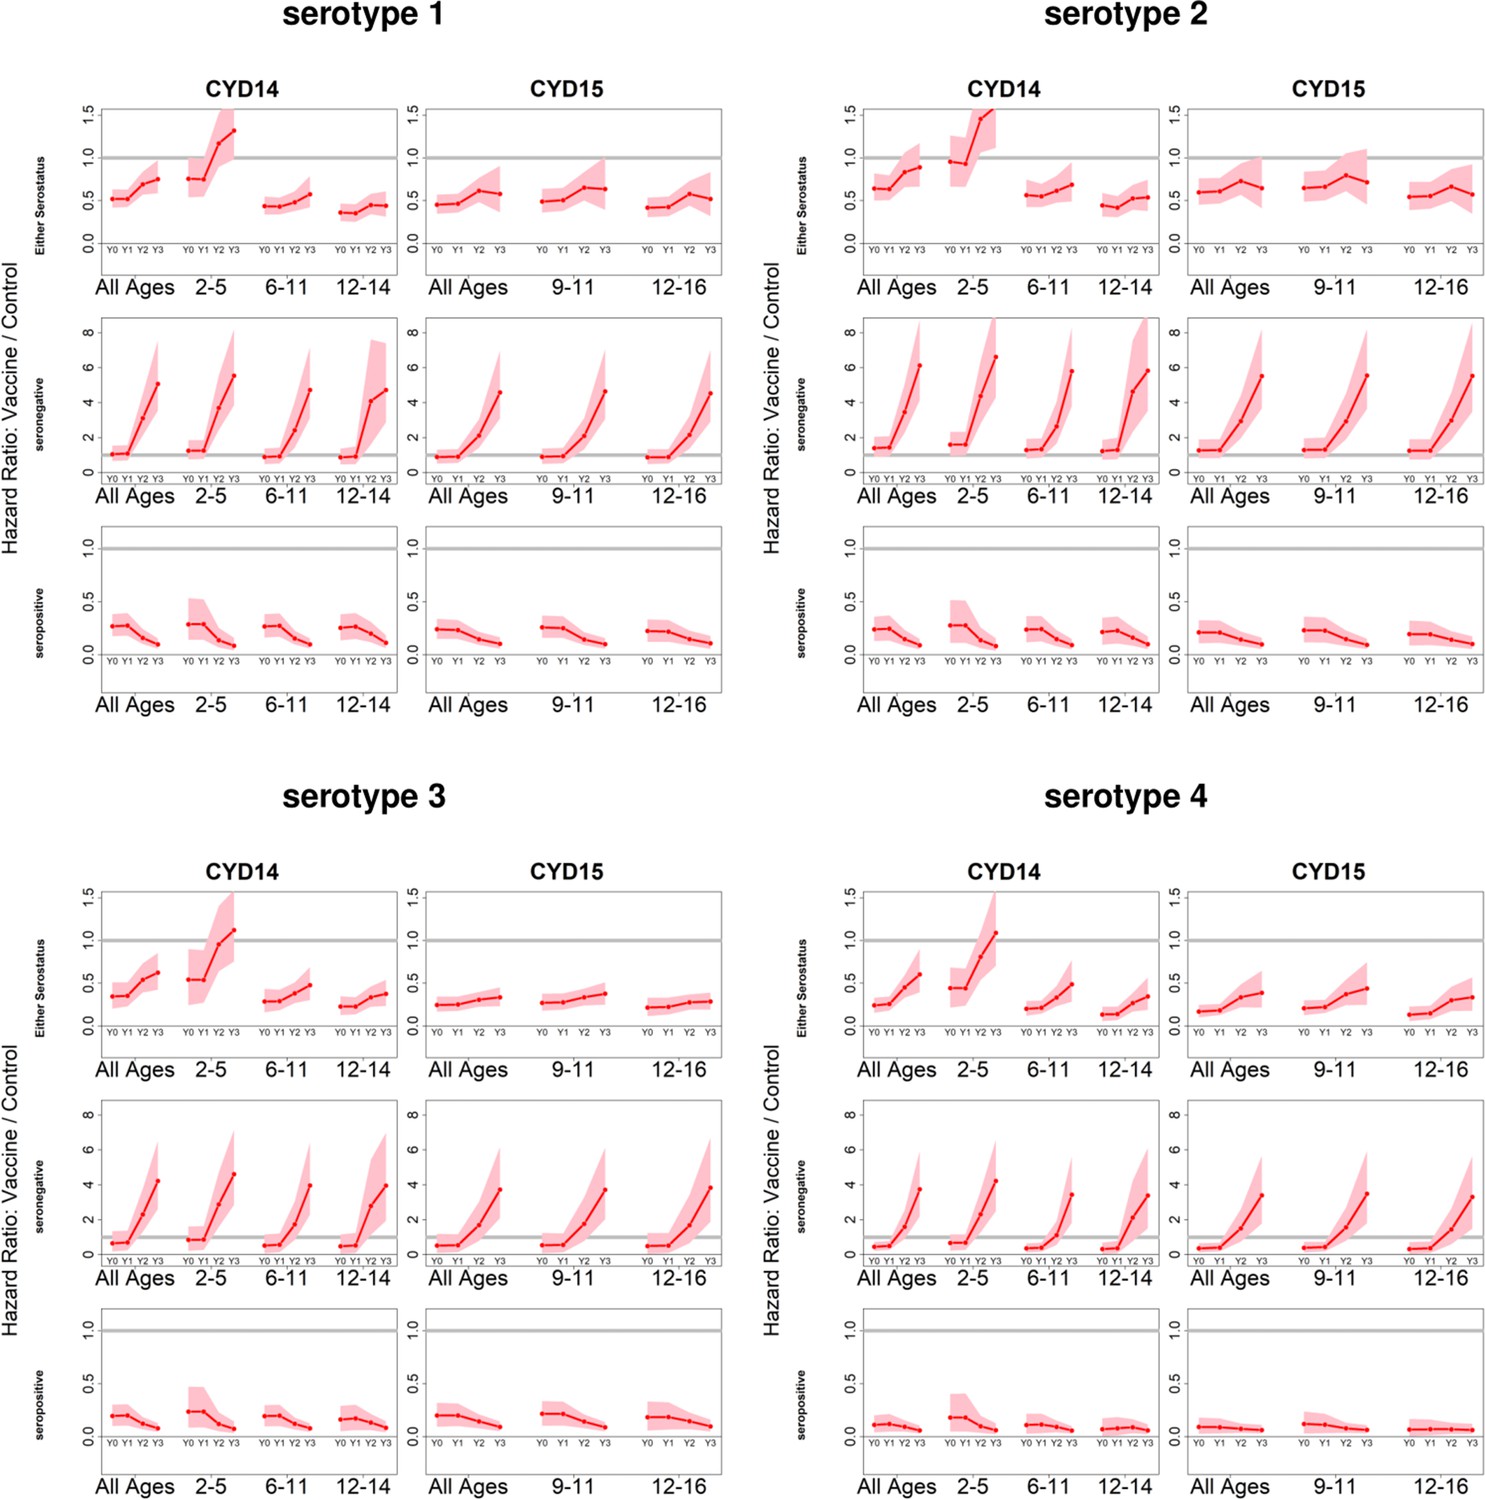
Posterior hazard ratio estimates by trial, age group, baseline serostatus and serotype over time (main model).
As per Figure 4. Hazard ratios consider symptomatic disease regardless of hospitalisation status.
Figure 4—figure supplement 2
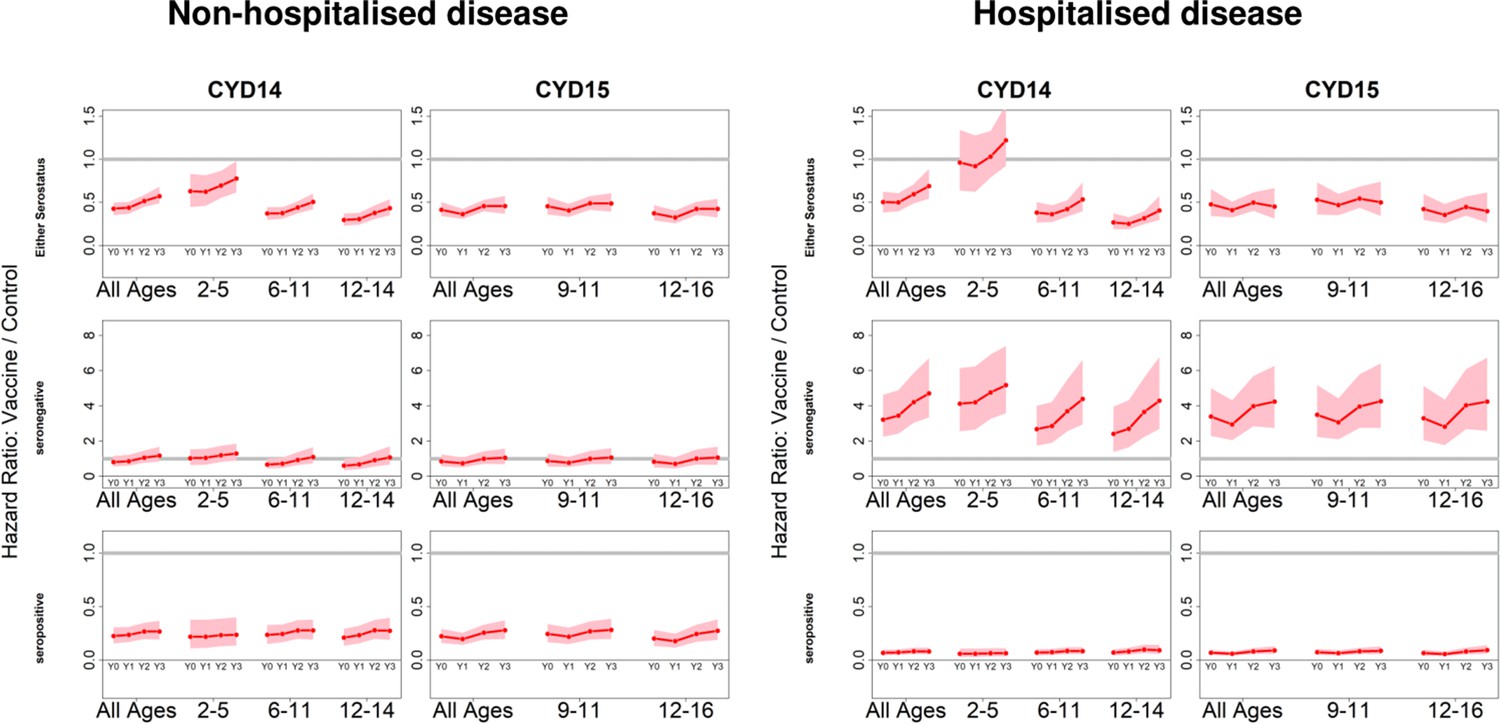
Posterior hazard ratios by hospitalisation status.
As per Figure 4. Left and right columns show hazard ratios for non-hospitalised and hospitalised disease, respectively (regardless of serotype). Ratios are almost identical when considering severe and non-severe disease (not shown).
Figure 4—figure supplement 3
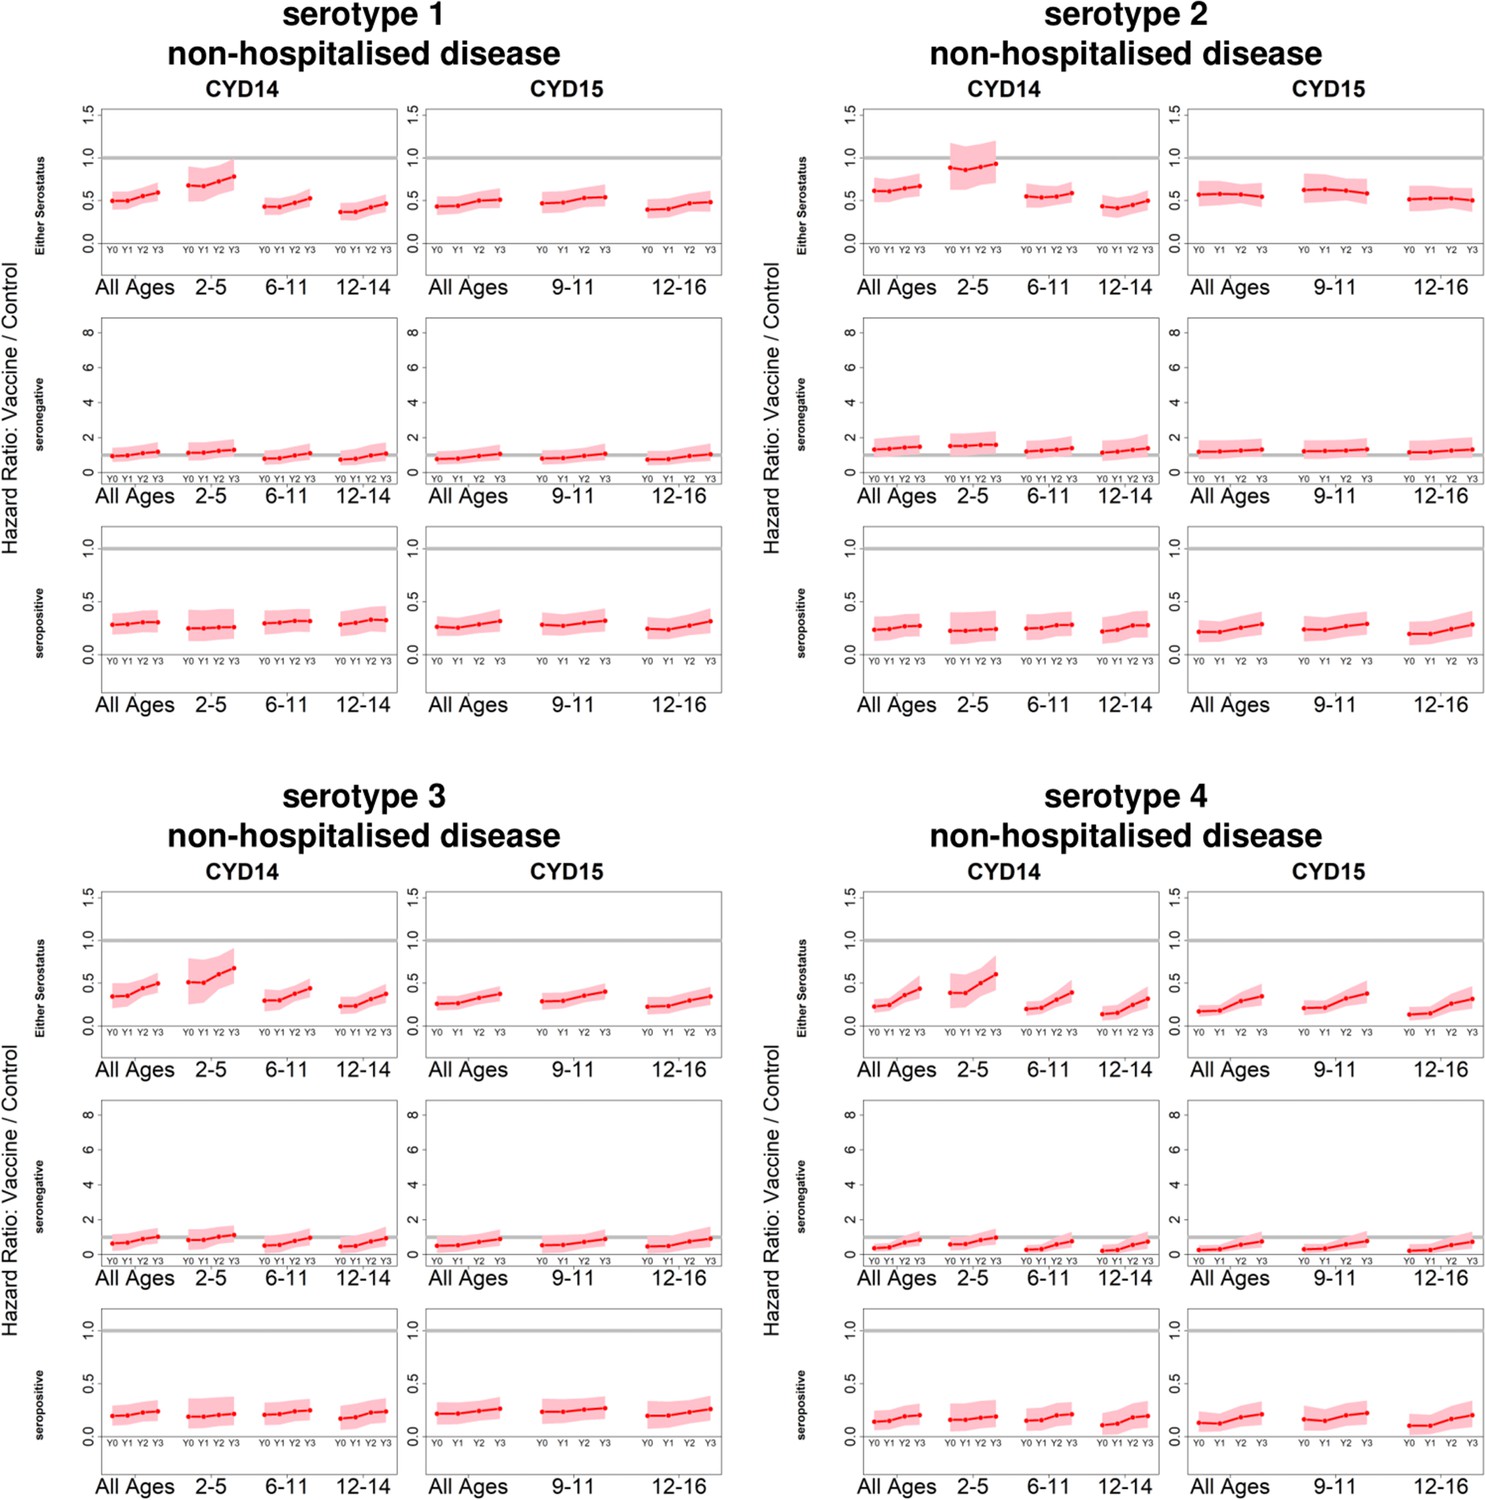
Posterior hazard ratios by serotype against non-hospitalised disease status.
As per Figure 4. Ratios are almost identical when considering non-severe disease (not shown).
Figure 4—figure supplement 4
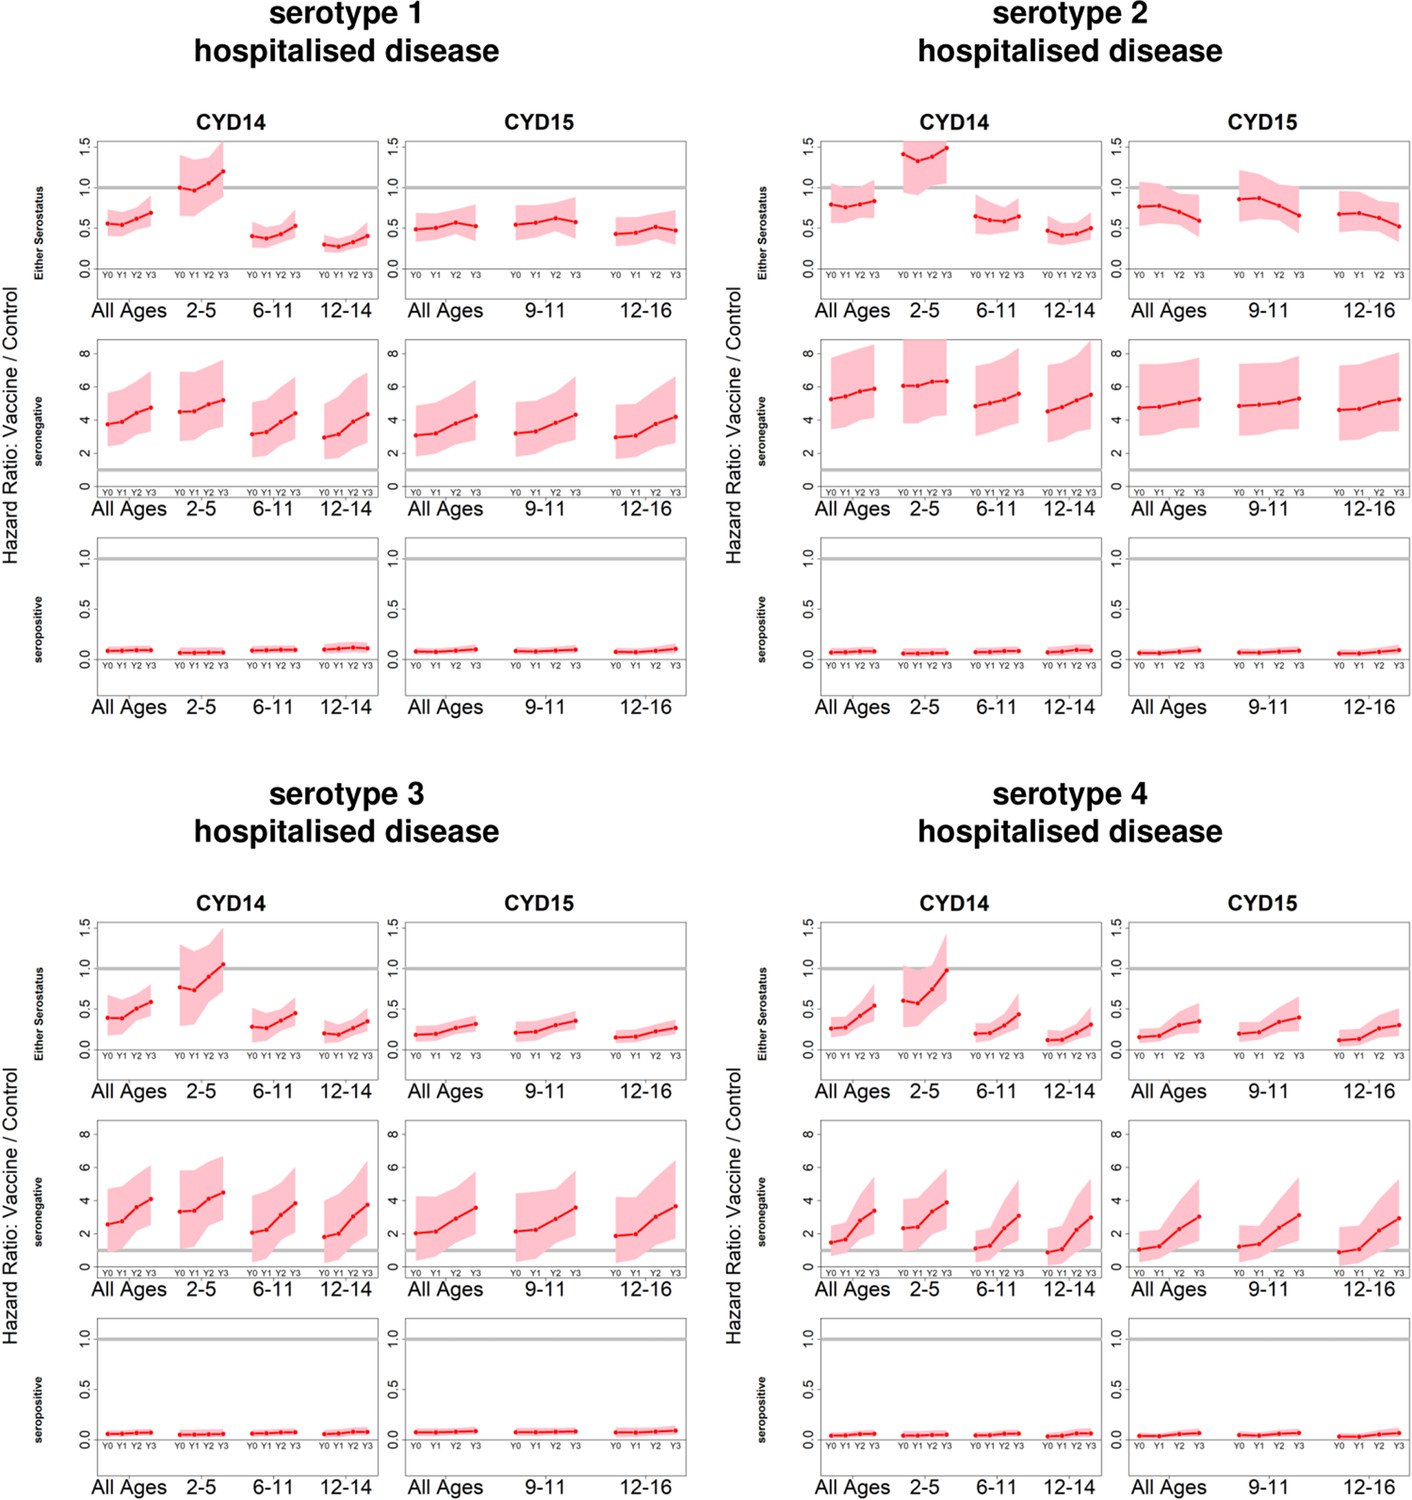
Posterior hazard ratios by serotype and hospitalised disease status.
As per Figure 4. Ratios are almost identical when considering severe disease (not shown).
Figure 5 with 5 supplements
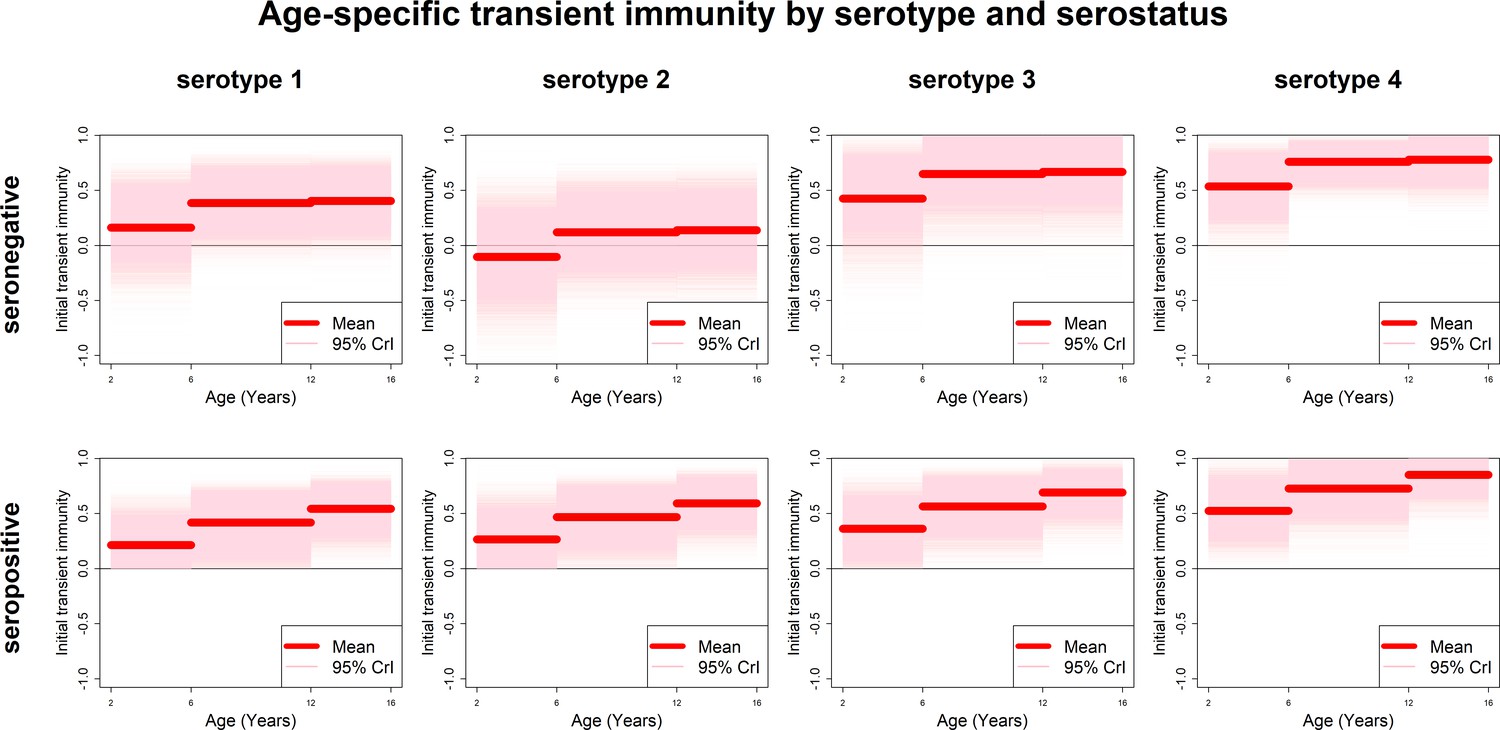
Age-specific transient immunity estimates (main model).
Profiles of age-group-specific transient immunity by serostatus for serotypes 1–4. Mean posterior estimates are shown in red, with 95% credible intervals surrounding.
Figure 5—figure supplement 1
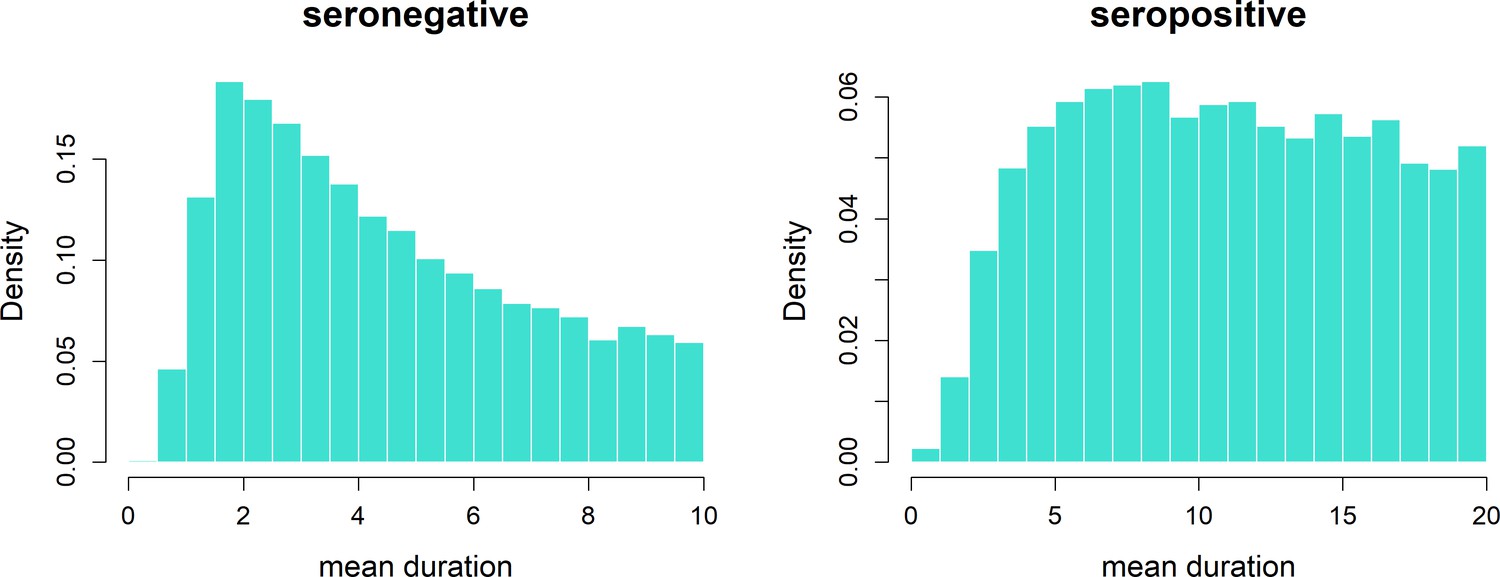
Transient immunity duration posteriors.
Durations τb (b = 0, 1) of transient immunity by serostatus. We allow seronegative duration (left) to vary between 0 and 10 years and seropositive duration (right) to vary between 0 and 20 years.
Figure 5—figure supplement 2
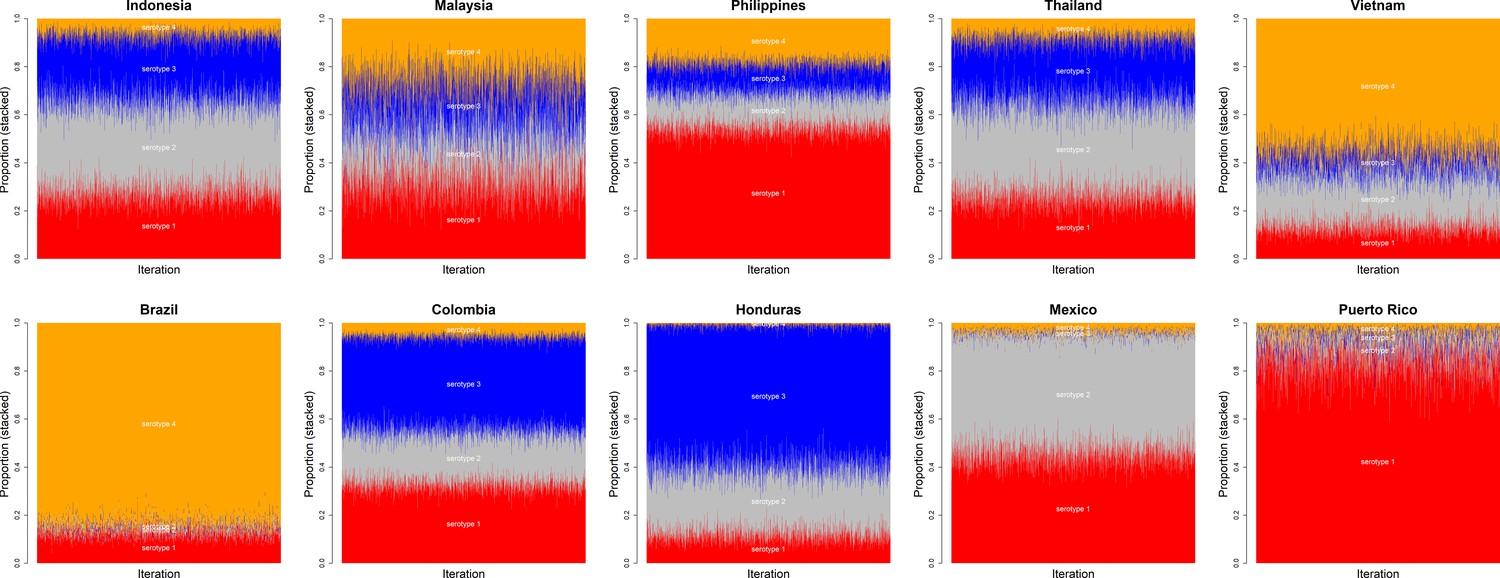
Posterior chains of serotype proportions by country.
Serotypes 1–4 are shown in red, grey, blue and orange, respectively. There is wide variation between countries in their serotype prevalence.
Figure 5—figure supplement 3
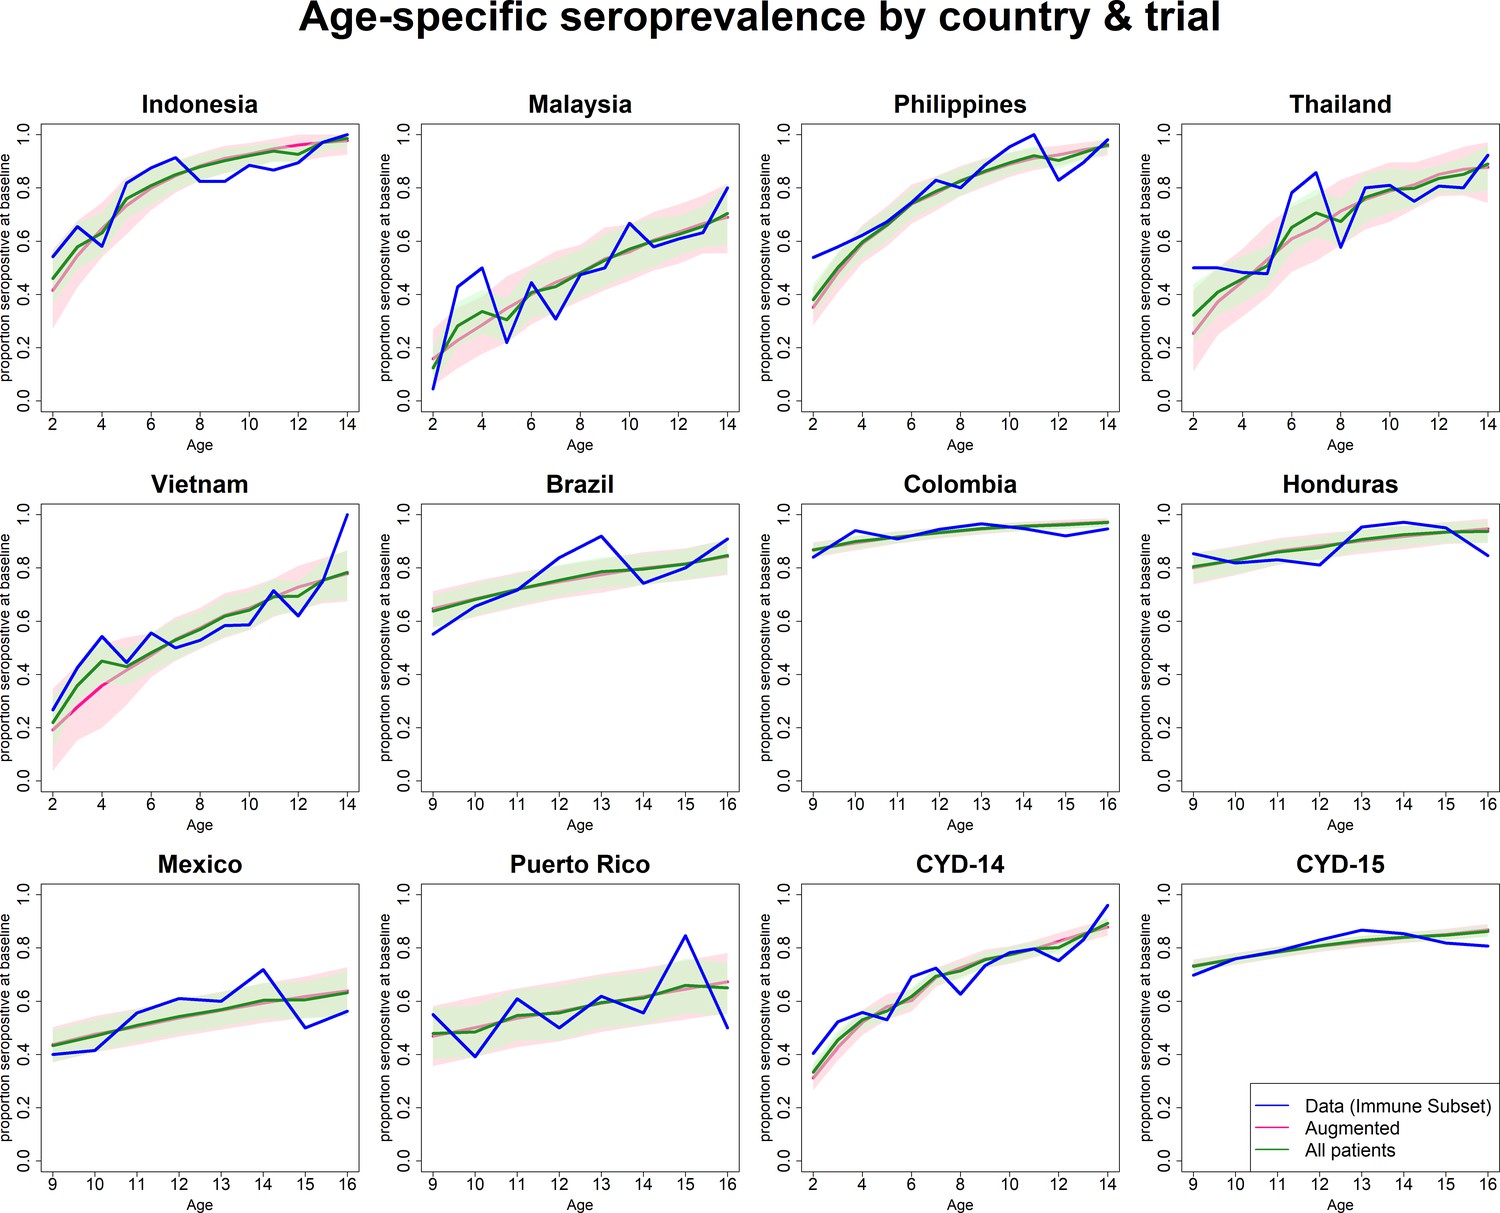
Observed and predicted age-specific seroprevalence by country and trial.
Figure 5—figure supplement 4
Age-specific transient immunity estimates (age effects model without serotype effects).
As per Figure 5.
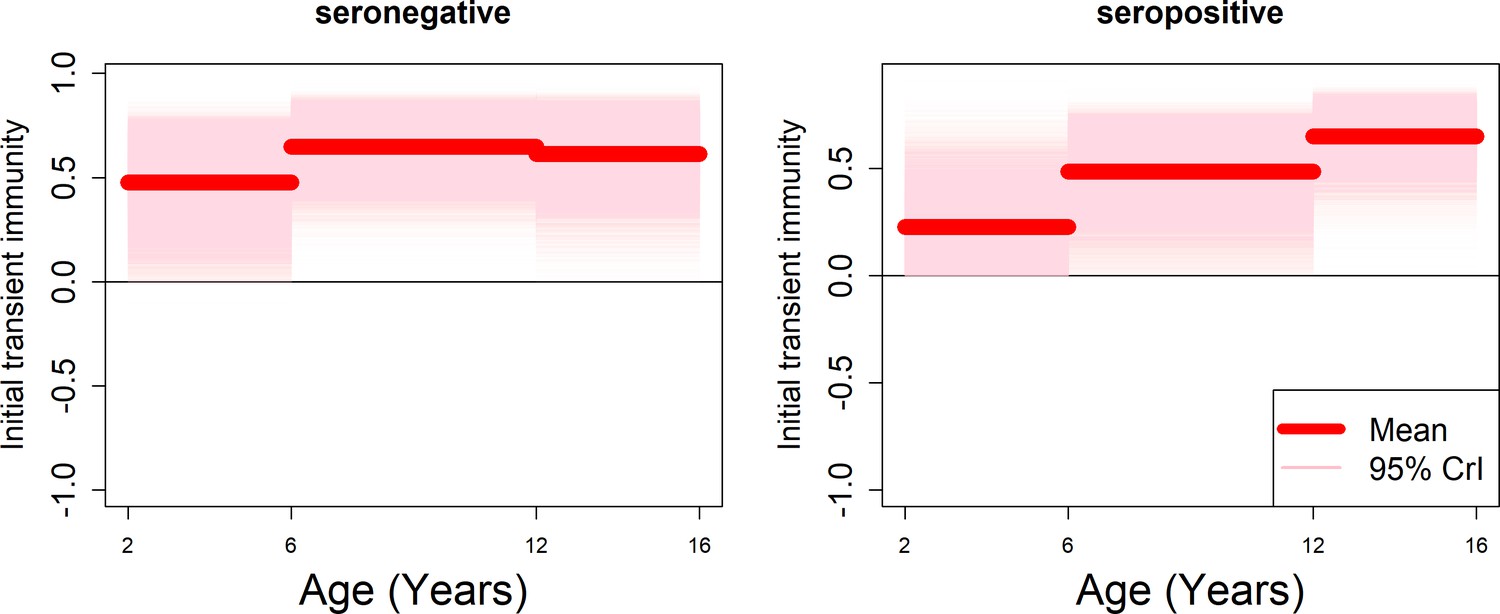
Figure 5—figure supplement 5
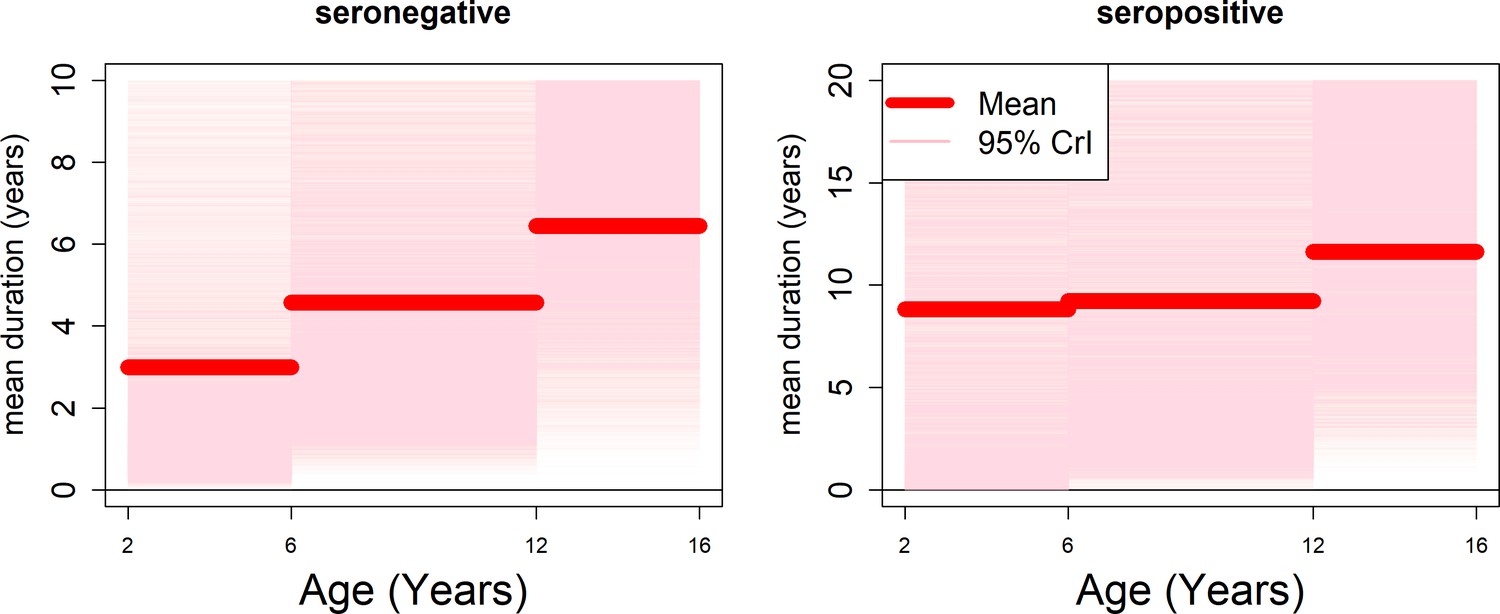
Age-specific transient immunity durations (model with fitted age-specific transient immunity durations).
Age-specific durations of transient immunity by serostatus. modelled as a step function. Mean posterior estimates are shown in red, with 95% credible intervals surrounding. We allow seronegative durations to vary between 0 and 10 years and seropositive durations to vary between 0 and 20 years.
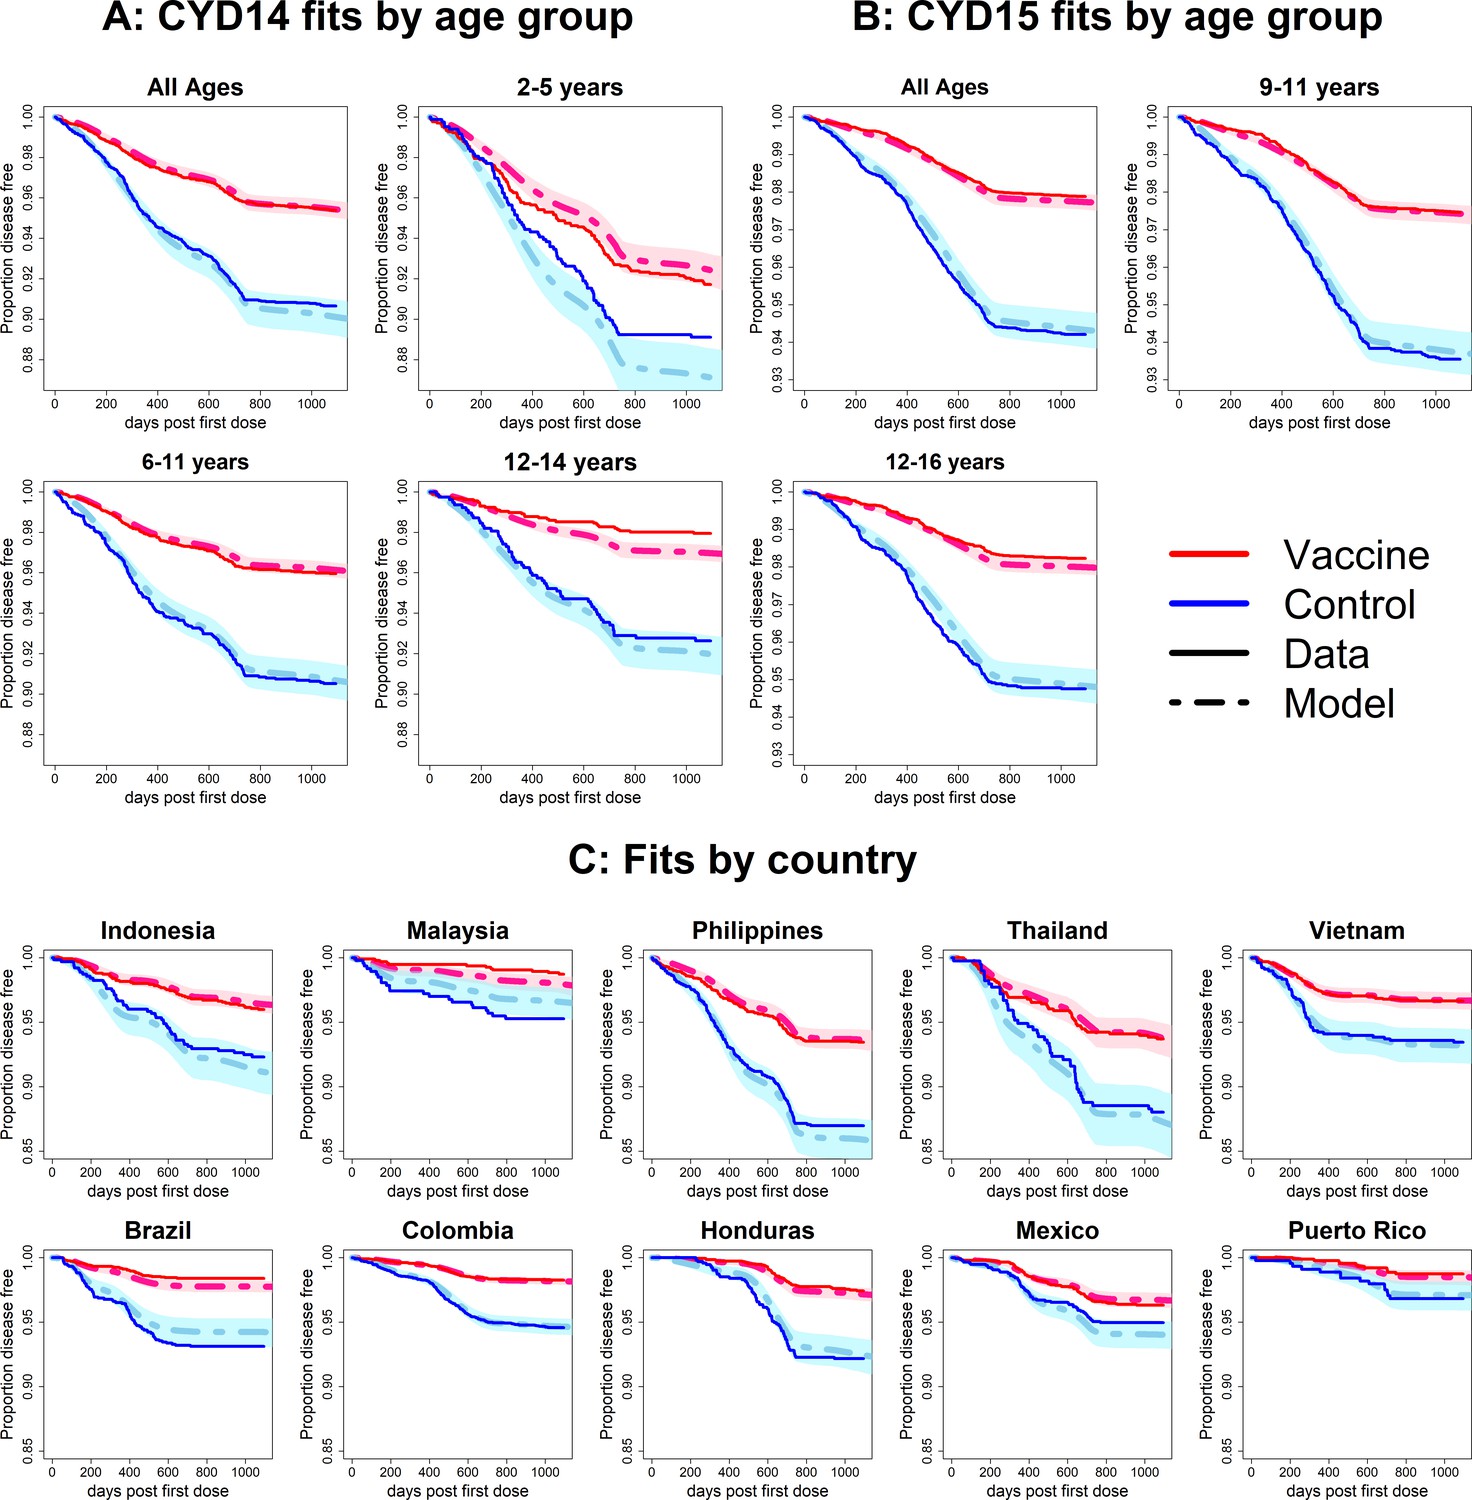
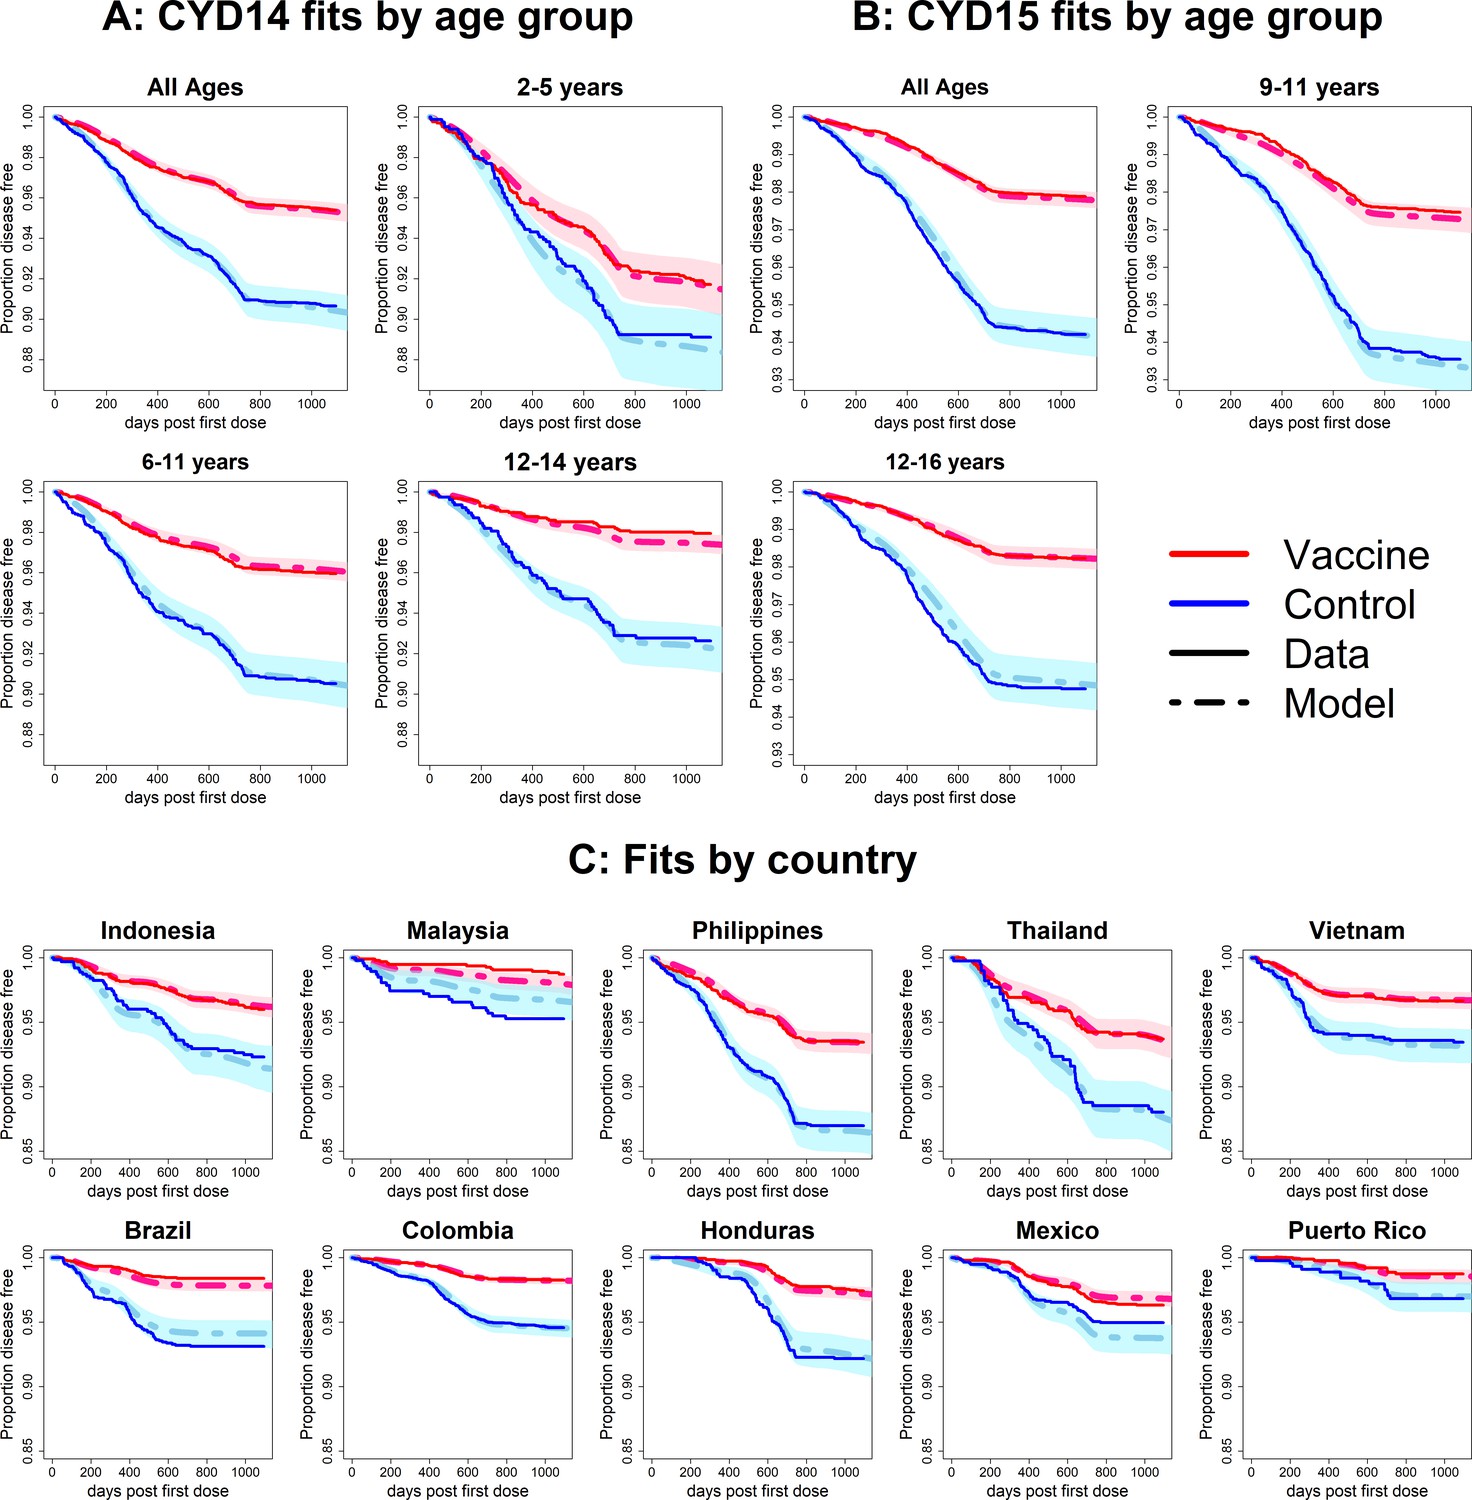
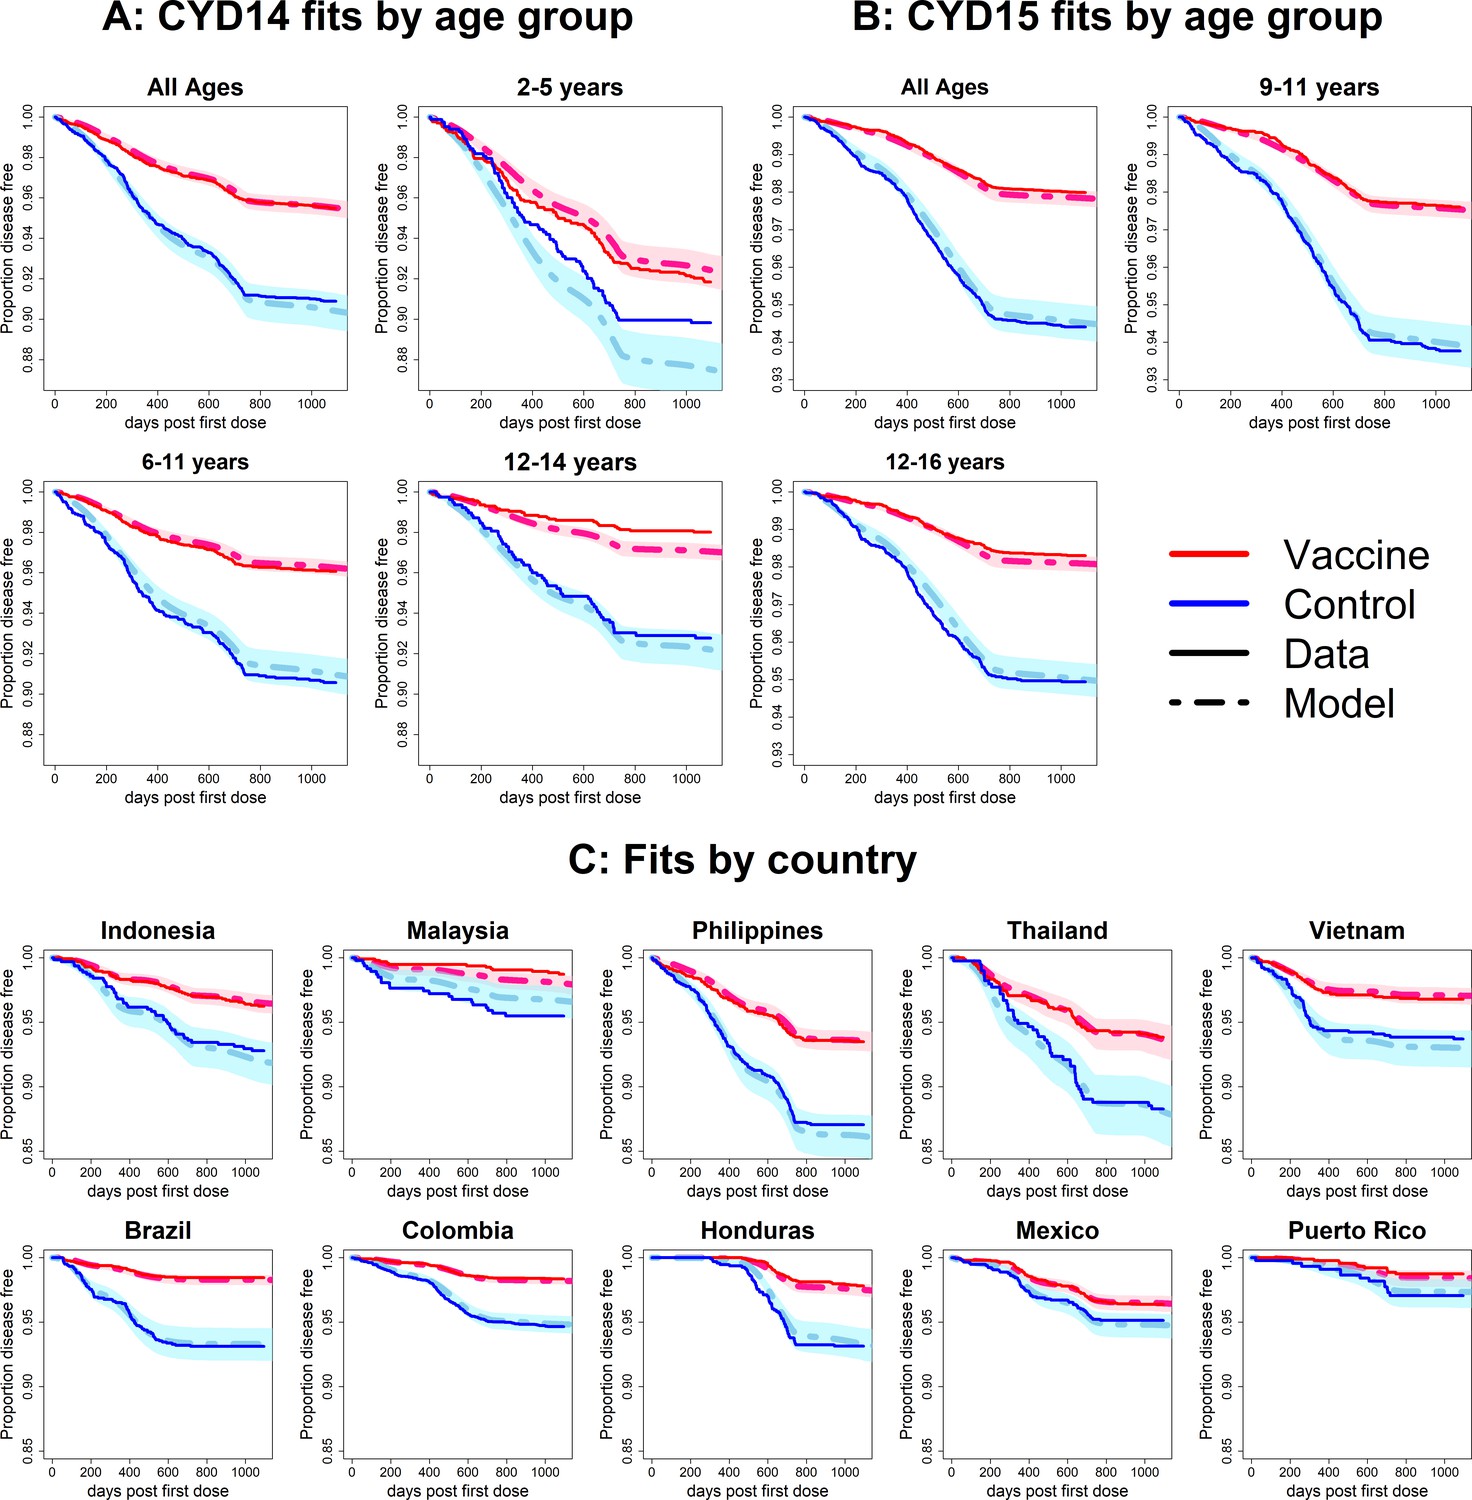
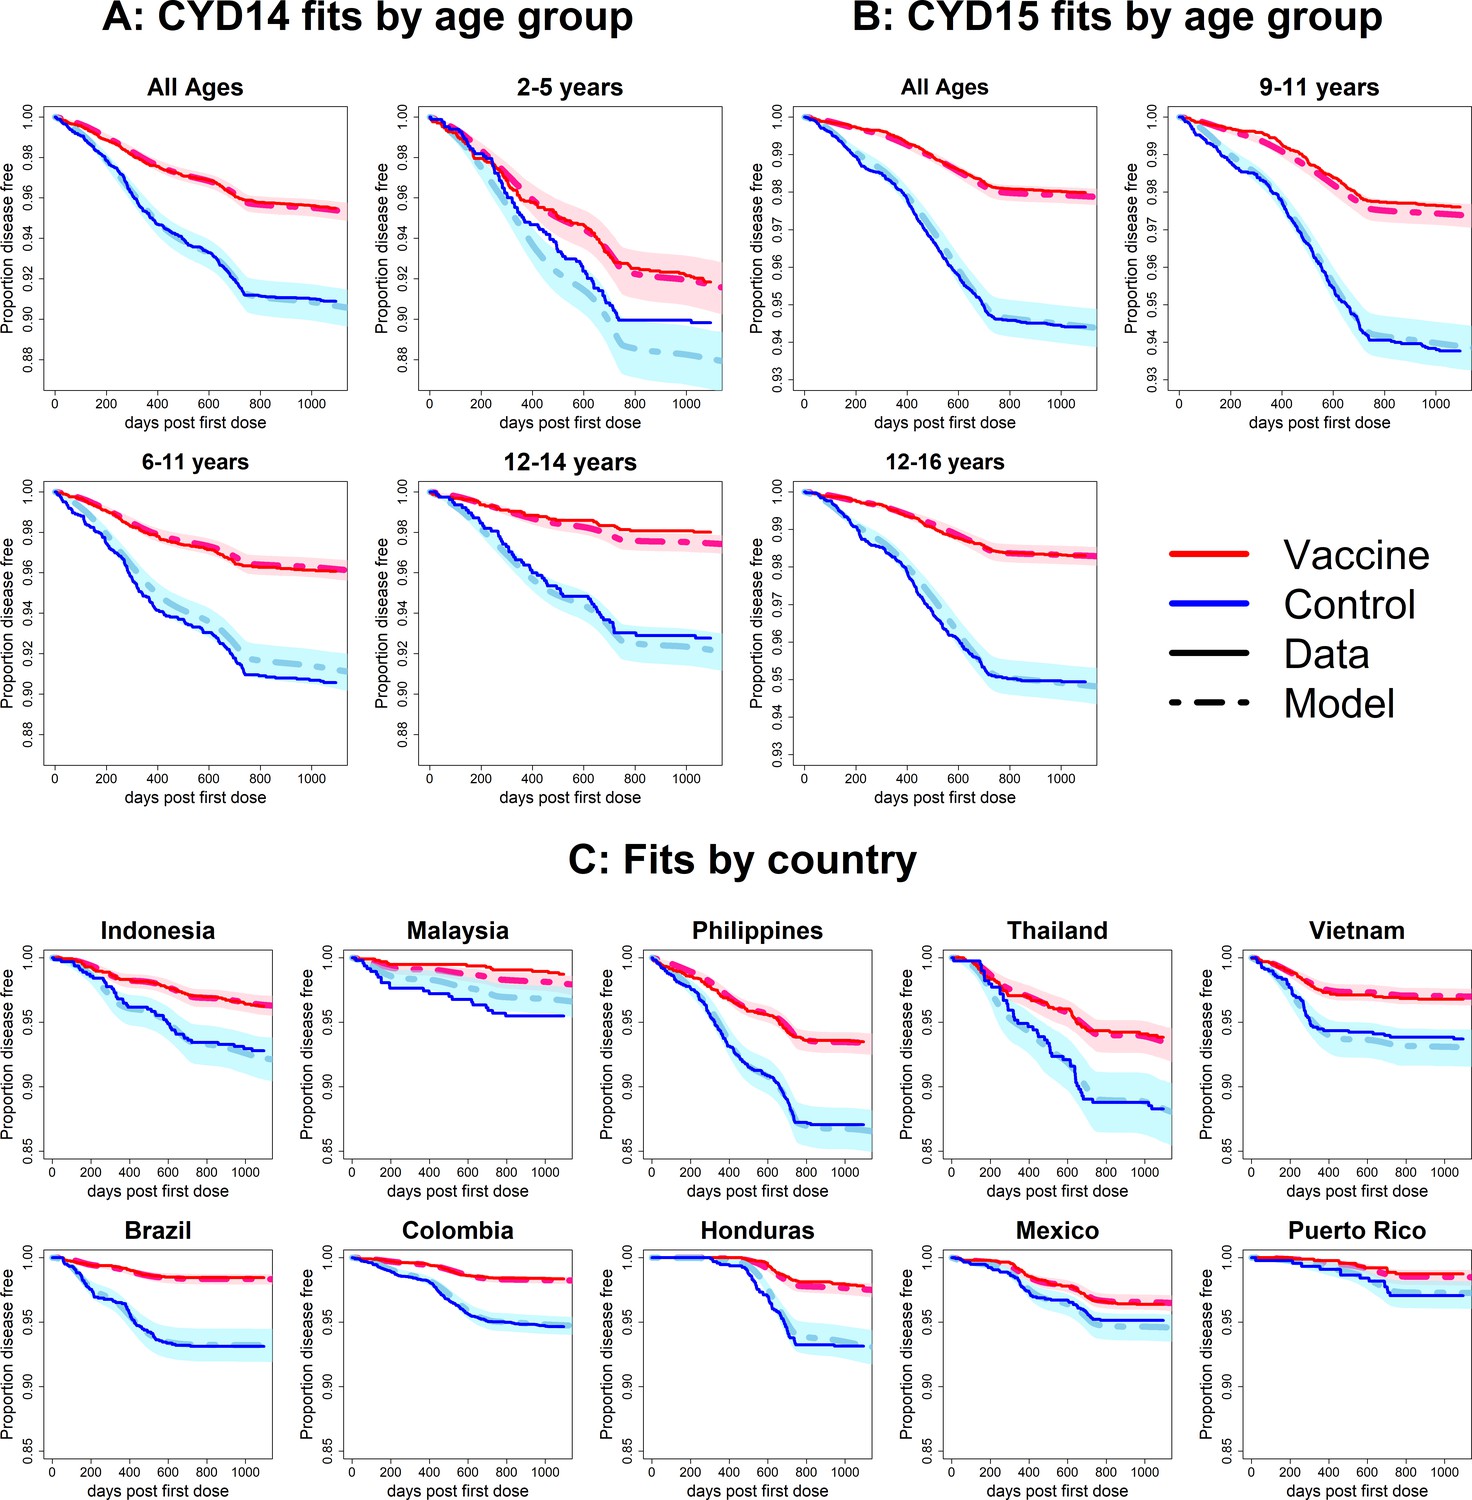
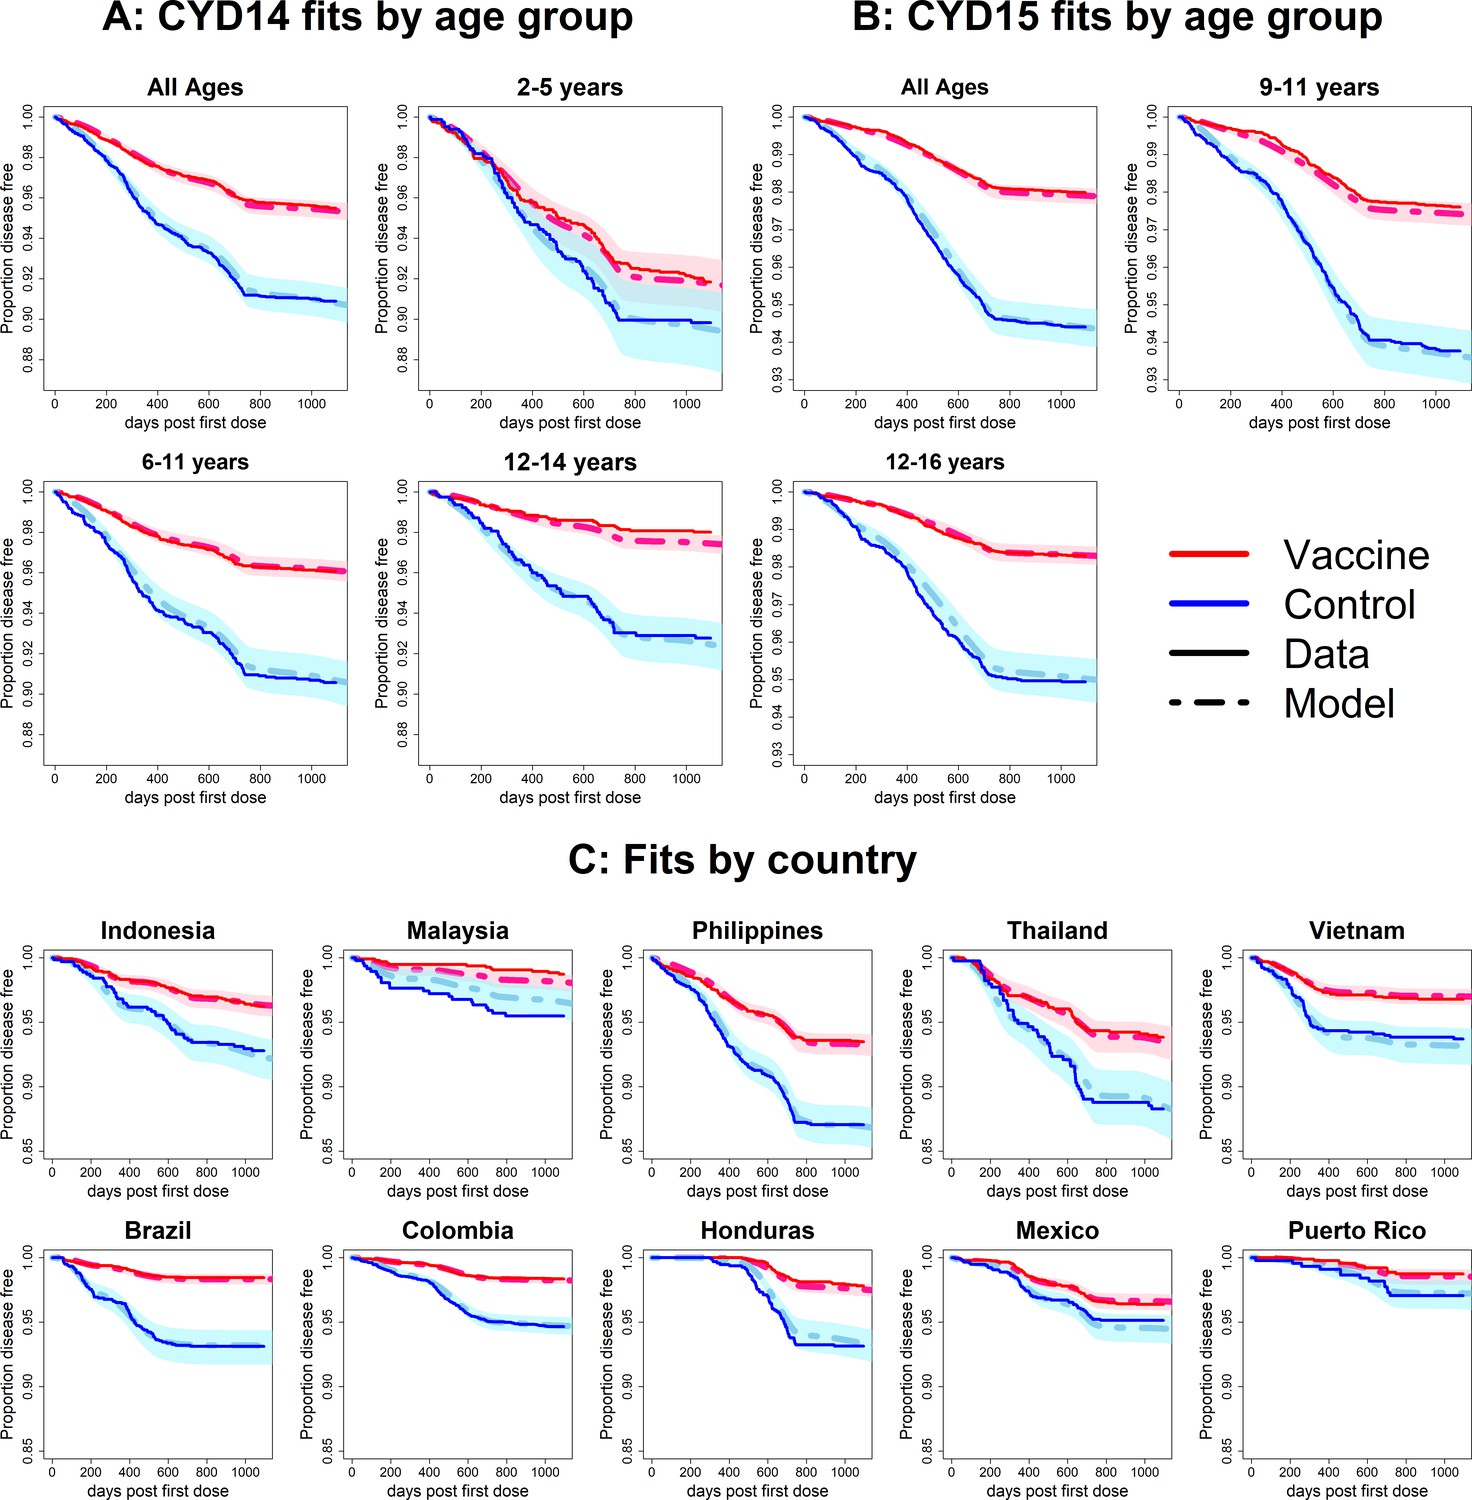
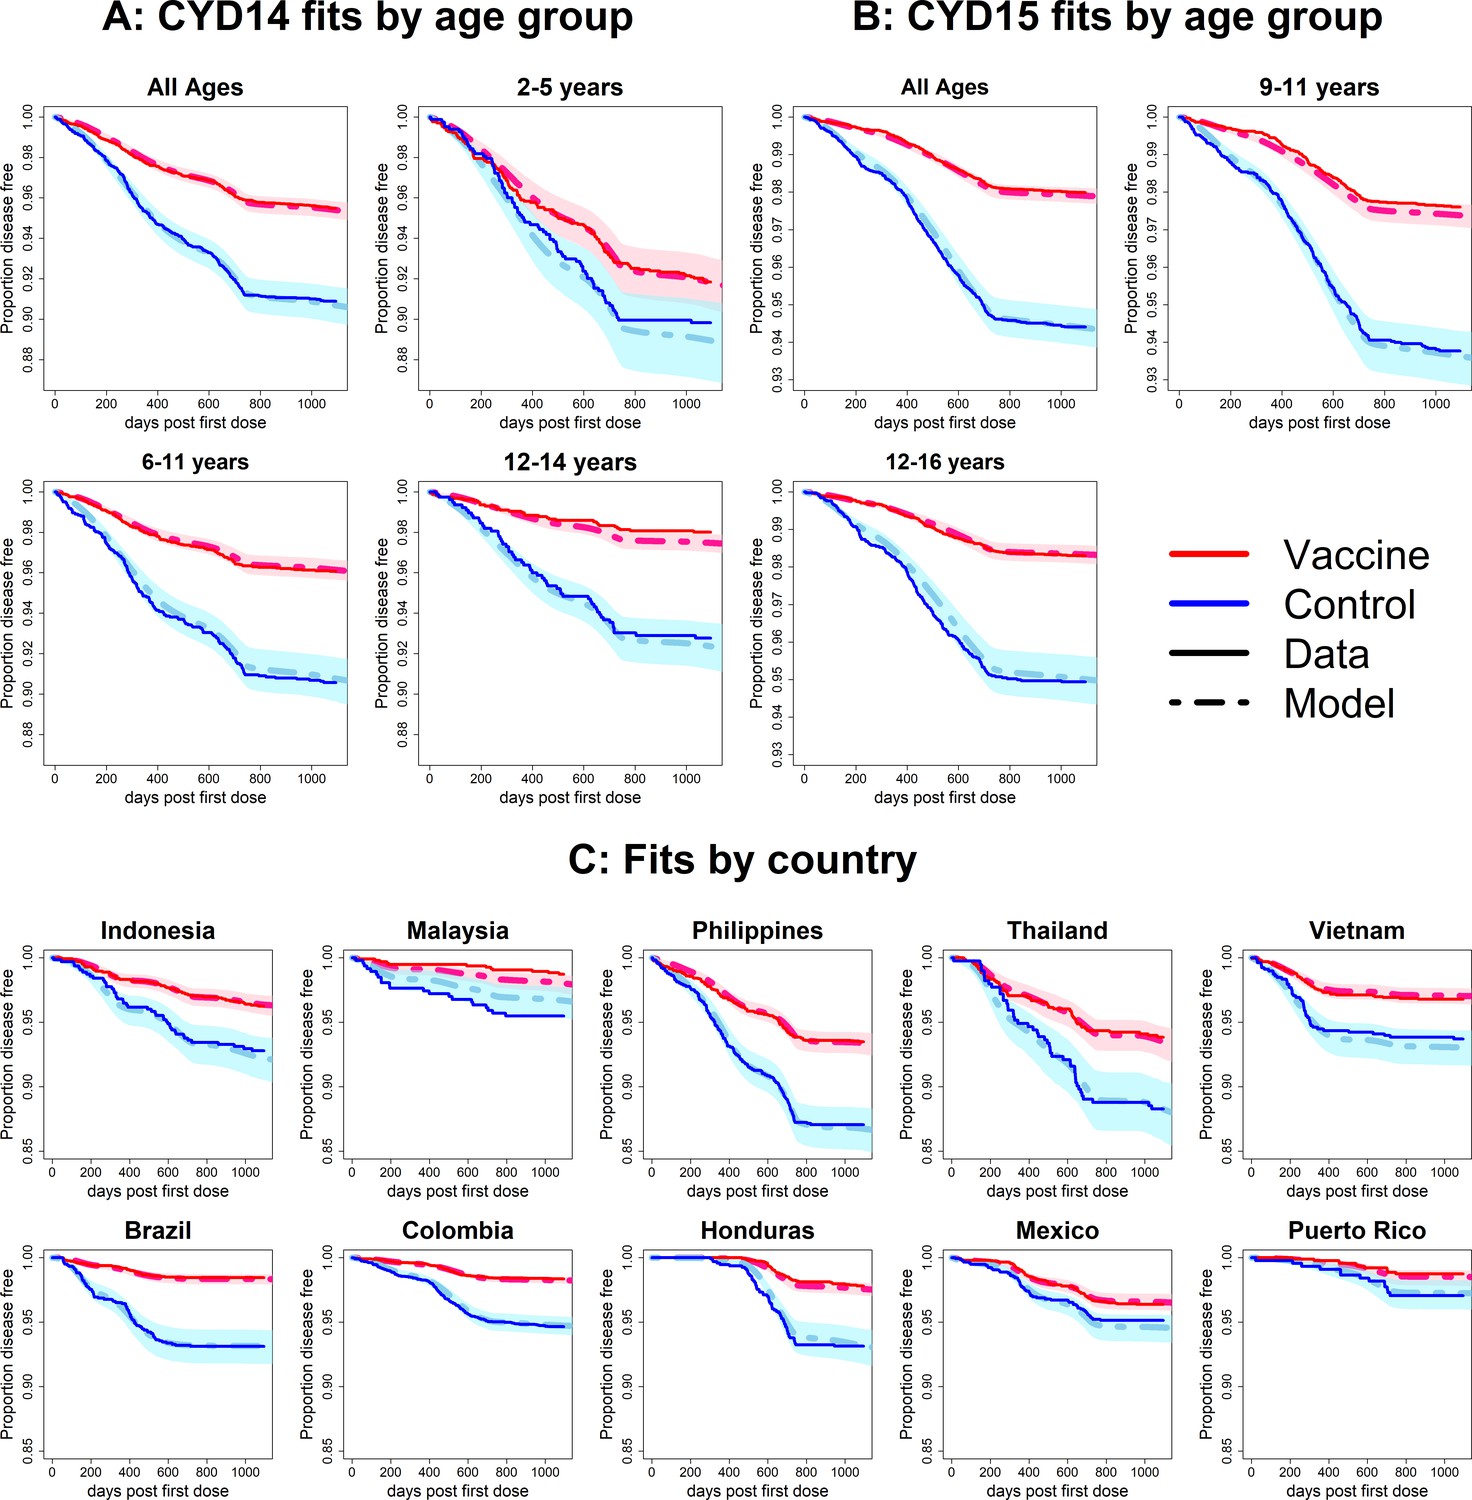
Figure 6 with 8 supplements
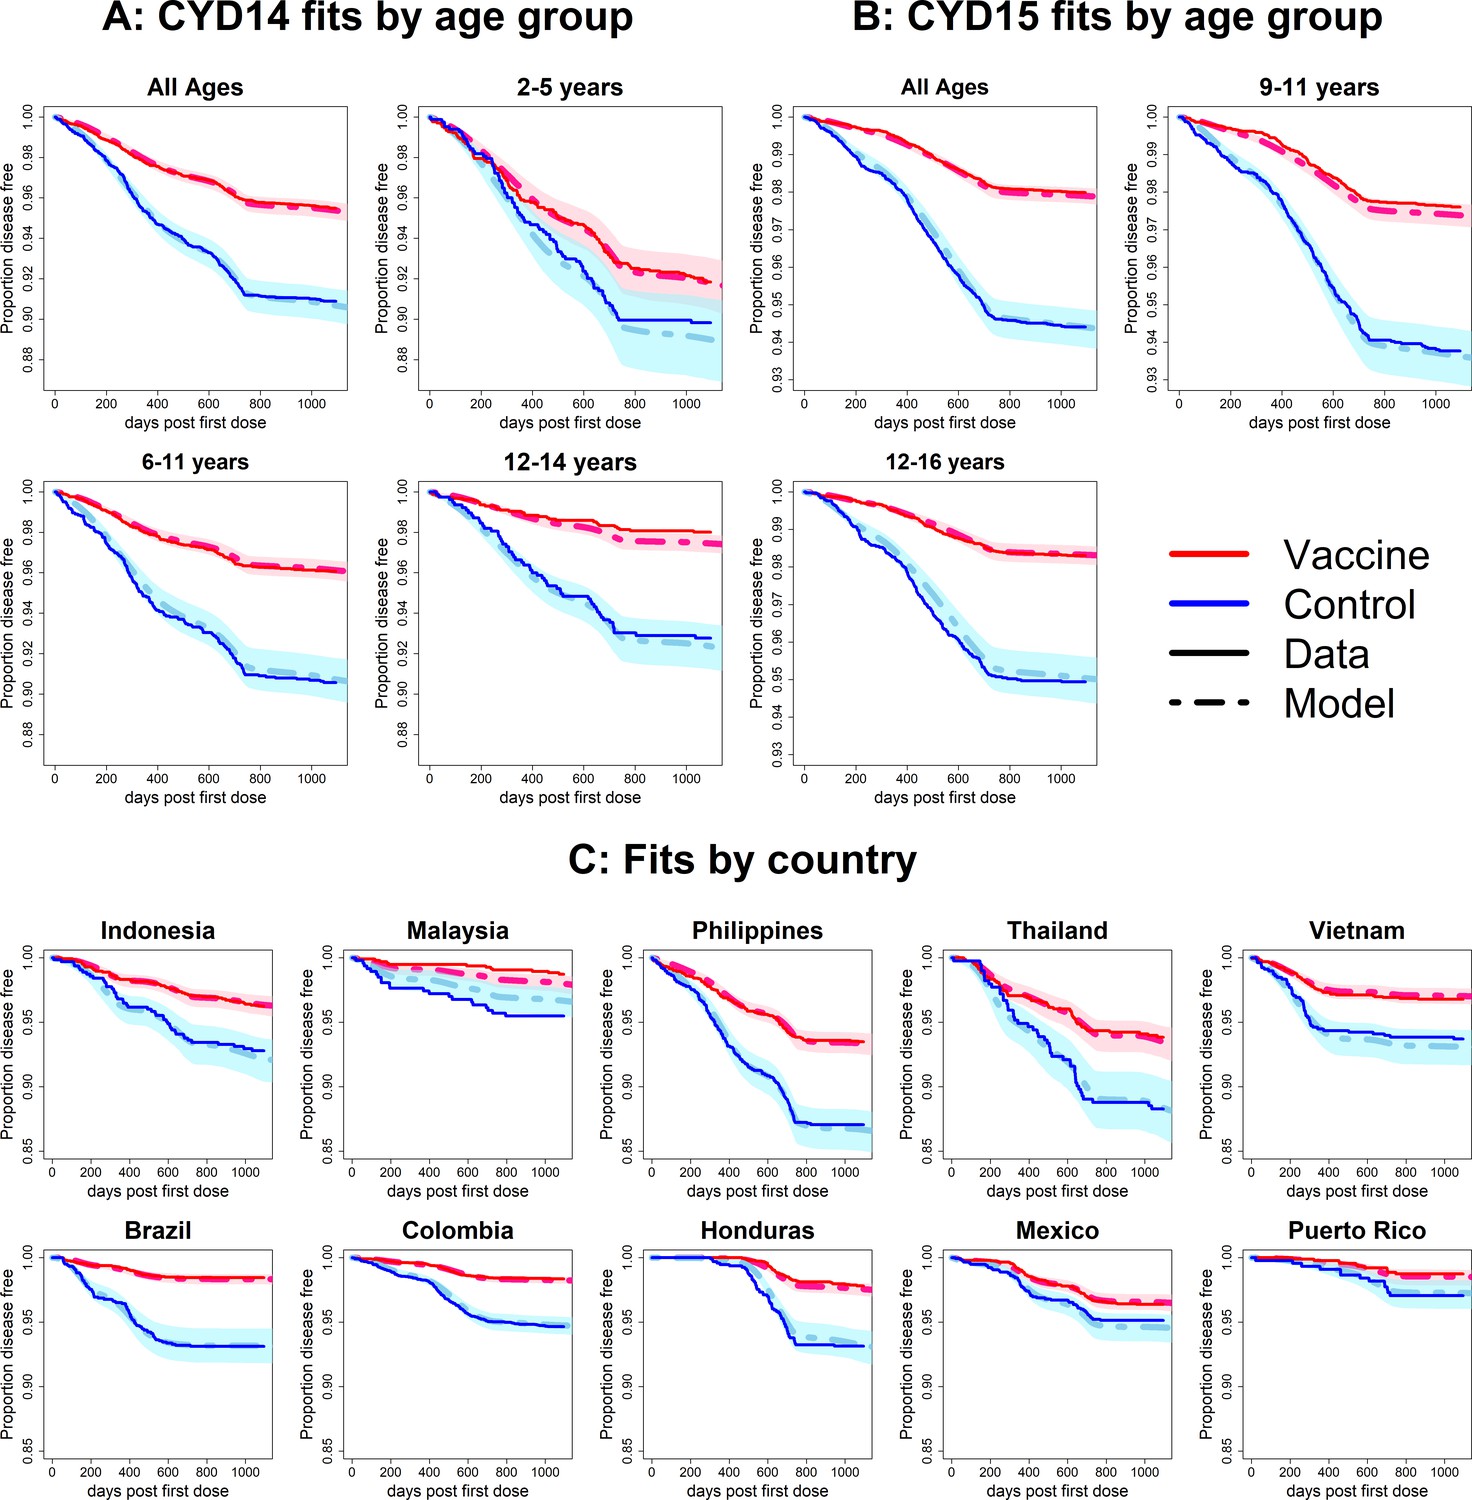
Fits to observed Kaplan–Meier curves by trial, age group and country (main model).
In each plot, vaccine and control survival probabilities are plotted against days post-first dose (vaccine or placebo). Dark lines denote observed curves, dashed lines are the mean posterior estimates, with 95% credible intervals around.
Figure 6—figure supplement 1
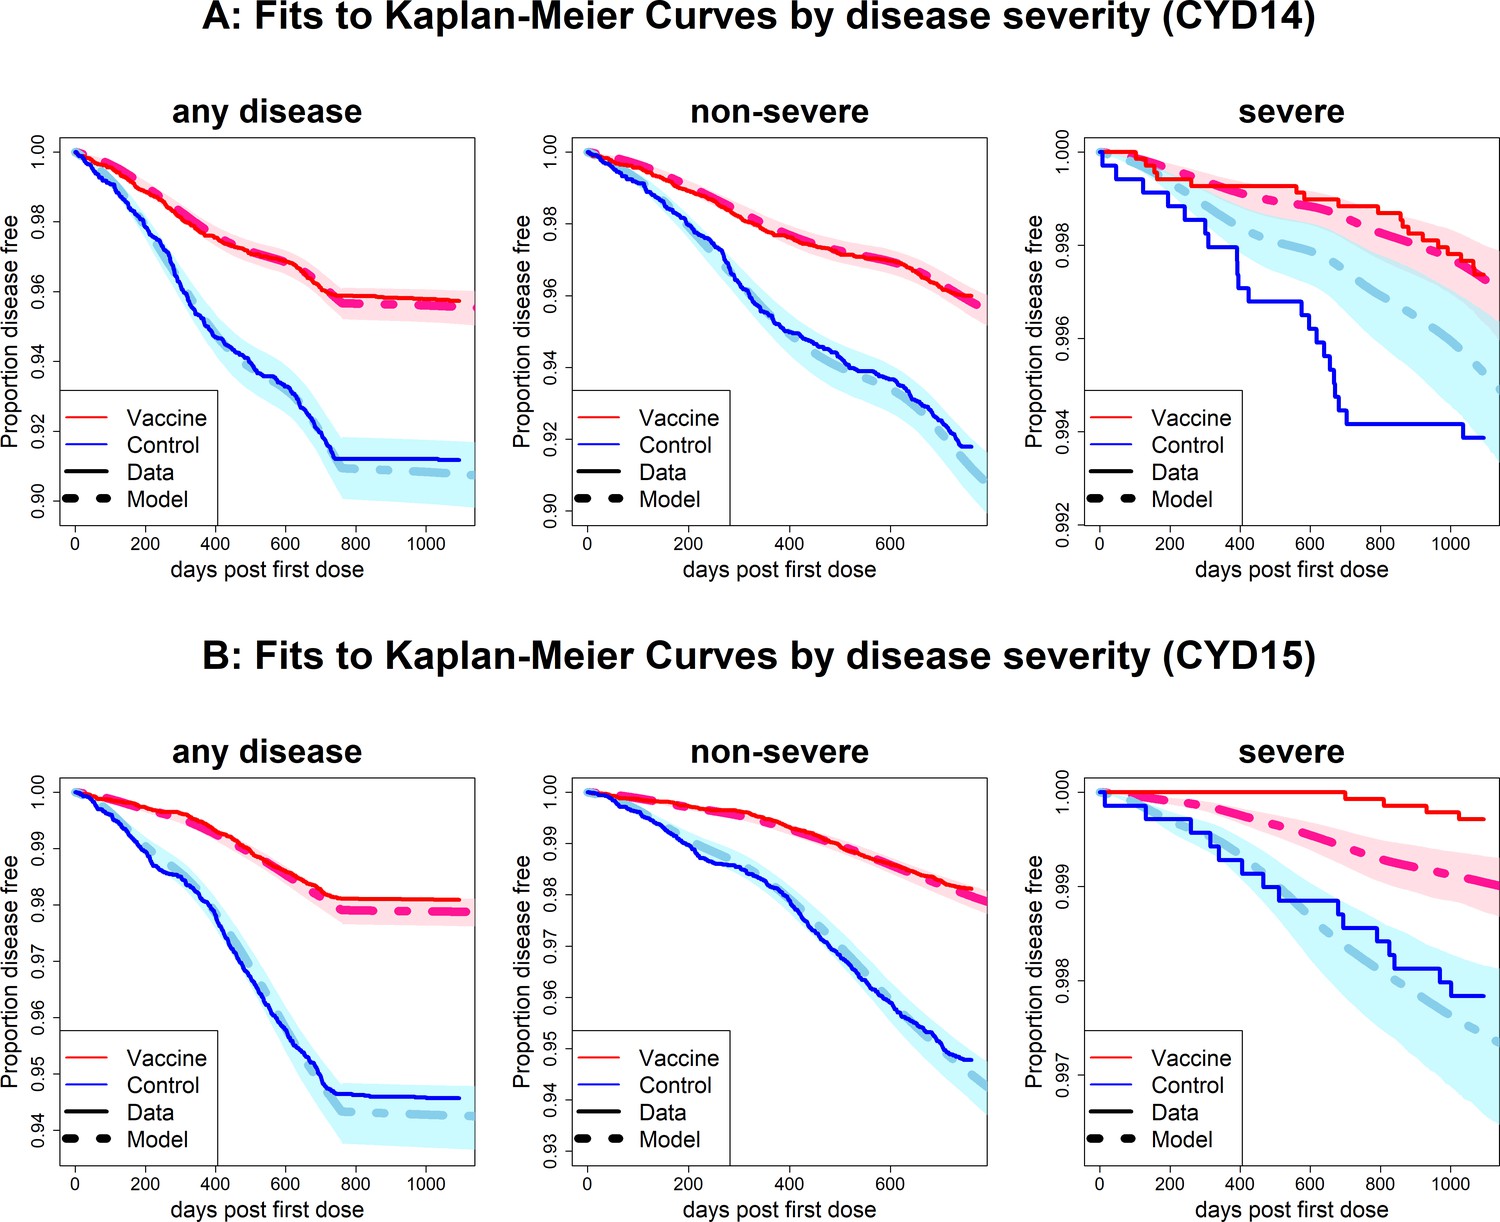
Fits to observed Kaplan–Meier curves by trial and disease severity.
As per Figure 6, showing fits of model considering any disease severity (left column), non-severe disease (middle column) and severe disease (right column).
Figure 6—figure supplement 2
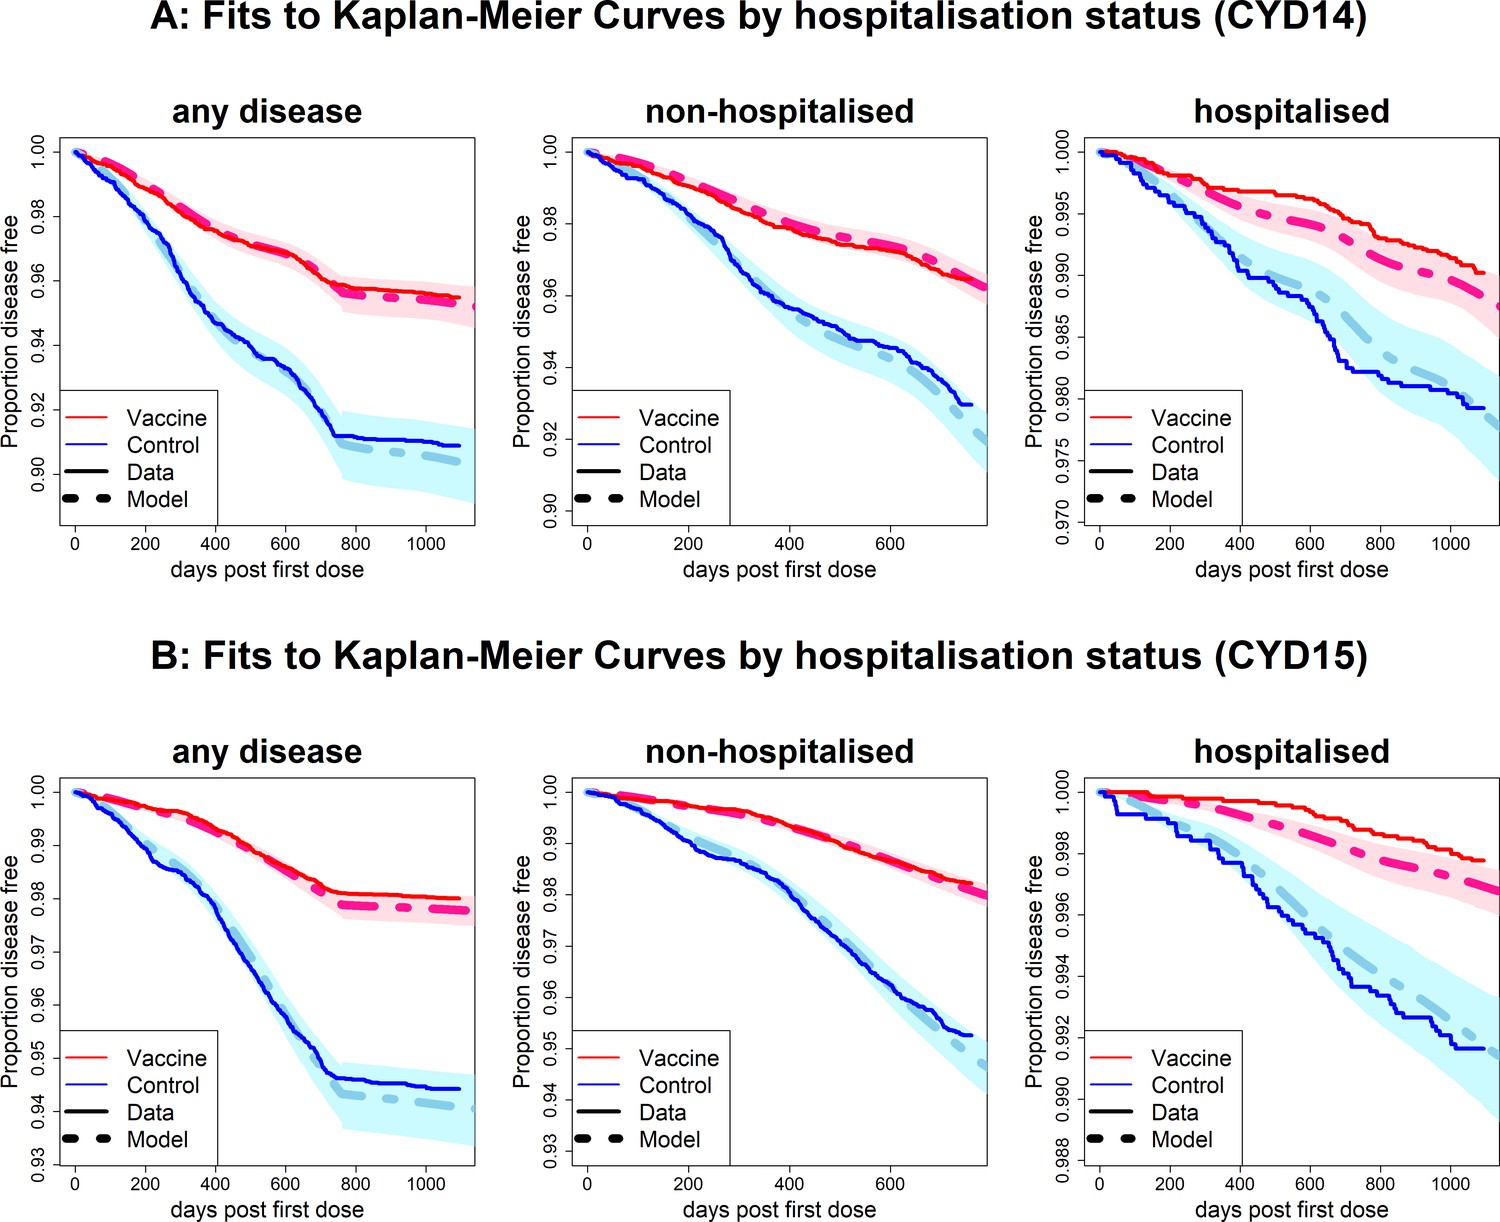
Fits to observed Kaplan–Meier curves by trial and hospitalisation status.
As per Figure 6, showing fits of model considering any disease severity (left column), non-hospitalised disease (middle column) and hospitalised disease (right column).
Figure 6—figure supplement 3
Fits to observed Kaplan–Meier curves by trial, age group and country (simplest model without age or serotype effects).
As per Figure 6.
Figure 6—figure supplement 4
Fits to observed Kaplan–Meier curves by trial, age group and country (age effects model without serotype effects).
As per Figure 6.
Figure 6—figure supplement 5
Fits to observed Kaplan–Meier curves by trial, age group and country (serotype effects model without age effects).
As per Figure 6.
Figure 6—figure supplement 6
Fits to observed Kaplan–Meier curves by trial, age group and country (model without age-specific force of infection).
As per Figure 6.
Figure 6—figure supplement 7
Fits to observed Kaplan–Meier curves by trial, age group and country (model without immune priming).
As per Figure 6.
Figure 6—figure supplement 8
Fits to observed Kaplan–Meier curves by trial, age group and country (model with fitted age-specific transient immunity durations).
As per Figure 6.
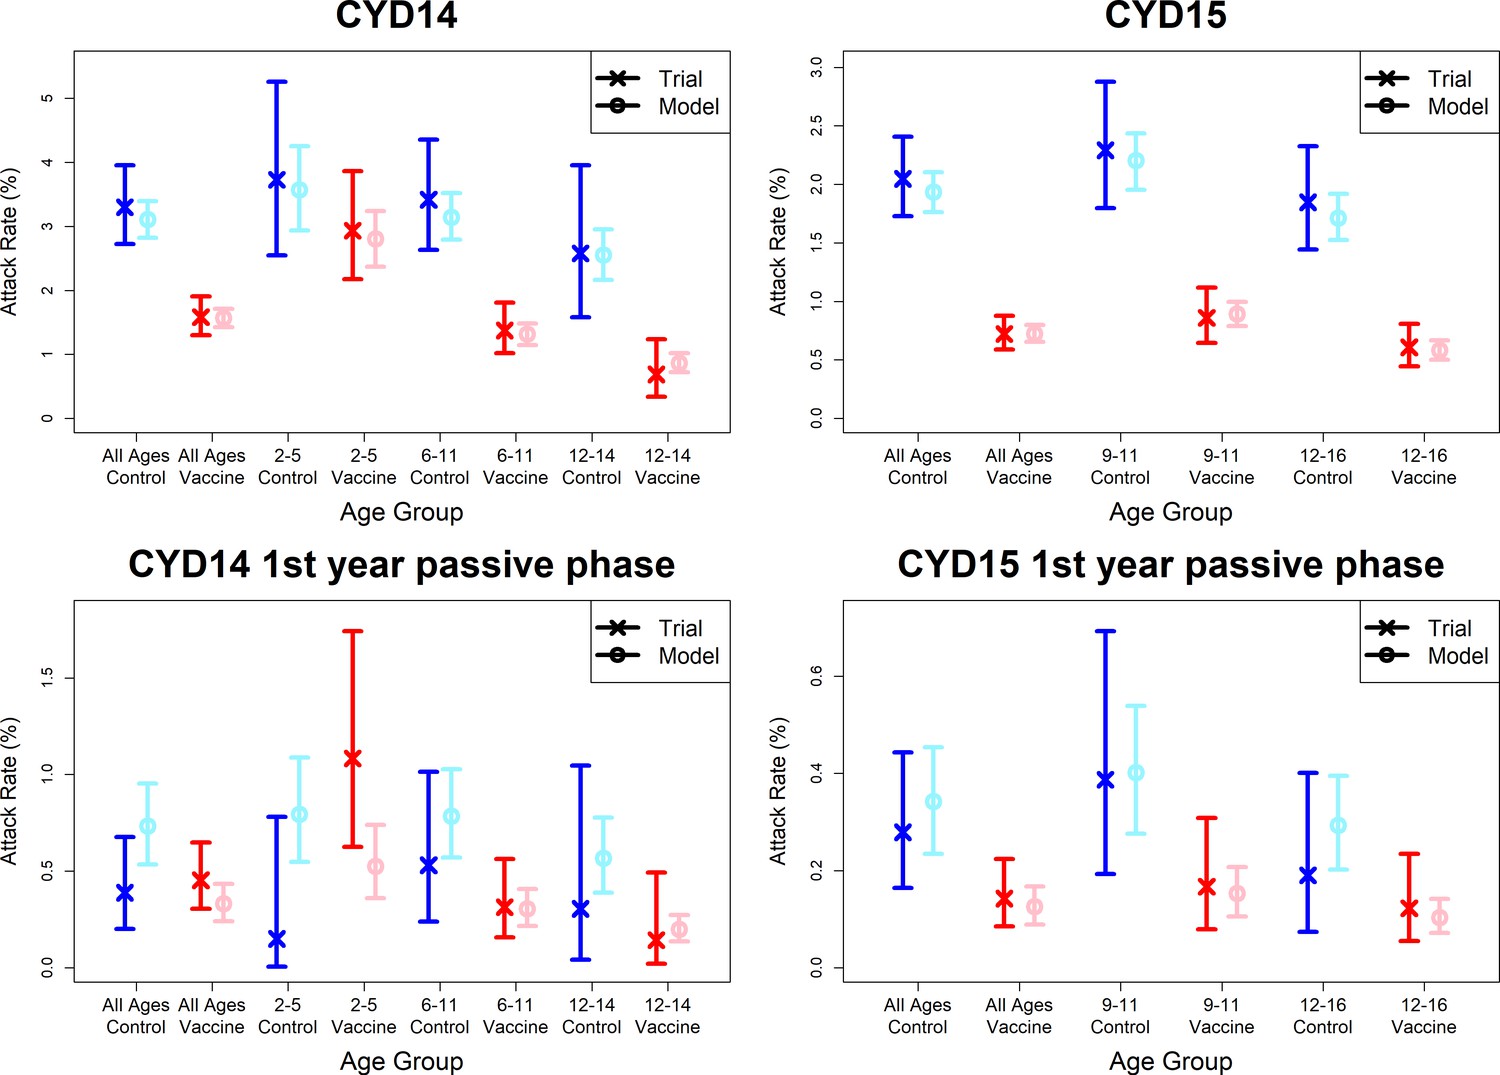
Figure 7 with 8 supplements

Model fits to observed attack rates at trial level for active and first year passive phase.
Observed and predicted age group-specific attack rates are shown for CYD14 (left column) and CYD15 (right column), for first three years follow-up (active phase and first year hospital phase combined), and for the first year of follow-up only. Blue and red denote observed attack rates for control and vaccine groups, while light blue and pink denote model predictions for control and vaccine groups. Confidence intervals for observed attack rates are calculated using exact binomial confidence intervals, whereas the uncertainty around predicted rates are 95% posterior sample credible intervals.
Figure 7—figure supplement 1
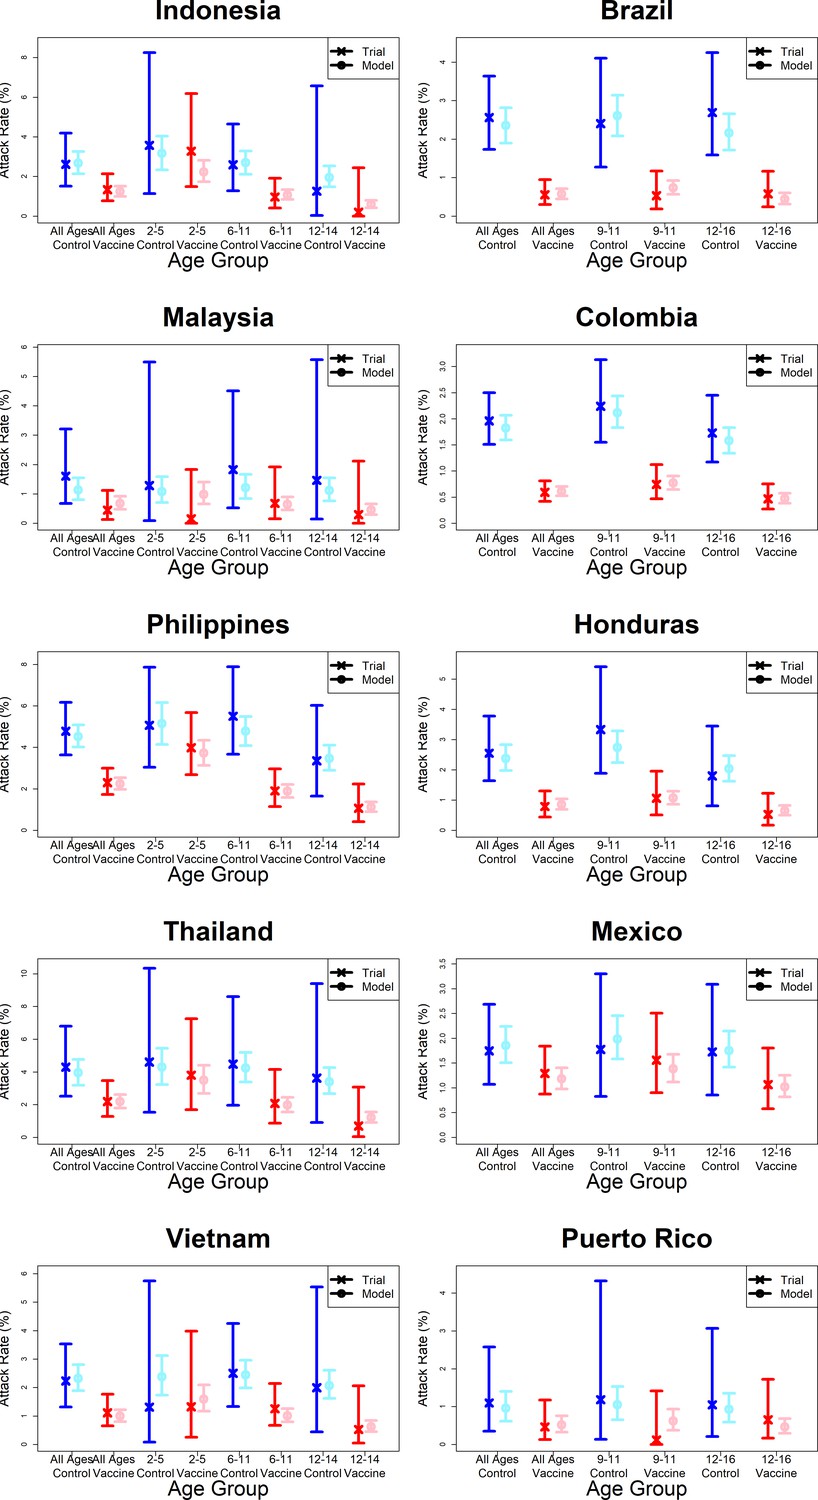
Model fits to observed attack rates by country.
As per Figure 7.
Figure 7—figure supplement 2
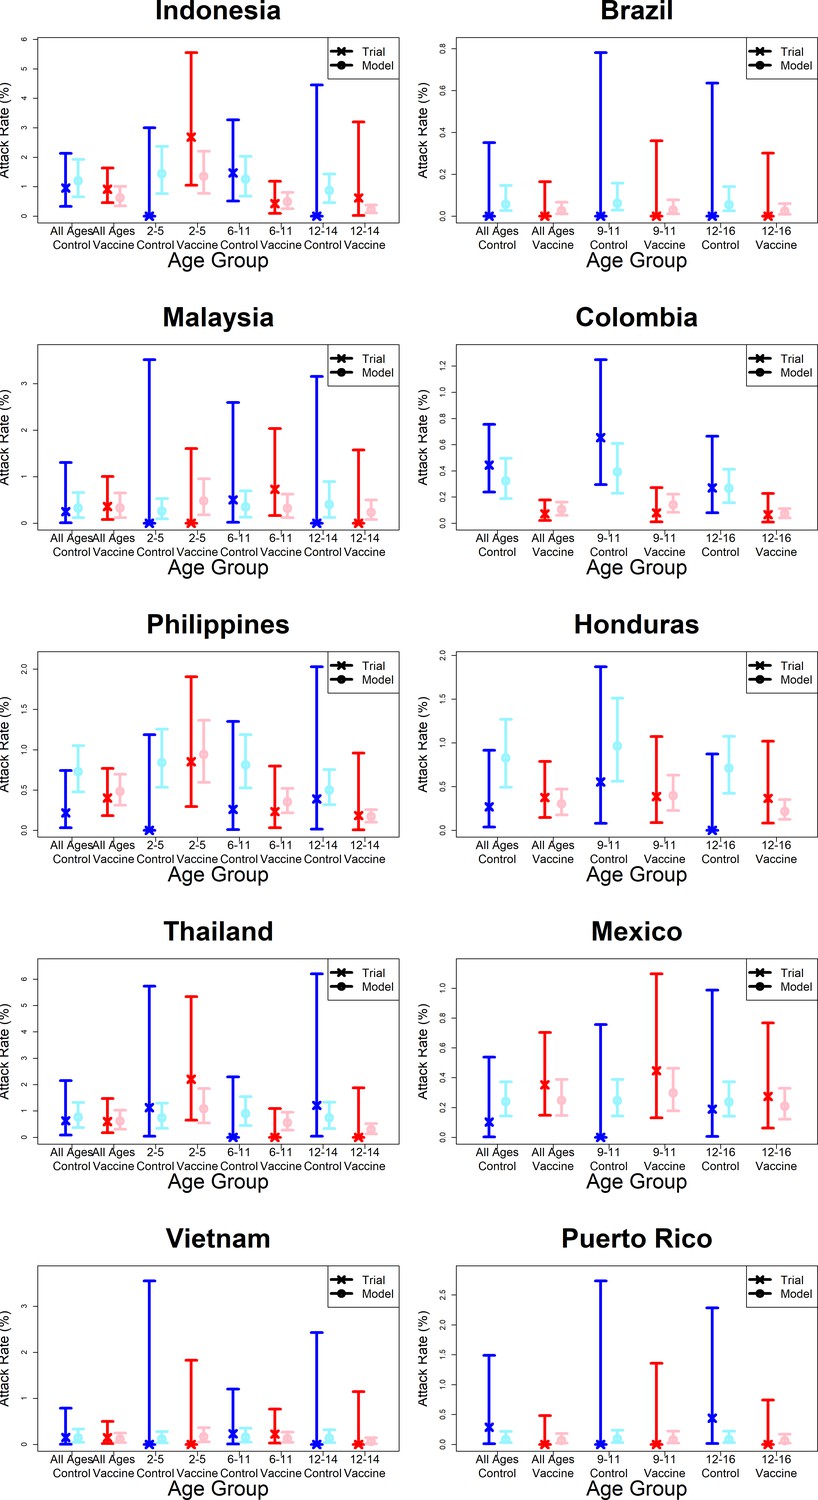
Model fits to observed first year passive phase attack rates by country.
As per Figure 7.
Figure 7—figure supplement 3
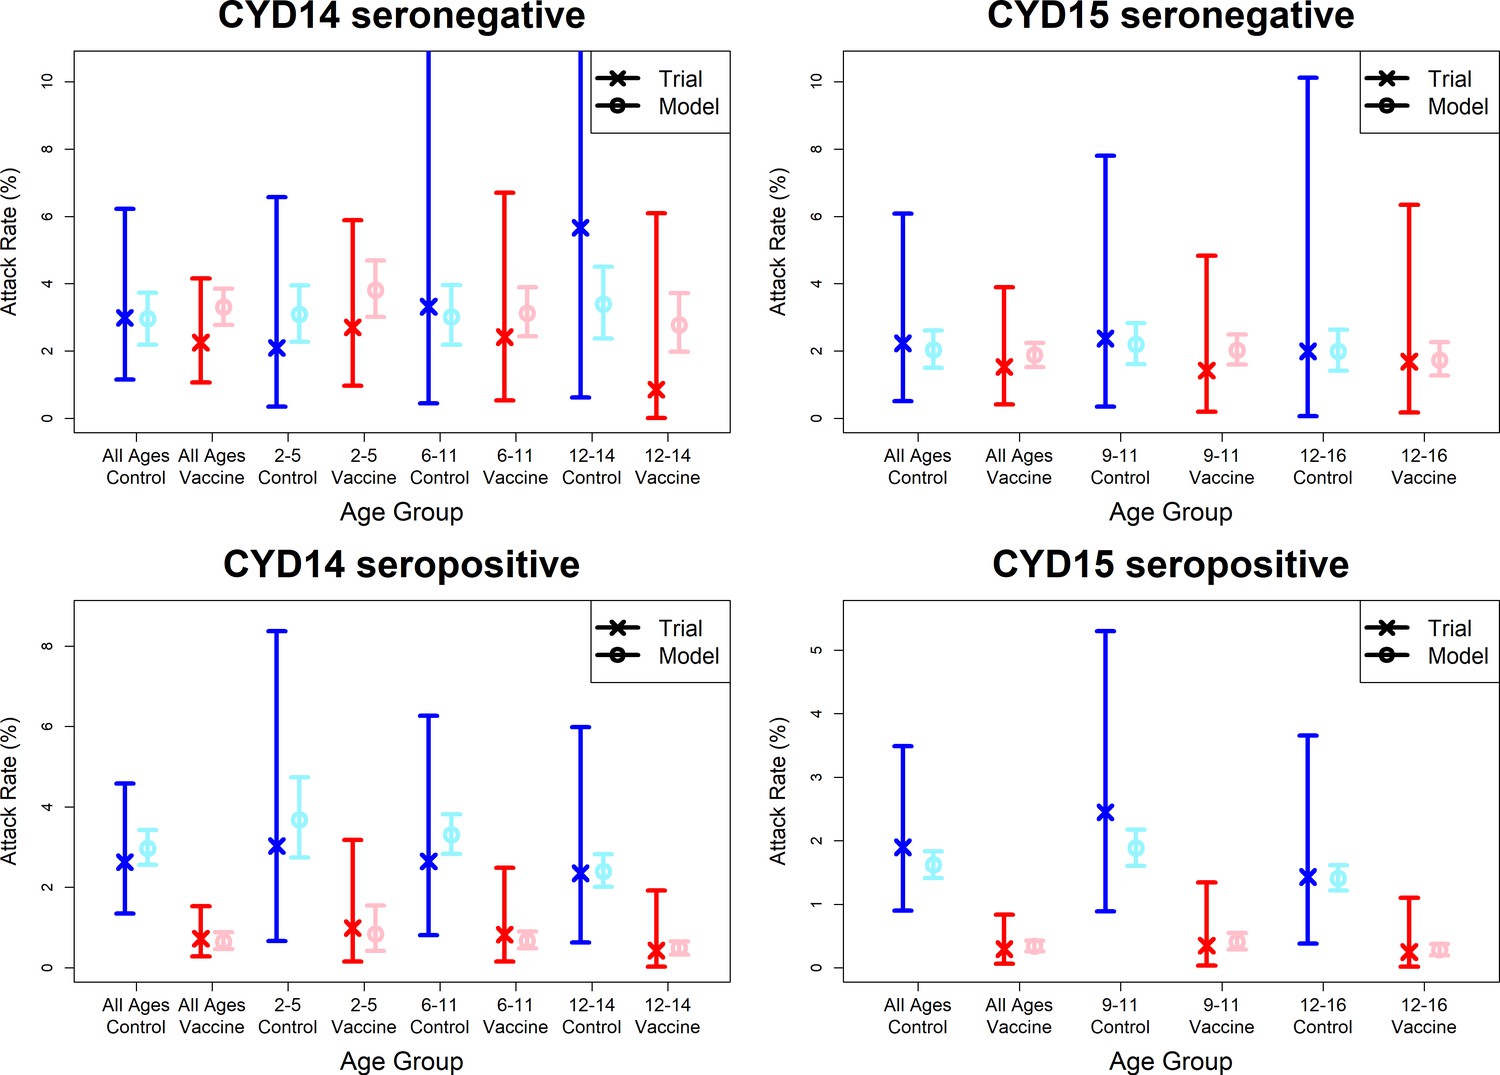
Model fits to observed immunogenicity subset attack rates.
As per Figure 7. Seronegative (top row) and seropositive (bottom row) observed and predicted attack rates for CYD14 (left column) and CYD15 (right column) for combined active and first year passive follow-up.
Figure 7—figure supplement 4
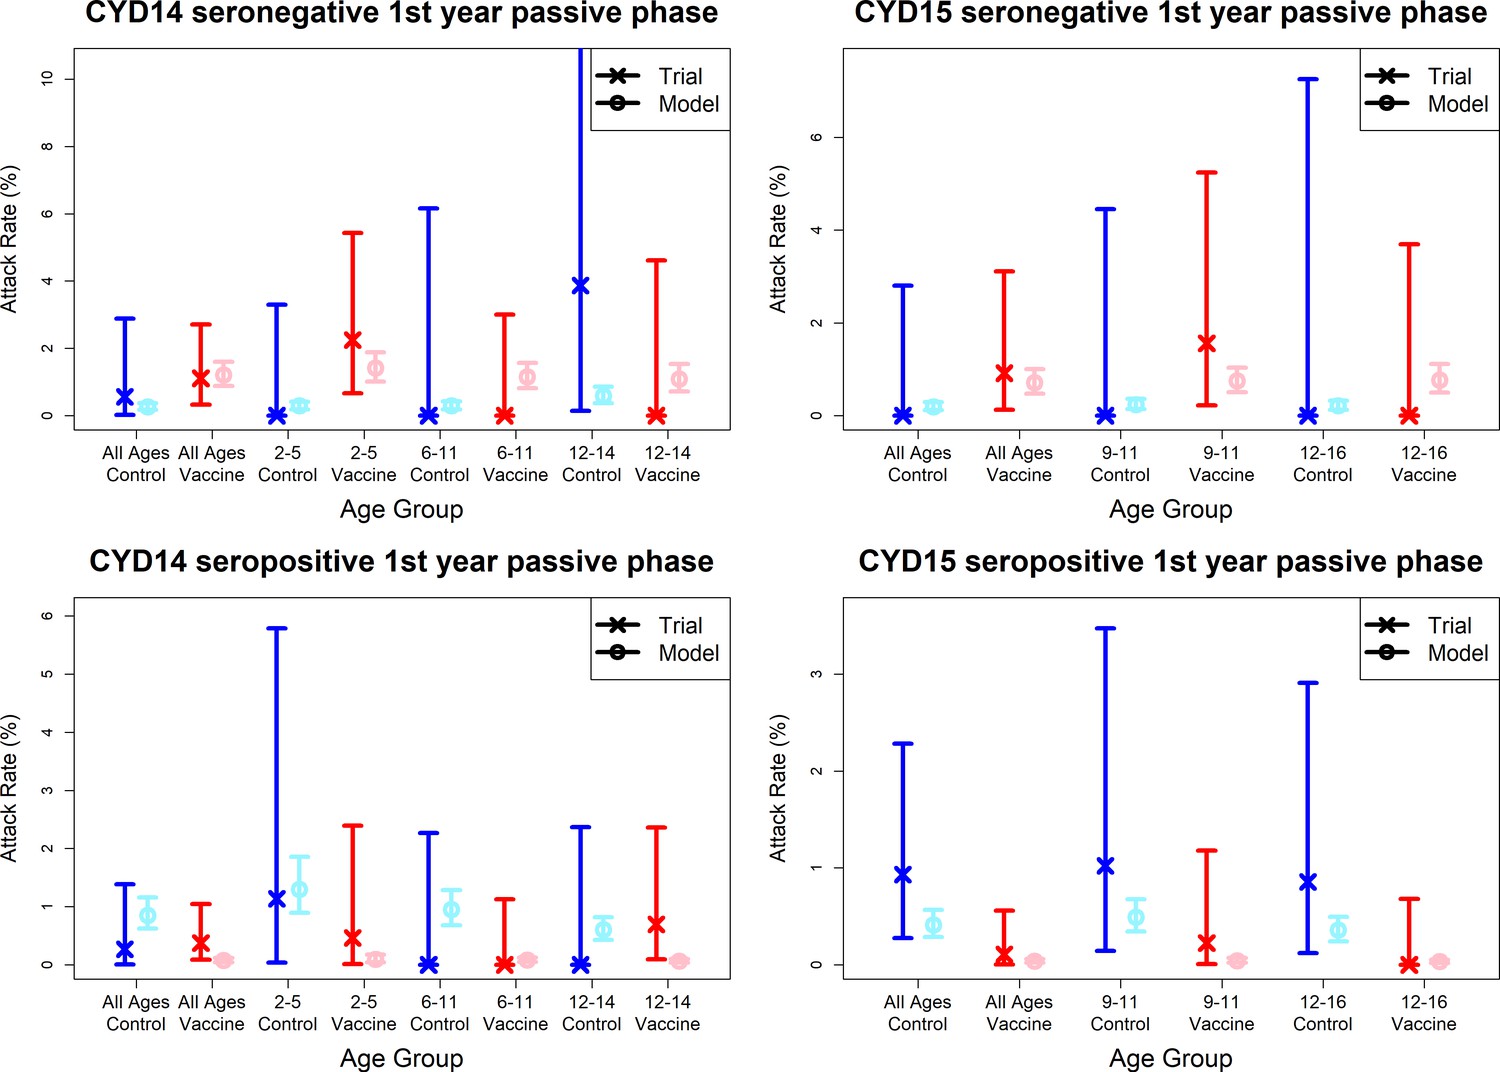
Model fits to observed immunogenicity subset attack rates from first year passive phase.
As per Figure 7. Seronegative (top row) and seropositive (bottom row) observed and predicted attack rates for CYD14 (left column) and CYD15 (right column) for first year passive follow-up only.
Figure 7—figure supplement 5
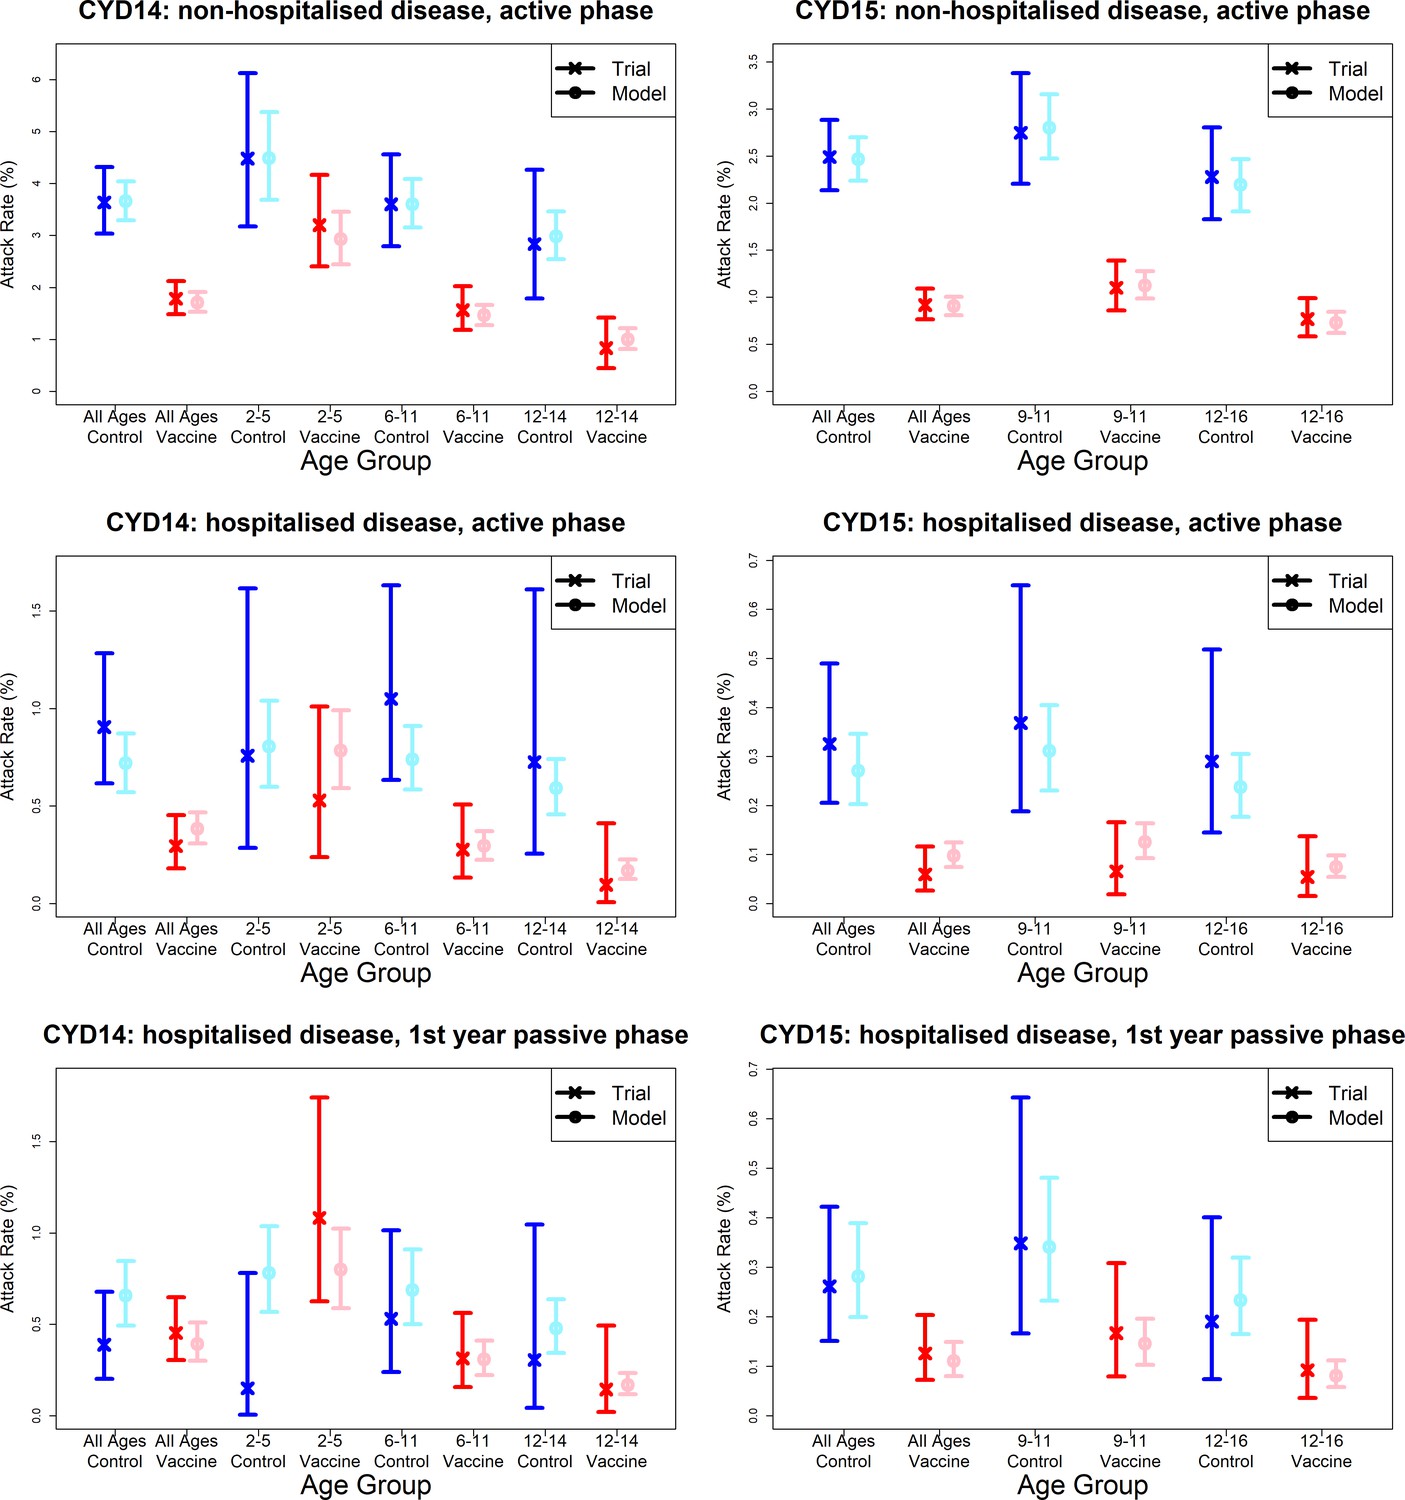
Model fits to observed attack rates by trial, hospitalisation status and trial phase.
As per Figure 7, showing attack rates by age group for CYD14 (left column) and CYD15 (right column). The top row shows attack rates for non-hospitalised disease in the active phase (the majority of case data). Second and third rows show attack rates for hospitalised disease during the active phase (middle row) and first year passive phase (bottom row).
Figure 7—figure supplement 6
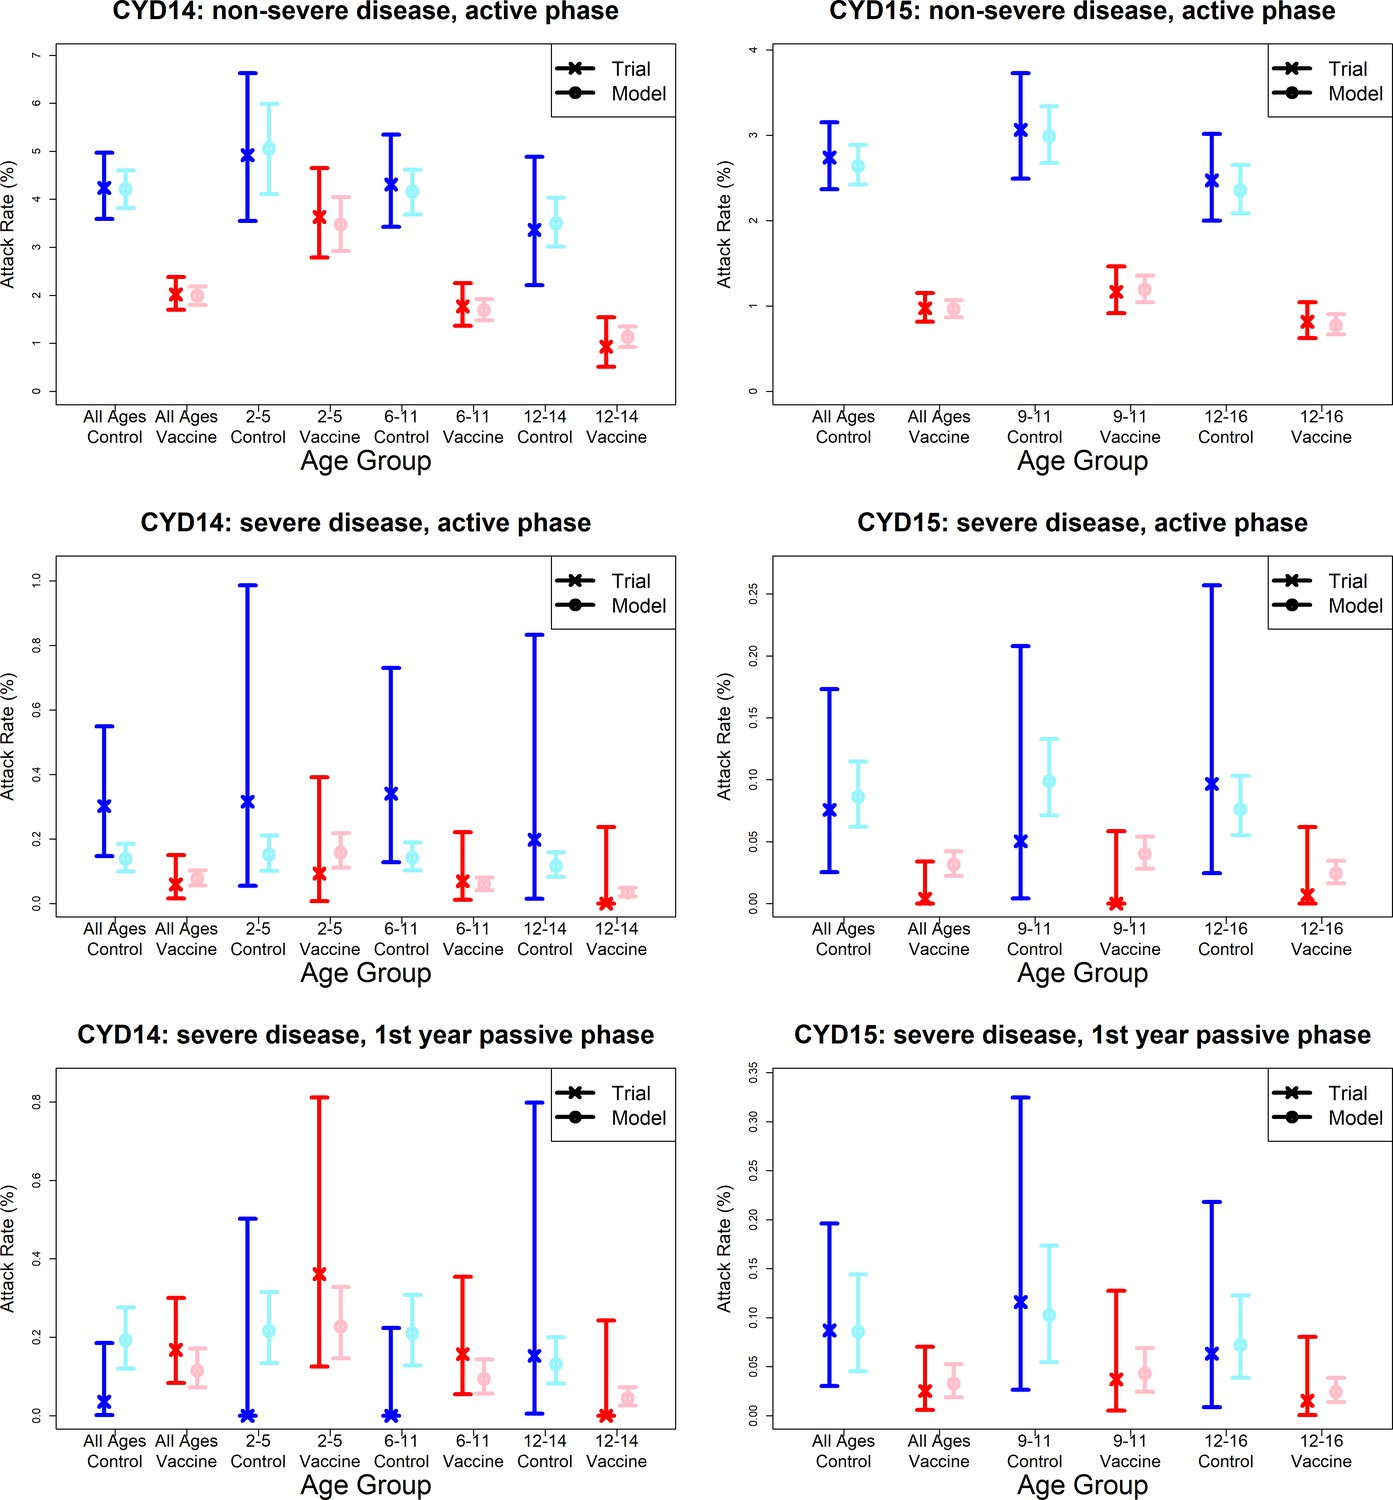
Model fits to observed attack rates by trial, disease severity and trial phase.
As per Figure 7, showing attack rates by age group for CYD14 (left column) and CYD15 (right column). The top row shows attack rates for non-severe disease in the active phase (the majority of case data). Second and third rows show attack rates for severe disease during the active phase (middle row) and first year passive phase (bottom row).
Figure 7—figure supplement 7
Model fits to observed attack rates at trial level for active and first year passive phase (model without immune priming).
As per Figure 7.
Figure 7—figure supplement 8

Model fits to observed attack rates at trial level for active and first year passive phase (model with fitted age-specific transient immunity durations).
As per Figure 7.
Tables
Table 1
Parameter values by model variant.
A, B, C, D refer to panels A, B, C and D of Figure 2. WBIC: Widely-Applicable Bayesian Information Criterion.
| Model variant | Main model A | Age effects onlyB | Serotype effects onlyC | Simplest modelD | ||
|---|---|---|---|---|---|---|
| WBIC | −28627.1 | −29065.33 | −28591.5 | −29018.16 | ||
| Relative risks | Trial phase | No. prior infections | ||||
| Active (K0,0) | 0 | 0.7 (0.36, 0.98) | 0.53 (0.26, 0.9) | 0.52 (0.28, 0.83) | 0.43 (0.24, 0.78) | |
| Active (K0,1) | 1 (baseline) | 1 (1, 1) | 1 (1, 1) | 1 (1, 1) | 1 (1, 1) | |
| Active (K0,2) | two or 3 | 0.31 (0.14, 0.63) | 0.32 (0.14, 0.65) | 0.2 (0.1, 0.4) | 0.21 (0.089, 0.45) | |
| Passive (K1,0) | 0 | 0.053 (0.034, 0.078) | 0.054 (0.035, 0.078) | 0.051 (0.033, 0.073) | 0.052 (0.034, 0.074) | |
| Passive (K1,1) | 1 | 0.21 (0.14, 0.31) | 0.22 (0.14, 0.31) | 0.2 (0.13, 0.29) | 0.21 (0.14, 0.3) | |
| Passive (K2,1) | 2 or 3 | 0.053 (0.034, 0.078) | 0.054 (0.035, 0.078) | 0.051 (0.033, 0.073) | 0.052 (0.034, 0.074) | |
| Seronegative transient immunity | Any serotype | Any age | - | - | - | 0.64 (0.34, 0.81) |
| 2–5 years | - | 0.48 (0.085, 0.77) | - | - | ||
| 6–11 years | - | 0.65 (0.36, 0.85) | - | - | ||
| 12–16 years | - | 0.61 (0.25, 0.85) | - | - | ||
| Serotype 1 | Any age | - | - | 0.47 (0.12, 0.74) | - | |
| 2–5 years | 0.16 (–0.34, 0.61) | - | - | - | ||
| 6–11 years | 0.39 (–0.0023, 0.73) | - | - | - | ||
| 12–16 years | 0.4 (0.022, 0.73) | - | - | - | ||
| Serotype 2 | Any age | - | - | 0.29 (0.0095, 0.62) | - | |
| 2–5 years | −0.11 (–0.72, 0.46) | - | - | - | ||
| 6–11 years | 0.12 (–0.38, 0.57) | - | - | - | ||
| 12–16 years | 0.14 (–0.39, 0.6) | - | - | - | ||
| Serotype 3 | Any age | - | - | 0.69 (0.29, 0.96) | - | |
| 2–5 years | 0.43 (–0.17, 0.86) | - | - | - | ||
| 6–11 years | 0.65 (0.15, 0.96) | - | - | - | ||
| 12–16 years | 0.67 (0.17, 0.97) | - | - | - | ||
| Serotype 4 | Any age | - | - | 0.78 (0.59, 0.92) | - | |
| 2–5 years | 0.54 (0.11, 0.85) | - | - | - | ||
| 6–11 years | 0.76 (0.53, 0.93) | - | - | - | ||
| 12–16 years | 0.78 (0.48, 0.98) | - | - | - | ||
| Seropositive transient immunity | Any serotype | Any age | - | - | - | 0.43 (0.041, 0.73) |
| 2–5 years | - | 0.23 (0.0089, 0.6) | - | - | ||
| 6–11 years | - | 0.49 (0.11, 0.74) | - | - | ||
| 12–16 years | - | 0.65 (0.37, 0.82) | - | - | ||
| Serotype 1 | Any age | - | - | 0.29 (0.015, 0.64) | - | |
| 2–5 years | 0.21 (0.011, 0.55) | - | - | - | ||
| 6–11 years | 0.42 (0.063, 0.7) | - | - | - | ||
| 12–16 years | 0.54 (0.22, 0.78) | - | - | - | ||
| Serotype 2 | Any age | - | - | 0.4 (0.041, 0.75) | - | |
| 2–5 years | 0.26 (0.015, 0.63) | - | - | - | ||
| 6–11 years | 0.47 (0.1, 0.76) | - | - | - | ||
| 12–16 years | 0.59 (0.28, 0.83) | - | - | - | ||
| Serotype 3 | Any age | - | - | 0.54 (0.12, 0.84) | - | |
| 2–5 years | 0.36 (0.06, 0.72) | - | - | - | ||
| 6–11 years | 0.57 (0.19, 0.83) | - | - | - | ||
| 12–16 years | 0.69 (0.39, 0.9) | - | - | - | ||
| Serotype 4 | Any age | - | - | 0.79 (0.44, 0.98) | - | |
| 2–5 years | 0.52 (0.2, 0.86) | - | - | - | ||
| 6–11 years | 0.73 (0.37, 0.96) | - | - | - | ||
| 12–16 years | 0.85 (0.56, 0.99) | - | - | - | ||
| Transient-immunity duration | Seronegative (τ0) | 4.5 (1, 9.6) | 5 (1.1, 9.7) | 4.1 (0.97, 9.4) | 4.9 (1.2, 9.6) | |
| Seropositive (τ1) | 11 (2.3, 20) | 12 (2.9, 20) | 9.5 (1.2, 19) | 10 (1.3, 20) | ||
| Age-specific hazard multiplier Z(α) | 2–5 years (baseline) | 1 (1,1) | 1 (1, 1) | - | - | |
| 6–11 years | 1.2 (0.91, 1.5) | 1.1 (0.88, 1.4) | - | - | ||
| 12–16 years | 1.1 (0.79, 1.5) | 1 (0.76, 1.4) | - | - | ||
| Infection risk multiplier | Seronegative (M0, baseline) | 1 (1,1) | 1 (1, 1) | 1 (1,1) | 1 (1, 1) | |
| Seropositive (M1) | 0.77 (0.43, 0.99) | 0.61 (0.31, 0.96) | 0.69 (0.4, 0.97) | 0.57 (0.33, 0.94) | ||
Additional files
-
Supplementary file 1
Model glossary / parameter table.
- https://cdn.elifesciences.org/articles/65131/elife-65131-supp1-v2.docx
-
Transparent reporting form
- https://cdn.elifesciences.org/articles/65131/elife-65131-transrepform-v2.docx
Download links
A two-part list of links to download the article, or parts of the article, in various formats.
Downloads (link to download the article as PDF)
Open citations (links to open the citations from this article in various online reference manager services)
Cite this article (links to download the citations from this article in formats compatible with various reference manager tools)
Efficacy profile of the CYD-TDV dengue vaccine revealed by Bayesian survival analysis of individual-level phase III data
eLife 10:e65131.
https://doi.org/10.7554/eLife.65131


