A nuclease- and bisulfite-based strategy captures strand-specific R-loops genome-wide
- Gene Expression and Regulation program, The Wistar Institute, United States
- Epigenetics Institute, University of Pennsylvania, United States
Figures
Figure 1

BisMapR, an RNase H-based strand-specific native R-loop detection strategy.
Schematic of the BisMapR protocol. R-loops are released from cells using MapR and subjected to non-denaturing bisulfite conversion. Bisulfite-converted products are directly processed for second-strand synthesis in the presence of RNase H and dUTP. Adaptors are ligated to resultant dsDNA. Treatment with uracil DNA glycosylase (UDG) degrades all uracil-containing DNA molecules. Remaining DNA is tagged with paired-end barcoded index primers, amplified, sequenced, and strand-specifically aligned. Created with BioRender.com.
Figure 2 with 1 supplement
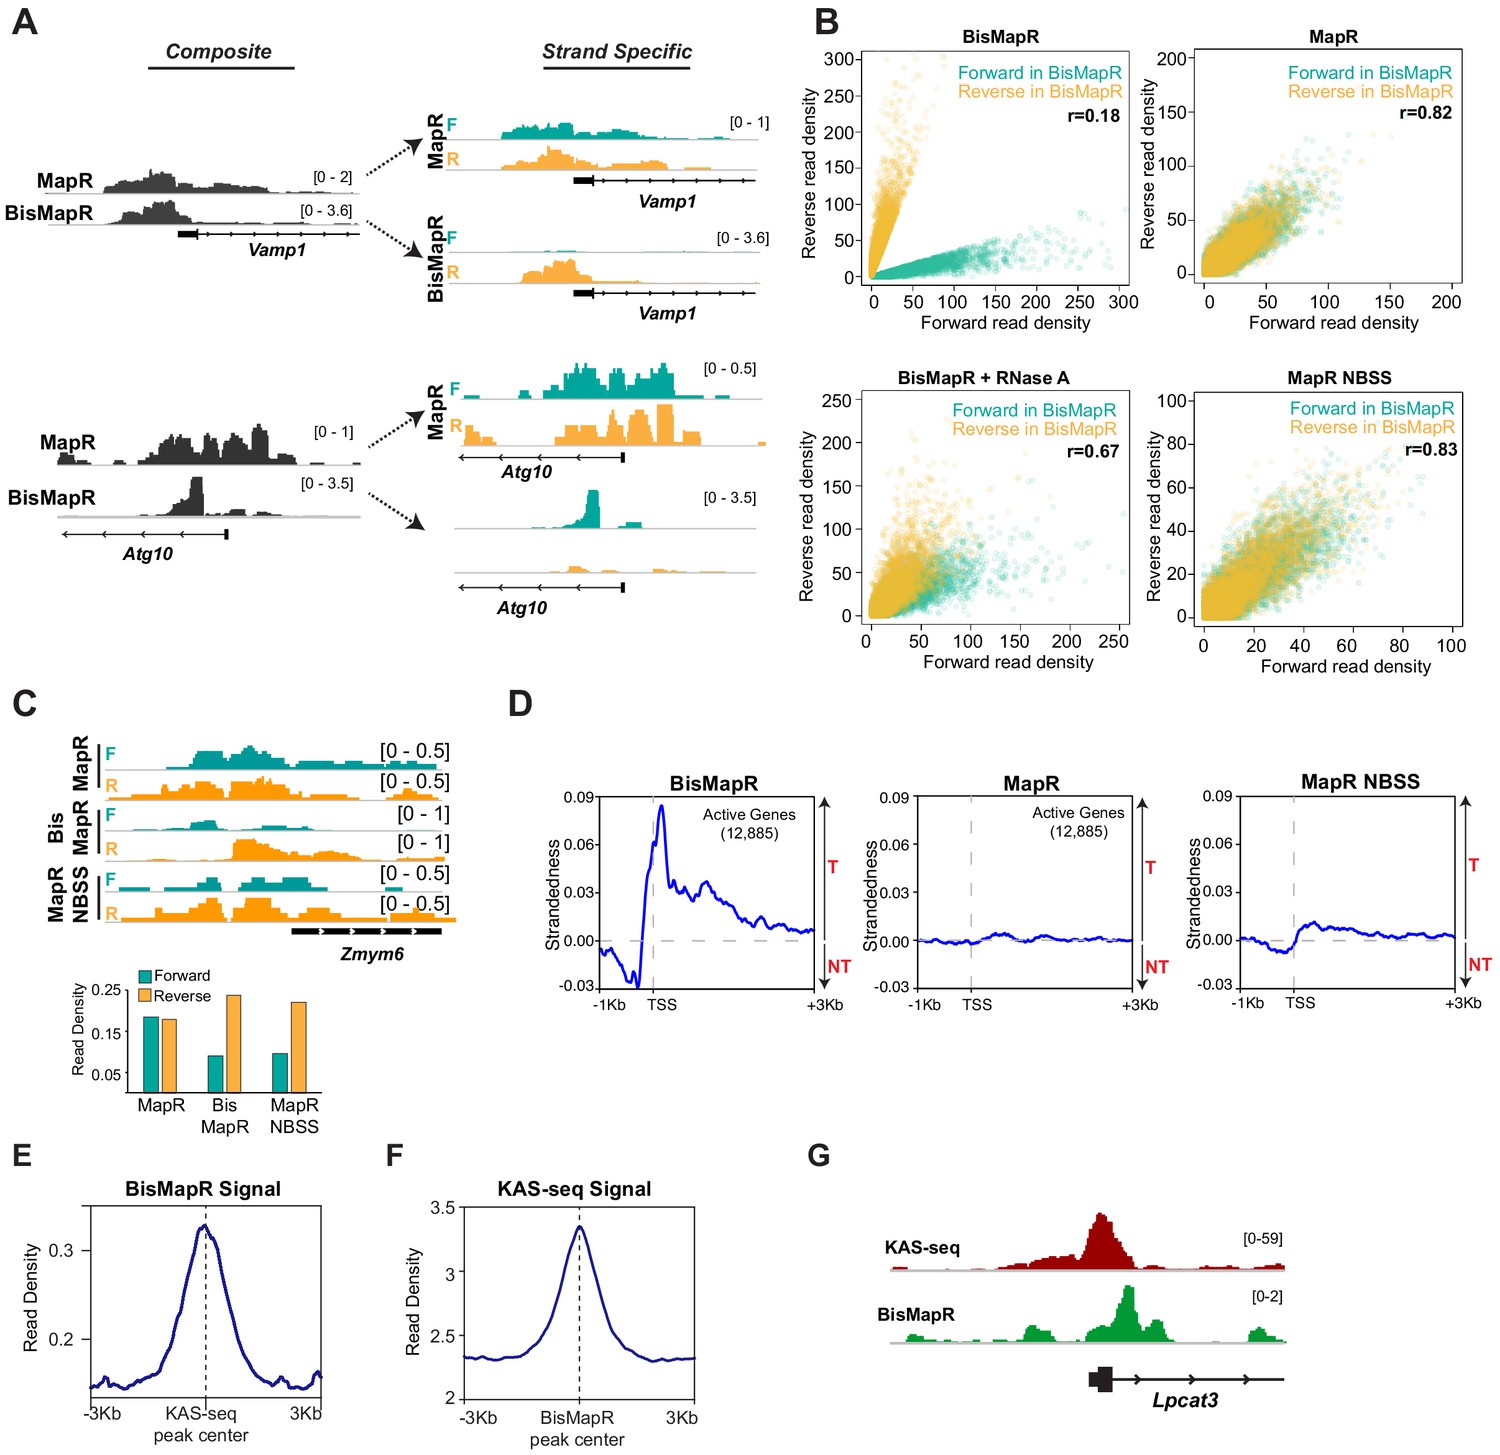
BisMapR confers strand specificity to nuclease-based genome-wide R-loop detection.
(A) Genome browser views of the Vamp1 and Atg10 genes showing composite (dark gray) BisMapR and MapR signals (reads per million, RPM) (left) and the same signal when separated into forward (teal) and reverse (orange) strands (right). (B) Correlation plots of normalized read densities between forward and reverse strands in BisMapR, MapR, BisMapR samples treated with RNase A, and MapR samples without bisulfite treatment and with second-strand synthesis (NBSS). TSS regions of 19,655 genes with high specificity toward forward (teal, 9788 genes) or reverse (orange, 9867 genes) strand signals in BisMapR, defined as log2 ratio of at least 1.5 in either direction between forward or reverse read densities, are shown. r, Pearson correlation coefficients between forward and reverse read densities for all 19,655 genes. (C) Top, genome browser view of the Zmym6 gene showing forward (teal) and reverse (orange) strand R-loop signal (reads per million, RPM) for MapR, BisMapR, and MapR NBSS. Bottom, bar chart of total forward and reverse strand read densities across the region. (D) Strandedness plots of BisMapR, MapR, and MapR NBSS strand-specific signals around the transcription start sites (TSS) of 13,380 active genes in mESCs. Strandedness was calculated as the difference between template (T) and non-template (NT) signal (reads per million, RPM). (E) Signal plot of composite BisMapR signal (reads per million, RPM) centered around 40,900 KAS-seq peaks. (F) Signal plot of KAS-seq signal centered around 168,774 composite BisMapR peaks. (G) Genome browser view of the Lpcat3 gene showing KAS-seq (red) and composite BisMapR (green) signal (reads per million, RPM).
Figure 2—figure supplement 1
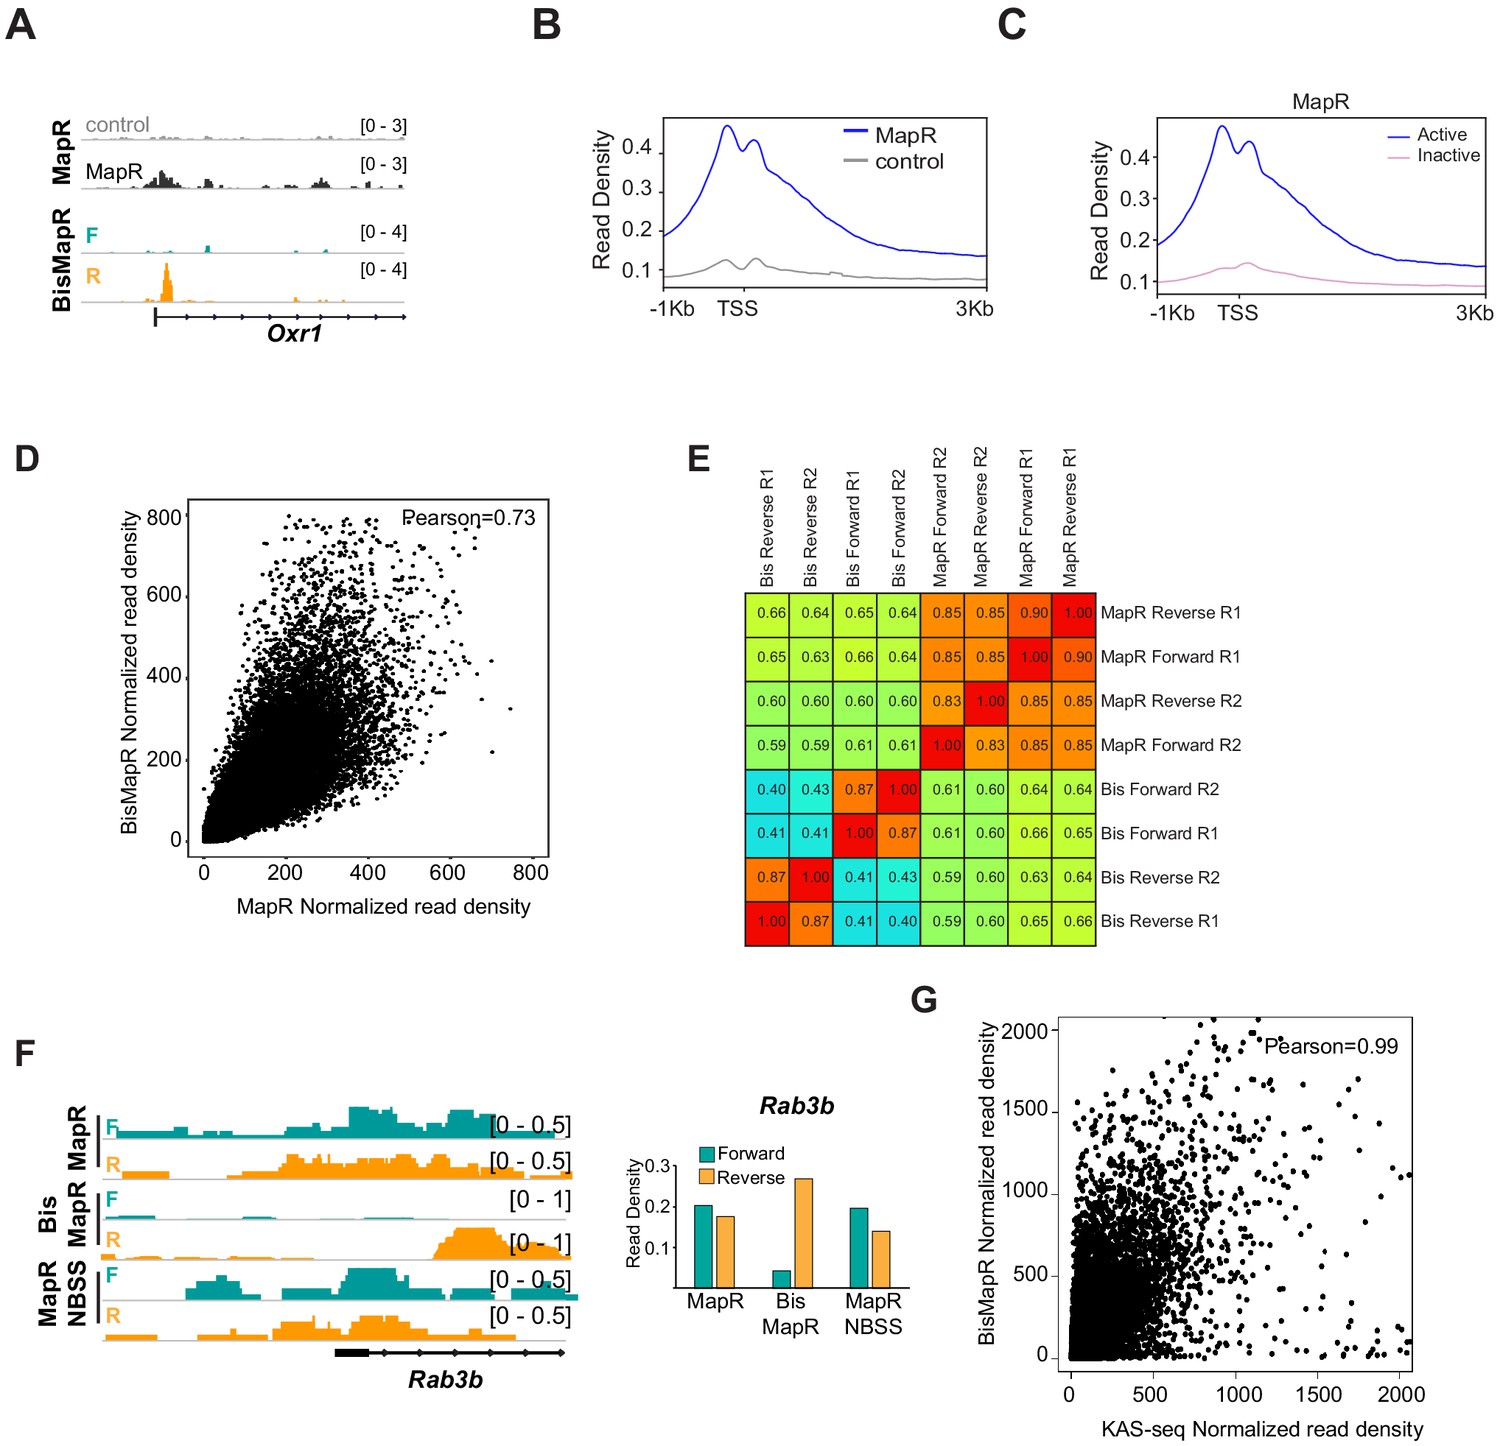
BisMapR generates strand-specific transcription-dependent R-loop sequencing data.
(A) Genome browser view of the Oxr1 gene showing GST-MNase (control) and GST-RHΔ-MNase (MapR) composite signals and BisMapR strand-specific signals. Forward, teal. Reverse, orange. (B) Metagene plot of MNase control and MapR signals at 13,380 active TSS in mESCs. Read density, reads per million (RPM). (C) Metagene plot of MapR signal at 13,380 active TSS and 42,003 inactive TSS in mESCs. Read density, reads per million (RPM). (D) Correlation plot showing normalized read density between MapR composite and BisMapR composite samples. Pearson correlation, 0.73. For all correlation analysis plots, read density was calculated for 1 kb flanking regions across all mouse TSS (55,364 genes). (E) Heatmap showing pairwise Pearson correlation scores of composite, forward-strand, and reverse-strand BisMapR and MapR read alignments. (F) Left, genome browser view of the Rab3b gene showing forward (teal) and reverse (orange) strand R-loop signal (reads per million, RPM) for MapR, BisMapR, and MapR NBSS. Right, bar chart of total forward- and reverse-strand read densities across the region. (G) Correlation plot showing normalized read density between KAS-seq and BisMapR composite samples. Pearson correlation, 0.99.
Figure 3 with 1 supplement
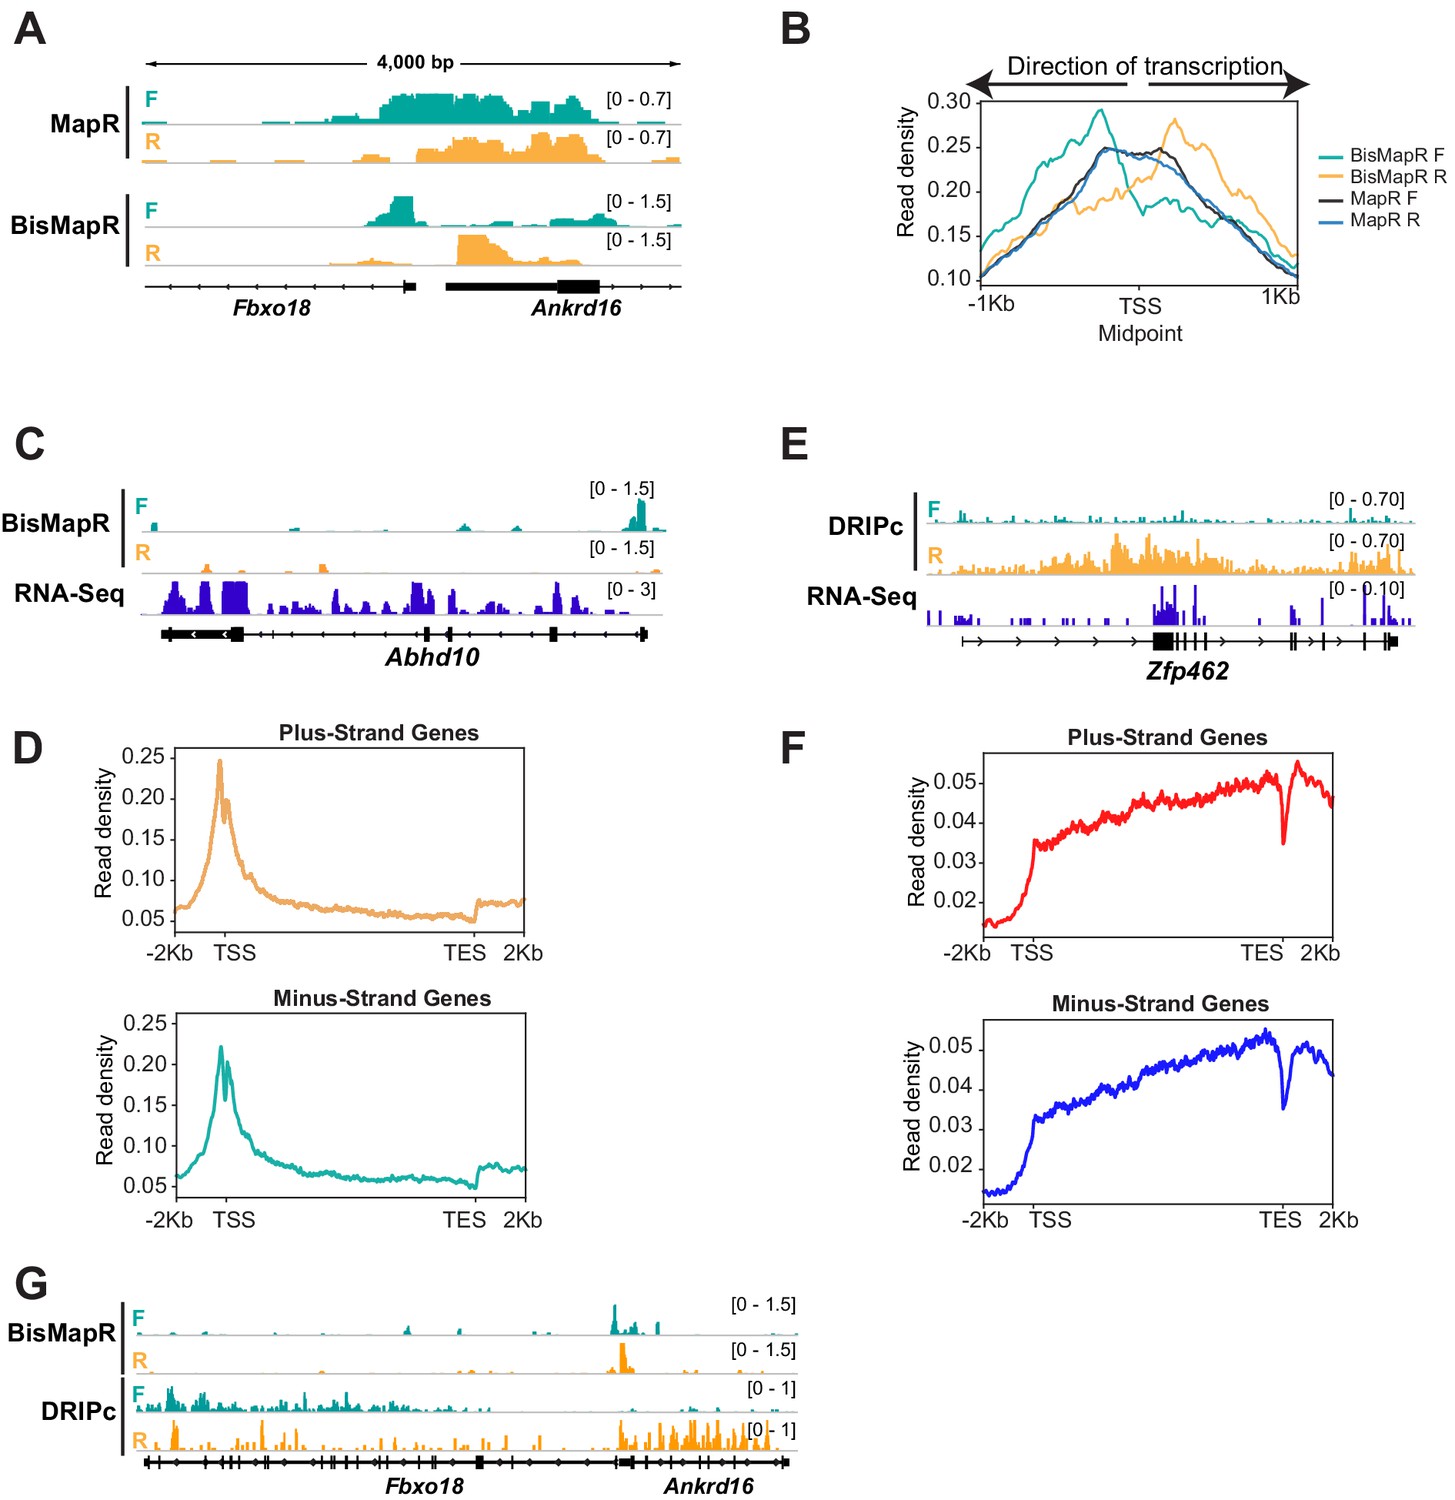
BisMapR distinguishes strand-specific R-loops with high resolution at bidirectional gene pairs.
(A) Genome browser view of the bidirectional promoter for Fbxo18 and Ankrd16 showing MapR and BisMapR signals (RPM) separated by forward (teal) and reverse (orange) strands. (B) Metagene plots of strand-specific BisMapR (forward strand [teal] and reverse strand [orange]) and MapR (forward strand [dark blue] and reverse strand [light blue]) signals at 1001 bidirectional promoters. TSS Midpoint, the midpoint between the transcription start sites of plus-strand and minus-strand genes. (C) Genome browser view of the Abhd10 gene showing BisMapR signal (reads per million, RPM) separated into forward (teal) and reverse (orange) strands. Mouse ESC RNA-seq signal is shown in blue. (D) Metagene plots of template strand BisMapR signal of 6746 plus-strand genes (top) and 6634 minus-strand genes (bottom) expressed in mESCs. (E) Genome browser view of the Zfp462 gene showing DRIPc signals separated into forward (teal) and reverse (orange) strands. 3T3 RNA-seq signal is shown in blue. (F) Metagene plots of template strand DRIPc signal of 6223 plus-strand genes (top) and 6164 minus-strand genes (bottom) expressed in 3T3. (G) Genome browser view of the bidirectional promoter for Fbxo18 and Ankrd16 showing BisMapR and DRIPc signals (RPM) separated by forward (teal) and reverse (orange) strands.
Figure 3—figure supplement 1
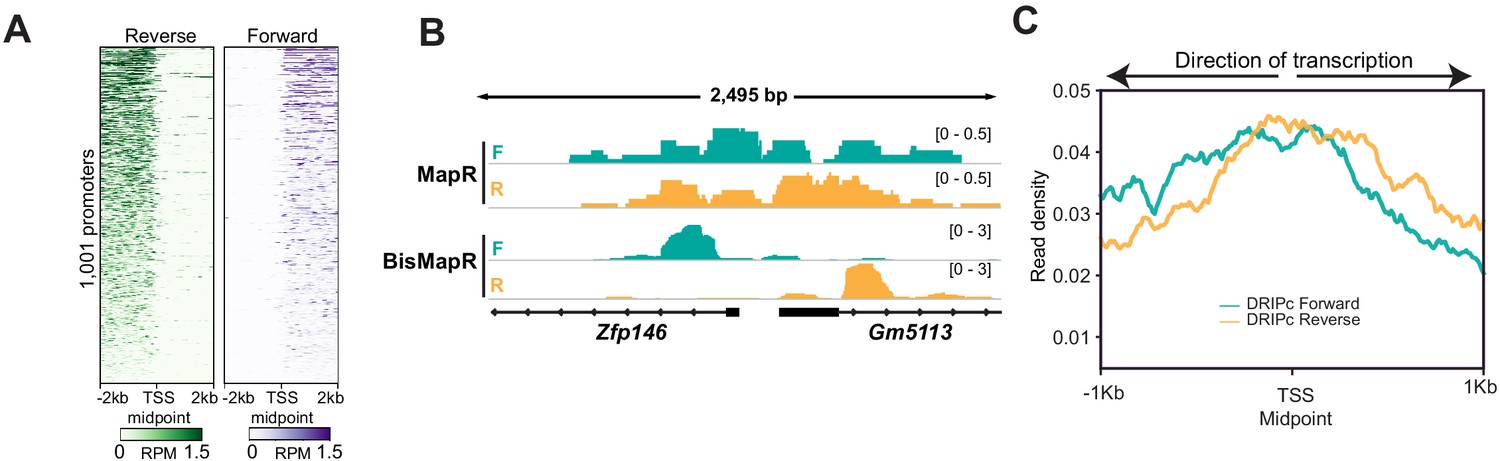
BisMapR reveals strand specificity of R-loops at high resolution at genic regions genome-wide.
(A) Heatmap of RNA-Seq strand-specific reads at 1001 bidirectional promoters. All rows are oriented in the plus-strand direction. Midpoint between the transcription start sites of plus-strand and minus-strand genes is shown. Signal, reads per million (RPM). (B) Genome browser view of the bidirectional promoter for Zfp146 and Gm5113 showing strand-specific MapR and BisMapR signal (RPM). (C) Metagene plots of strand-specific DRIPc-seq (forward strand [teal] and reverse strand [orange]) signal at 998 3T3 bidirectional promoters. TSS midpoint, the midpoint between the transcription start sites of plus- and minus-strand genes.
Figure 4 with 1 supplement
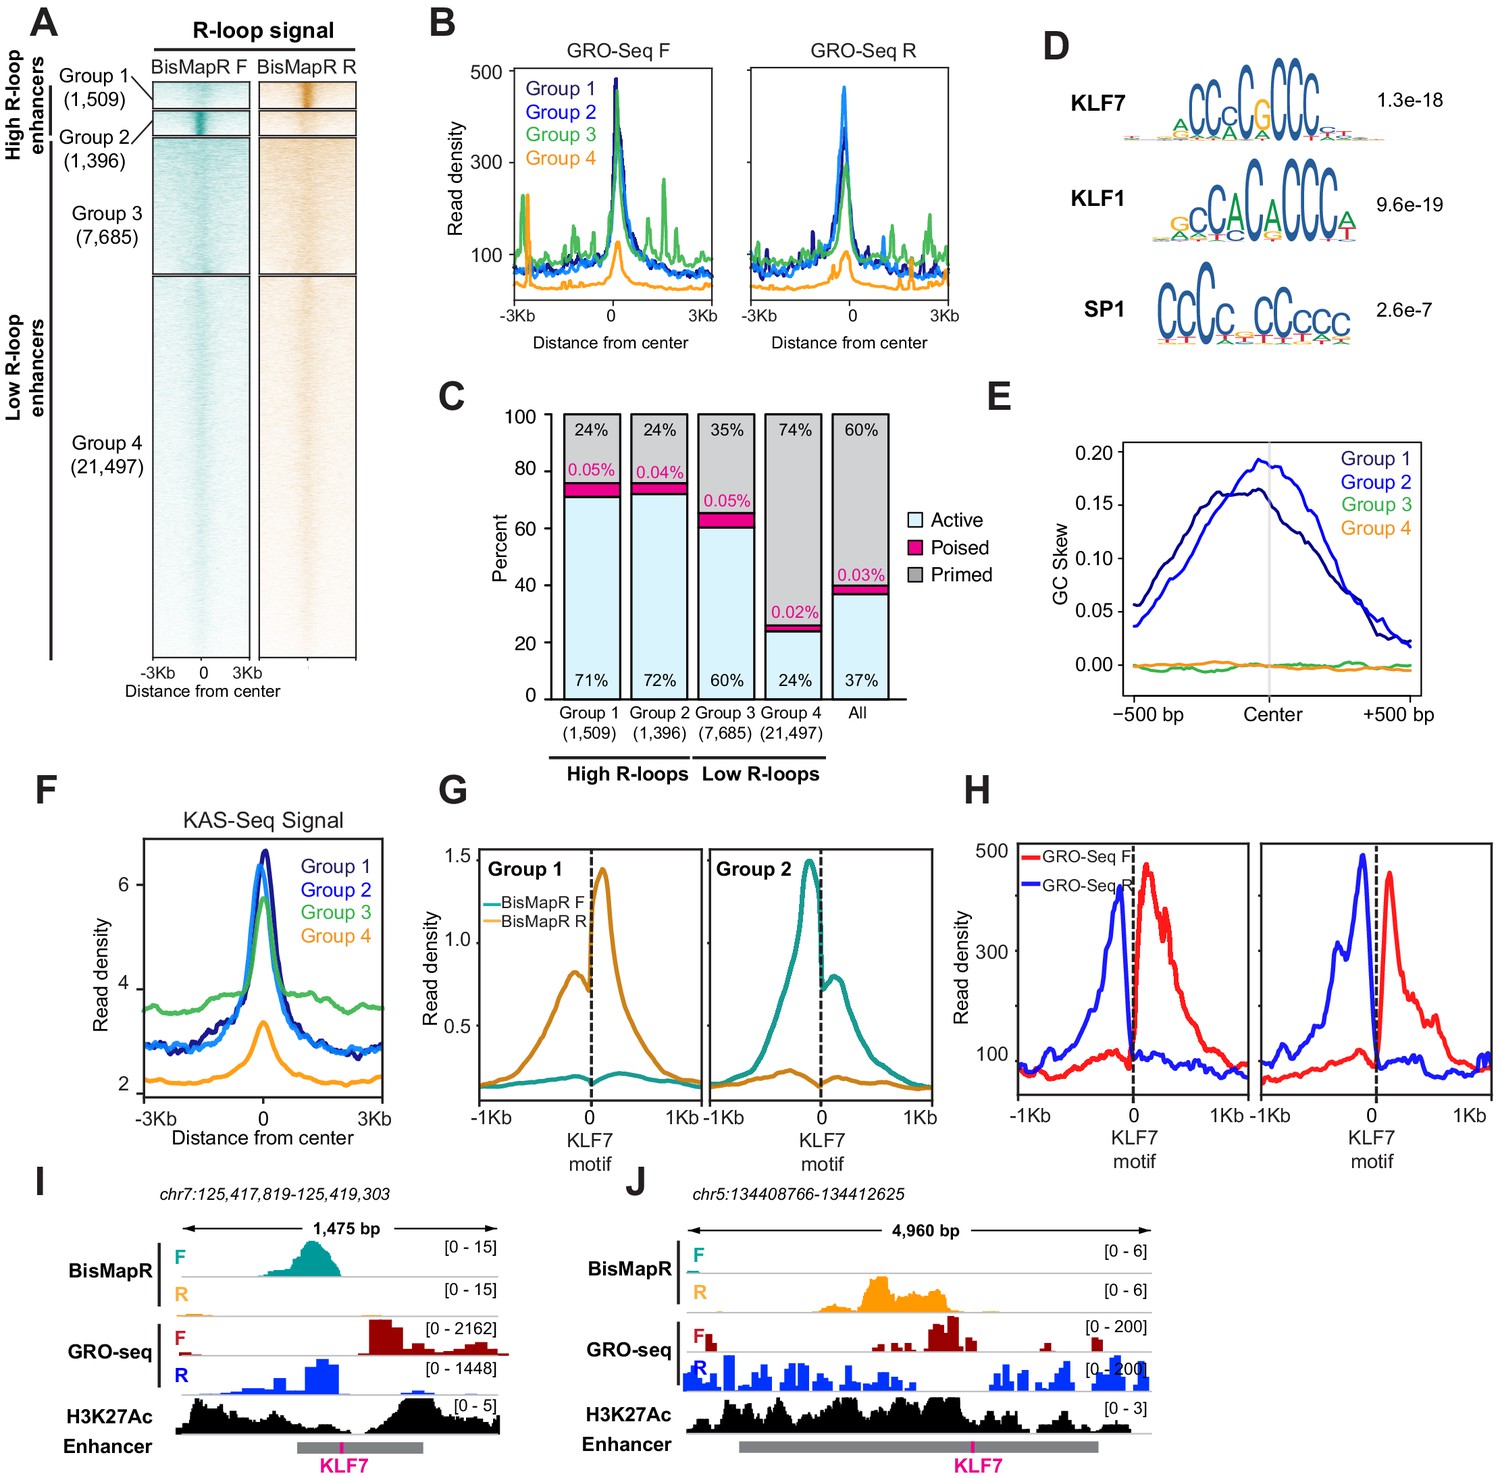
BisMapR reveals strand-specific R-loop formation across a subset of enhancers in mESCs.
(A) Heatmap of strand-specific BisMapR signal across mESC enhancers. Enhancers were divided into four groups by unsupervised k-means clustering (k = 4). Enhancer numbers in each group are indicated in parentheses. Signal, reads per million (RPM). (B) Strand-specific GRO-Seq read densities at group 1 (dark blue), group 2 (light blue), group 3 (green), and group 4 (orange) enhancers. (C) Barplot showing the proportion of active (blue), poised (pink), or primed (gray) enhancers in each group. Enhancer numbers in each group are indicated in parentheses. Distribution of all enhancer types is shown for comparison. (D) Sequence motifs of KLF7, KLF1, and SP1 transcription factors that are centrally enriched across group 1 and 2 enhancers compared to group 3 enhancers. E-values for each sequence are shown. (E) GC skew of non-template strand across group 1 (dark blue), group 2 (light blue), group 3 (green), and group 4 (orange) enhancers. GC skew was calculated as (G–C)/(G+C) in 100 bp sliding windows with 10 bp step size. (F) KAS-Seq read density across group 1 (dark blue), group 2 (light blue), group 3 (green), and group 4 (orange) enhancers. (G) Strand-specific BisMapR signal (RPM) profiles centered around Klf7 motifs identified in group 1 (2094 motifs) and group 2 (1972 motifs) enhancers. (H) Strand-specific GRO-seq signal profiles centered around Klf7 motifs identified in group 1 (2094 motifs) and group 2 (1972 motifs) enhancers. (I, J) Genome browser view of high-R-loop enhancers showing strand-specific BisMapR (F, teal; R, orange) and GRO-seq (F, red; R, blue) signals and H3K27Ac ChIP-seq (black). Enhancer region (gray bar) with location of KLF7 motif (pink) is shown.
Figure 4—figure supplement 1
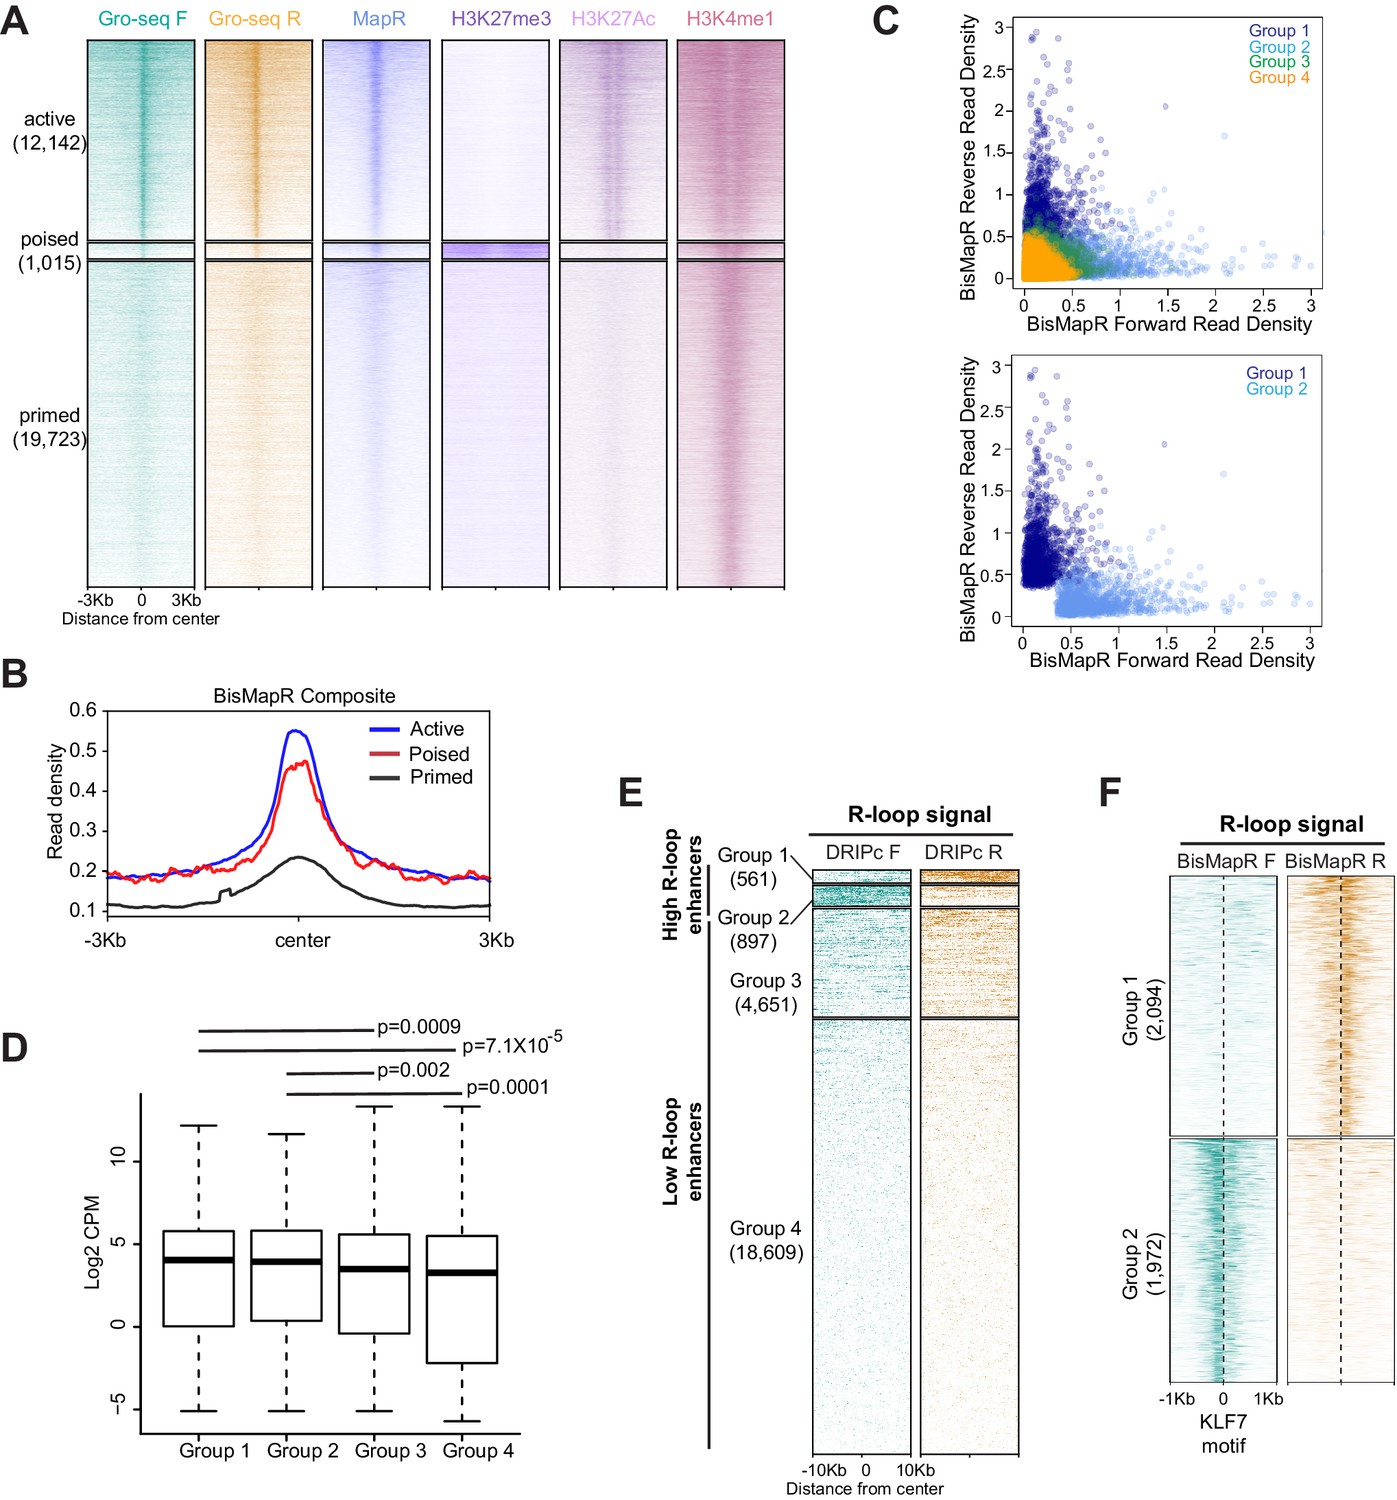
BisMapR identifies strand-specific R-loops at enhancers.
(A) Heatmap of strand-specific GRO-Seq read density, MapR, H3K27me3, H3K27Ac, and H3K4me1 at active, poised, and primed mESC enhancers. Enhancers were divided into active, poised, and primed. Enhancer numbers in each group are indicated in parentheses. (B) BisMapR composite signal profiles at active (blue), poised (red), and primed (black) enhancers. (C) Scatter plots of normalized BisMapR read densities in forward and reverse strands at group 1 (dark blue), group 2 (light blue), group 3 (green), and group 4 (orange) enhancers (top), or at group 1 and group 2 enhancers alone (bottom). Read density was calculated across 500 bp flanking regions around the center of each enhancer. (D) Boxplot showing mESC expression levels of genes associated with enhancers in Groups 1, 2, 3, or 4. Welch’s t-test p-values are shown. (E) Heatmap of strand-specific DRIPc signal across 3T3 enhancers. Enhancers were divided into four groups by unsupervised k-means clustering (k = 4). Enhancer numbers in each group are indicated in parentheses. Signal, reads per million (RPM). (F) Heatmap of strand-specific BisMapR signal centered at KLF7 binding motifs in group 1 and 2 enhancers. Motif numbers in each group are indicated in parentheses. Signal, reads per million (RPM).
Additional files
Download links
A two-part list of links to download the article, or parts of the article, in various formats.
Downloads (link to download the article as PDF)
Open citations (links to open the citations from this article in various online reference manager services)
Cite this article (links to download the citations from this article in formats compatible with various reference manager tools)
A nuclease- and bisulfite-based strategy captures strand-specific R-loops genome-wide
eLife 10:e65146.
https://doi.org/10.7554/eLife.65146


