Regional sequencing collaboration reveals persistence of the T12 Vibrio cholerae O1 lineage in West Africa
- Nigeria Centre for Disease Control, Nigeria
- Centre Pasteur du Cameroun, Cameroon
- National Public Health Laboratory, Cameroon
- Centre de Recherche Médicale et Sanitaire, Niger
- Department of Pharmaceutical Microbiology, Faculty of Pharmacy, University of Ibadan, Nigeria
- Epicentre, France
- World Health Organization Nigeria, Nigeria
- Department of Epidemiology, Johns Hopkins Bloomberg School of Public Health, United States
Figures
Figure 1

Cholera cases and sequenced isolates.
(A) Weekly suspected cholera cases for Cameroon (orange), Niger (blue), and Nigeria (green) from 2010 through 2019 (‘Regional Cholera Platform in West and Central Africa,’ n.d.) (Figure 1—source data 1). Suspected cases are defined as recommended by the World Health Organization (Global Task Force on Cholera Control Surveillance Working Group, 2017). Red points: weeks with no more than five suspected cases reported across all three countries. Arrows: collection dates of isolates sequenced. Collection dates provided as year only (n=2) are plotted on January 1 of their given year. (B) Map of Cameroon, Niger, and Nigeria. Colors are as in (A). White points: location of sequenced isolates collected in 2018 and 2019 (Figure 1—source data 2). Black crosses: location of sequenced isolates collected prior to 2018. One isolate with unknown sub-country location is not shown.
-
Figure 1—source data 1
Case counts by epidemiological week in Niger, Nigeria, and Cameroon, 2010 to 2019.
- https://cdn.elifesciences.org/articles/65159/elife-65159-fig1-data1-v1.zip
-
Figure 1—source data 2
Sample metadata for isolates sequenced in this study.
- https://cdn.elifesciences.org/articles/65159/elife-65159-fig1-data2-v1.zip
Figure 2 with 2 supplements
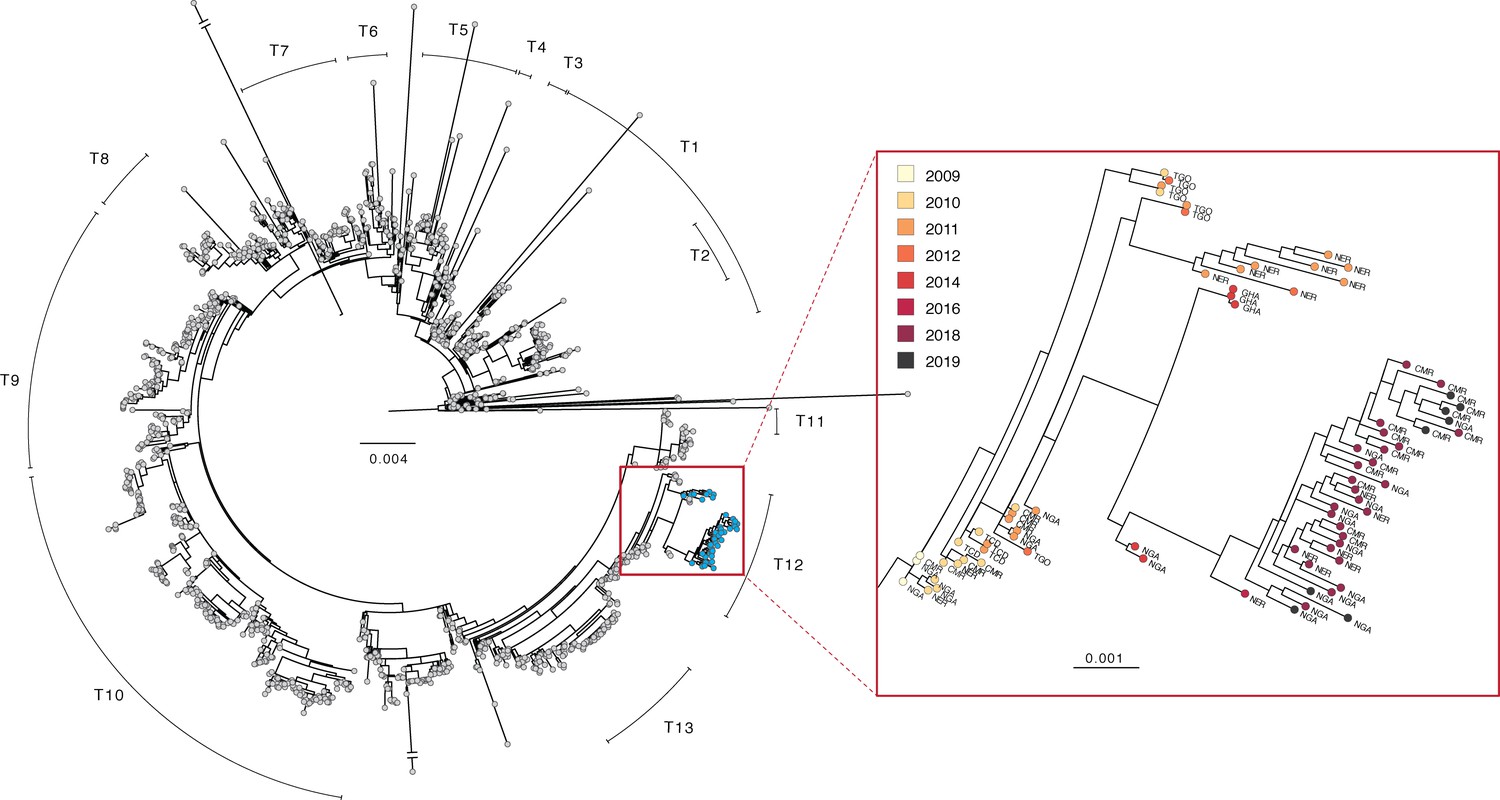
Phylogenetic tree of V. cholerae O1 sequences.
Left: maximum likelihood tree of global V. cholerae isolates. Samples generated in this study are shown in blue (see also, Figure 2—source data 1). Right: zoom view of a portion of the T12 lineage containing V. cholerae genomes generated in this study. Country codes: TGO, Togo; NER, Niger; GHA, Ghana; CMR, Cameroon; NGA, Nigeria; TCD, Chad. Scale bar unit: nucleotide substitutions per site.
-
Figure 2—source data 1
Table of sequencing metrics for V. cholerae O1 genomes.
- https://cdn.elifesciences.org/articles/65159/elife-65159-fig2-data1-v1.xlsx
-
Figure 2—source data 2
Summary table of published V. cholerae O1 genomes included in this study.
- https://cdn.elifesciences.org/articles/65159/elife-65159-fig2-data2-v1.xlsx
-
Figure 2—source data 3
Accession numbers, references, and basic metadata for sequences included in global phylogeny.
The majority of these data were compiled by Weill et al., and the majority of background sequences were originally published in Weill et al., 2017, Weill et al., 2017, Irenge et al., 2020, and Bwire et al., 2018, among others.
- https://cdn.elifesciences.org/articles/65159/elife-65159-fig2-data3-v1.zip
-
Figure 2—source data 4
Cases reported to the World Health Organization by decade, continent, and African subregion (where applicable), compiled from weekly epidemiological records (World Health Organization, 2019).
- https://cdn.elifesciences.org/articles/65159/elife-65159-fig2-data4-v1.zip
Figure 2—figure supplement 1
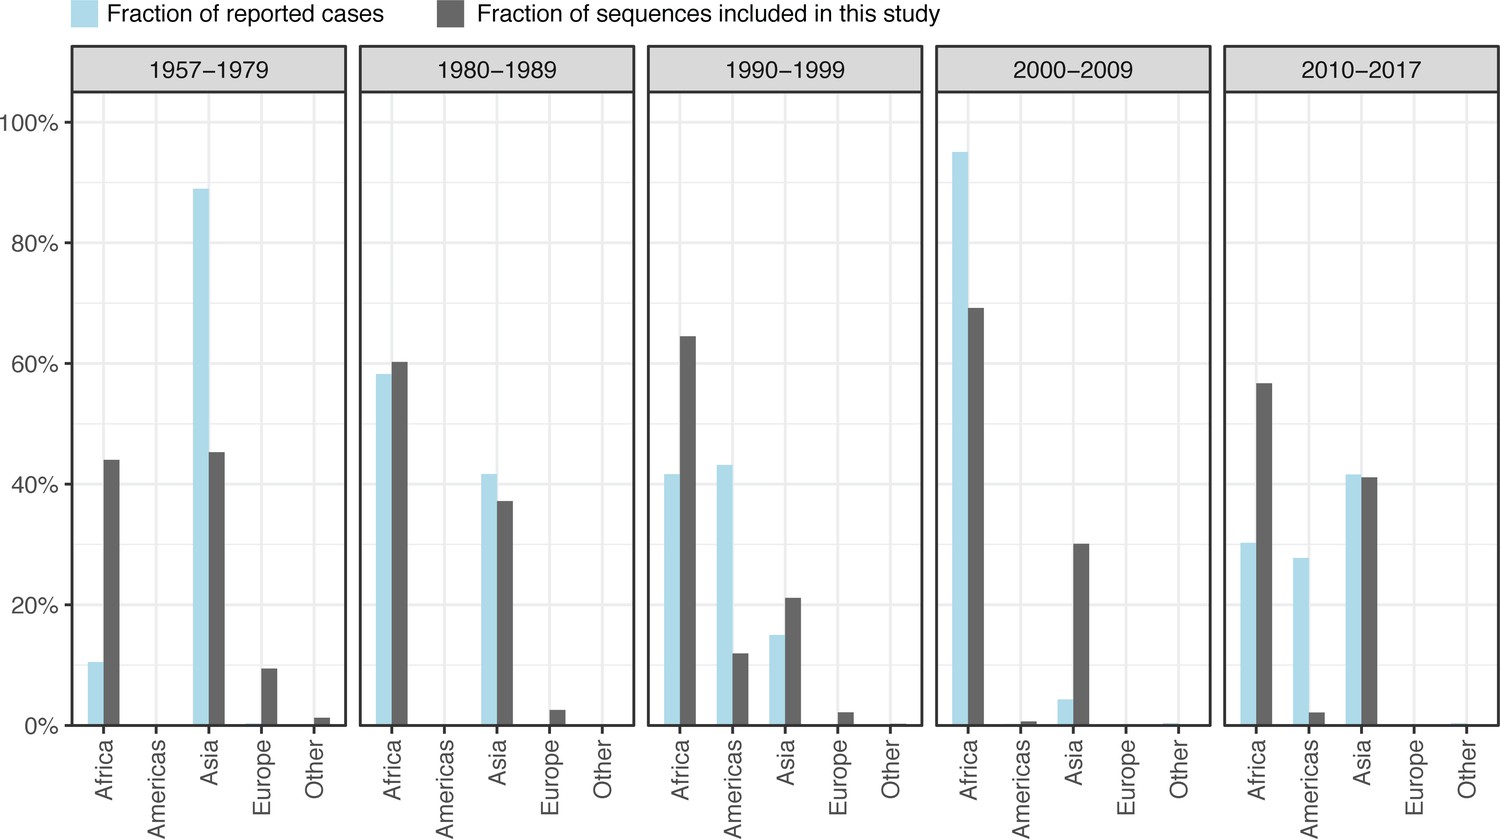
Proportion of reported cholera cases and V. cholerae sequences by continent.
For each decade, the proportion of cholera cases reported to the World Health Organization from each continent (blue bars) and proportion of V. cholerae sequences included in this study from each continent (gray bars).
Figure 2—figure supplement 2
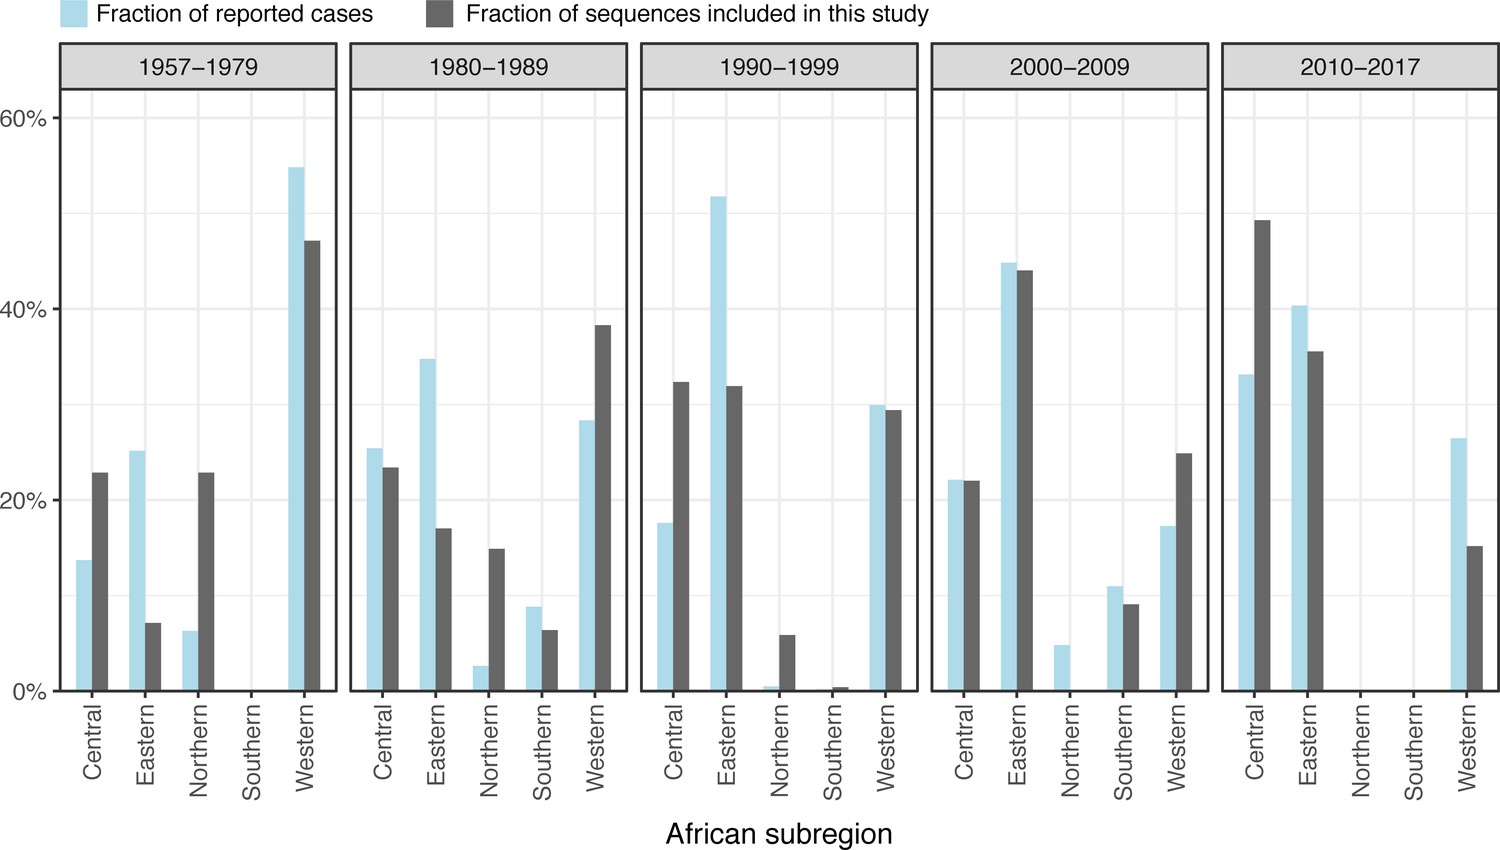
Proportion of reported cholera cases and V. cholerae sequences by African region.
For each decade, the proportion of cholera cases reported to the World Health Organization from each African subregion (blue bars) and proportion of V. cholerae sequences included in this study from each African subregion (gray bars).
Additional files
-
Source code 1
Code used to generate figures.
- https://cdn.elifesciences.org/articles/65159/elife-65159-code1-v1.zip
-
Supplementary file 1
Tabular results of antibiotic resistance testing and detection.
- https://cdn.elifesciences.org/articles/65159/elife-65159-supp1-v1.docx
-
Transparent reporting form
- https://cdn.elifesciences.org/articles/65159/elife-65159-transrepform-v1.docx
Download links
A two-part list of links to download the article, or parts of the article, in various formats.
Downloads (link to download the article as PDF)
Open citations (links to open the citations from this article in various online reference manager services)
Cite this article (links to download the citations from this article in formats compatible with various reference manager tools)
Regional sequencing collaboration reveals persistence of the T12 Vibrio cholerae O1 lineage in West Africa
eLife 10:e65159.
https://doi.org/10.7554/eLife.65159


