CM1-driven assembly and activation of yeast γ-tubulin small complex underlies microtubule nucleation
- Department of Biochemistry and Biophysics, University of California at San Francisco, United States
- Department of Biochemistry, University of Washington, United States
- Department of Bioengineering and Therapeutic Sciences, University of California at San Francisco, United States
- Department of Genome Sciences, University of Washington, United States
Figures
Figure 1
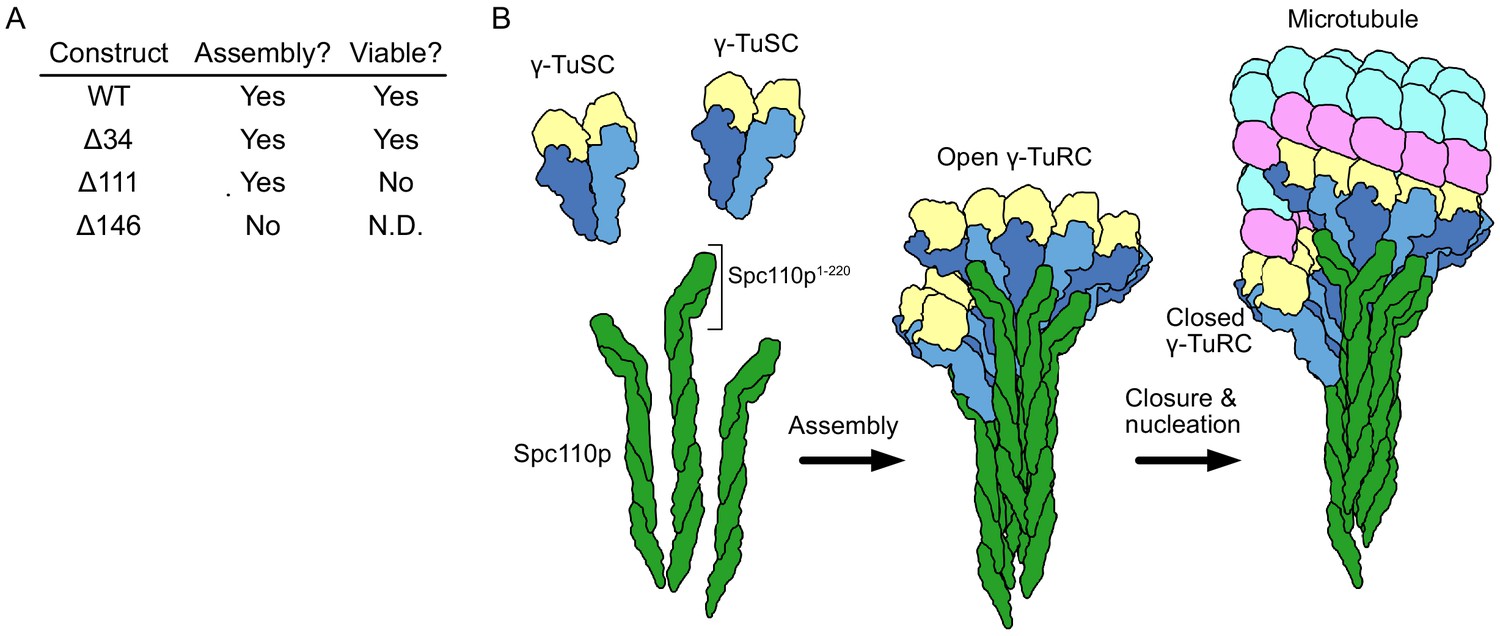
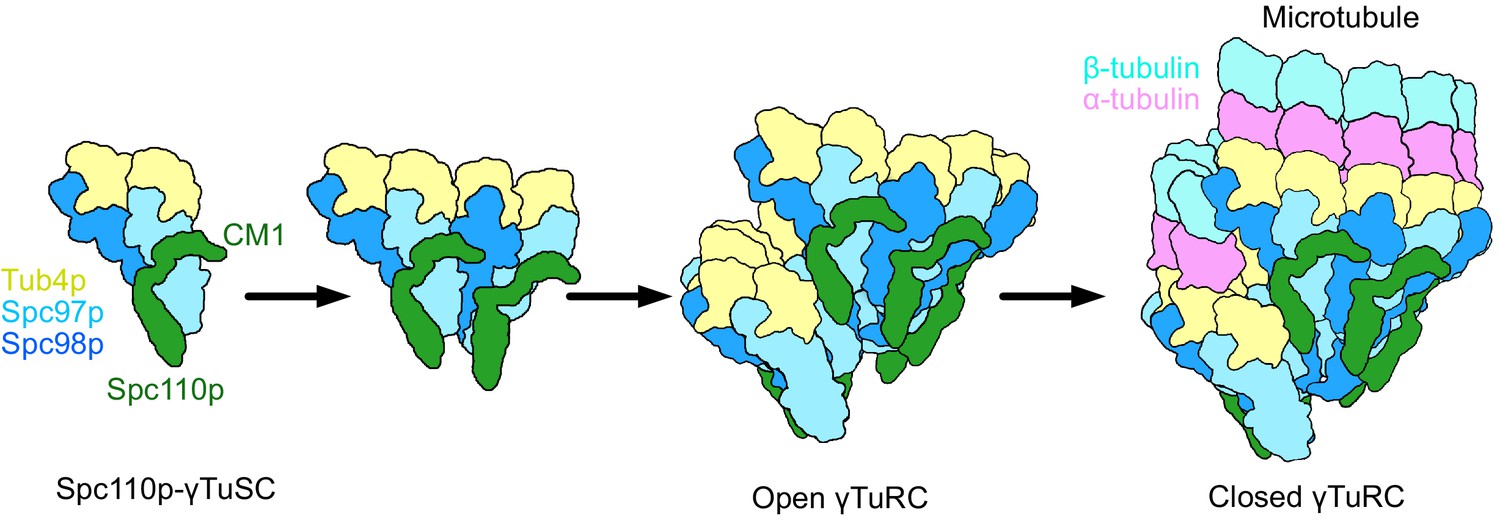
Spc110p and γ-tubulin small complexes (γTuSCs) assemble to form γ-tubulin ring complexes (γTuRCs) prior to microtubule nucleation.
(A) An overview of the effect of Spc110p deletions on assembly and viability, summarizing previously published data from Lyon et al., 2016. Assembly data was generated using Spc110p-GCN4 tetramer fusion constructions, while in vivo data used full-length proteins in a red-white plasmid shuffle assay. (B) Schematic overview of γTuRC assembly: monomeric γTuSCs bind to Spc110p1-220 and assemble into an open γTuRC, which undergoes closure prior to or concurrent with microtubule nucleation.
Figure 2 with 4 supplements
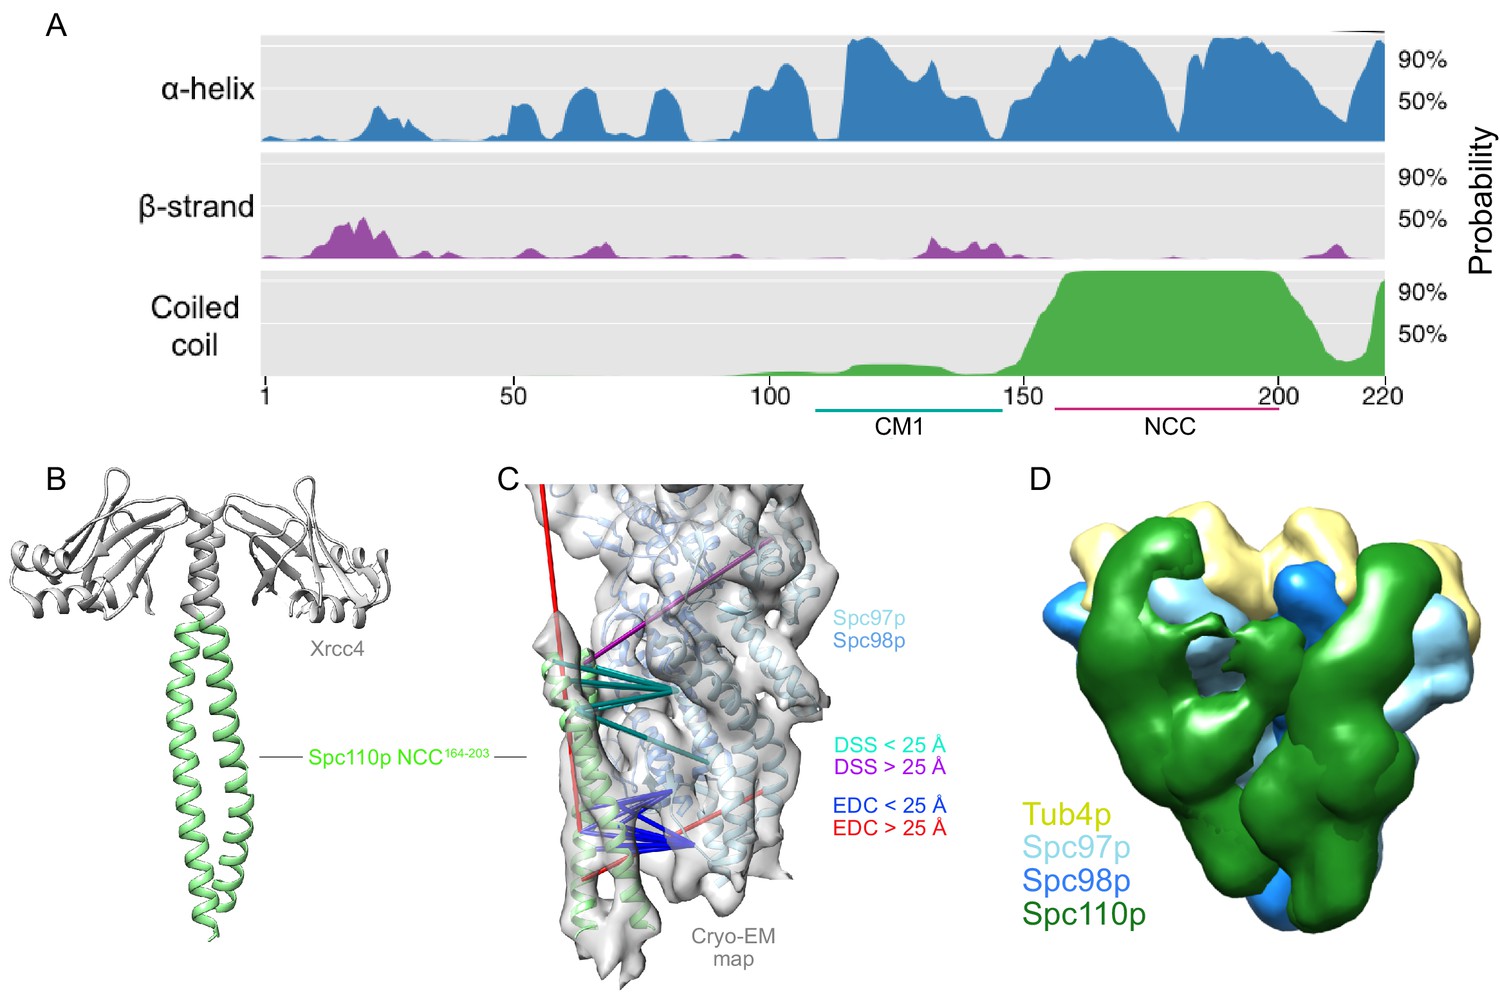
The Spc110pNCC binds near the N-terminus of Spc97p.
(A) Spc110p N-terminal region secondary structure prediction, showing lack of predicted secondary structure for the first 111 residues. Also shown are Spc110pCM1(117-146) and the Spc110pNCC(164-208) regions. (B) Structure of Xrcc4-Spc110p164-207, where Spc110pNCC residues 164–203 are resolved. (C) Spc110pNCC structure fit into γ-tubulin ring complex (γTuRC) cryo-EM density map (gray surface, EMDB ID 2799) along with γ-tubulin small complex (γTuSC) pseudo-atomic model (PDB ID 5FLZ) (Kollman et al., 2015; Greenberg et al., 2016). The majority of crosslinking mass spectrometry (XL-MS) distance restraints are satisfied by this model. Satisfied and violated disuccinimidyl suberate (DSS) crosslinks are shown in cyan and purple, respectively. Satisfied and violated 1-ethyl-3-(3-dimethylaminopropyl)carbodiimide (EDC) crosslinks are shown in blue and red, respectively. Crosslinks that are satisfied by either Spc110p monomer are shown twice, one for each monomer. (D) Localization density map for the ensemble of integrative models consisting of two adjacent γTuSCs, each bound to an Spc110p1-220 dimer. The map shows the positions of different parts of the complex in the ensemble of models from the top cluster; maps for all components are contoured at 2.5% of their respective maximum voxel values. The modeling results shown are based on the γTuSC-Spc110p1-220-GCN4 crosslinks; similar results were obtained using γTuSC-Spc110p1-401-GST crosslinks (see Appendix 1).
Figure 2—figure supplement 1
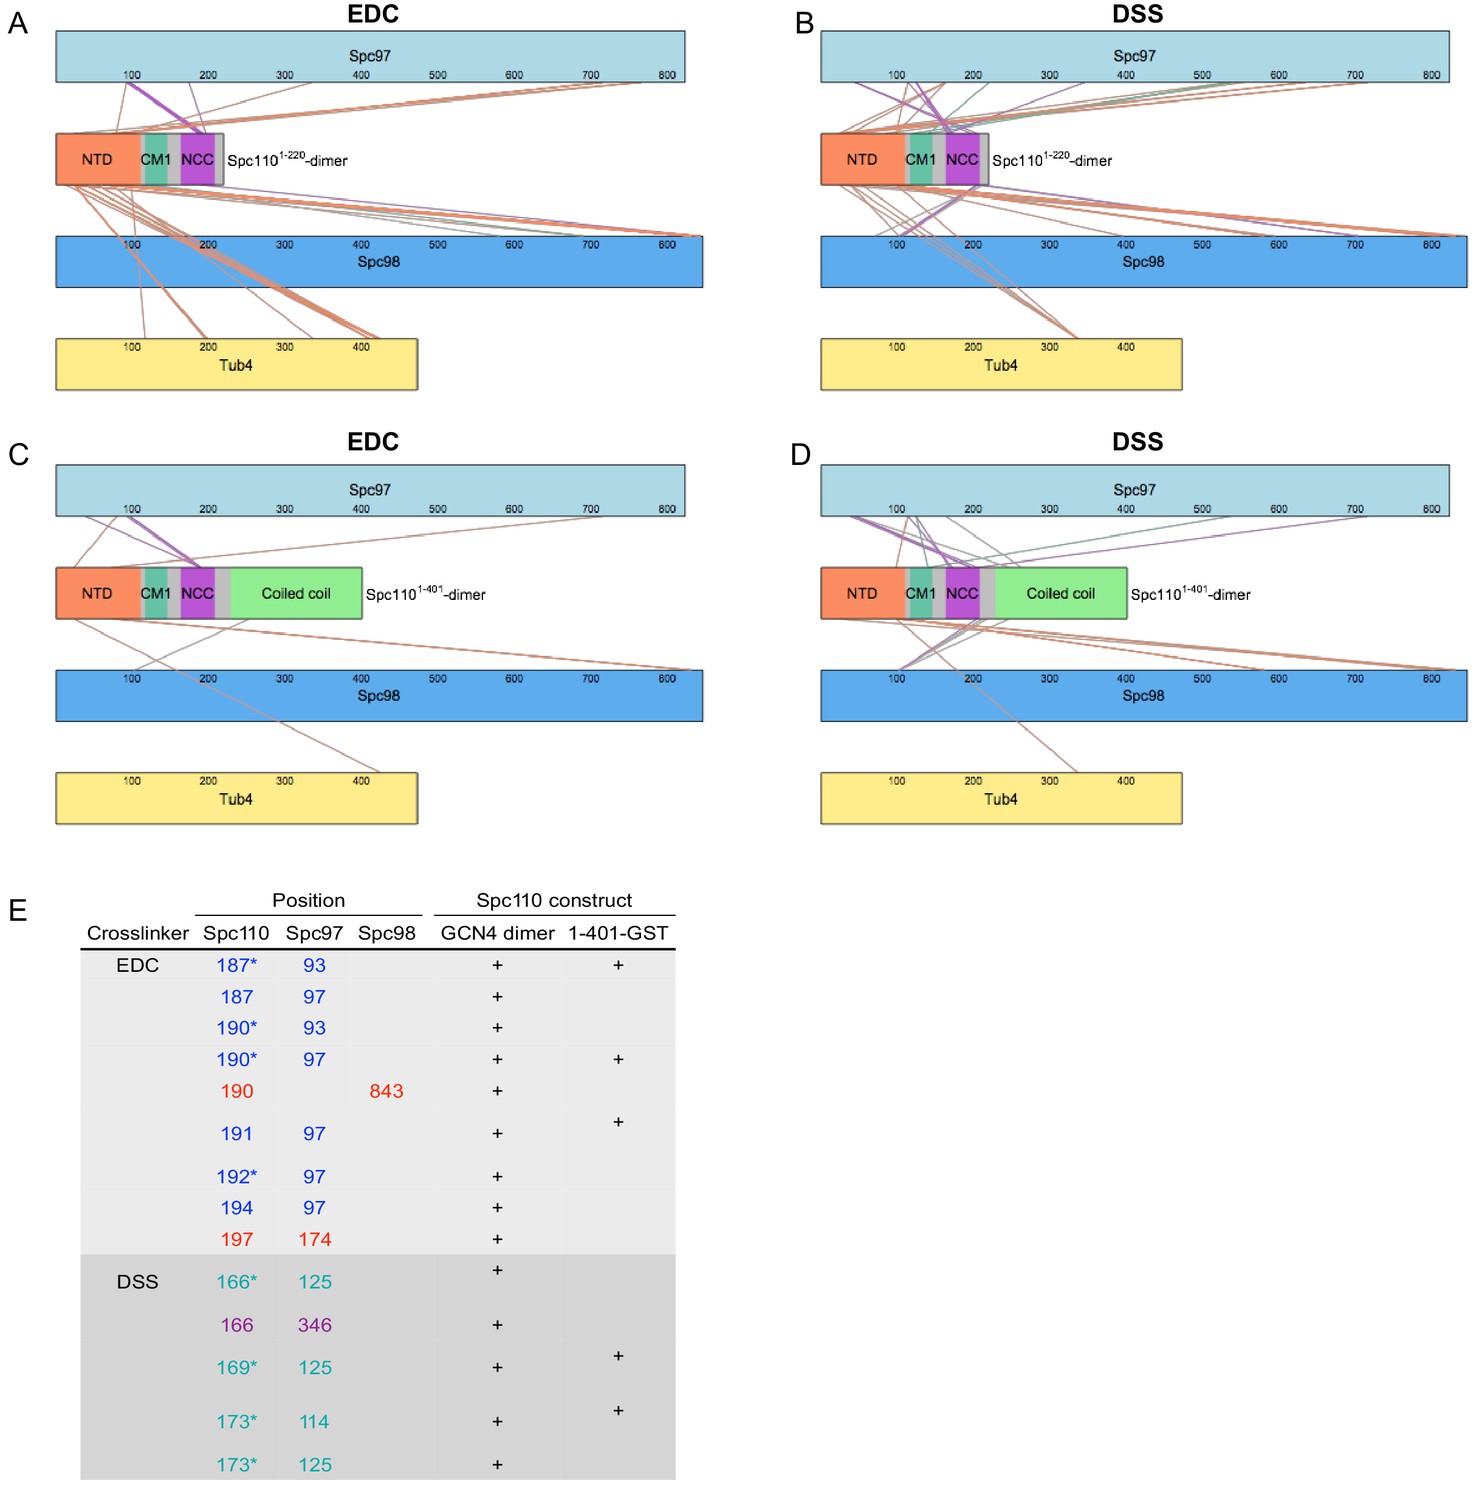
Overview of crosslinking mass spectrometry (XL-MS) datasets.
XL-MS datasets for γ-tubulin small complex (γTuSC) crosslinked to Spc110p1-220-GCN4 dimer (A, B) or Spc110p1-401-GST (C, D) with either EDC (A, C) or DSS (B, D). Each colored rectangle represents a protein in the crosslinked sample. The lengths of the rectangles are proportional to the number of residues in each protein. Crosslinks between γTuSC components and Spc110p1-111, Spc110pCM1(117-146), and Spc110pNCC (164-208) regions are color coded orange, green, and purple, respectively. (E) Table of crosslinks between Spc110pNCC(164-208) and γTuSC. Spc110p crosslinks marked with an asterisk are satisfied on either monomer within Spc110pNCC(164-208).
Figure 2—figure supplement 2
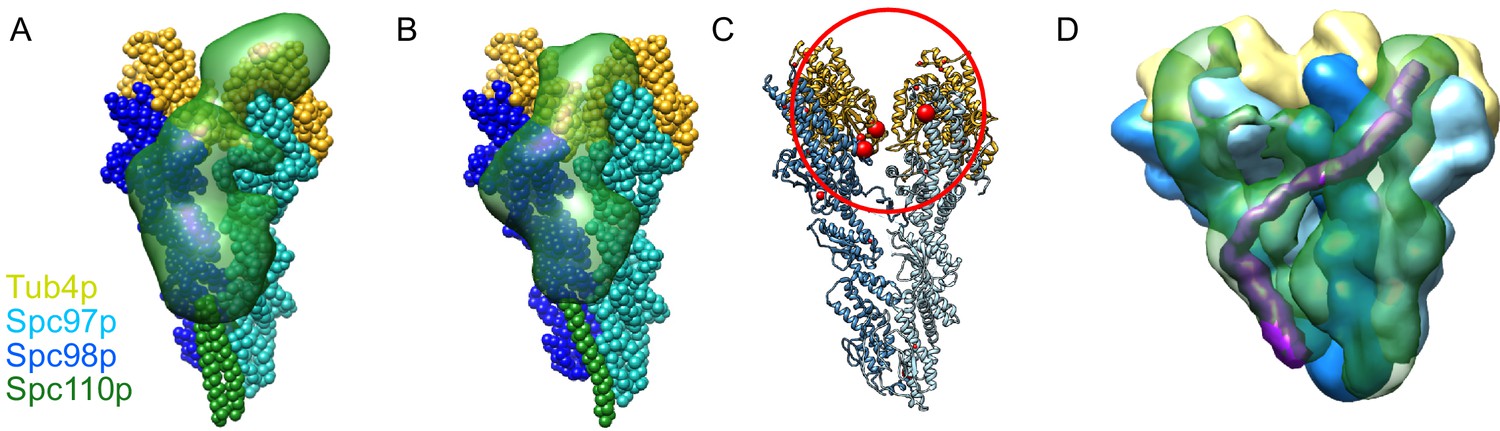
Results of integrative modeling of the Spc110p-γ-tubulin small complex (γTuSC) complex.
The modeling results shown are based on the γTuSC-Spc110p1-220 GCN4 crosslinks; similar results were obtained in all cases using γTuSC-Spc110p1-401-GST crosslinks (see Appendix 1). (A) Monomer of Spc110p1-220-GCN4 bound to γTuSC. γTuSC and Spc110p NCC, which were kept fixed in the modeling, are shown as spherical beads with one bead per residue. Spc110p1-163 is shown as a localization density map, showing the positions of the Spc110p N-terminal domain (NTD) in the ensemble of models from the top cluster. (B) Dimer of Spc110p1-220-GCN4 bound to γTuSC, with a representation similar to (A). (C) A γTuSC monomer with EDC and DSS crosslinks from the NTD (residues 3–113) of the Spc110p1-220-GCN4 dimer construct mapped onto it (note that residues 3–113 in this construct correspond to residues 1–111 in Spc110). Each red sphere represents a residue in TuSC where the Spc110p1-111 crosslinks. The size of the red sphere indicates the number of residues in Spc110p1-111 that crosslink there. The smallest sphere indicates one residue from Spc110p1-111 crosslinks to that γTuSC residue; the largest spheres show where four or more residues from Spc110p1-111 crosslink. The red circle highlights a cluster of crosslink sites between Spc110p1-111 and Spc97p or Spc98p at the intra-γTuSC interface. (D) Dimer of Spc110p1-220-GCN4 bound to adjacent γTuSCs, shown as a localization density map, similar to Figure 1D. Maps for all components are contoured at 2.5% of their respective maximum voxel values. We highlight in purple a hypothetical path integrating our modeling and structural work showing how Spc110p bridges the inter-γTuSC interface and reaches to the adjacent γTuSC where it crosslinks to the N-terminal regions of Spc97p and Spc98p at the intra-γTuSC interface.
Figure 2—figure supplement 3
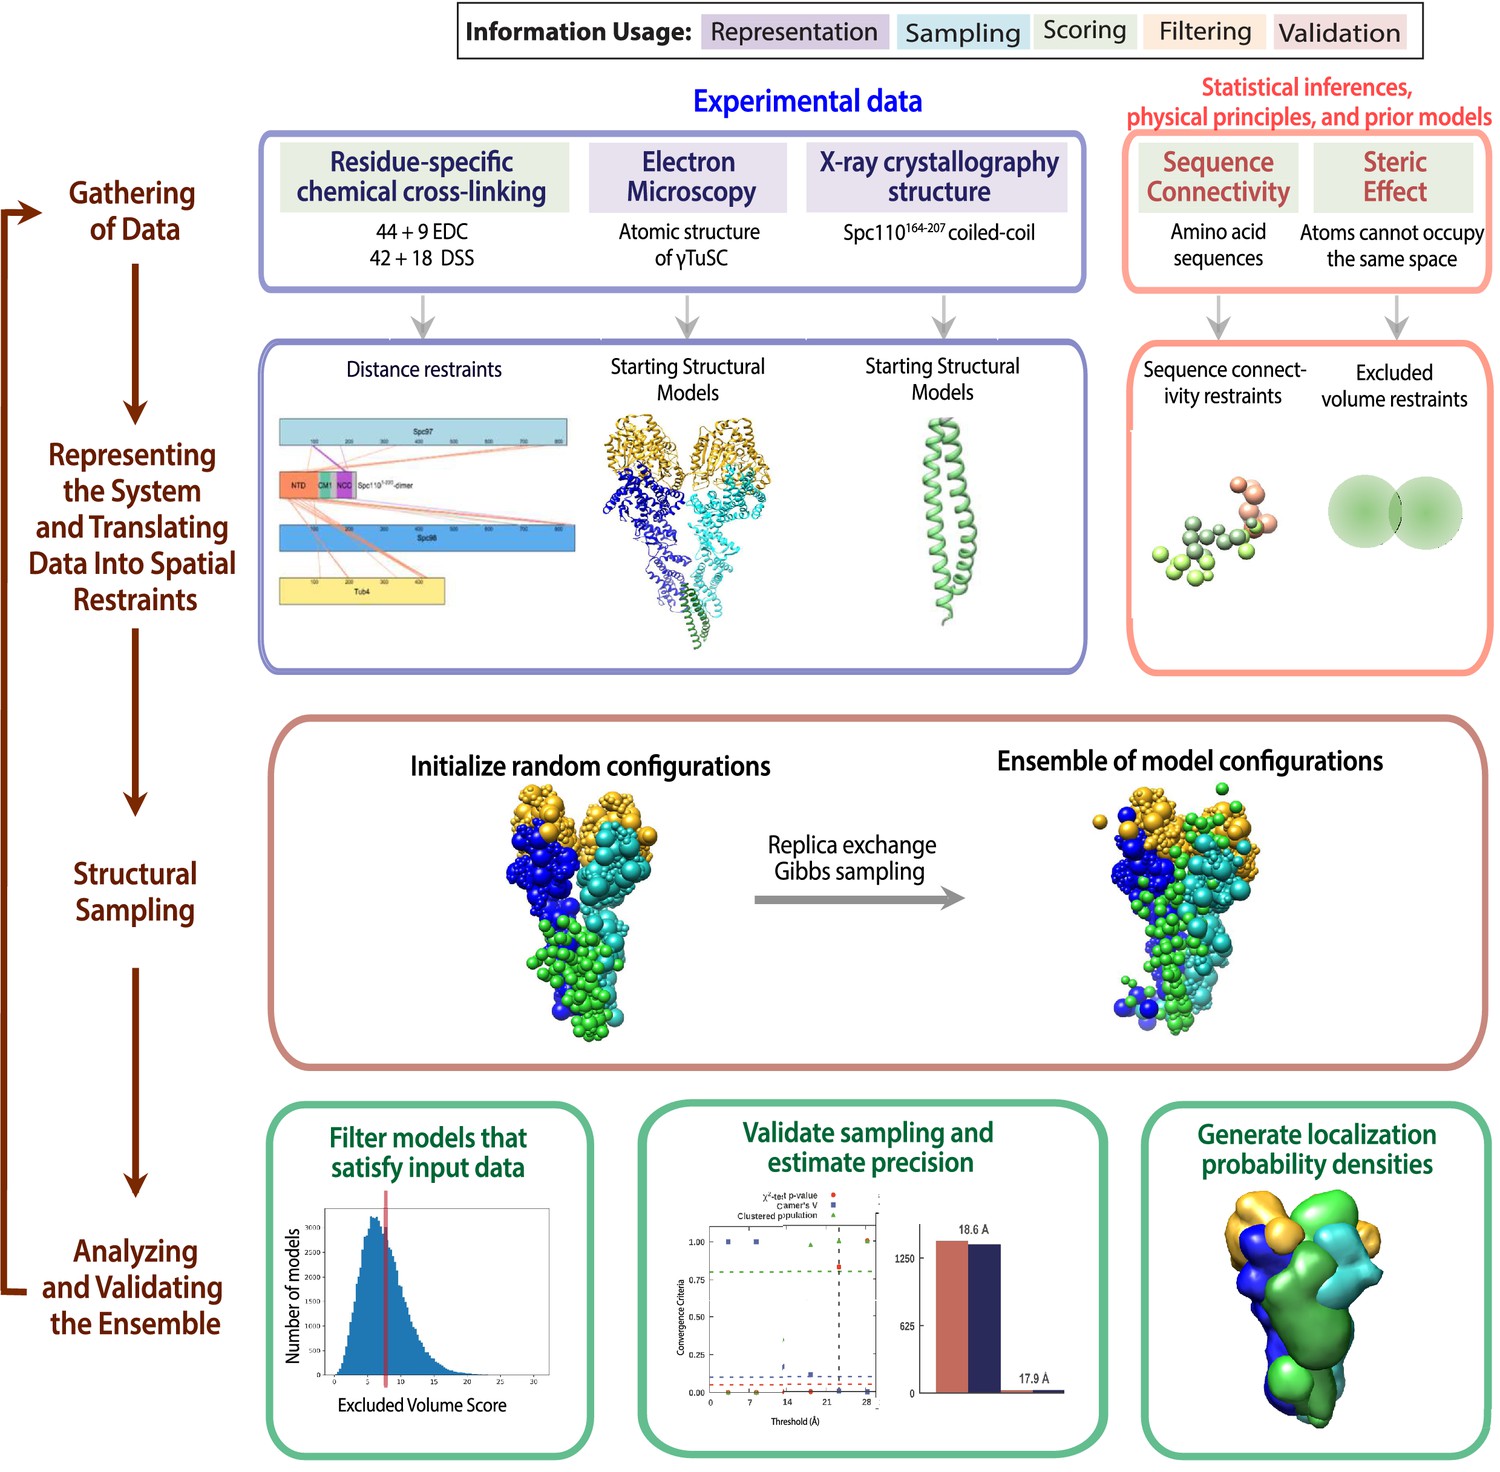
The four stages of integrative modeling of the Spc110-γ-tubulin small complex (γTuSC) complex.
This schematic describes the integrative structure modeling procedures used in this paper. The first row details the information to be used in modeling. The background color of each information source indicates where the information is applied in modeling, as detailed in the key at the top. The second row describes how each information source is converted into spatial restraints. The third row details the sampling protocol. The last row details the analysis and validation steps of the modeling.
Figure 2—figure supplement 4
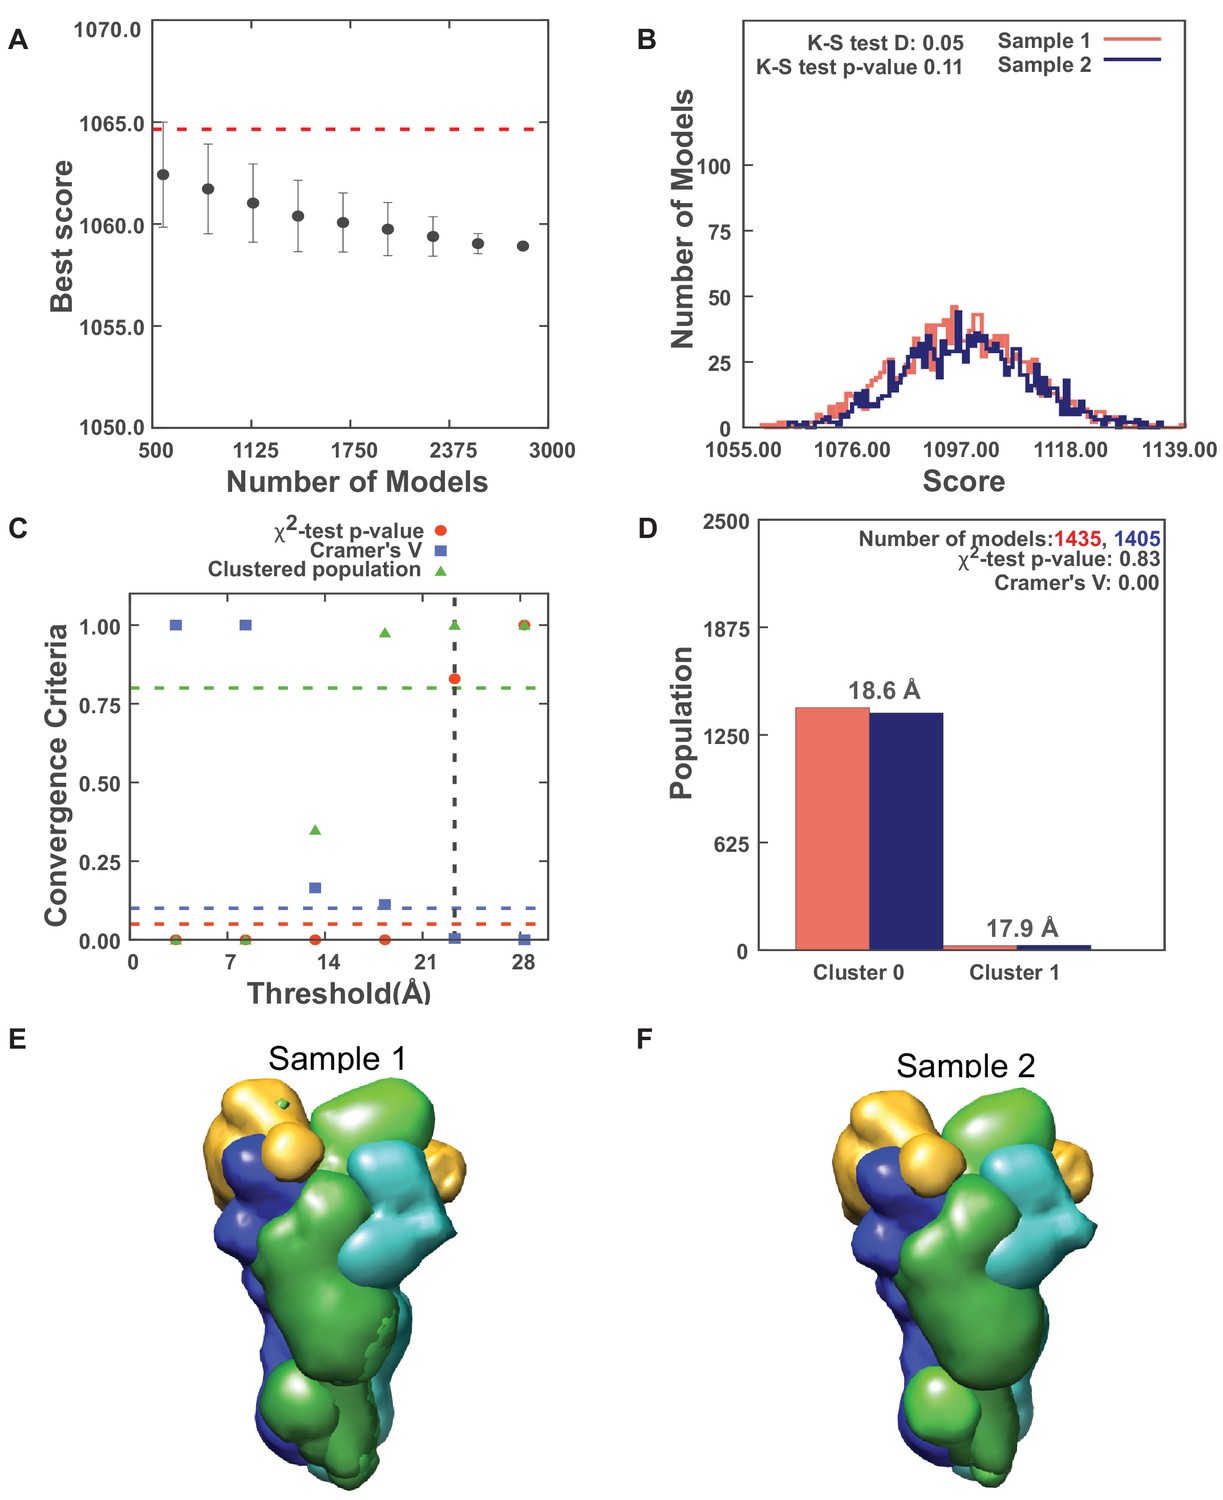
Results for sampling exhaustiveness protocol for modeling the complex of Spc110p1-220-GCN4 dimer with γ-tubulin small complex (γTuSC).
(A) Results of test 1, convergence of the model score, for the 2840 good-scoring models; the scores do not continue to improve as more models are computed essentially independently. The error bar represents the standard deviations of the best scores, estimated by repeating sampling of models 10 times. The red dotted line indicates a lower bound reference on the total score. (B) Results of test 2, testing similarity of model score distributions between samples 1 (red) and 2 (blue); the difference in distribution of scores is not significant (Kolmogorov–Smirnov two-sample test p-value >0.05) and the magnitude of the difference is small (the Kolmogorov–Smirnov two-sample test statistic D is 0.05); thus, the two score distributions are effectively equal. (C) Results of test 3, three criteria for determining the sampling precision (Y-axis), evaluated as a function of the root-mean-square deviation (RMSD) clustering threshold (X-axis). First, the p-value is computed using the χ2-test for homogeneity of proportions (red dots). Second, an effect size for the χ2-test is quantified by the Cramer’s V value (blue squares). Third, the population of models in sufficiently large clusters (containing at least 10 models from each sample) is shown as green triangles. The vertical dotted gray line indicates the RMSD clustering threshold at which three conditions are satisfied (p-value>0.05 [dotted red line], Cramer’s V < 0.10 [dotted blue line], and the population of clustered models > 0.80 [dotted green line]), thus defining the sampling precision of 23.3 Å. (D) Populations of sample 1 and 2 models in the clusters obtained by threshold-based clustering using the RMSD threshold of 23.3 Å. Cluster precision is shown for each cluster. (E, F) Results of test 4: comparison of localization probability densities of models from sample As and B for the major cluster (98.1% population). The cross-correlation of the density maps of the two samples is 0.99 for the Spc110 maps (green).
Figure 3 with 5 supplements
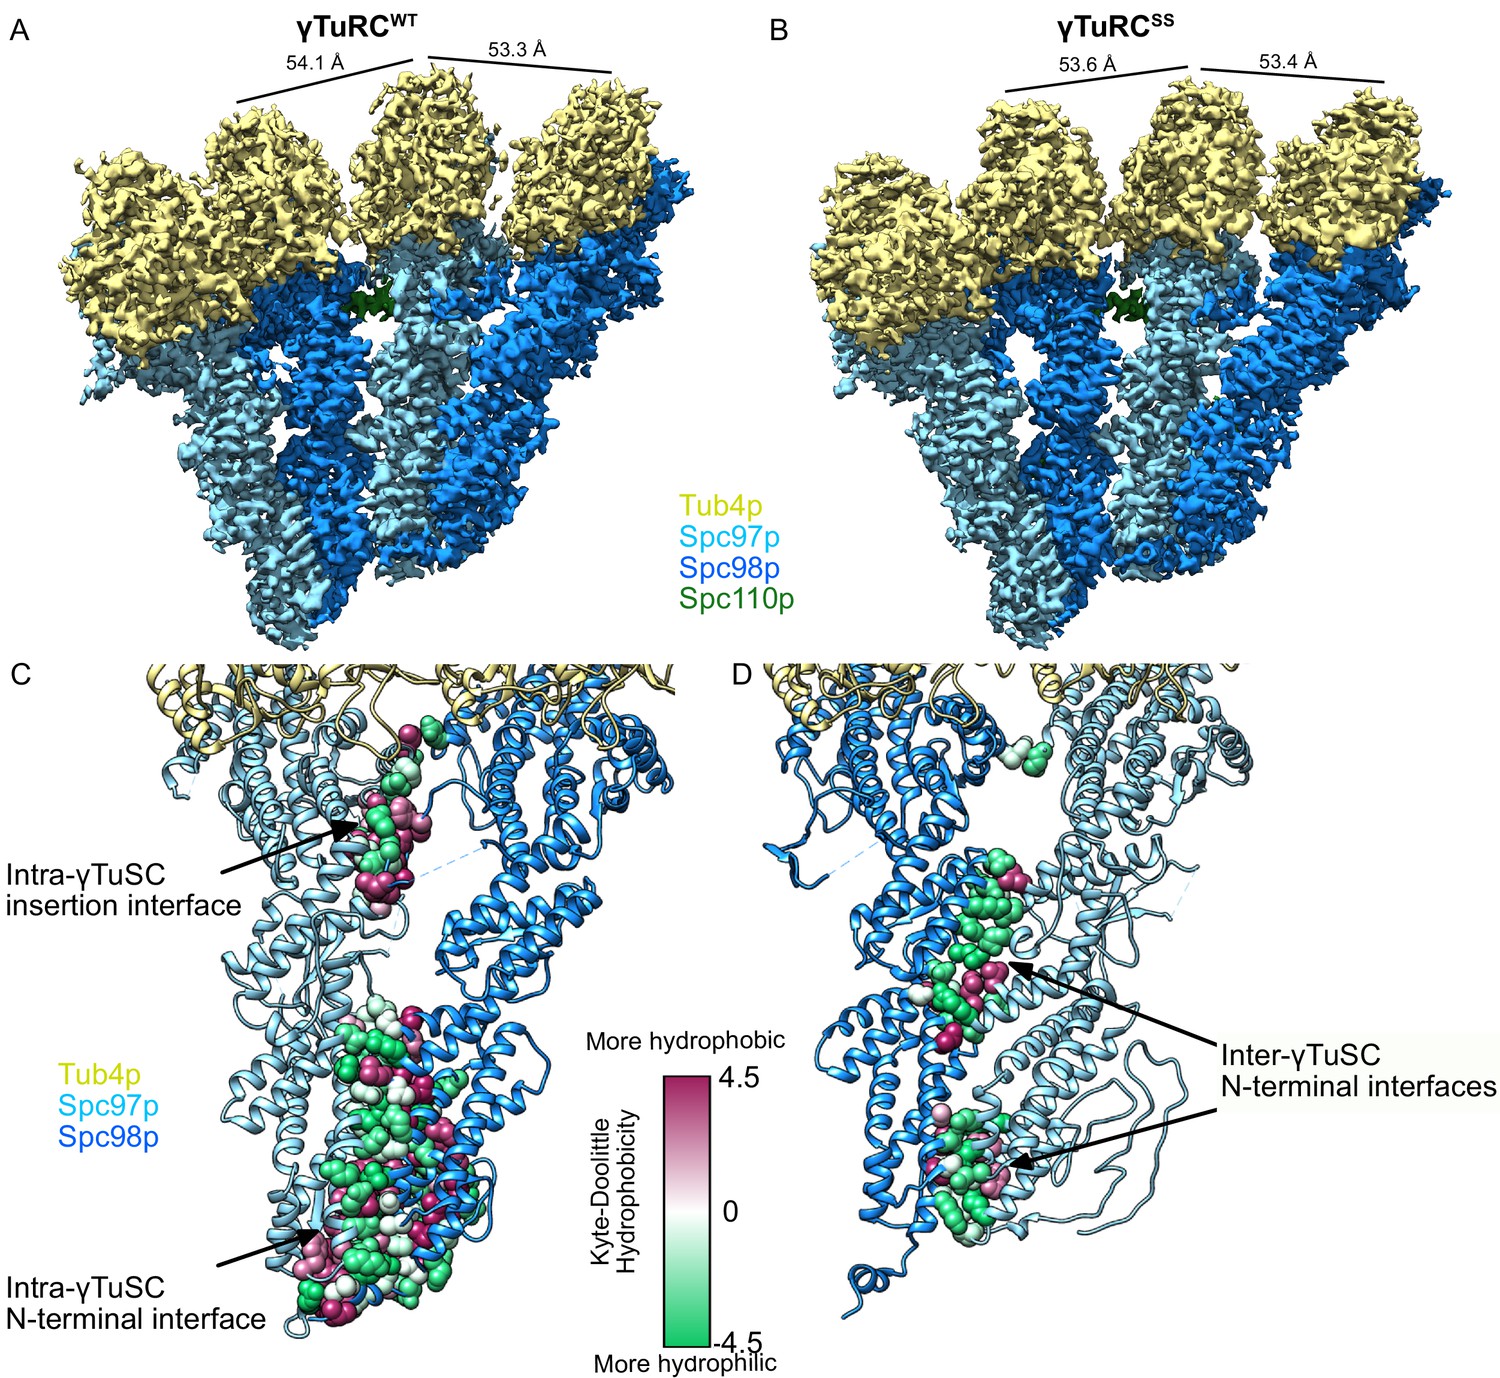
Structure and assembly interfaces of γTuRCWT and γTuRCSS.
(A, B) Segmented density of (A) open γTuRCWT and (B) closed γTuRCSS. γTuRC subunits are colored as in the figure inset. Density was segmented within 4.5 Å of the atomic model, showing one Spc110p copy. Disconnected density smaller than 5 Å was hidden using the ‘Hide Dust’ command in Chimera. Spc110pNCC is not visible at this threshold due to heterogeneity. (C, D) Representation of the intra- (C) and inter-γTuSC (D) interfaces of Spc97p/98p illustrated on a γTuRCSS dimer. Interface atoms are shown as spheres and colored by their hydrophobicity according to the Kyte–Doolittle scale. γTuRC: γ-tubulin ring complex; γTuSC: γ-tubulin small complex.
Figure 3—figure supplement 1
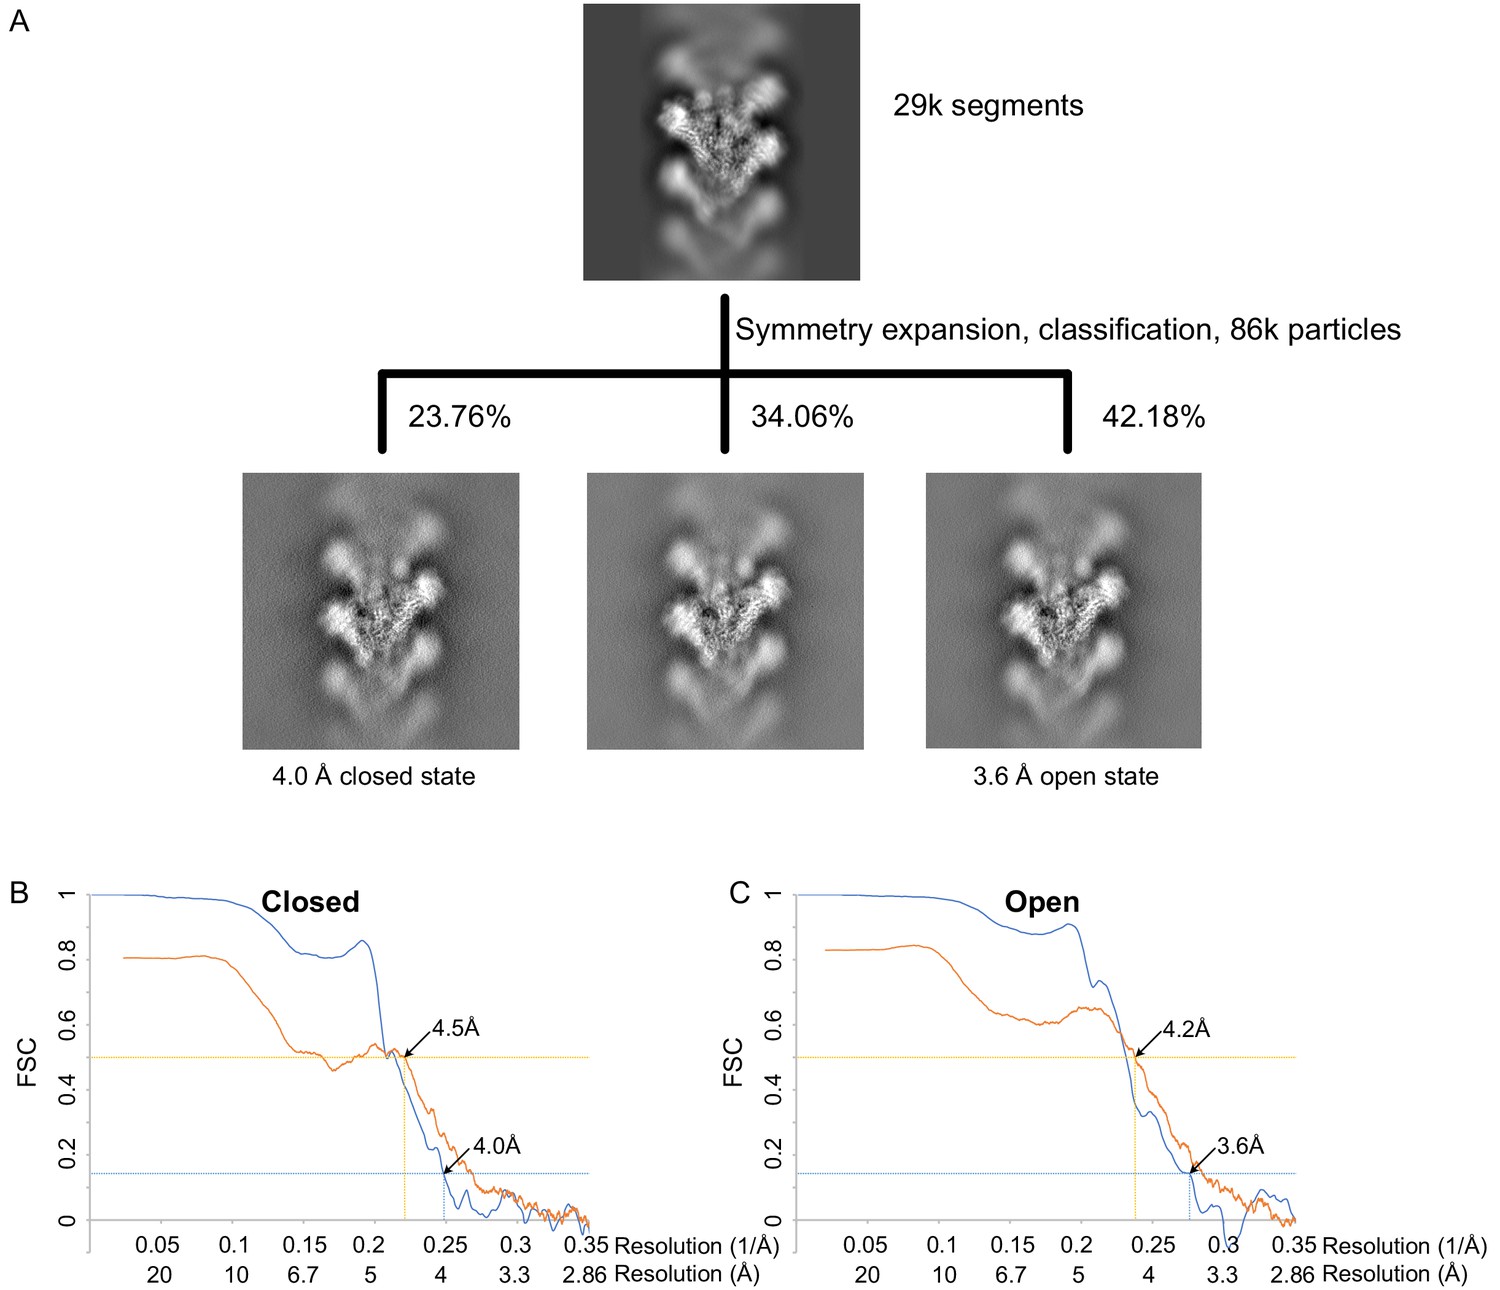
γTuRCWT processing and resolution.
(A) Classification scheme for γTuRCWT processing. Images are projection images of the 3D classes obtained. (B) Fourier shell correlation FSC (blue) and map to model FSC (orange) for the closed γTuRCWT. (C) FSC (blue) and map to model FSC (orange) for the open γTuRCWT. γTuRC: γ-tubulin ring complex.
Figure 3—figure supplement 2
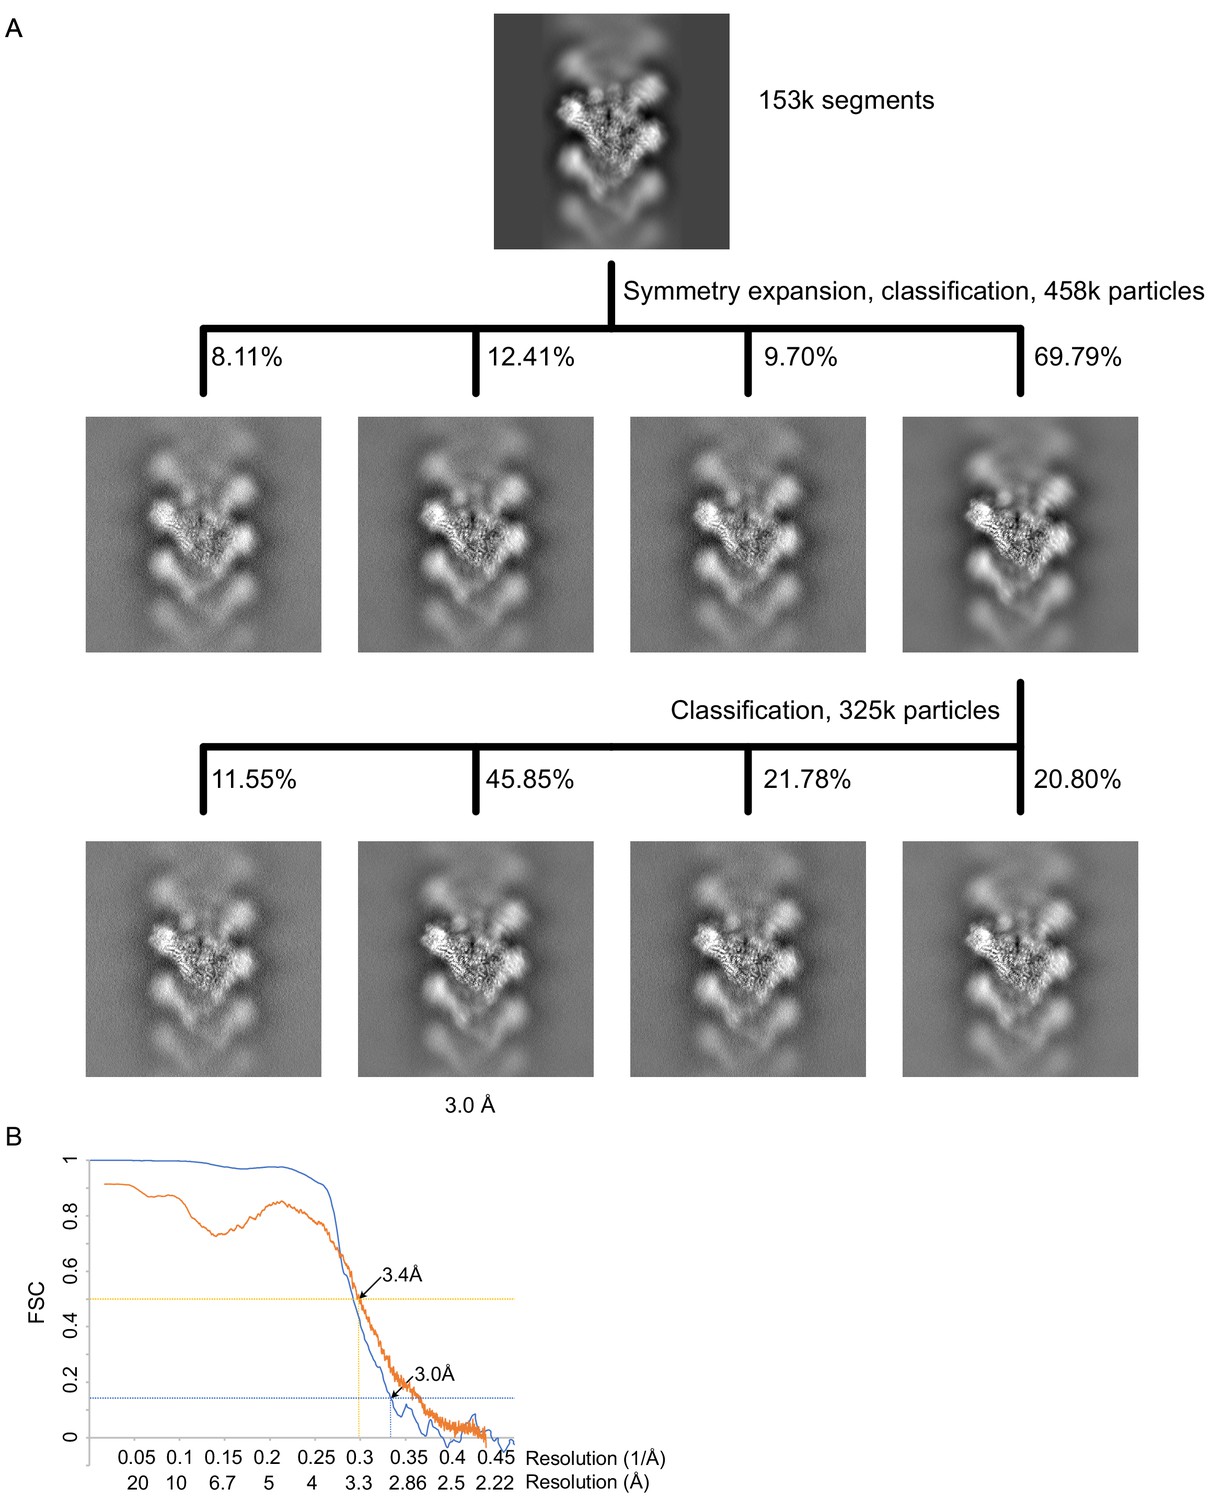
γTuRCSS processing and resolution.
(A) Classification scheme for γTuRCSS processing. Images are projection images of the 3D classes obtained. (B) FSC (blue) and map to model FSC (orange) for the γTuRCSS. γTuRC: γ-tubulin ring complex.
Figure 3—figure supplement 3
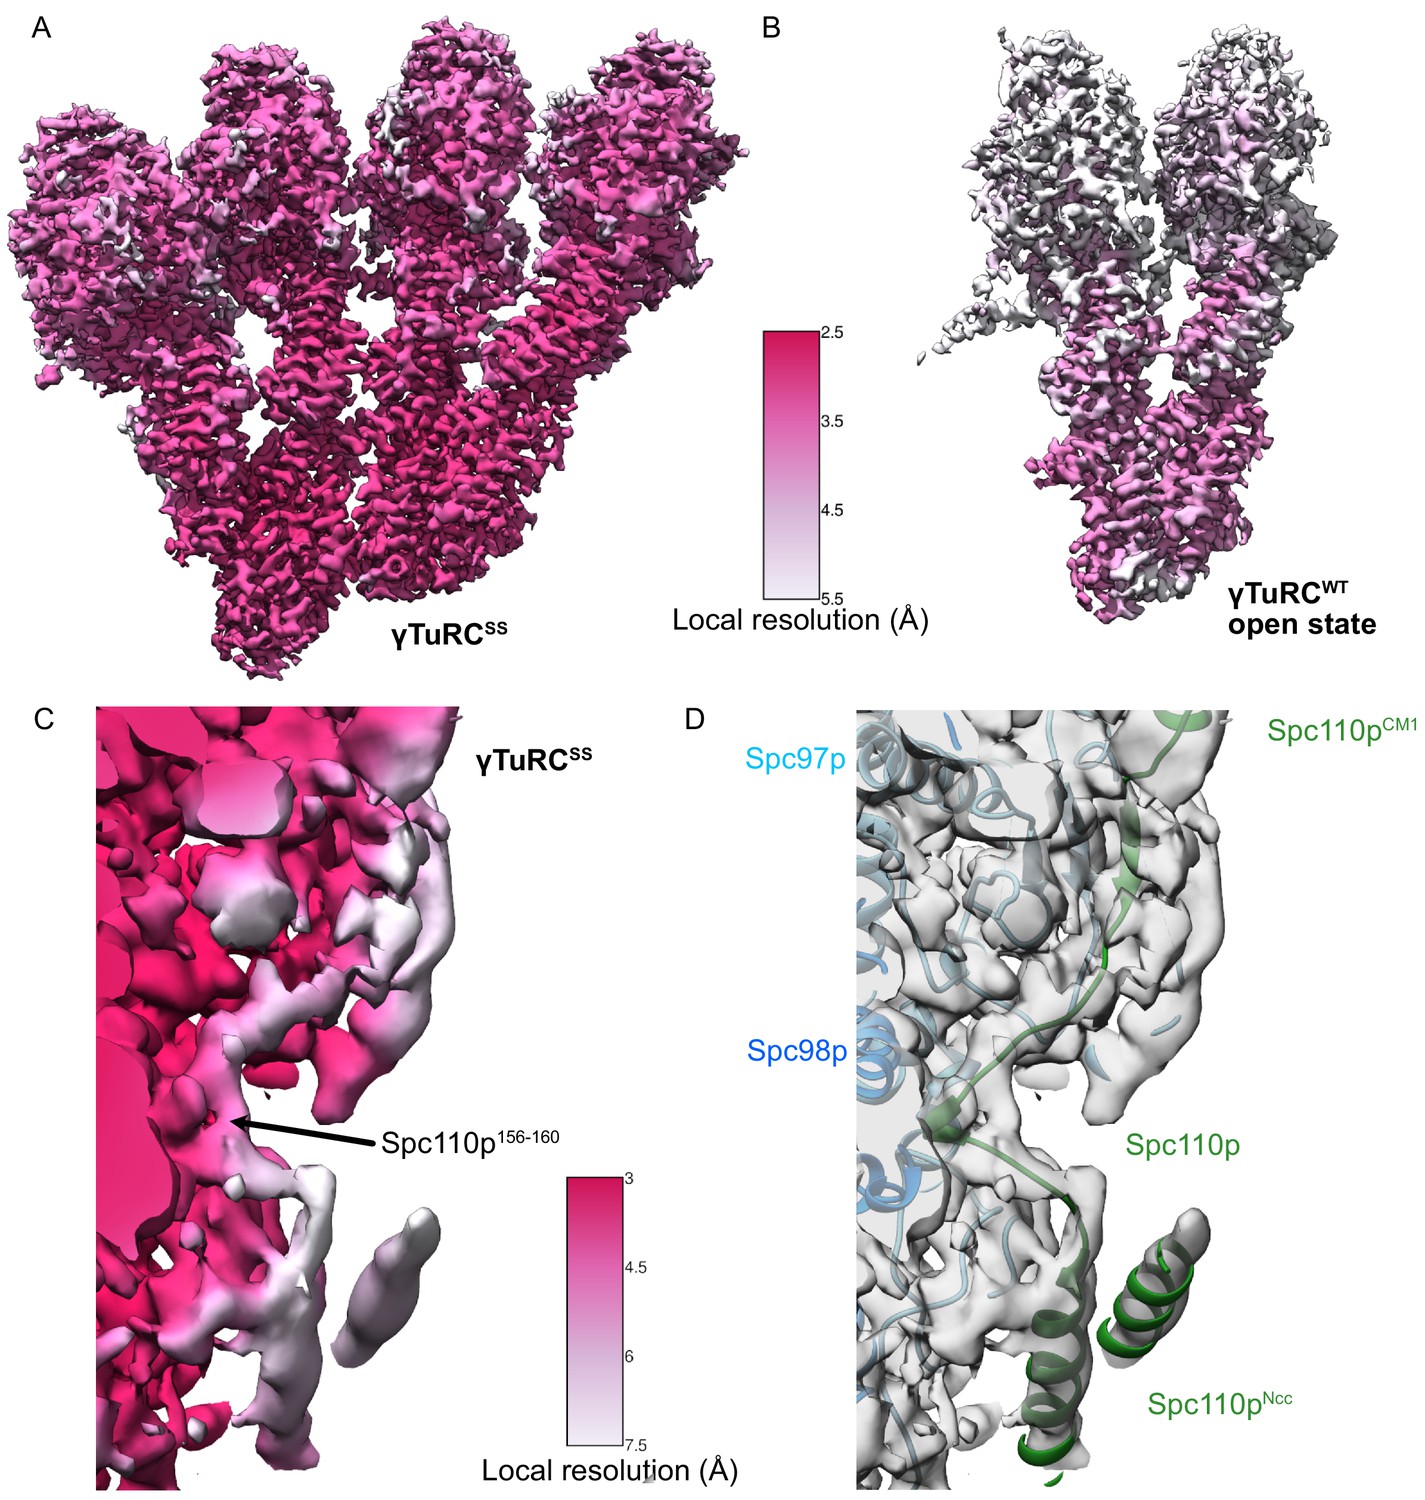
γTuRCSS and γTuRCWT local resolution maps.
(A) γTuRCSS local resolution map. The color scale is shown between panels (A) and (B). (B) γTuRCWT local resolution map. The color scale is shown between panels (A) and (B). (C) Local resolution map highlighting the region spanning the Spc110pCM1 and Spc110pNCC regions of the γTuRCSS reconstruction. The color scale is shown between panels (C) and (D). The density was filtered using local resolution filtering in SPoC (https://github.com/MaximilianBeckers/SPOC; Beckers and Sachse, 2020), using the local resolutions calculated from BlocRes (see Materials and methods). Although the density connecting the Spc110pCM1 helix with Spc110pNCC is at a lower resolution, we used a short region of higher resolution for Spc110p156-160 and the constraints of the Spc110pNCC and the Spc110p112-150 regions to buildthe connecting loops for Spc110p161-165 and Spc110p150-155 into the lower resolution density. (D) View identical to panel (C) showing transparent density and atomic models rendered as ribbons. Colors are as indicated by inset text.
Figure 3—figure supplement 4
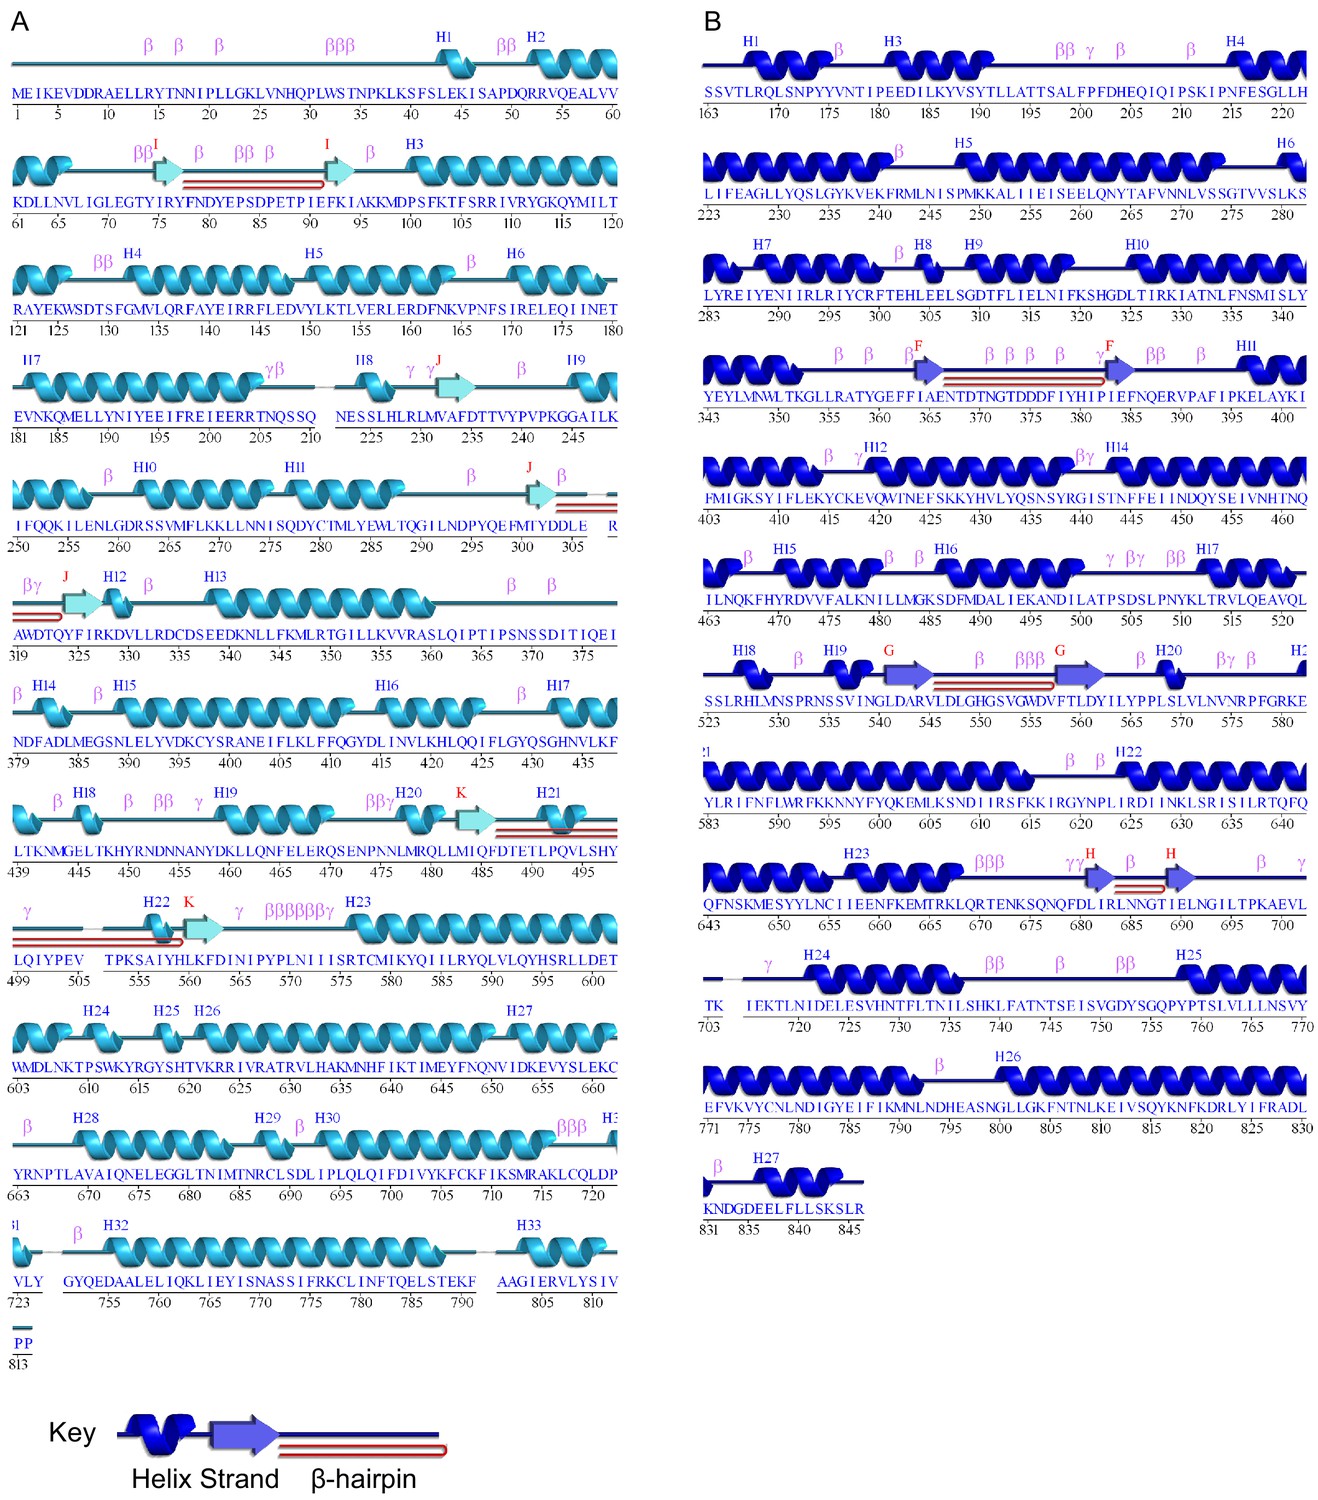
Wiring diagrams of (A) Spc97p and (B) Spc98p.
Helices are numbered from 1, whereas sheets are labeled from (A). Turns are labeled by type. Plots were generated using the pdbsum server (Laskowski, 2009).
Figure 3—figure supplement 5
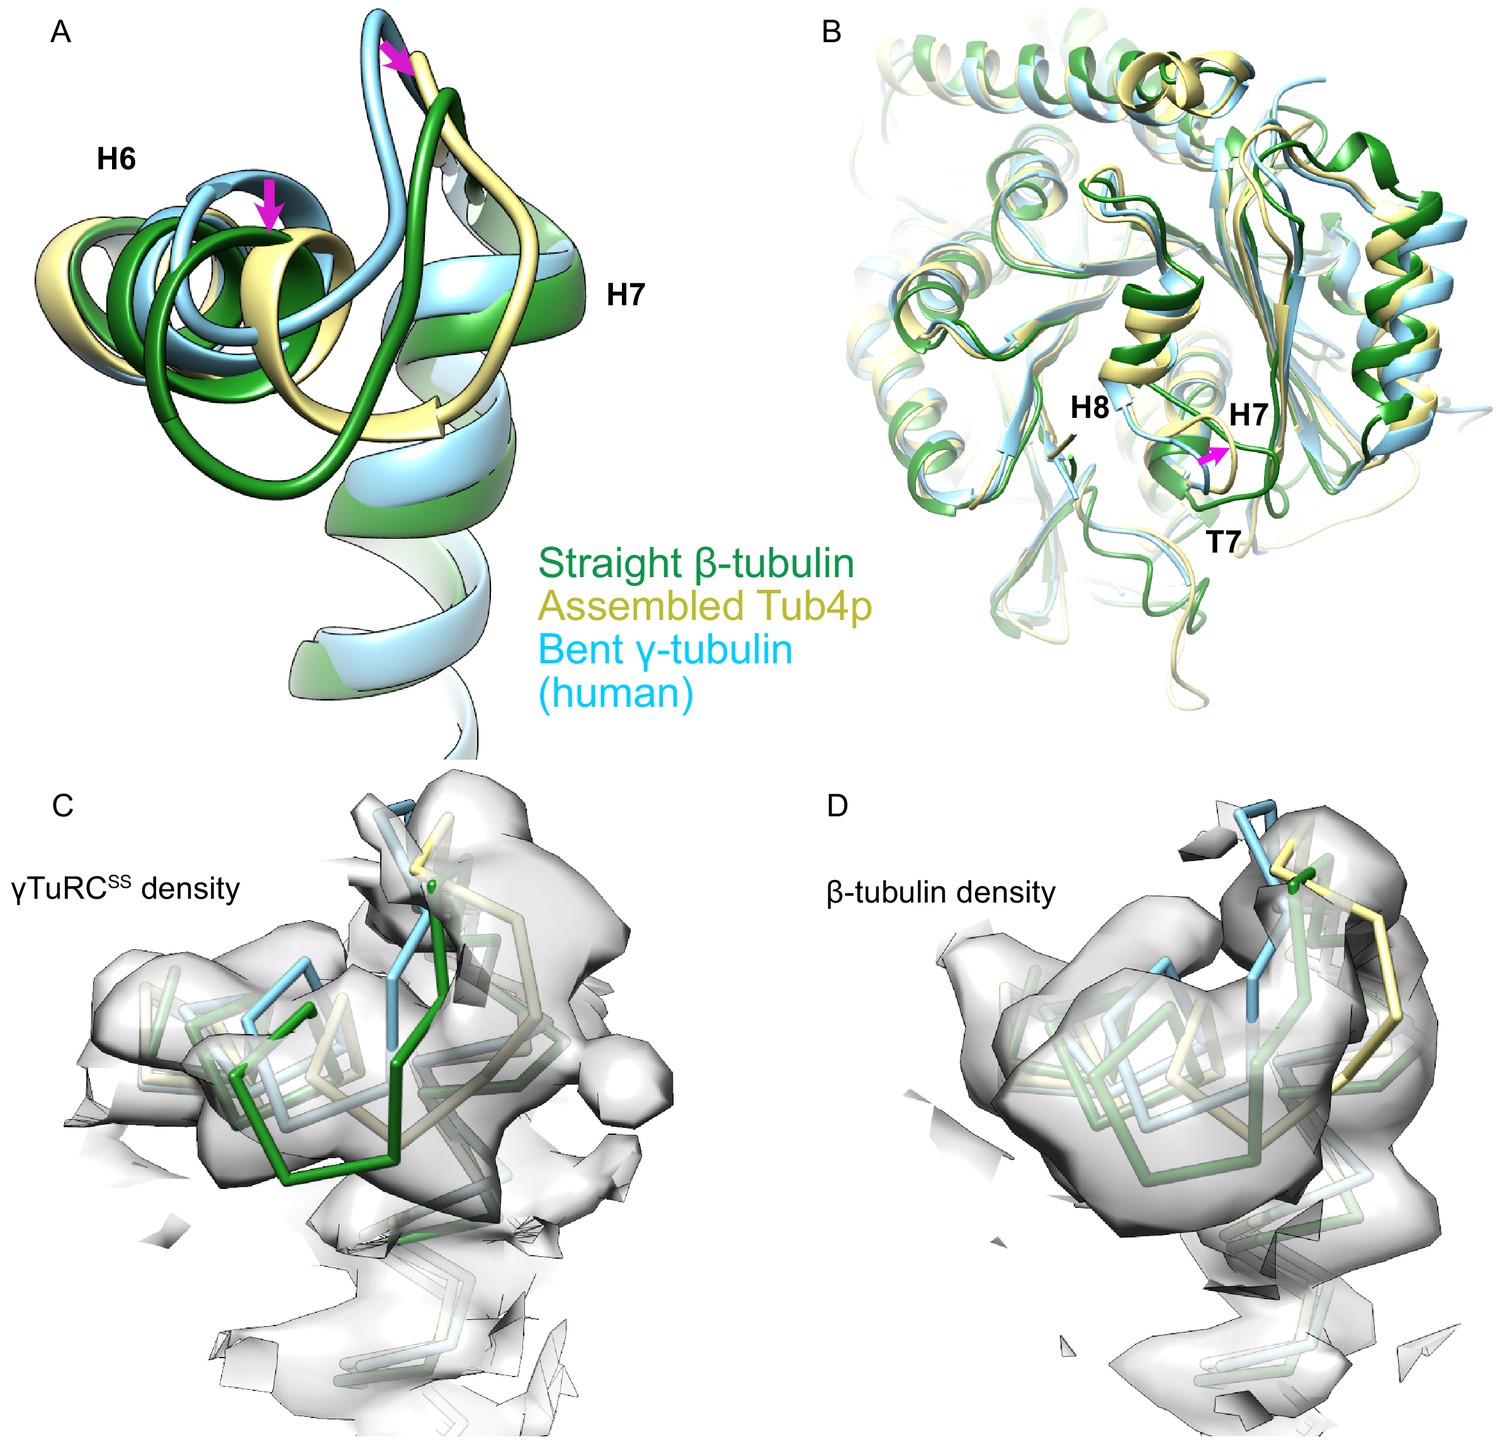
Comparison of γ-tubulin conformation between human and yeast γ-tubulin ring complex (γTuRC).
(A) An alignment of γ-tubulin (γ-tubulin bound to Spc98p, khaki, this work; human free γ-tubulin, sky blue, PDB ID 1Z5W; yeast straight β-tubulin, forest green, PDB ID 5W3F) using their N-terminal domain shows that the human γ-tubulin is nearly identical to the bent crystal structure, whereas the yeast Tub4p is in an intermediate conformation more similar to the straight conformation in its H6 conformation. The magenta arrow highlights the motion of H6 and the H6–H7 loop relative to the bent conformation in both assembled and straight γ-tubulin. (B) View from the γ-tubulin:spc98p interface of a global overlay of γ-tubulin bound to Spc98p and the human free γ-tubulin structure shows a motion of T7 loop at the γ-tubulin:Spc98p interface during assembly. The magenta arrow highlights the motion of the T7 loop relative to the bent conformation in both assembled and straight γ-tubulin. (C) View of aligned yeast γ-tubulin, human free γ-tubulin, and yeast straight β-tubulin, colored and aligned as in panel (A), showing that the density from the yeast γ-tubulin as seen in the γTuRCSS reconstruction is clearly distinct from the bent and straight conformations. Density is filtered at 4.2 Å for clarity. (D) View of aligned yeast γ-tubulin, human free γ-tubulin, and yeast straight β-tubulin, colored and aligned as in panel (A), showing that the density from the yeast β-tubulin filament reconstruction is clearly distinct from the γTuRCSS and bent conformations. Density in panels (C) and (D) was zoned within 2.8 Å of their respective models.
Figure 4 with 3 supplements
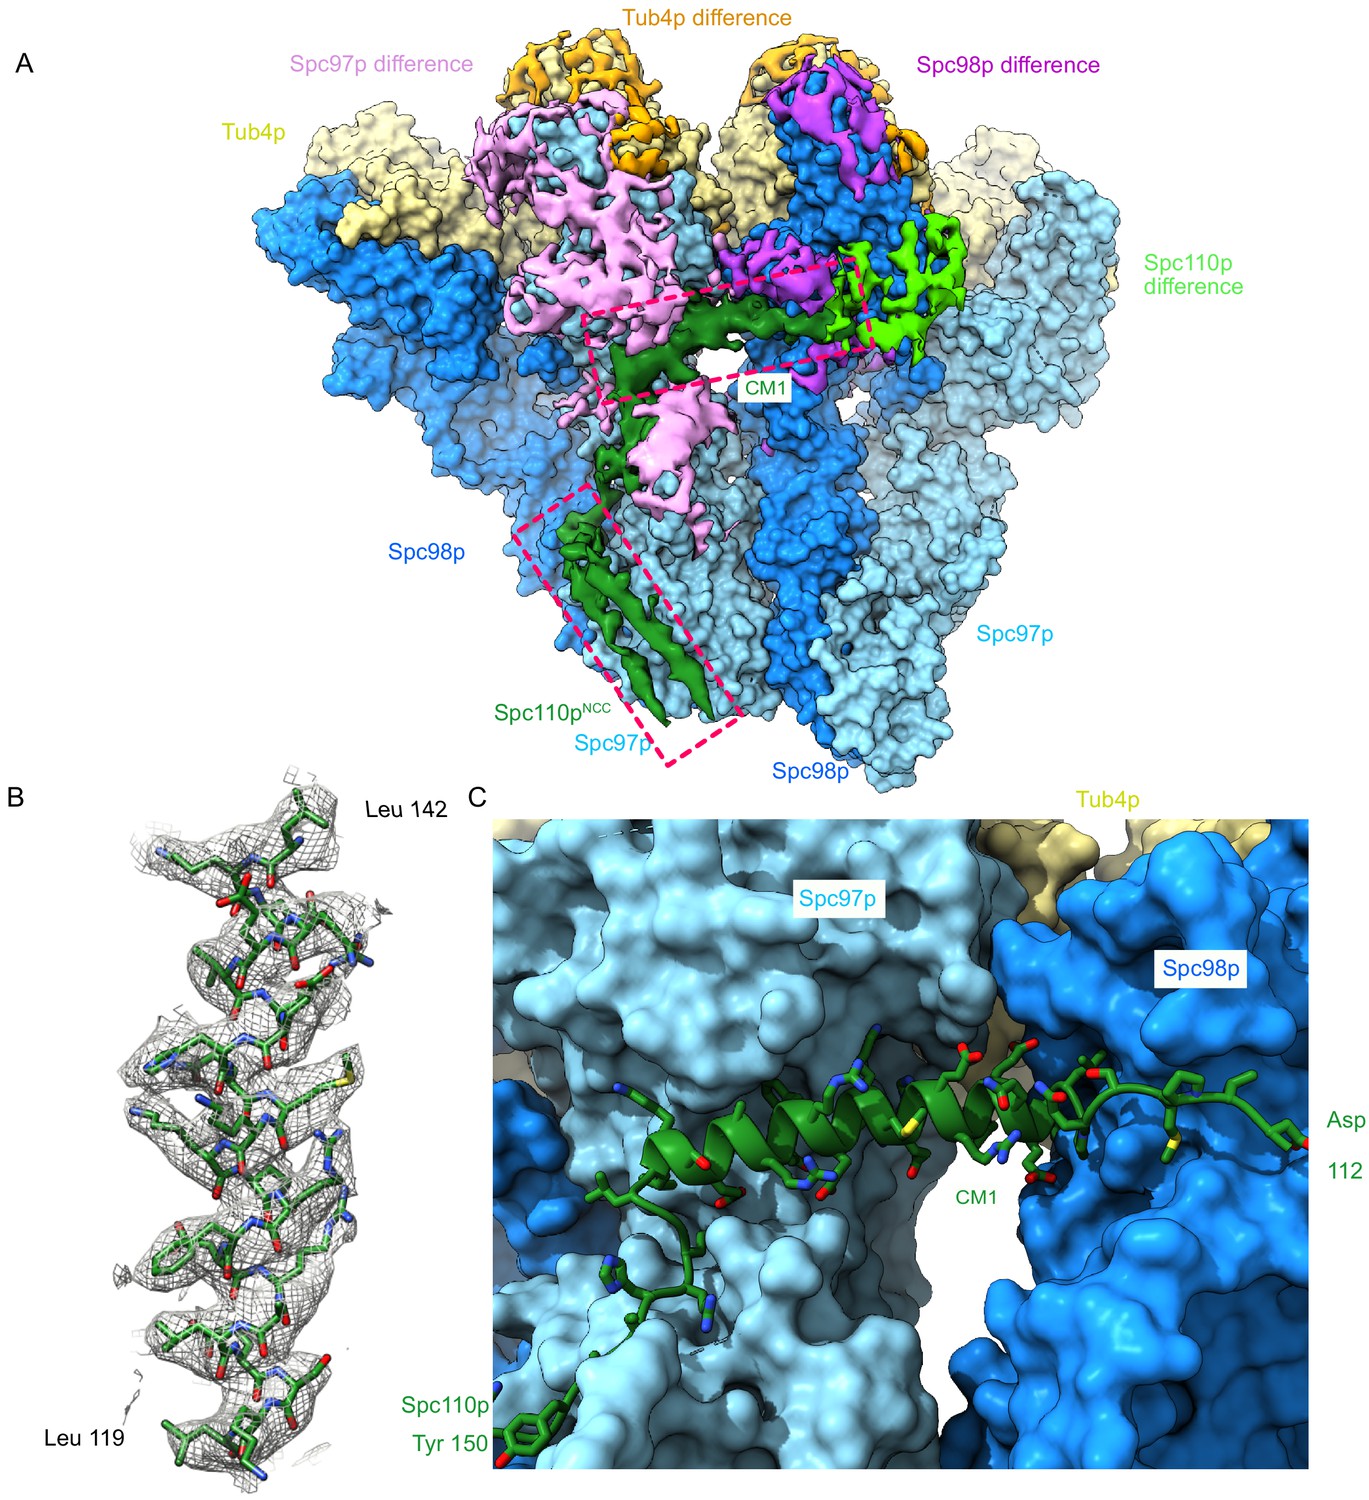
The Spc110p centrosomin motif 1 (CM1) helix binds at the inter-γ-tubulin small complex (γTuSC) interface.
(A) Filtered segmented difference map between experimental density and the fitted atomic model without Spc110p overlaid on a γTuRCSS surface lacking Spc110p. The difference map was segmented to show density near a γTuRCSS monomer and colored to attribute densities to their putative chains. The Spc110pNCC and Spc110pCM1 densities are highlighted with rectangular boxes. (B) Density for the helical CM1 density of γTuRCSS showing clear side-chain features unambiguously defining the register. Density was zoned near the atoms in Chimera with a radius of 2.6 Å. (C) View of the binding site for CM1 and the strands preceding and following the CM1 helix. γTuRC: γ-tubulin ring complex.
Figure 4—figure supplement 1
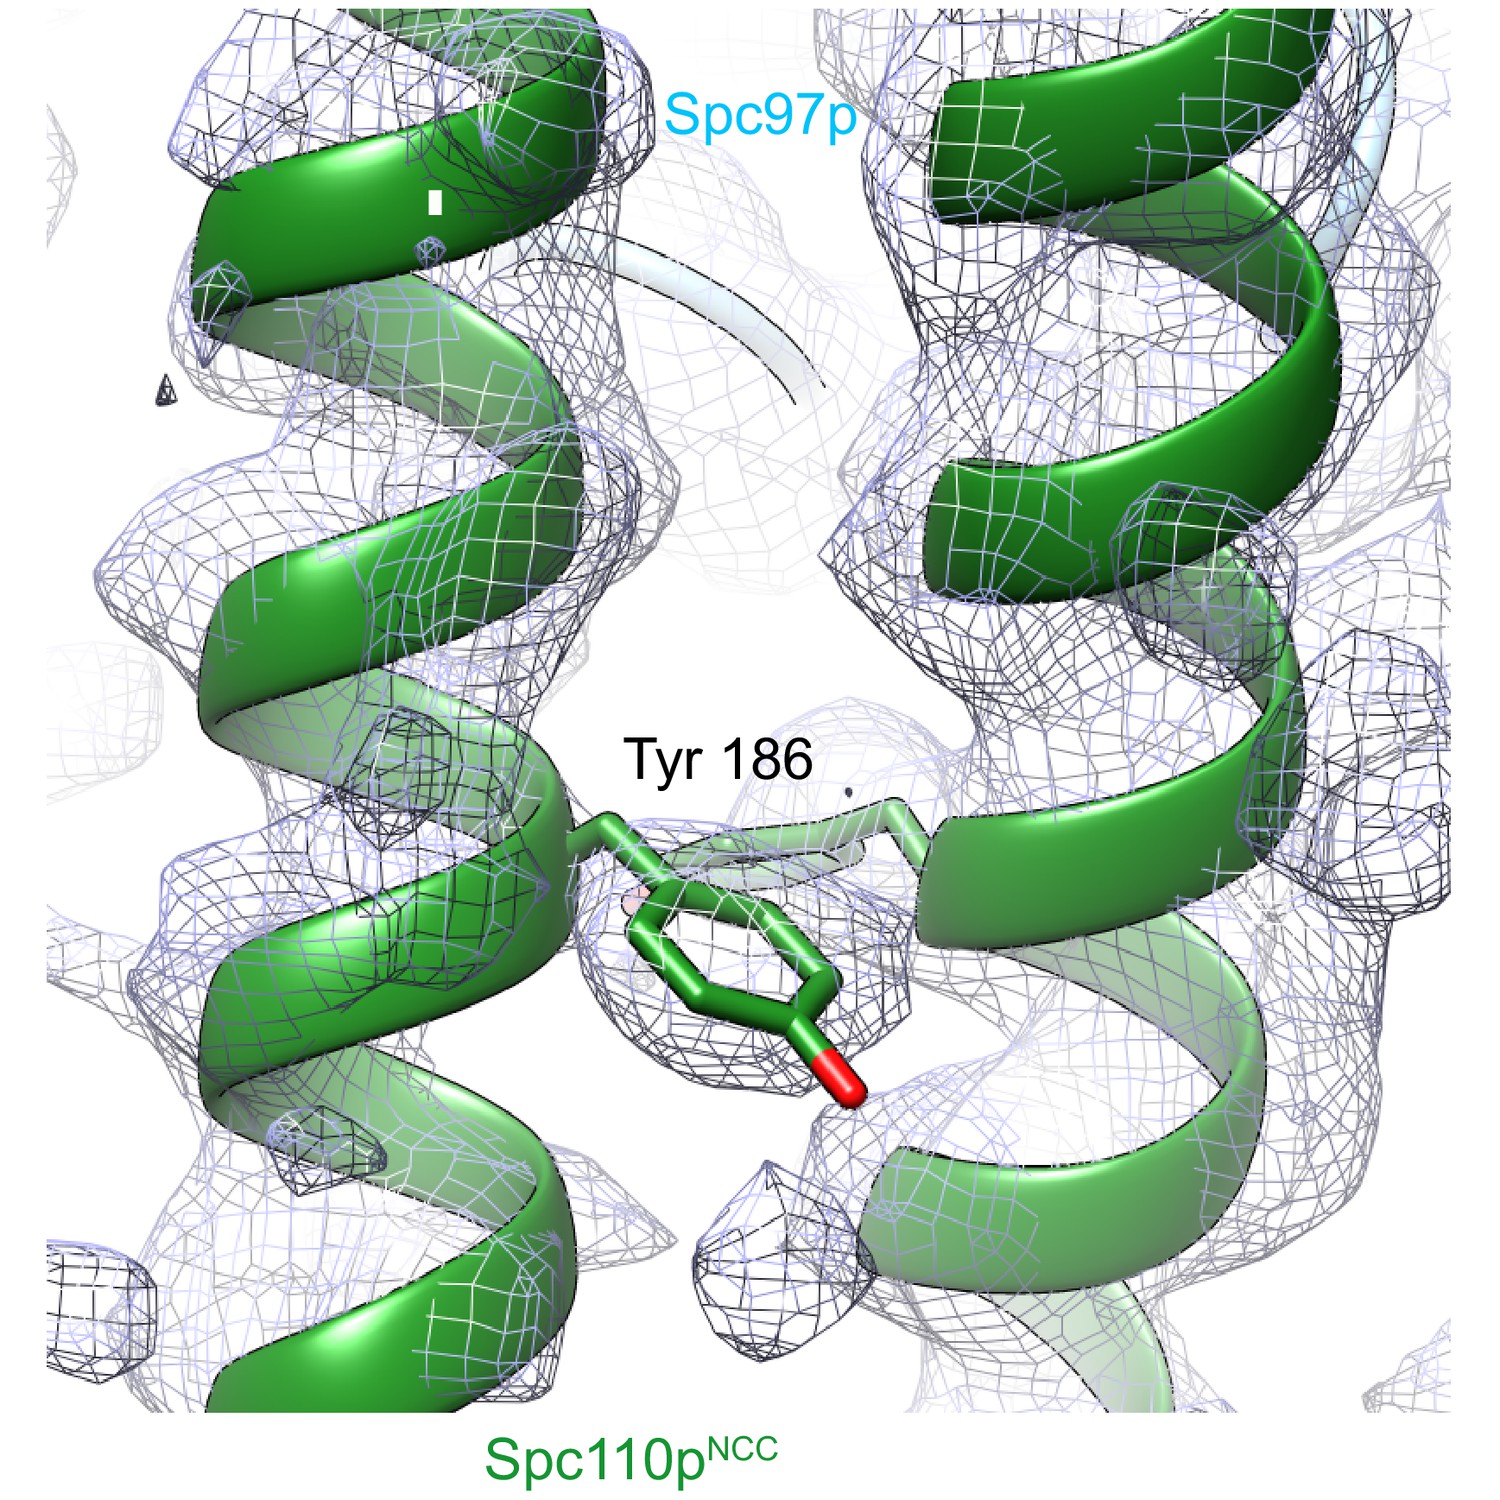
Spc110pNCC structure (forest green) near the tyrosine 186 side chain fitted into ~4.2 Å low pass filtered density from the γTuRCSS reconstruction. γTuRC: γ-tubulin ring complex.
Figure 4—figure supplement 2
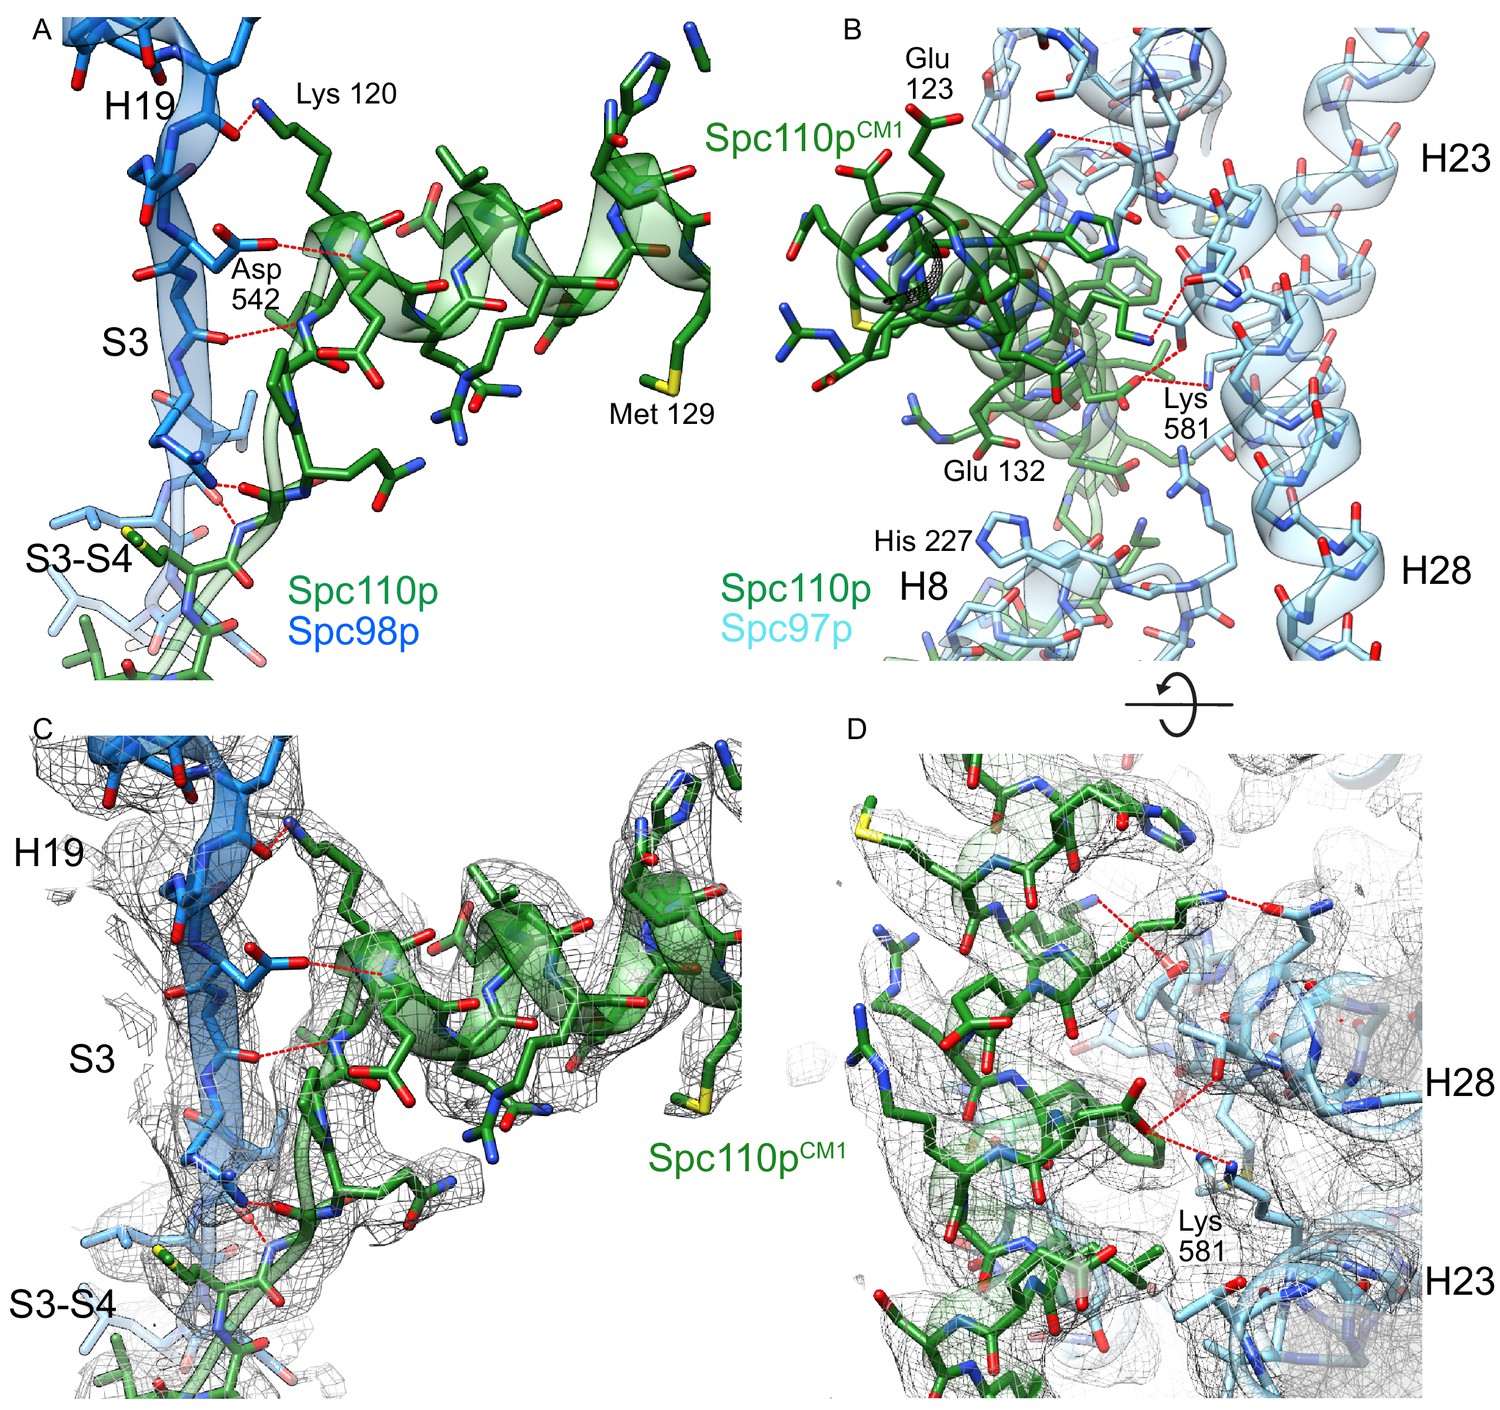
Helix dipole interactions define the centrosomin motif 1 (CM1) binding site on Spc98p.
(A) View of the Spc110pCM1 motif binding site with Spc98p with the H19-S3 region, colored as in Figure 4. Spc110pCM1:Spc98p hydrogen bond interactions are indicated in red. All of the hydrogen bonds between Spc110p and Spc98p have a backbone atom as one of the hydrogen bonds partners. (B) View of the CM1 binding site with Spc97p. Side chains interacting with the Spc110pCM1 helix are shown. Spc110pCM1:Spc97p hydrogen bond interactions are indicated in red. (C) View of the Spc110pCM1 motif binding site with Spc98p with the H19-S3 region, with the model overlaid with density. Density in this panel is filtered at 3.0 Å and zoned within 2.6 Å from the model. (D) View of the CM1 binding site with Spc97p, with the model overlaid with density. The view has density in this panel and is filtered at 3.5 Å, and density is unmasked. Hydrogen bonds labeled in panels (A) and (B) were identified using the ‘FindHBond’ GUI as implemented in Chimera using the default parameters for relaxing H-bond constraints of 0.4 Å and 20.0°.
Figure 4—figure supplement 3
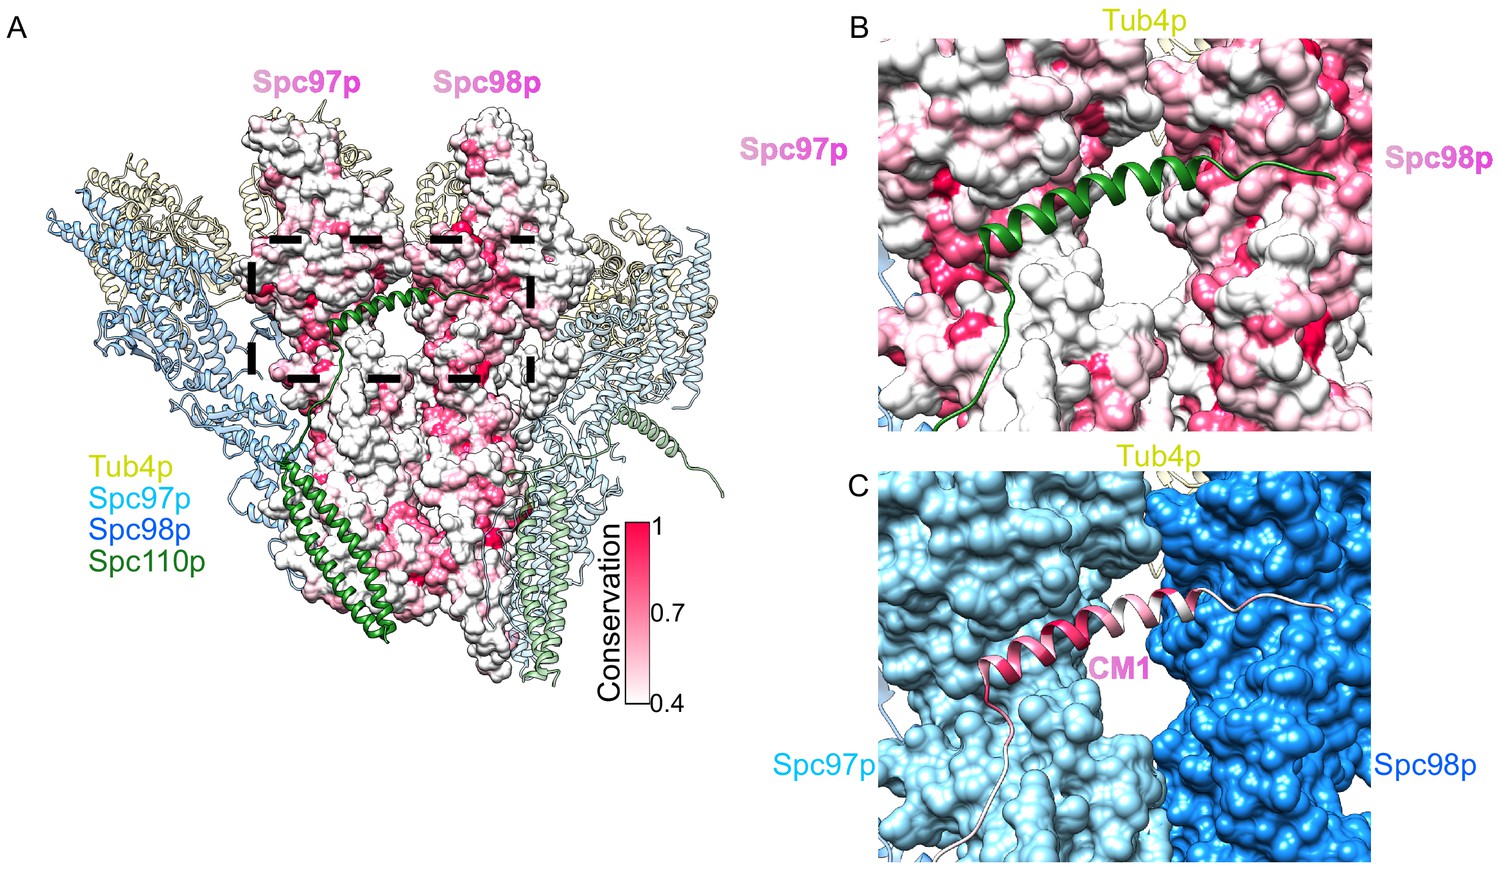
Conserved binding interface with the centrosomin motif 1 (CM1) motif.
(A) Overview of a dimer of γ-tubulin small complex (γTuSC) colored as in Figure 2, with the central Spc97p/98p colored according to their conservation. (B) View of the Spc110pCM1 binding site at the Spc97p/98p C-terminus, with Spc97p/98p colored according to their conservation, as in panel (A). (C) View of the Spc110pCM1 binding site at the Spc97p/98p C-terminus, with Spc110p colored according to its conservation, with the same scale as panel (A). Spc97p/98p are colored as in the figure legend.
Figure 5 with 7 supplements
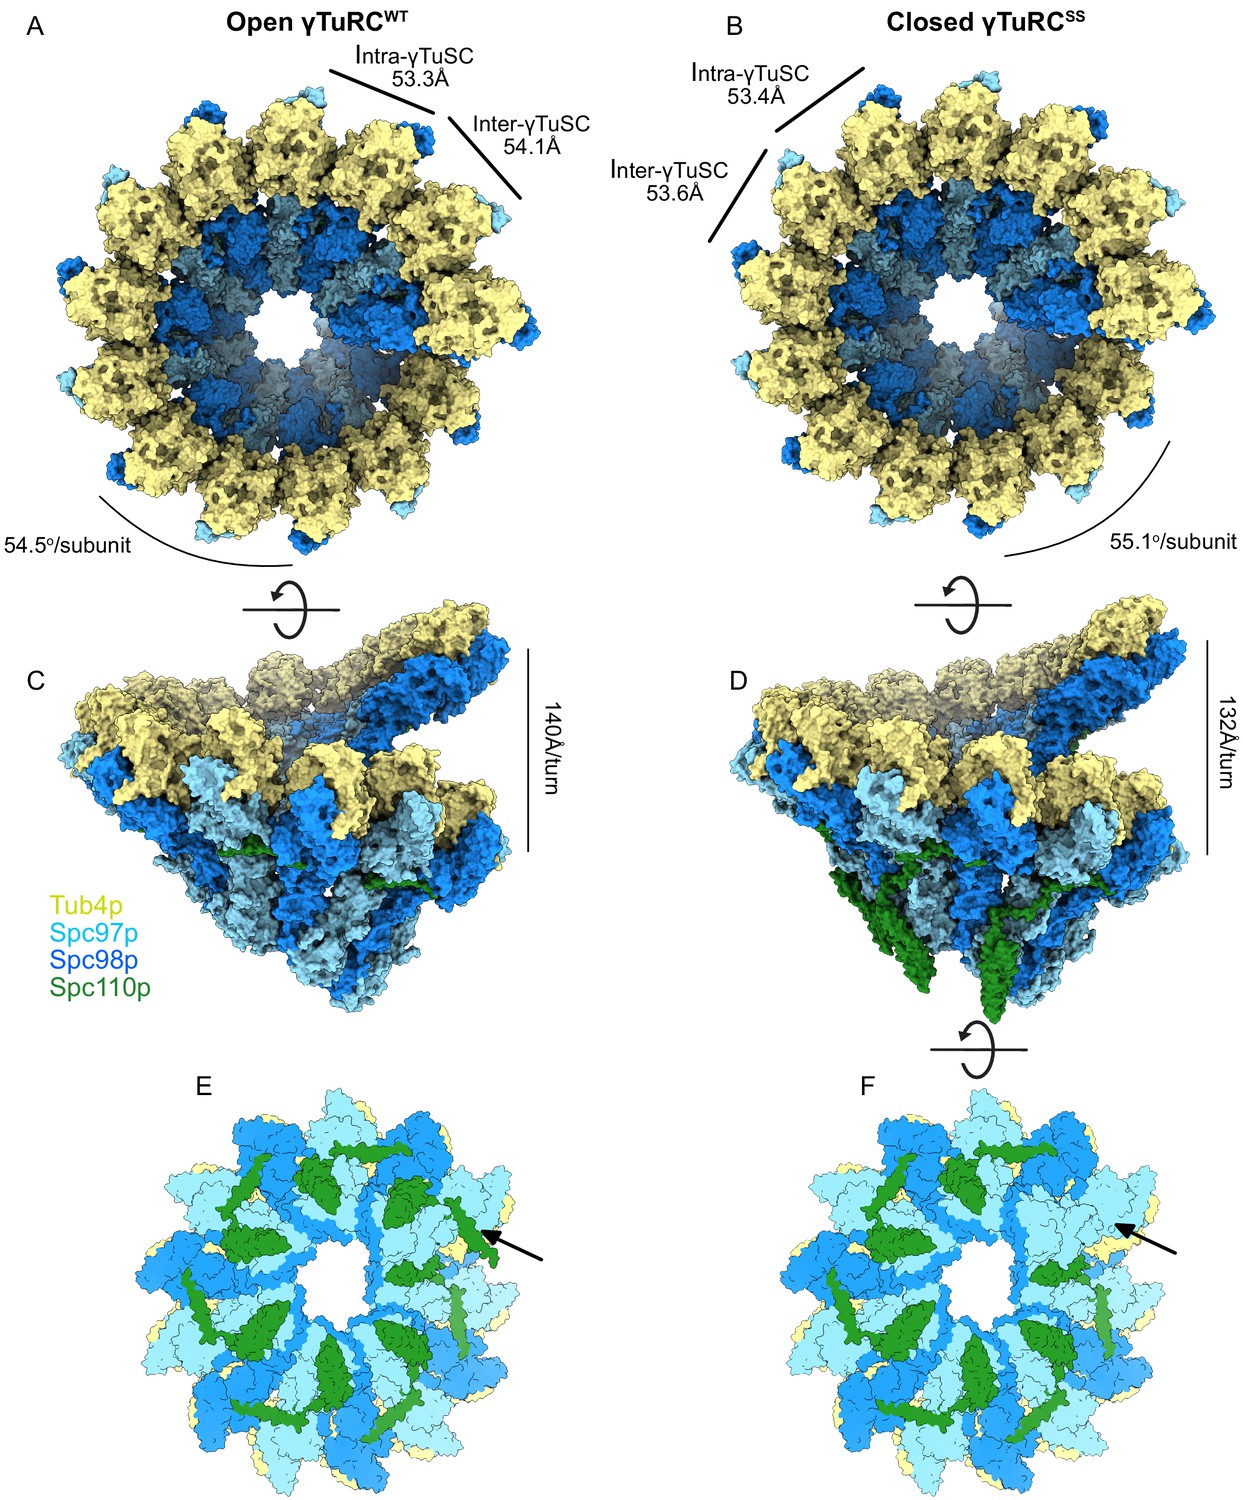
Structural overview of γ-tubulin ring complex (γTuRC) assemblies.
Top and side views of open γTuRCWT (A, C) and closed γTuRCSS (B, D). Panels (E) and (F) show a bottom view of an assembled γTuRCSS. The arrow indicates the seventh Spc110pNCC binding site in the γ-tubulin small complex (γTuSC) heptamer, which is likely not to have bound Spc110p, given the sixfold symmetry observed in Spc42p at the spindle pole body (SPB), and the lack of a centrosomin motif 1 (CM1) binding site at the adjacent inter-γTuSC interface. Panel (E) shows the heptamer with a seventh Spc110p binding site, with CM1 only partially bound.
Figure 5—figure supplement 1
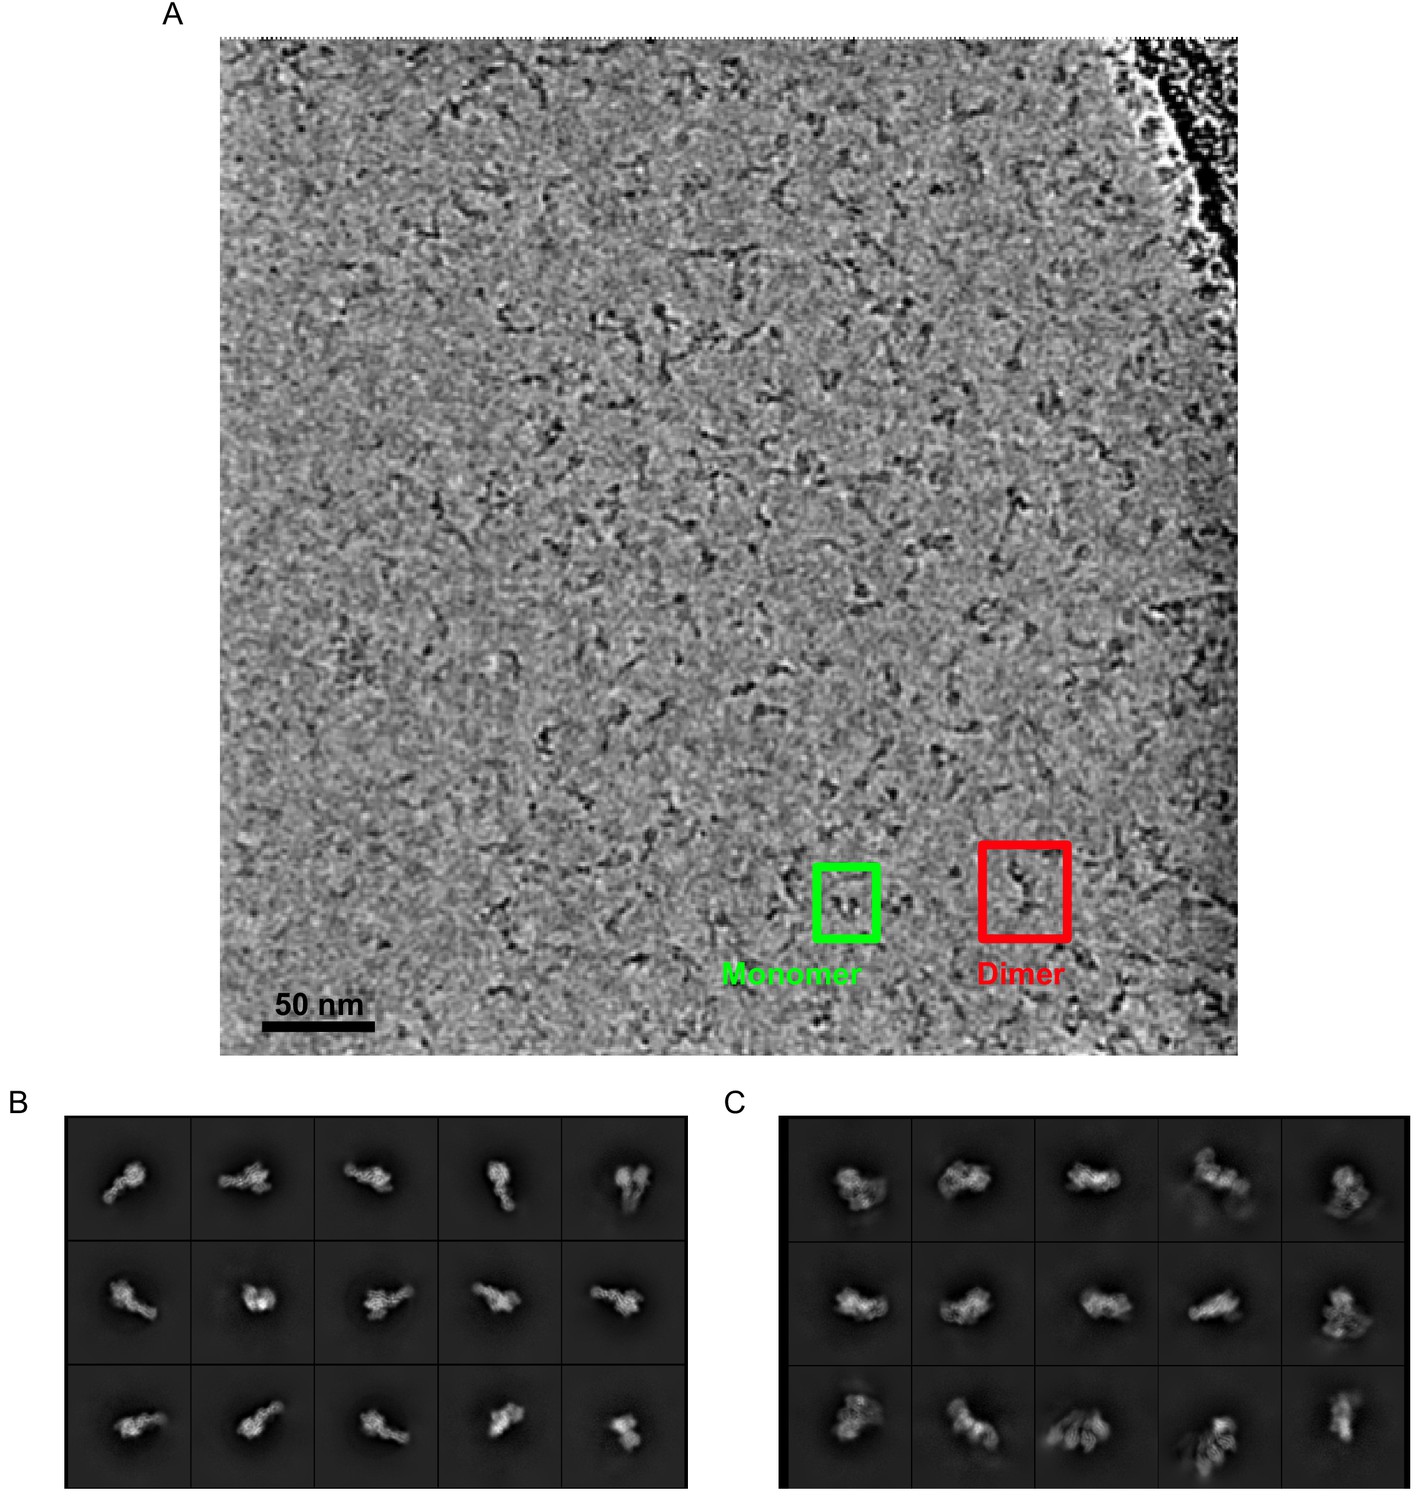
A mixture of compositional states is observed.
(A) A filtered micrograph showing raw particles shows well-dispersed single particles and a mixture of γ-tubulin small complex (γTuSC) monomers and dimers. (B) Representative examples of classes obtained by unsupervised classification of monomers. (C) Representative examples of classes obtained by unsupervised classification of dimers.
Figure 5—figure supplement 2
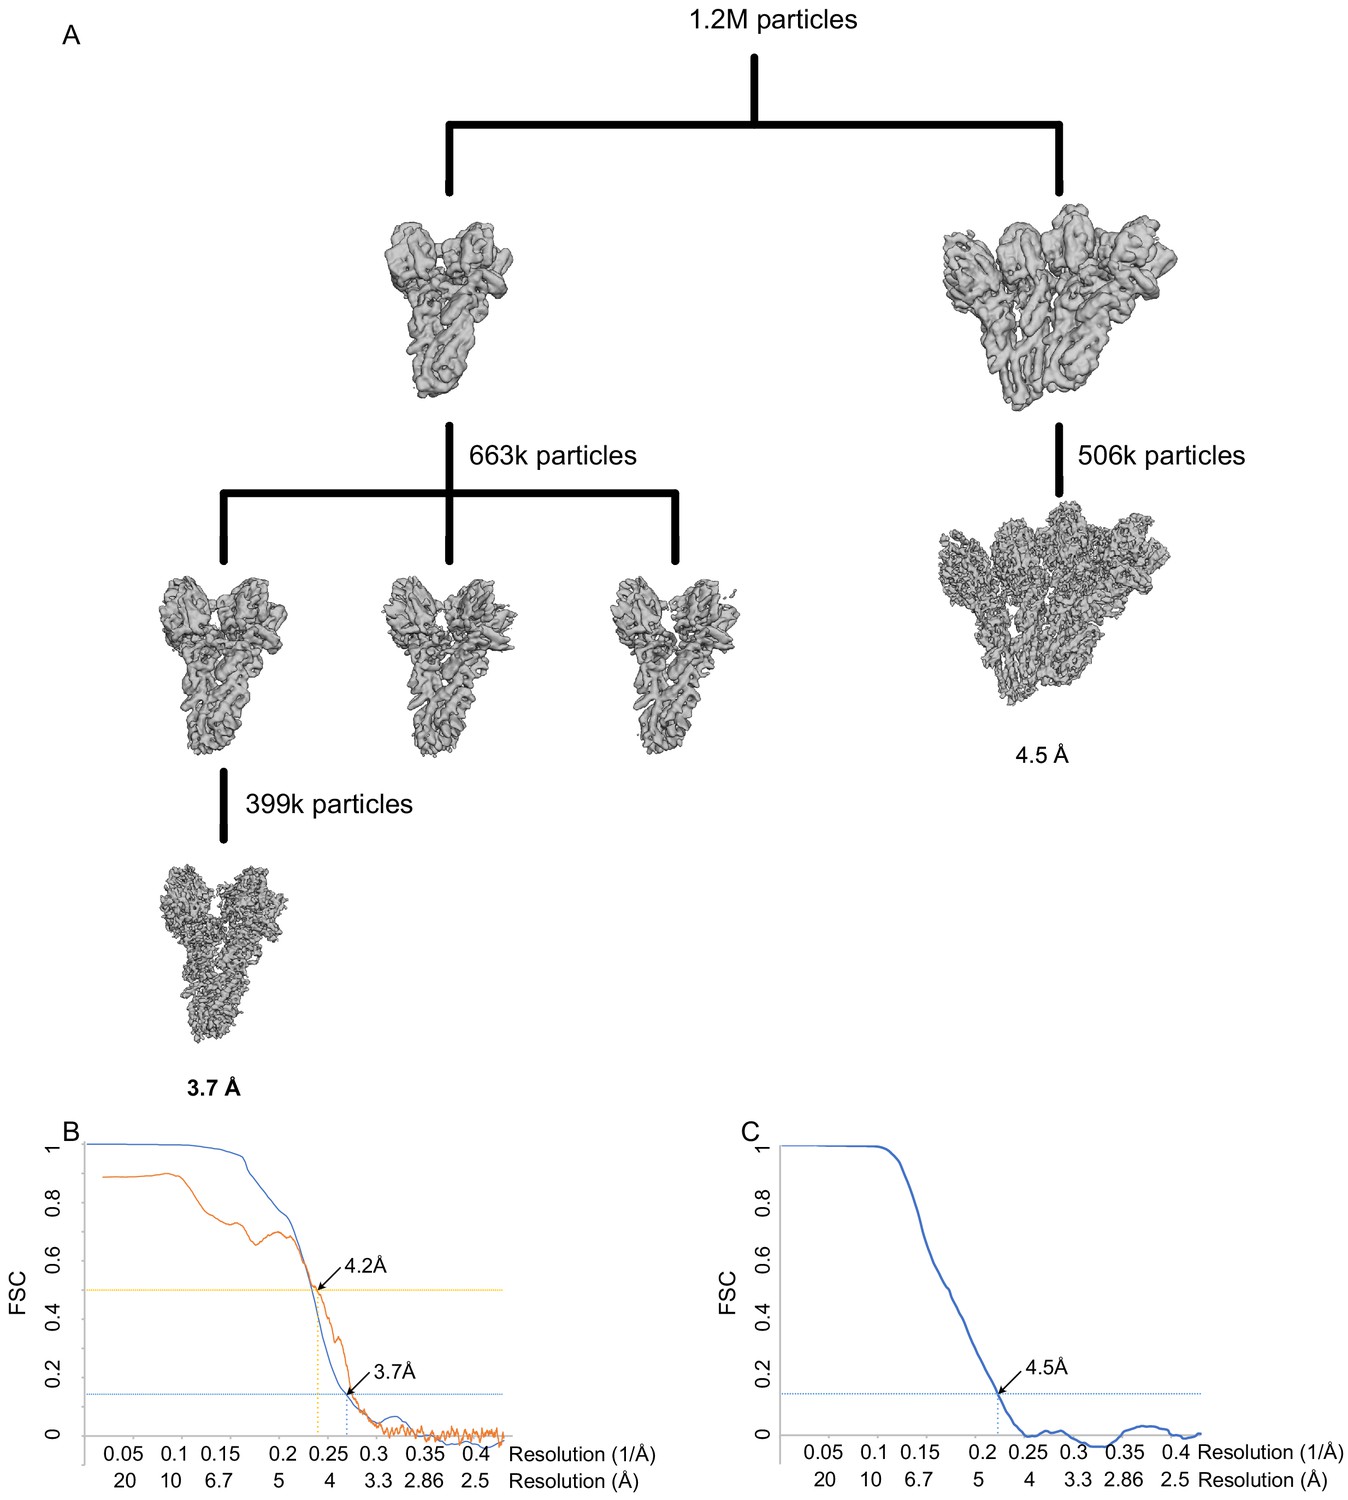
WT γ-tubulin small complex (γTuSC) processing and resolution.
(A) Classification scheme for WT γTuSC monomer and dimer processing. (B) FSC (blue) and map to model FSC for the closed WT γTuSC monomer. (C) FSC (blue) and map to model FSC for the open WT γTuSC dimer.
Figure 5—figure supplement 3
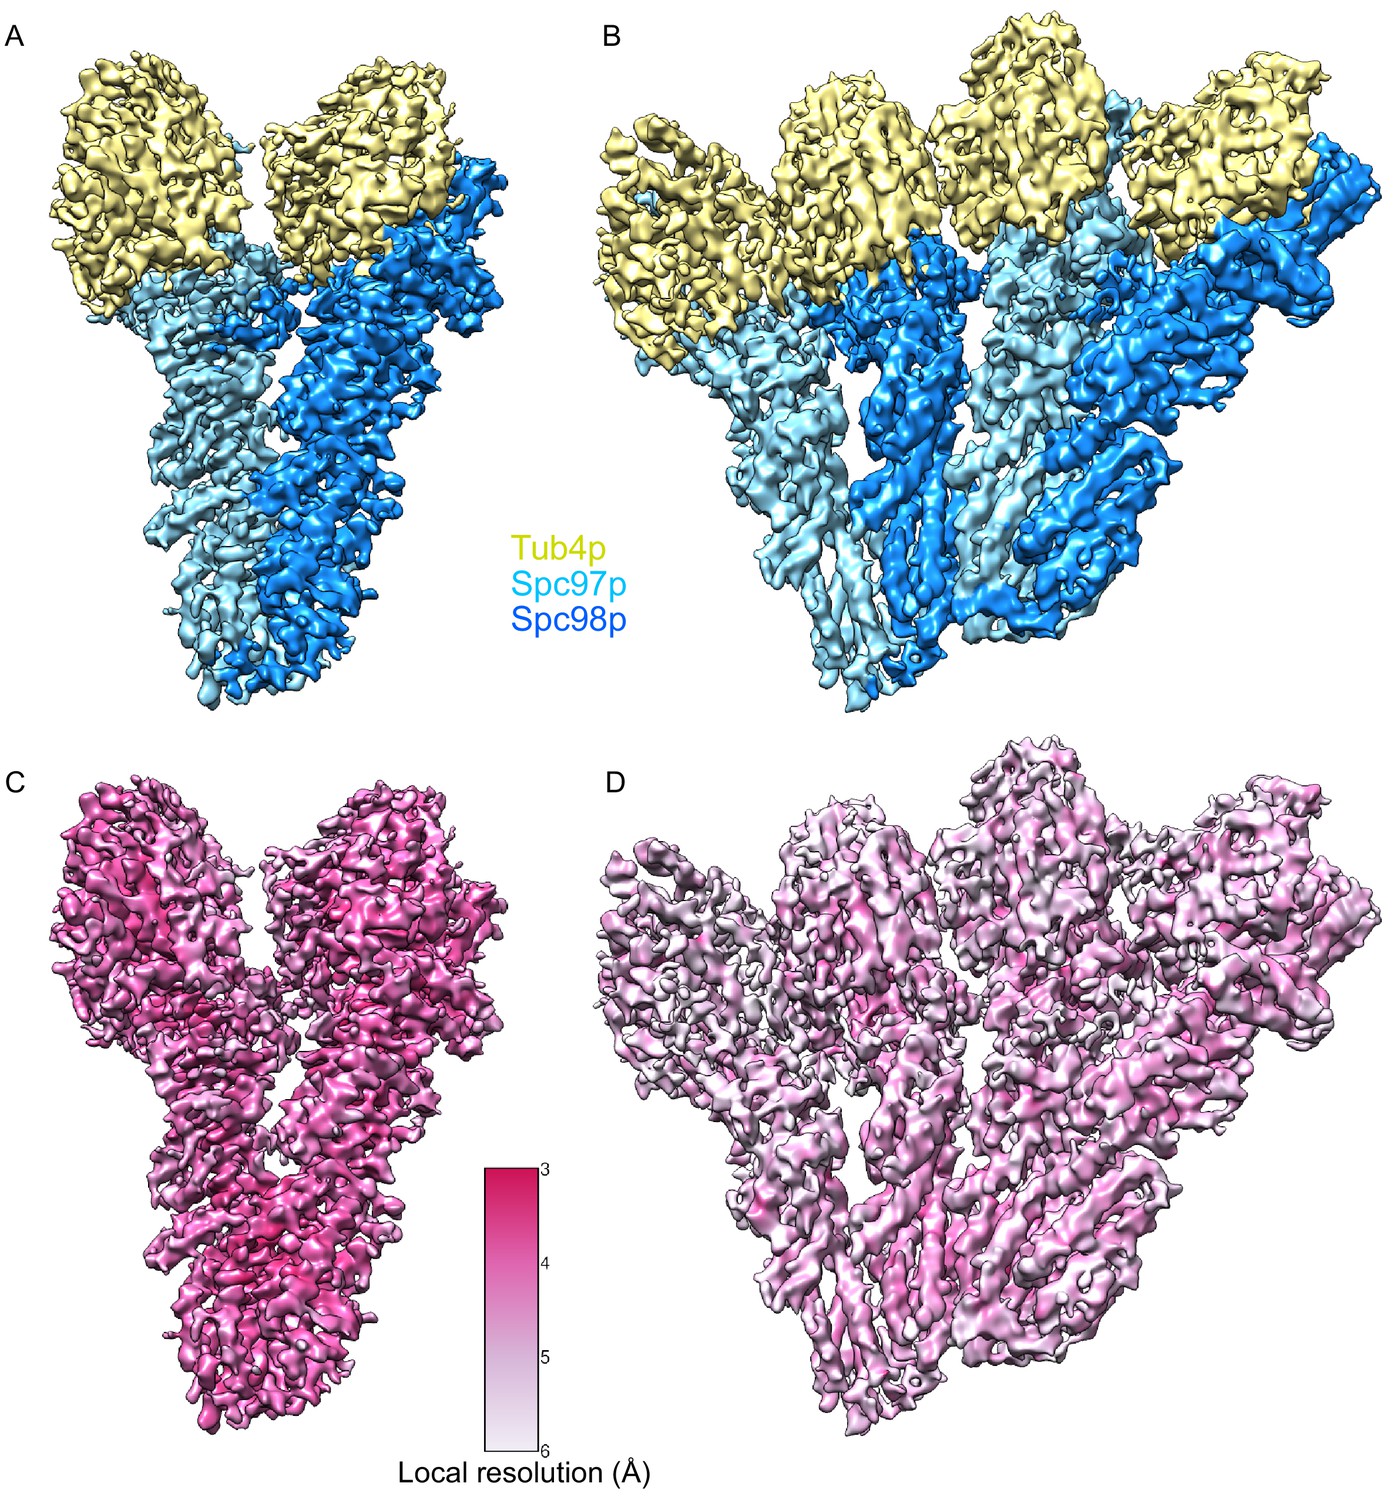
Segmented single-particle reconstructions of γ-tubulin small complex (γTuSC) monomer and dimer.
(A) Approximately 3.7 Å reconstruction γTuSC showing Spc97p (sky blue), Spc98p (dodger blue), and γ-tubulin (khaki). (B) Approximately 4.5 Å reconstruction of a dimer of γTuSC colored as in panel (A). (C) Approximately 3.7 Å reconstruction γTuSC colored according to its local resolution. (D) Approximately 4.5 Å reconstruction of a dimer of γTuSC colored according to its local resolution. Color scale for panels (C) and (D) is shown in figure inset. Disconnected density smaller than 5 Å was hidden using the ‘Hide Dust’ command in Chimera.
Figure 5—figure supplement 4
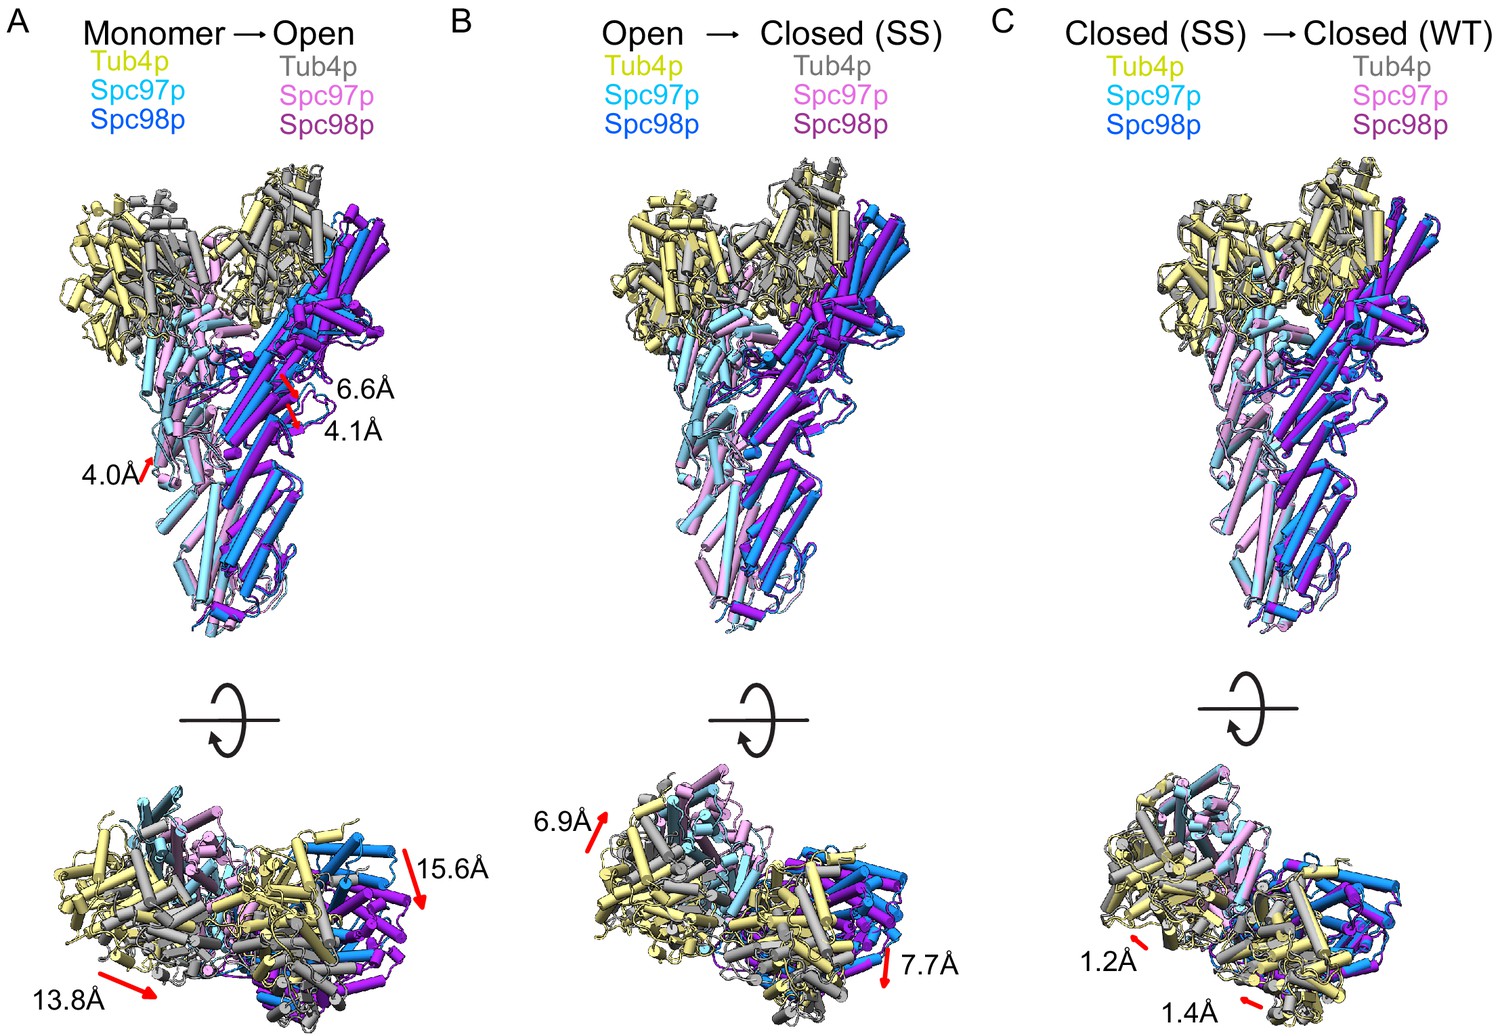
Conformational changes in γ-tubulin small complex (γTuSC) during assembly and activation.
(A) Views of the monomeric γTuSC aligned with an open γTuRCWT filament monomer using the N-terminal helical bundles of Spc97/98p. Monomeric γTuSC is colored as in Figure 2, and the γTuSCWT filament has Spc97p in light pink, Spc98p in purple, and Tub4p colored in gray. (B) Views of a γTuRCWT filament monomer aligned with a γTuRCss filament monomer using the N-terminal helical bundles of Spc97/98p. γTuSCWT is colored as in Figure 2, and γTuSCss has Spc97p in light pink, Spc98p in purple, and Tub4p colored in gray. (C) Views of a γTuSCss filament monomer aligned with a γTuSCWT closed filament monomer using the N-terminal helical bundles of Spc97/98p. γTuSCss is colored as in Figure 2, and γTuSCWT has Spc97p in light pink, Spc98p in purple, and Tub4p colored in gray. γTuRC: γ-tubulin ring complex.
Figure 5—video 1
Conformational changes of γ-tubulin small complex (γTuSC) during assembly.
Morph of the monomeric γTuSC conformation to the conformation adopted by a γTuRCWT filament monomer in the open state. The γTuSC is colored with Tub4p in khaki, Spc97p in light blue, and Spc98p in light blue (as in Figure 2). Morphs were calculated in Chimera (Pettersen et al., 2004) using a linear interpolation method. Corresponds to transition shown in Figure 5—figure supplement 4A.
Figure 5—video 2
Conformational changes of γ-tubulin ring complex (γTuRC) during activation.
Morph of a γTuRCWT filament monomer in the open conformation to the conformation adopted by a γTuRCSS filament monomer in the closed state. The γTuSC is colored with Tub4p in khaki, Spc97p in light blue, and Spc98p in light blue (as in Figure 2). Morphs were calculated in Chimera (Pettersen et al., 2004) using a linear interpolation method. Corresponds to transition shown in Figure 5—figure supplement 4B.
Figure 5—video 3
Morph of γTuRCSS and γTuRCWT closed states shows minimal changes.
Morph of a γTuRCSS filament monomer in the closed state to the conformation adopted by a γTuRCWT filament monomer in the closed state. The γTuSC is colored with Tub4p in khaki, Spc97p in light blue, and Spc98p in light blue (as in Figure 2). Morphs were calculated in Chimera (Pettersen et al., 2004) using a linear interpolation method. Corresponds to transition shown in Figure 5—figure supplement 4C. γTuRC: γ-tubulin ring complex; γTuSC: γ-tubulin small complex.
Figure 6

Phosphorylation sites visualized on the γTuRCSS structure.
(A) γTuSCSS dimer, colored as in Figure 2, with phosphorylation sites from Fong et al., 2018 marked with red balls (no known phenotype) or purple balls (phenotype previously reported). Boxes are shown highlighting areas shown in panels (B–D). (B) View of phosphorylation sites at the Spc97p Spc110pNCC binding site. The phosphorylation site T88 is labeled in bold as the only phosphorylation site localized at high resolution, which is expected to stabilize the interaction between Spc110p and the γ-tubulin ring complex (γTuRC) based on its proximity to a positive charge. (C) View of the path of the Spc110p loop between the Spc110pNCC and Spc110pCM1 domain. This loop shows two phosphorylation sites opposite an acidic path. (D) Phosphorylation sites mapped on the γ-tubulin:α-tubulin interface, illustrating the position of the phosphorylation sites in relation to the interface with α-tubulin, Spc98p-bound γ-tubulin is in khaki, while α-tubulin is in light green.
Figure 7 with 2 supplements
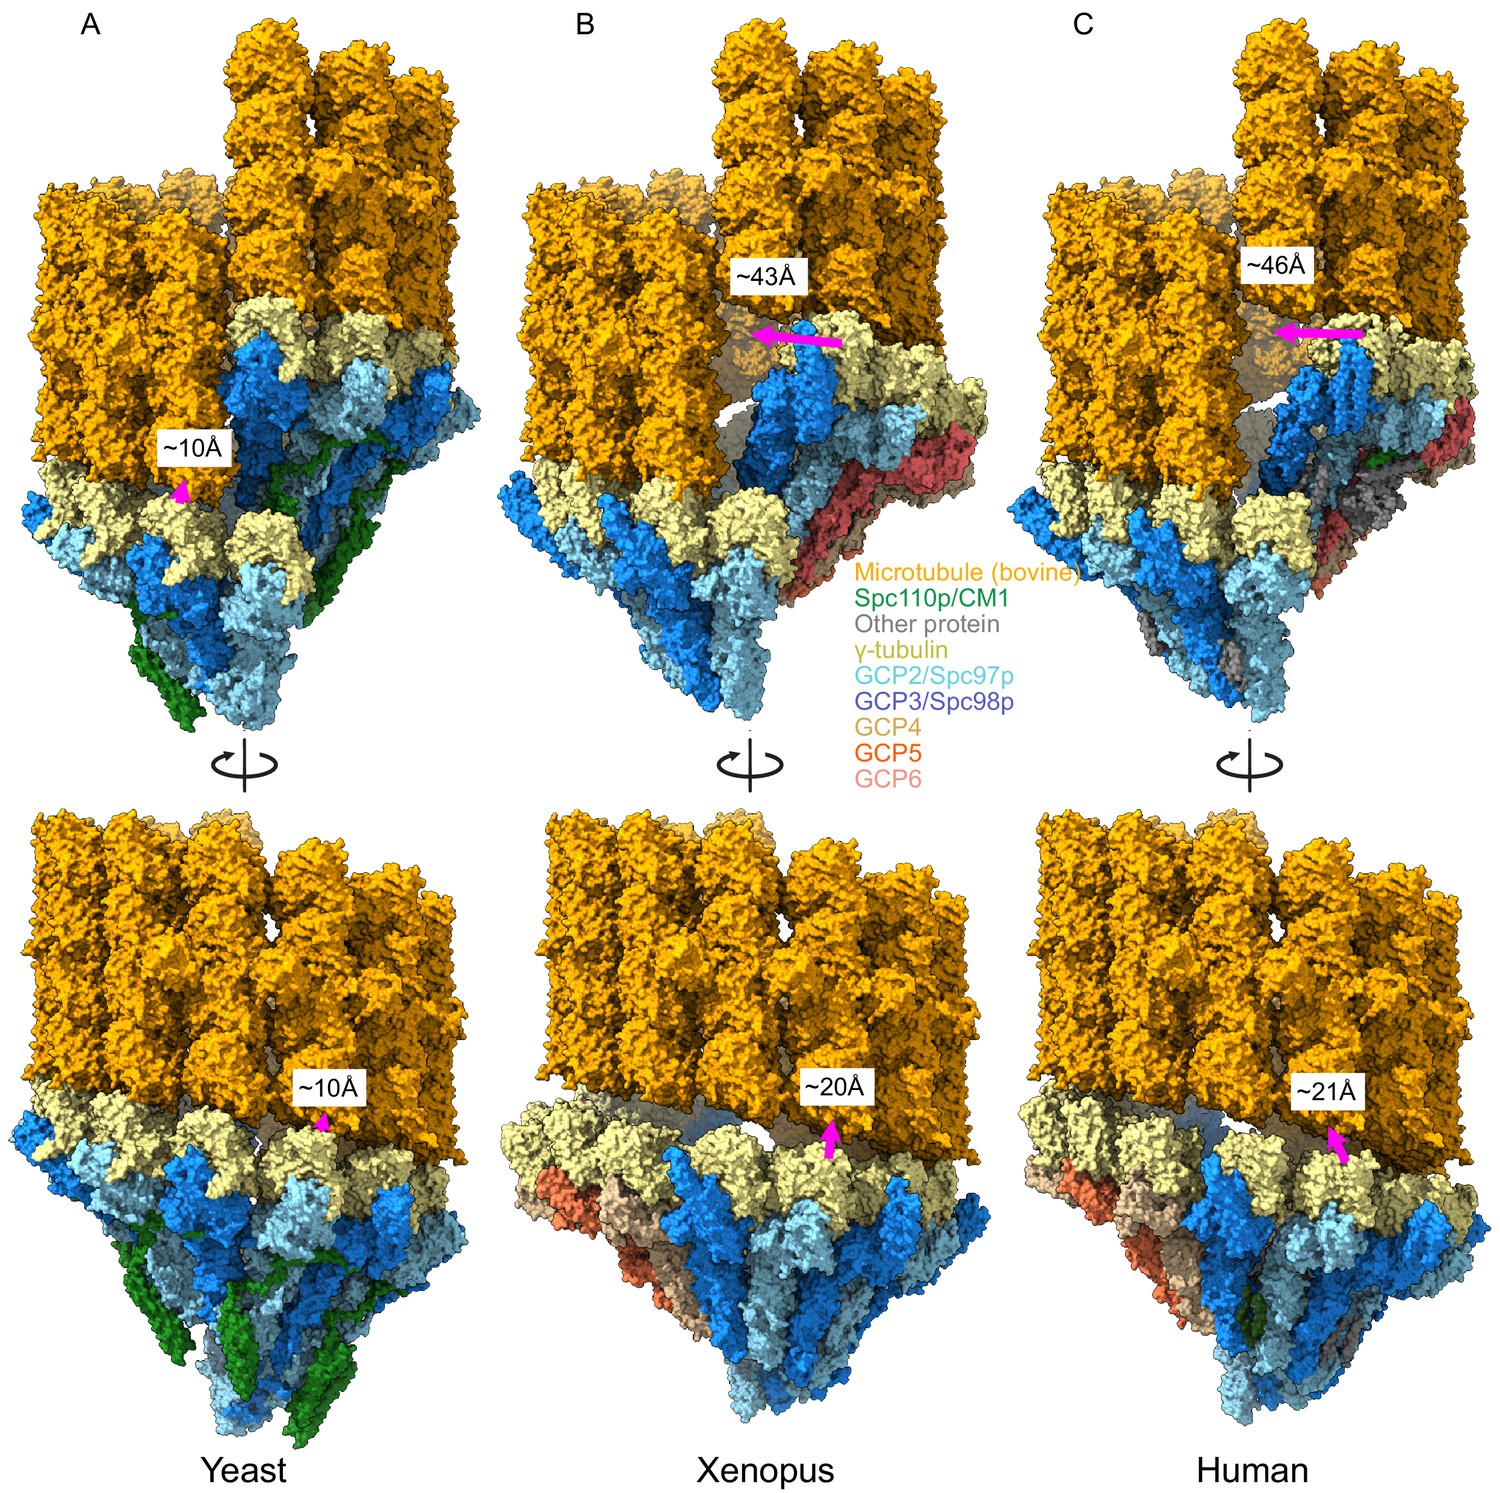
Metazoan γ-tubulin ring complexes (γTuRCs) require large motions to template microtubules.
(A) Yeast closed (this work), (B) Xenopus (PDB ID 6TF9), and (C) human γTuRC (PDB ID 6V6S) structures placed adjacent to a microtubule to illustrate the motions required to properly template microtubules. For each structure, two γ-tubulins (positions 2, 3 for Xenopus and human and positions 13, 14 for yeast) were aligned with two β-tubulins docked in microtubule density to approximate binding of γ-tubulins to a microtubule.
Figure 7—figure supplement 1
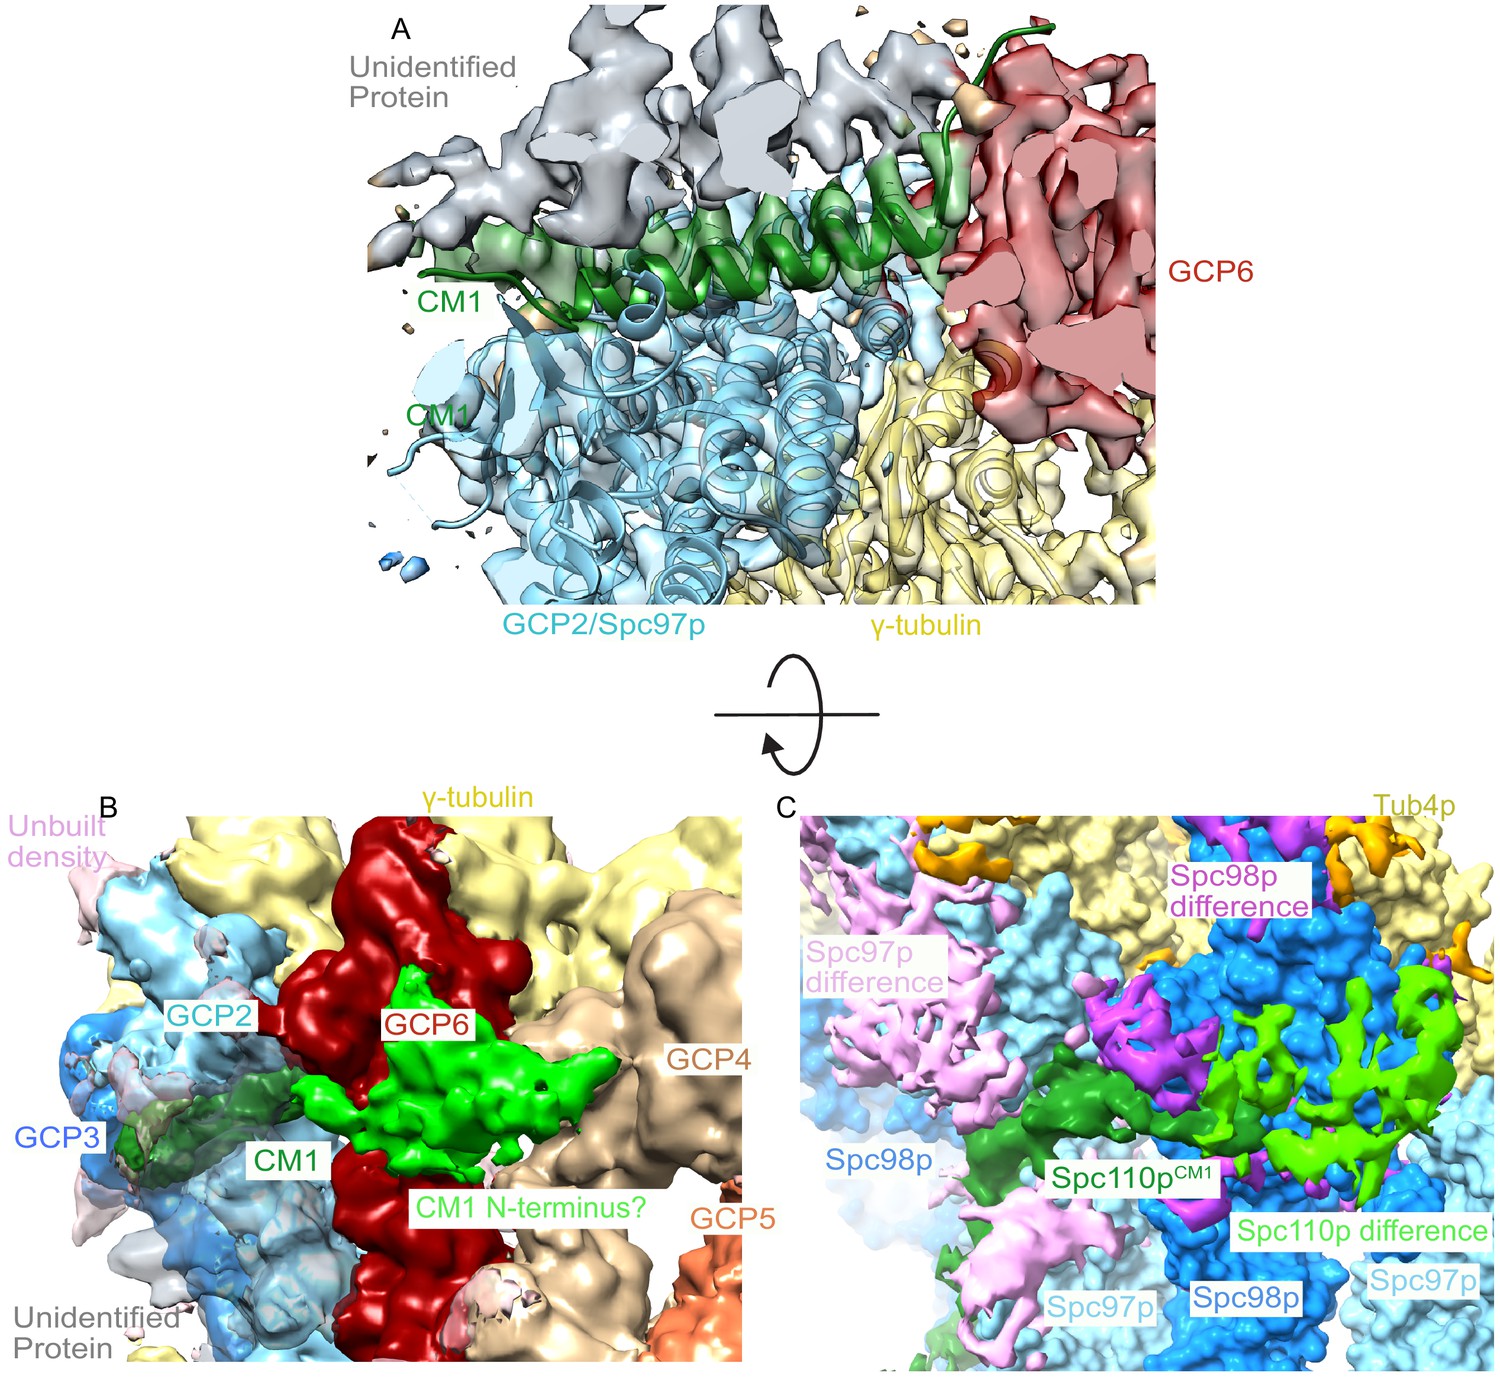
A centrosomin motif 1 (CM1) helix binds between grip-containing protein (GCP)2 and GCP6 in human γ-tubulin ring complex (γTuRC).
(A) Human γTuRC density (EMDB ID 21068) is fitted with the C-terminal region of yeast GCP2, γ-tubulin, and CM1 helix (this work), showing that a CM1 helix binds between GCP2 and GCP6 in human γTuRC. (B) Low-resolution filtered human γTuRC density (EMDB ID 21068) shows a similar N-terminal density extending from the CM1 helix towards the adjacent GCP as observed in the (C) yeast difference map (this work).
Figure 7—figure supplement 2
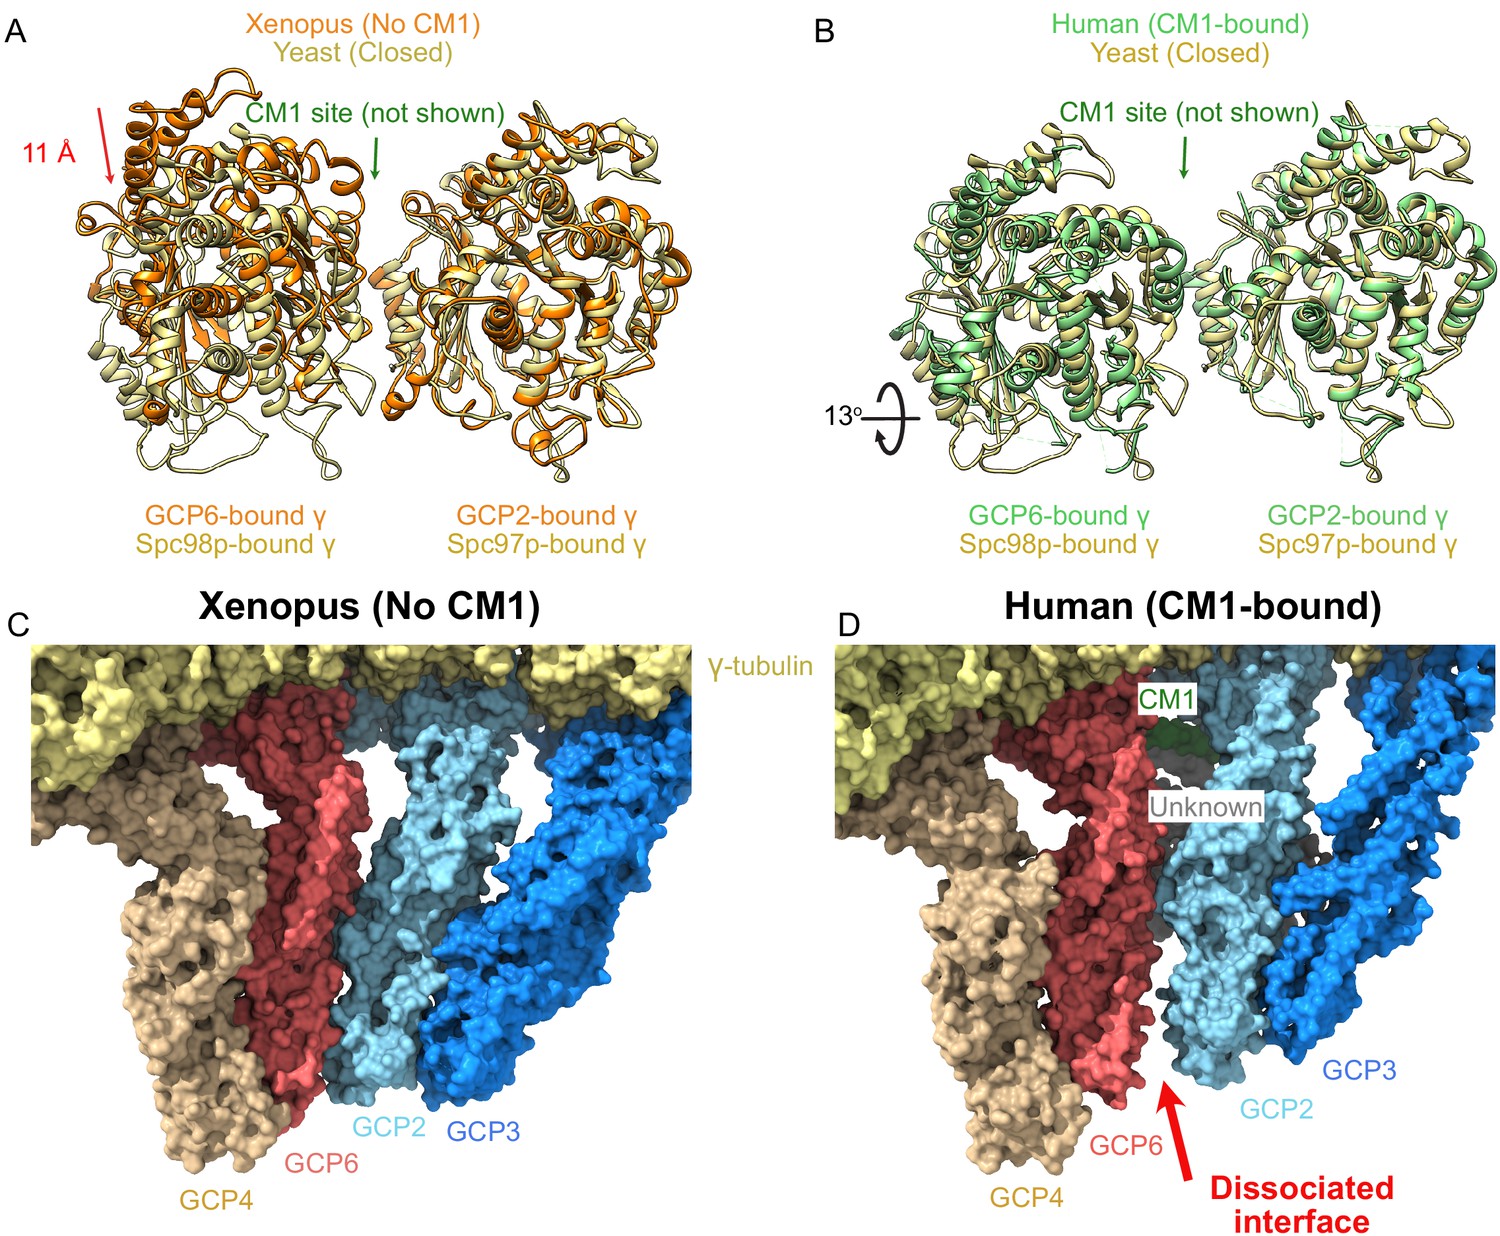
γ-Tubulin ring complex (γTuRC) undergoes large structural changes on centrosomin motif 1 (CM1) binding.
(A, B) Overlay of the two γ-tubulins adjacent to the CM1 binding site observed in the human γTuRC structure for (A) Xenopus (no CM1 bound) and (B) human (CM1-bound) highlighting the large motion upon CM1 binding. Alignment is based on the GCP2-bound γ-tubulin. (C, D) Surface representation of the GCP2/6 interface shows a well-formed interface in the Xenopus (no CM1 bound) γTuRC structure in contrast to the dissociated interface observed in the human (CM1-bound) γTuRC structure.
Figure 8
Model of γ-tubulin ring complex (γTuRC) assembly and activation.
γ-Tubulin small complex (γTuSC) monomers bound to Spc110p display an improved binding for γTuSC due to the presence of the overhanging Spc110pCM1 binding surface. This leads to cooperative assembly of further γTuSCs to form an open γTuRC. The open γTuRC then transitions into a closed structure either prior to or concurrent with microtubule nucleation. Only six full Spc110pCM1 binding sites exist in a fully formed γTuRC, matching the hexagonal Spc42p symmetry at the spindle pole body (Bullitt et al., 1997; Drennan et al., 2019; Muller et al., 2005).
Tables
Key resources table
| Reagent type (species) or resource | Designation | Source or reference | Identifiers | Additional information |
|---|---|---|---|---|
| Software, algorithm | IMP (Integrative Modeling Platform) | https://integrativemodeling.org;https://doi.org/10.1371/journal.pbio.1001244 | RRID:SCR_002982 | Version 2.8 |
| Software, algorithm | UCSF Chimera | https://www.cgl.ucsf.edu/chimera/ https://doi.org/10.1002/jcc.20084 | RRID:SCR_004097 | |
| Strain, strain background (Escherichia coli) | BL21(DE3) CodonPlus-RIL | Agilent | Part No.:230245 | |
| Genetic reagent (Homo sapiens, Saccharomyces cerevisiae) | pET28a-3C-Xrcc4-Spc110(164-207) | This paper | Uniprot:Q13426 (Xrcc4); Uniprot:32380 (Spc110) | Construct contains residues 2–132 of H. sapiens Xrcc4 fused with residues 164–207 of S. cerevisiae Spc110 |
| Software, algorithm | XDS | Kabsch, 2010; DOI: https://doi.org/10.1107/S0907444909047337 | RRID:SCR_015652 | Version: October 15, 2015 |
| Software, algorithm | Phenix | Adams et al., 2010; DOI: https://doi.org/10.1107/S0907444909052925; McCoy et al., 2007; DOI: https://doi.org/10.1107/S0021889807021206; Terwilliger et al., 2008; DOI: https://doi.org/10.1107/S090744490705024X Afonine et al., 2012; DOI:https://doi.org/10.1107/S0907444912001308 | RRID:SCR_014224 | Version 1.10.1_2155 |
| Software, algorithm | Coot | Emsley et al., 2010; DOI: https://doi.org/10.1107/S0907444910007493 | RRID:SCR_014222 | Version 0.8.3 |
| Software, algorithm | Kojak, XL identification algorithm | http://www.kojak-ms.org/ | RRID:SCR_021028 | Versions 1.4.1 and 1.4.3 |
| Software, algorithm | ProXL, protein XL data visualization | https://proxl-ms.org/ | RRID:SCR_021027 | |
| Chemical compound, drug | DSS | Thermo Fisher Scientific | 21655 | |
| Chemical compound, drug | EDC | Thermo Fisher Scientific | A35391 | |
| Chemical compound, drug | Sulfo-NHS | Thermo Fisher Scientific | A39269 | |
| Software, algorithm | cisTEM | Grant et al., 2018.DOI:10.7554/eLife.35383 | RRID:SCR_016502 | Version 1.0 beta |
| Software, algorithm | Relion | Scheres, 2012. PMID:23000701; DOI: 10.1016/j.jsb.2012.09.006 | RRID:SCR_016274 | |
| Genetic reagent (S. cerevisiae) | pFastBac-Tub4p | Vinh et al., 2002. doi: 10.1091/mbc.02-01-0607 | ||
| Genetic reagent (S. cerevisiae) | pFastBac-Spc97p | Vinh et al., 2002. doi: 10.1091/mbc.02-01-0607 | ||
| Genetic reagent (S. cerevisiae) | pFastBac-Spc98p | Vinh et al., 2002. doi: 10.1091/mbc.02-01-0607 | ||
| Genetic reagent (S. cerevisiae) | pFastBac-GST-Spc110p1-220 | Vinh et al., 2002. doi: 10.1091/mbc.02-01-0607 | ||
| Genetic reagent (S. cerevisiae) | pFastBac-Tub4pS58C/G288C | Kollman et al., 2015. DOI: 10.1038/nsmb.2953 |
Additional files
-
Supplementary file 1
X-ray data collection and refinement statistics.
- https://cdn.elifesciences.org/articles/65168/elife-65168-supp1-v1.docx
-
Supplementary file 2
Cryo-EM data collection, processing, and modeling statistics.
- https://cdn.elifesciences.org/articles/65168/elife-65168-supp2-v1.docx
-
Transparent reporting form
- https://cdn.elifesciences.org/articles/65168/elife-65168-transrepform-v1.docx
Download links
A two-part list of links to download the article, or parts of the article, in various formats.
Downloads (link to download the article as PDF)
Open citations (links to open the citations from this article in various online reference manager services)
Cite this article (links to download the citations from this article in formats compatible with various reference manager tools)
CM1-driven assembly and activation of yeast γ-tubulin small complex underlies microtubule nucleation
eLife 10:e65168.
https://doi.org/10.7554/eLife.65168


