Task-specific roles of local interneurons for inter- and intraglomerular signaling in the insect antennal lobe
- Biocenter, Institute for Zoology, and Cologne Excellence Cluster on Cellular Stress Responses in Aging-Associated Diseases (CECAD), University of Cologne, Germany
Figures
Figure 1
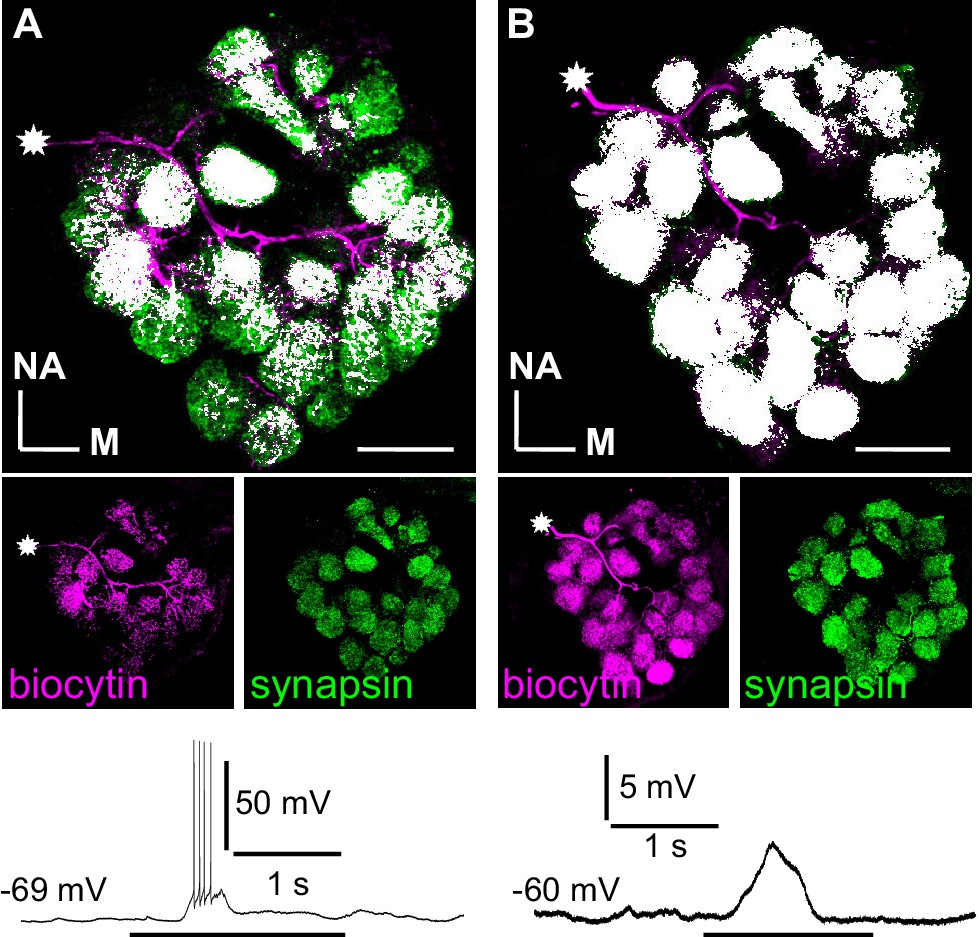
Branching patterns and odorant responses of spiking and nonspiking local interneurons.
A spiking type I (A) and a nonspiking type II local interneuron (B) that were labeled with biocytin/streptavidin via the patch pipette. The glomeruli were visualized by synapsin-LIR. (A) Type I local interneuron. 13 µm stack of optical sections. The neuron innervates many but not all glomeruli and generates action potentials to an odorant stimulus (benzaldehyde). (B) Type II local interneuron. 15 µm stack of optical sections. The neuron innervated all glomeruli and responded to the odorant (benzaldehyde) with a graded depolarization. The stars mark the locations of the somata. Biocytin/streptavidin, magenta; synapsin-LIR, green; double-labeled pixels, white. NA: anterior, M: medial. Scale bars = 100 µm.
Figure 2
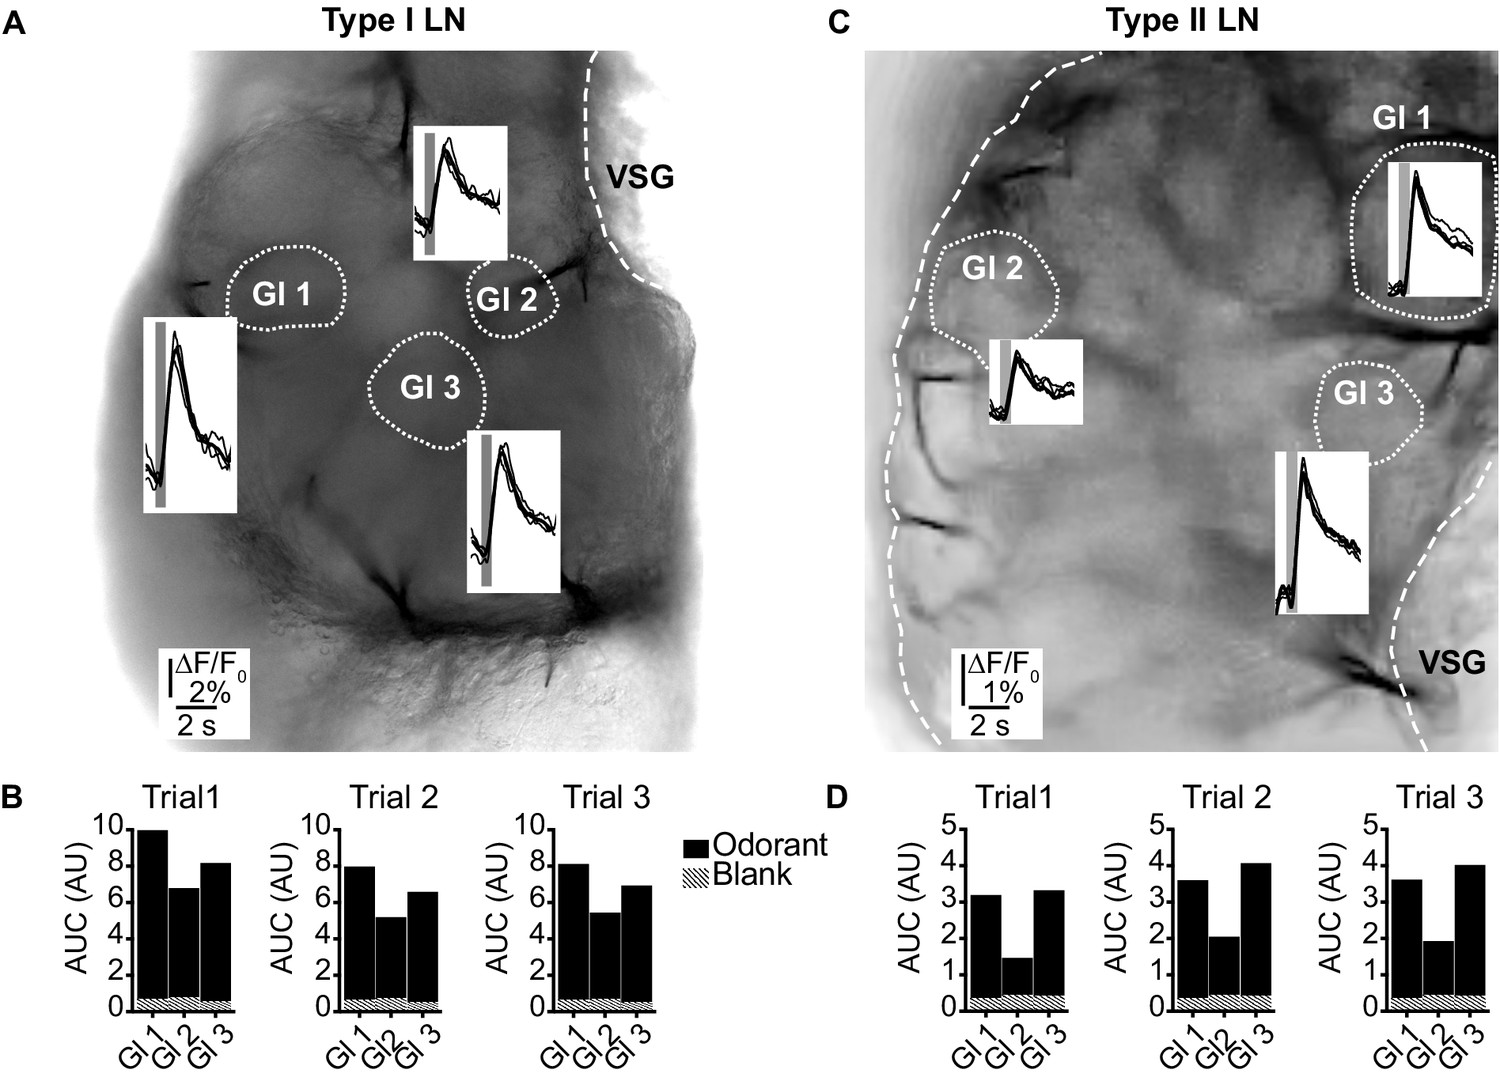
(LNI #24; LNII #1) Odorant-induced glomerular calcium signals are reproducible in type I (A, B) and type II local interneurons (LNs) (C, D).
(A, C) Transmitted light images of an investigated antennal lobes. The dotted lines mark the recorded glomeruli, and the insets show overlays of Ca2+ responses from three trials with the same odorant (hexanol). The gray bars mark the 500 ms odorant stimuli. (B, D) Areas under the curves of the Ca2+ signals that are shown in (A) and (C). The first 3 s after stimulus onset were analyzed. Hatched bars represent control signals to blank stimuli. AUC: area under the curve; Gl: glomerulus; VSG: ventrolateral somata group.
-
Figure 2—source data 1
Numerical data for Figure 2B and D.
- https://cdn.elifesciences.org/articles/65217/elife-65217-fig2-data1-v1.xlsx
Figure 3 with 1 supplement
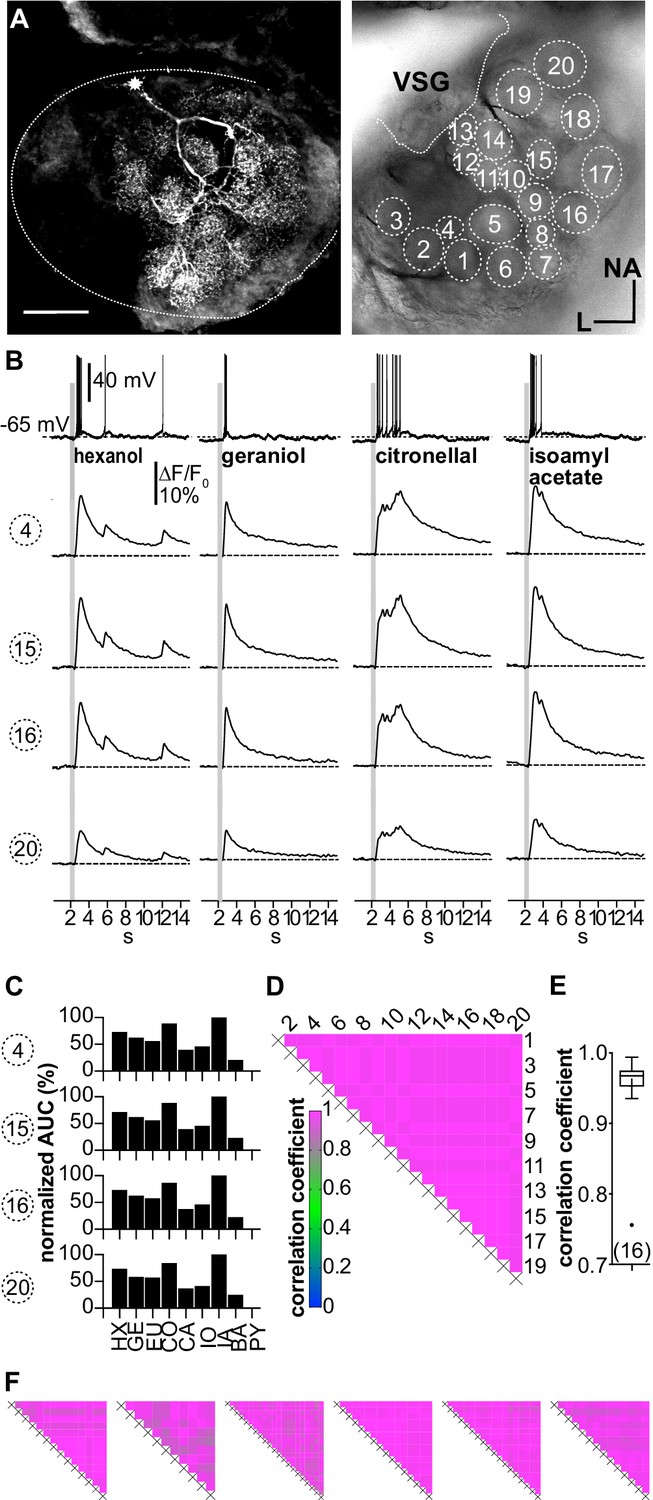
(A–D; LNI #1) Ca2+ imaging in type I local interneurons (LNs) shows uniform glomerular odor responses.
(A) Left: biocytin/streptavidin-labeled type I LN. The antennal lobe (AL) is outlined by the dotted line. The star marks the position of the soma. Scale bar: 100 µm. Right: transmitted light image of the same AL while the neuron was recorded. Orientation applies to both images. The outlined glomeruli mark the regions of interest (individual glomeruli) that were individually analyzed. (B) Electrophysiological responses to four odorants (top traces) and the corresponding Ca2+ dynamics of four glomeruli that are marked in (A). Gray bars represent the 500 ms odorant stimuli. The neuron responded to different odorants with odorant-specific spike trains. The time courses of the Ca2+ signals were similar in all glomeruli for a given odorant. (C) Tuning curves of glomerular responses. Areas under the curves of the odorant-evoked glomerular Ca2+ signals (first 3 s after stimulus onset) were calculated for a set of nine odorants and normalized to the maximum response in the respective glomerulus. Every glomerulus responded most strongly to isoamyl acetate and least to benzaldehyde. (D) Heatmap showing the correlations between the glomerular tuning curves of every imaged glomerulus. Numbers correspond to the glomeruli in (A). All tuning curves were well correlated with coefficients of ~1 (nonparametric Spearman correlation). (E) Mean correlation coefficient across all investigated type I LNs was 0.95 ± 0.06 (N = 16) N values are given in brackets. (F) Heatmaps of correlations between glomerular tuning curves from six additional type I LNs (LNI # 7, 8, 12, 14, 15, 18). HX: hexanol; GE: geraniol; EU: eugenol; CO: citronellal; CA: citral; IO: ionone; IA: isoamylacetate; BA: benzaldehyde; PY: pyrrolidine.
-
Figure 3—source data 1
Numerical data for Figure 3E.
- https://cdn.elifesciences.org/articles/65217/elife-65217-fig3-data1-v1.xlsx
Figure 3—figure supplement 1
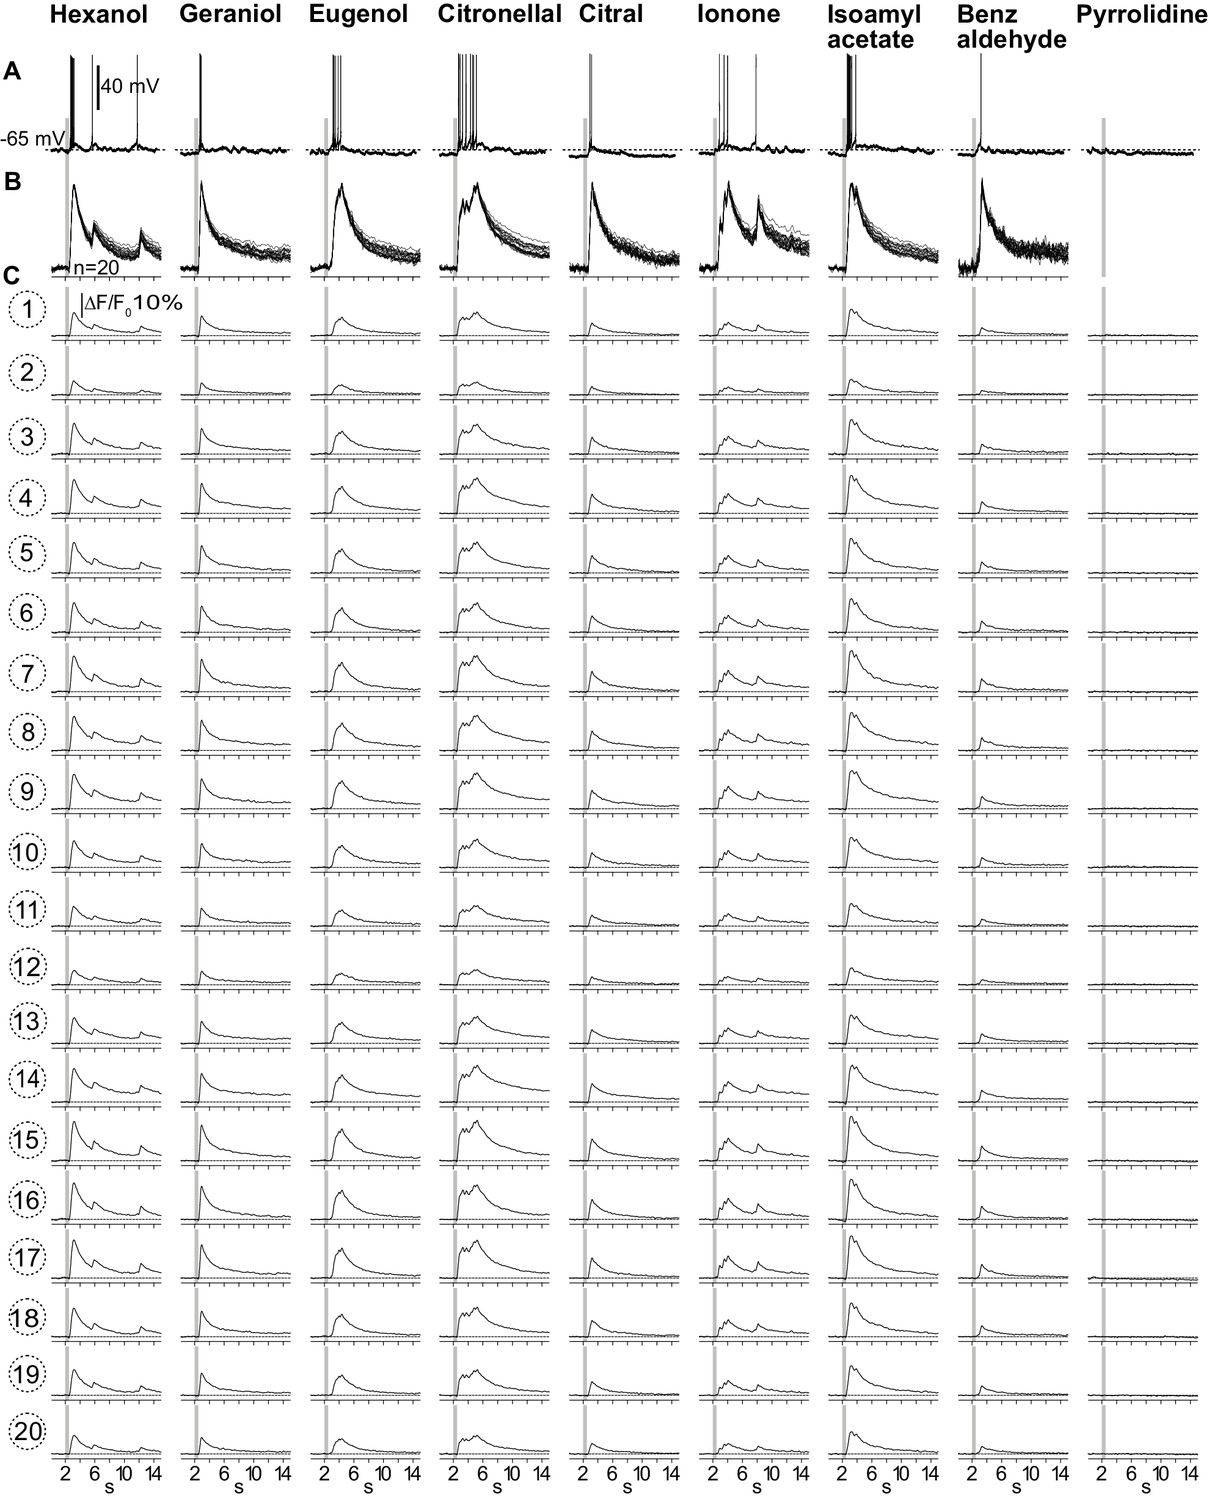
Ca2+ signals from all 20 imaged glomeruli.
(A) Electrophysiological responses to all tested odorants. (B) Scaled overlays of the corresponding Ca2+ signals from all imaged glomeruli (n = 20). The odorant-induced Ca2+ signals were scaled to the same size. (C) Original odorant-induced Ca2+ signals from all glomeruli.
Figure 4 with 1 supplement
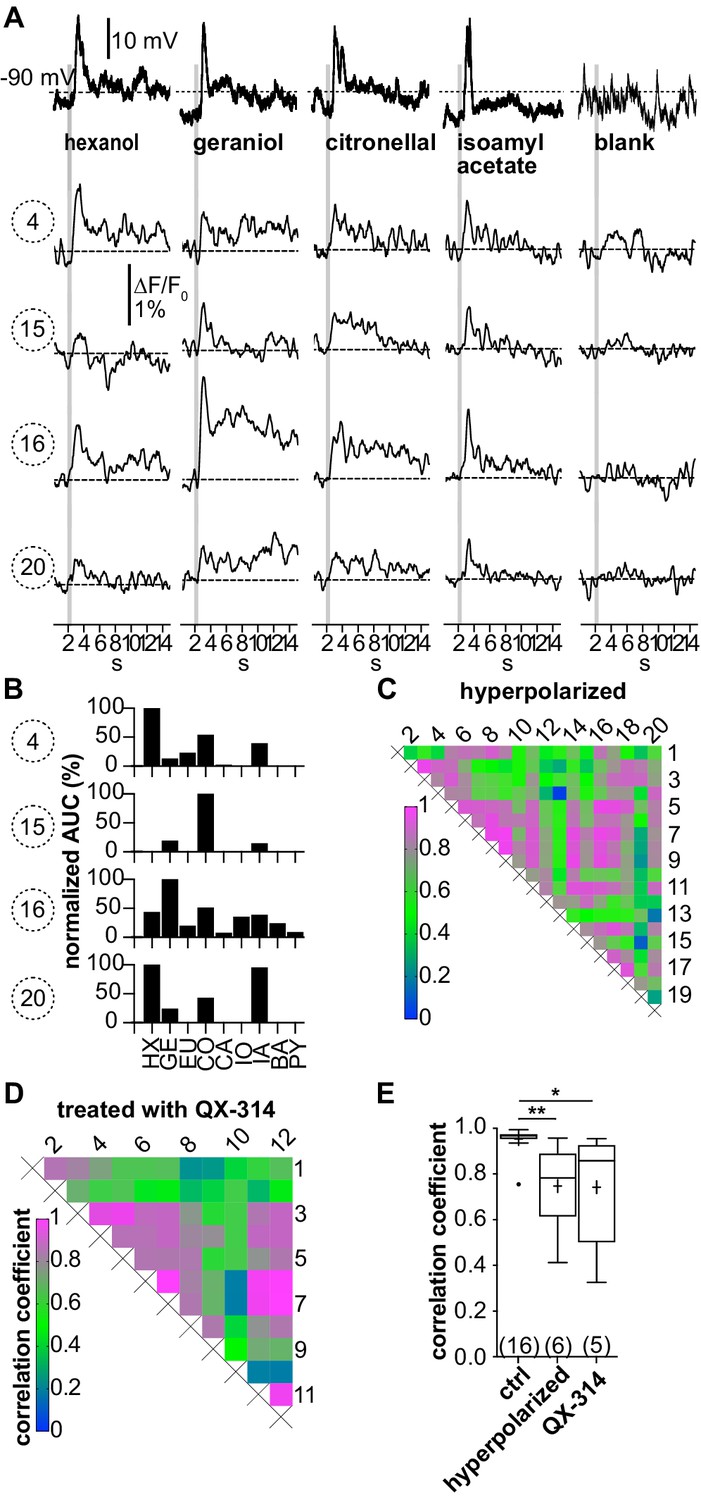
(A–C; LNI #1) Hyperpolarization below the action potential threshold and pharmacological block of action potential firing prevent the correlation between odorant-induced glomerular Ca2+ signals.
Data in (A–C) are taken from the same type I local interneuron (LN) as in Figure 3. (A) Electrophysiological responses to odorants (top traces) and corresponding Ca2+ dynamics in the same four glomeruli as shown in Figure 3. The neuron was hyperpolarized to prevent the generation of action potentials upon stimulation with odorants. Electrophysiologically, the neuron responded with odorant-specific graded depolarizations. The high correlation of the glomerular Ca2+ signals shown in Figure 3 was inhibited. (B) The tuning curves of the glomerular responses (for details, see Figure 3C) varied considerably, whereby the odorant that triggered the maximum Ca2+ signal in each individual glomerulus was different for each glomerulus. (C) Heatmap demonstrating the heterogeneous correlations between glomerular tuning curves. Numbers correspond to glomeruli in Figure 3A. Correlation coefficients ranged between 0 and 0.95 (median = 0.56). (D; LNI #19) Heatmap demonstrating the variable correlations between glomerular tuning curves of a neuron that was treated with the intracellular NaV channel blocker QX-314. Correlation coefficients ranged between 0.2 and 1 (median = 0.7). (E) Mean correlation coefficients of hyperpolarized (0.75 ± 0.19, N = 6, p=0.0073) and QX-314-treated (0.74 ± 0.26, N = 5, p=0.0142) type I LNs were significantly decreased compared to the control group (Kruskal–Wallis and Dunn’s multiple comparisons test). Hyperpolarized and QX-314-treated type I LNs were not significantly different (p>0.9999). *p<0.05, **p<0.01. N values are given in brackets. Abbreviations as in Figure 3F.
-
Figure 4—source data 1
Numerical data for Figure 4E.
- https://cdn.elifesciences.org/articles/65217/elife-65217-fig4-data1-v1.xlsx
Figure 4—figure supplement 1

Tuning curves of all imaged glomeruli from the neuron shown in Figure 4A–C.
Figure 5 with 1 supplement
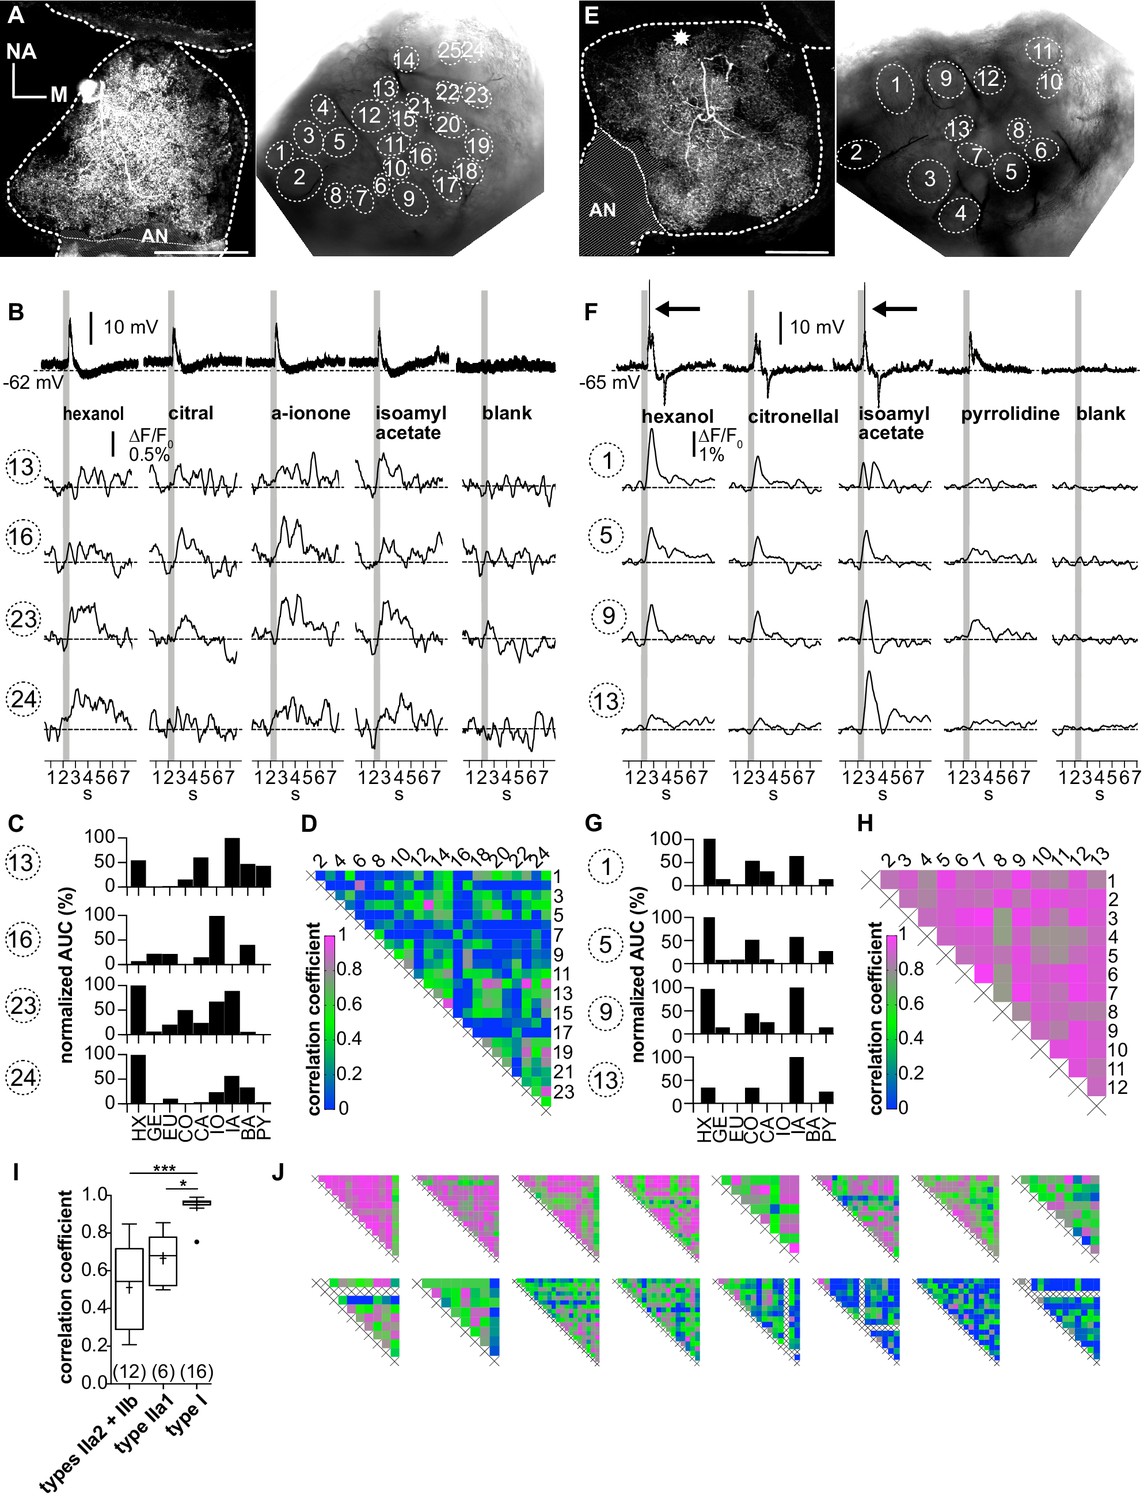
Ca2+ imaging of type II local interneurons (LNs) shows heterogeneous glomerular odorant responses.
Data from a type IIb (A–D, LNII #2) and a type IIa LN (E–H, LNII #3). (A, E) Left: biocytin/streptavidin stainings of the investigated type II LNs. The antennal lobes (ALs) are outlined by the dotted lines. The position of the soma in (E) is marked by the star. Scale bar: 100 µm. Right: transmitted light images of the same ALs during the experiment. Outlined glomeruli were marked as regions of interest and individually analyzed. The orientations of the left and right images are similar. (B, F) Electrophysiological responses to four odorants (top traces) with the corresponding Ca2+ dynamics of four glomeruli that are marked in the images shown in (A) and (E). Gray bars represent the 500 ms odorant stimuli. (B–D) Type IIb LN. (B) The neuron responded similarly to the different odorants with graded depolarizations that were followed by slow hyperpolarizations. The time course and amplitude of the corresponding Ca2+ signals varied in different glomeruli for the different odorants. (C) Tuning curves of glomerular Ca2+ signals (for details, see Figure 3C). The tuning curves of the different glomeruli varied considerably, while the maximum response was induced by different odorants in the different glomeruli. Some glomeruli were narrowly tuned (e.g., glomerulus 16); others were broadly tuned (e.g., glomerulus 23). (D) Heatmap showing the correlations between glomerular tuning curves of every imaged glomerulus. Numbers correspond to glomeruli shown in (A). Correlations between glomerular tuning curves were mostly low, with coefficients ranging between 0 and 0.97 (median = 0.23). (F–H) Type IIa LN. (F) The neuron responded similarly to different odorants with graded depolarizations that could include spikelets (e.g., hexanol, isoamylacetate, arrows mark the spikelets), whereas the time course and amplitude of the corresponding Ca2+ signals mostly varied between different glomeruli for different odorants. (G) Tuning curves of the glomerular Ca2+ signals shown in (F) (for details, see Figure 3C). Groups of glomeruli showed similar tuning curves (e.g., glomeruli 1, 5, and 9), while other glomeruli were individually tuned (e.g., glomerulus 13). (H) Heatmap showing correlations between glomerular tuning curves of every imaged glomerulus. Numbers correspond to the glomeruli marked in (E). Glomerular tuning curves correlated strongly in a subset of glomeruli, while the correlation was low between other glomeruli. Coefficients ranged between 0.72 and 0.98 (median = 0.87). (I) The mean correlation coefficient of spiking type I LNs (0.95 ± 0.06, N = 16) is significantly larger compared to nonspiking type IIa1 LNs that can generate spikelets (0.67 ± 0.12, N = 6, p=0.01) and (pooled) type IIa2 and type IIb LNs, which do not generate spikelets (0.51 ± 0.23, N = 12, p<0.001) (Kruskal–Wallis and Dunn’s multiple comparisons tests). Abbreviations as in Figure 3F. The mean correlation coefficient across all investigated type II LNs was 0.56 ± 0.21 (N = 18). *p<0.05, ***p<0.001. N values are given in brackets. (J) Heatmaps of correlations between glomerular tuning curves from all additional type II LNs in descending order of mean correlation coefficient (upper row: LN II # 5, 4, 1, 7, 6, 9, 8, 10; lower row: LN II # 14, 12, 11, 13, 15, 16, 17, 18). AN: antennal nerve, all other abbreviations as in Figure 3F.
-
Figure 5—source data 1
Numerical data for Figure 5I.
- https://cdn.elifesciences.org/articles/65217/elife-65217-fig5-data1-v1.xlsx
Figure 5—figure supplement 1
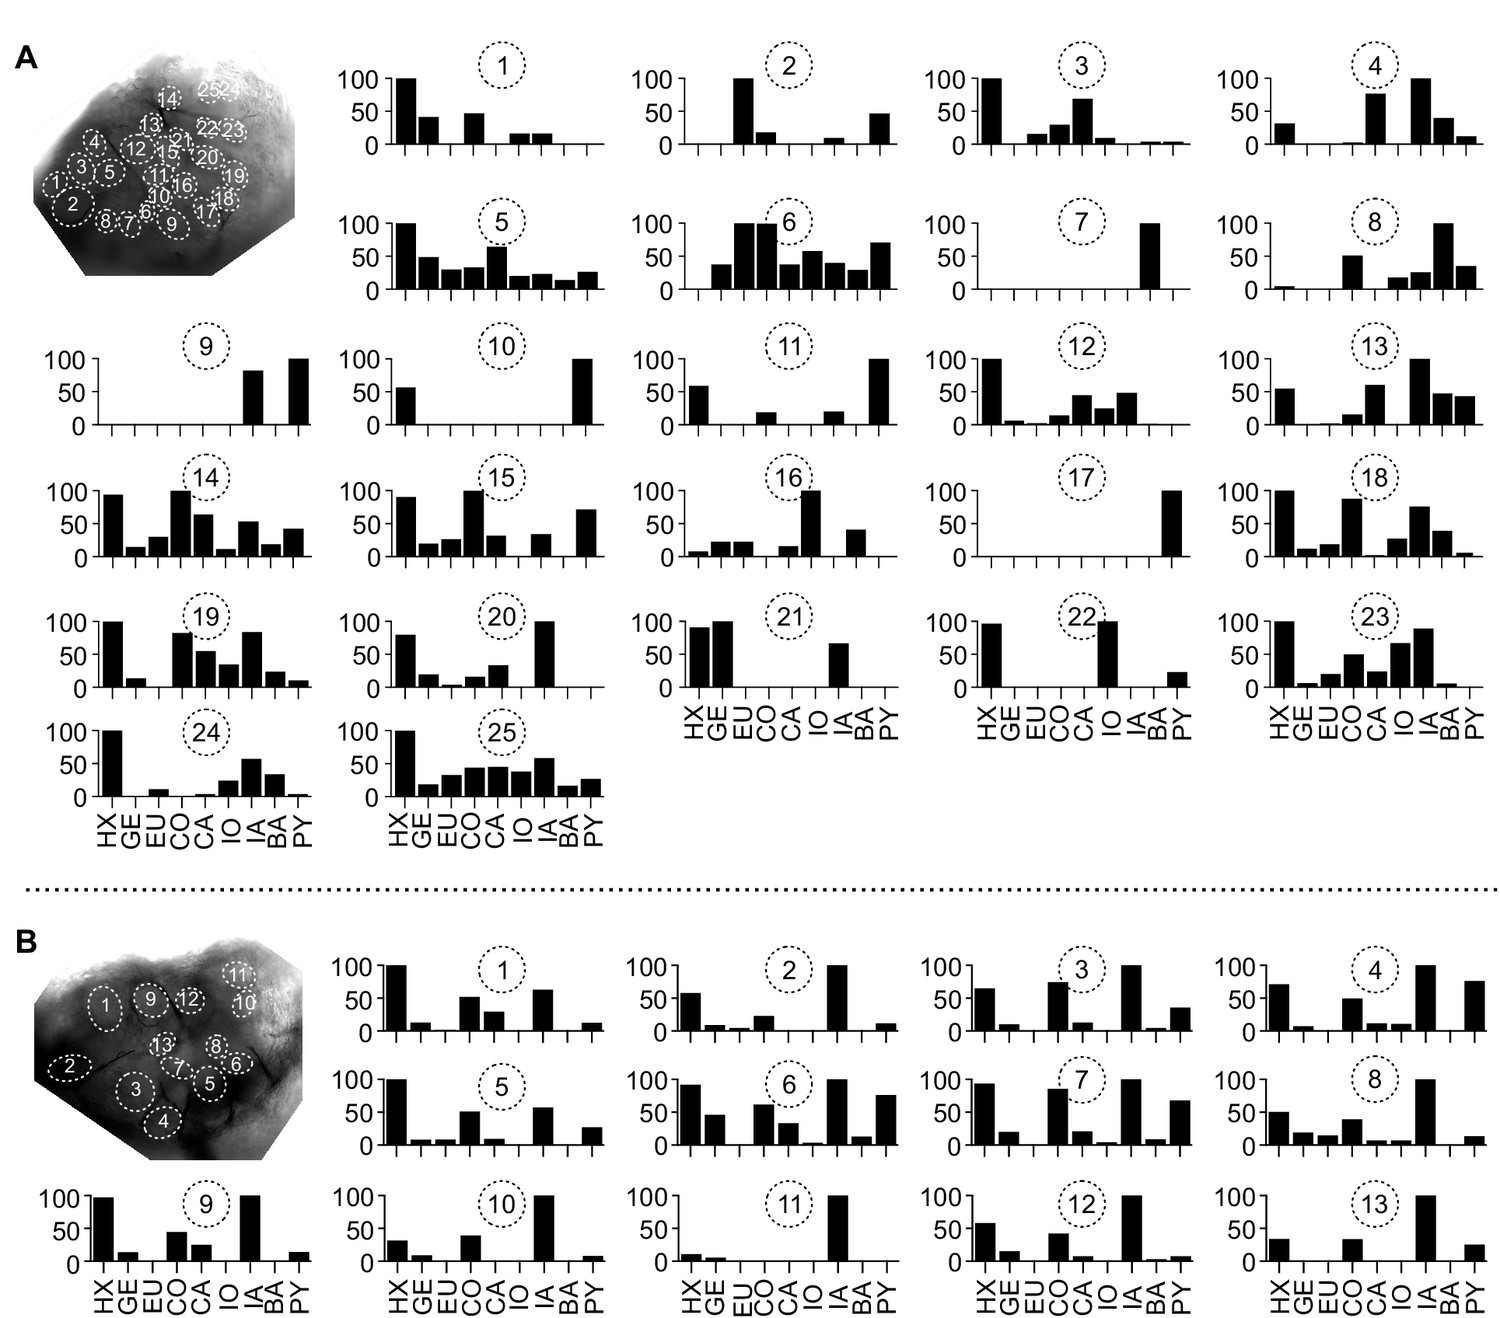
Glomerular tuning curves of all imaged glomeruli.
Tuning curves of all glomeruli from the neurons shown in Figure 5A–D (A) and Figure 5E–H (B). Y-axes show normalized odor response. For details, see Figure 3C. Abbreviations as in Figure 3F.
Author response image 1

Simultaneous electrophysiological and optophysiological recordings of a uniglomerular projection using the ratiometric Ca2+ indicator fura-2.
The projection neuron has its arborization in glomerulus 1. The train of action potentials was induced with a depolarizing current pulse (grey bar).
Tables
Key resources table
| Reagent type (species) or resource | Designation | Source or reference | Identifiers | Additional information |
|---|---|---|---|---|
| Chemical compound, drug | Lidocaine N-ethyl chloride | Alomone | QX-314;#Q-150 | Channel blocker |
| Software, algorithm | Prism | GraphPad | RRID:SCR_002798 | |
| Software, algorithm | ImageJ | https://imagej.net/software/fiji/ | RRID:SCR_003070 | |
| Other | Oregon Green 488 BAPTA-1 hexapotassium salt | Thermo Fisher Scientific | Cat. # O6806 | Calcium indicator |
Additional files
-
Transparent reporting form
- https://cdn.elifesciences.org/articles/65217/elife-65217-transrepform1-v1.docx
-
Source data 1
Individual Neurons.
- https://cdn.elifesciences.org/articles/65217/elife-65217-supp1-v1.xlsx
Download links
A two-part list of links to download the article, or parts of the article, in various formats.
Downloads (link to download the article as PDF)
Open citations (links to open the citations from this article in various online reference manager services)
Cite this article (links to download the citations from this article in formats compatible with various reference manager tools)
Task-specific roles of local interneurons for inter- and intraglomerular signaling in the insect antennal lobe
eLife 10:e65217.
https://doi.org/10.7554/eLife.65217


