Left-right side-specific endocrine signaling complements neural pathways to mediate acute asymmetric effects of brain injury
- Departamento de Biomedicina da Faculdade de Medicina da Universidade do Porto, Instituto de Investigação e Inovação em Saúde, Instituto de Biologia Molecular e Celular, Portugal
- Department of Pharmaceutical Biosciences, Uppsala University, Sweden
- Neuronano Research Center, Department of Experimental Medical Science, Lund University, Sweden
- Department of Molecular Medicine, University of Southern Denmark, Denmark
- Faculty of Mechanics and Mathematics, Lomonosov Moscow State University, Russian Federation
- Faculty of Biology and Biotechnology, National Research University Higher School of Economics, Russian Federation
- Shemyakin–Ovchinnikov Institute of Bioorganic Chemistry RAS, Russian Federation
Figures
Figure 1 with 6 supplements
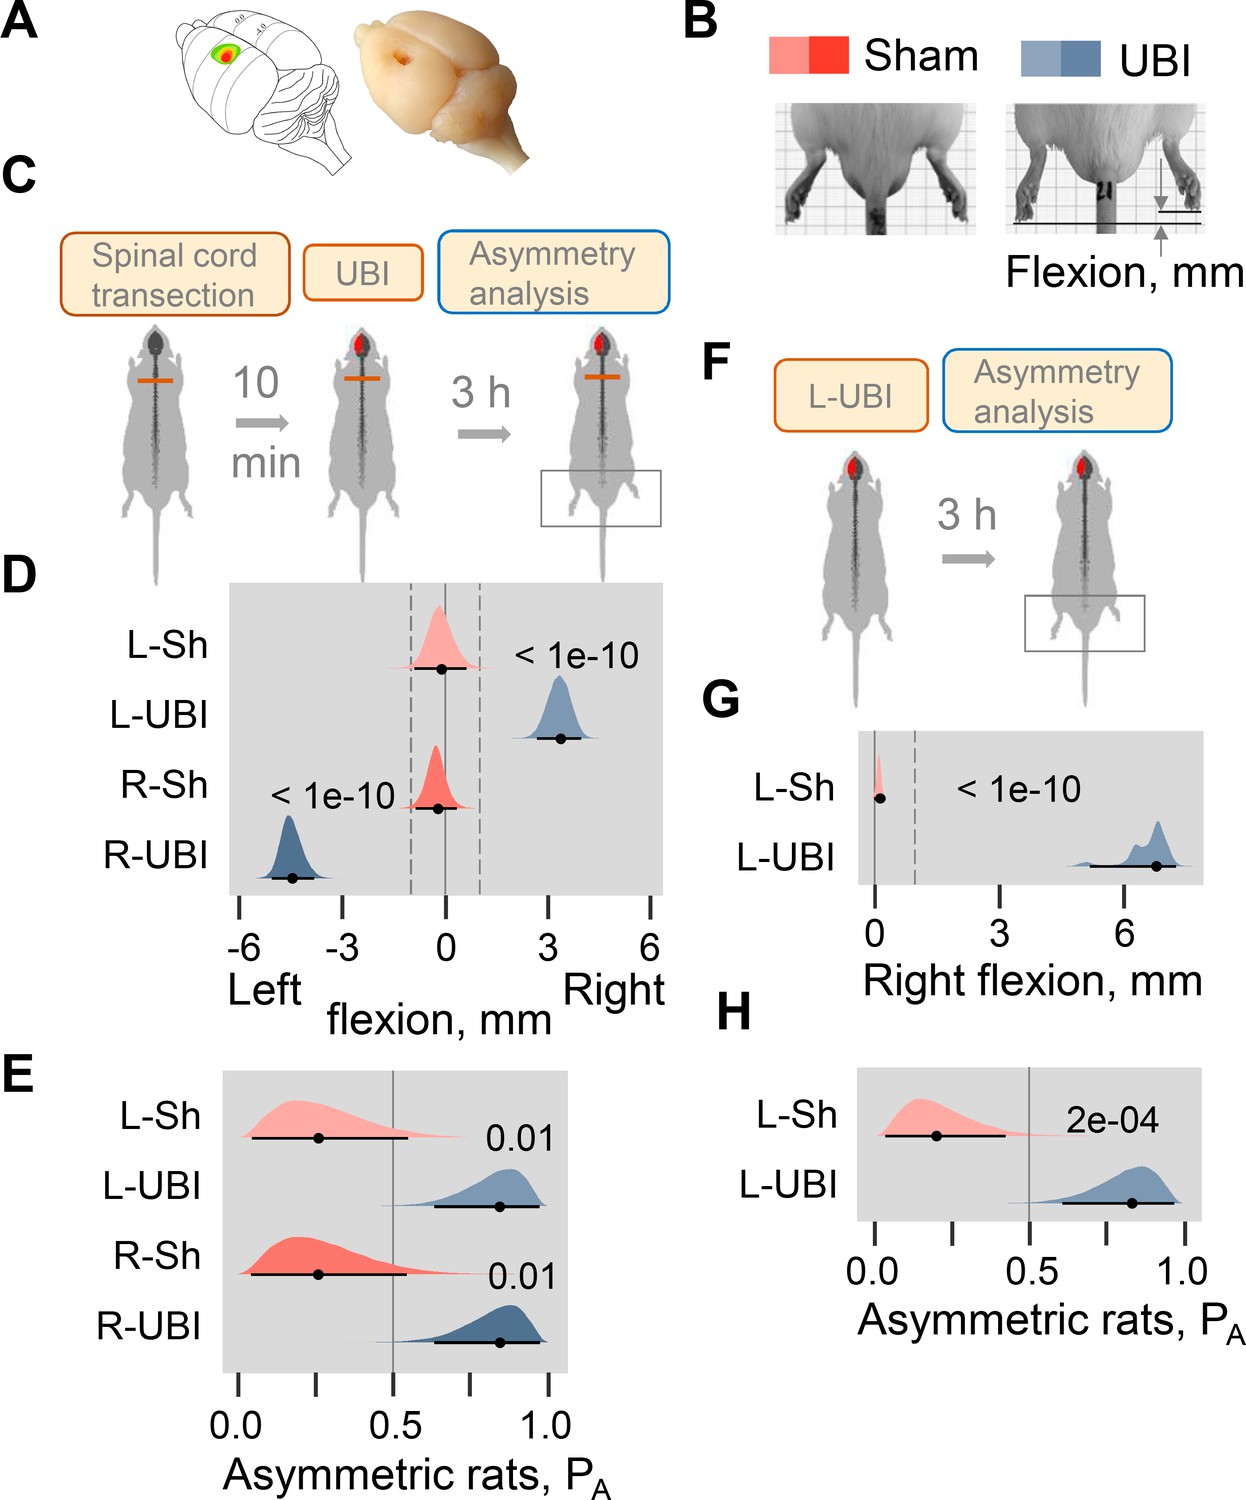
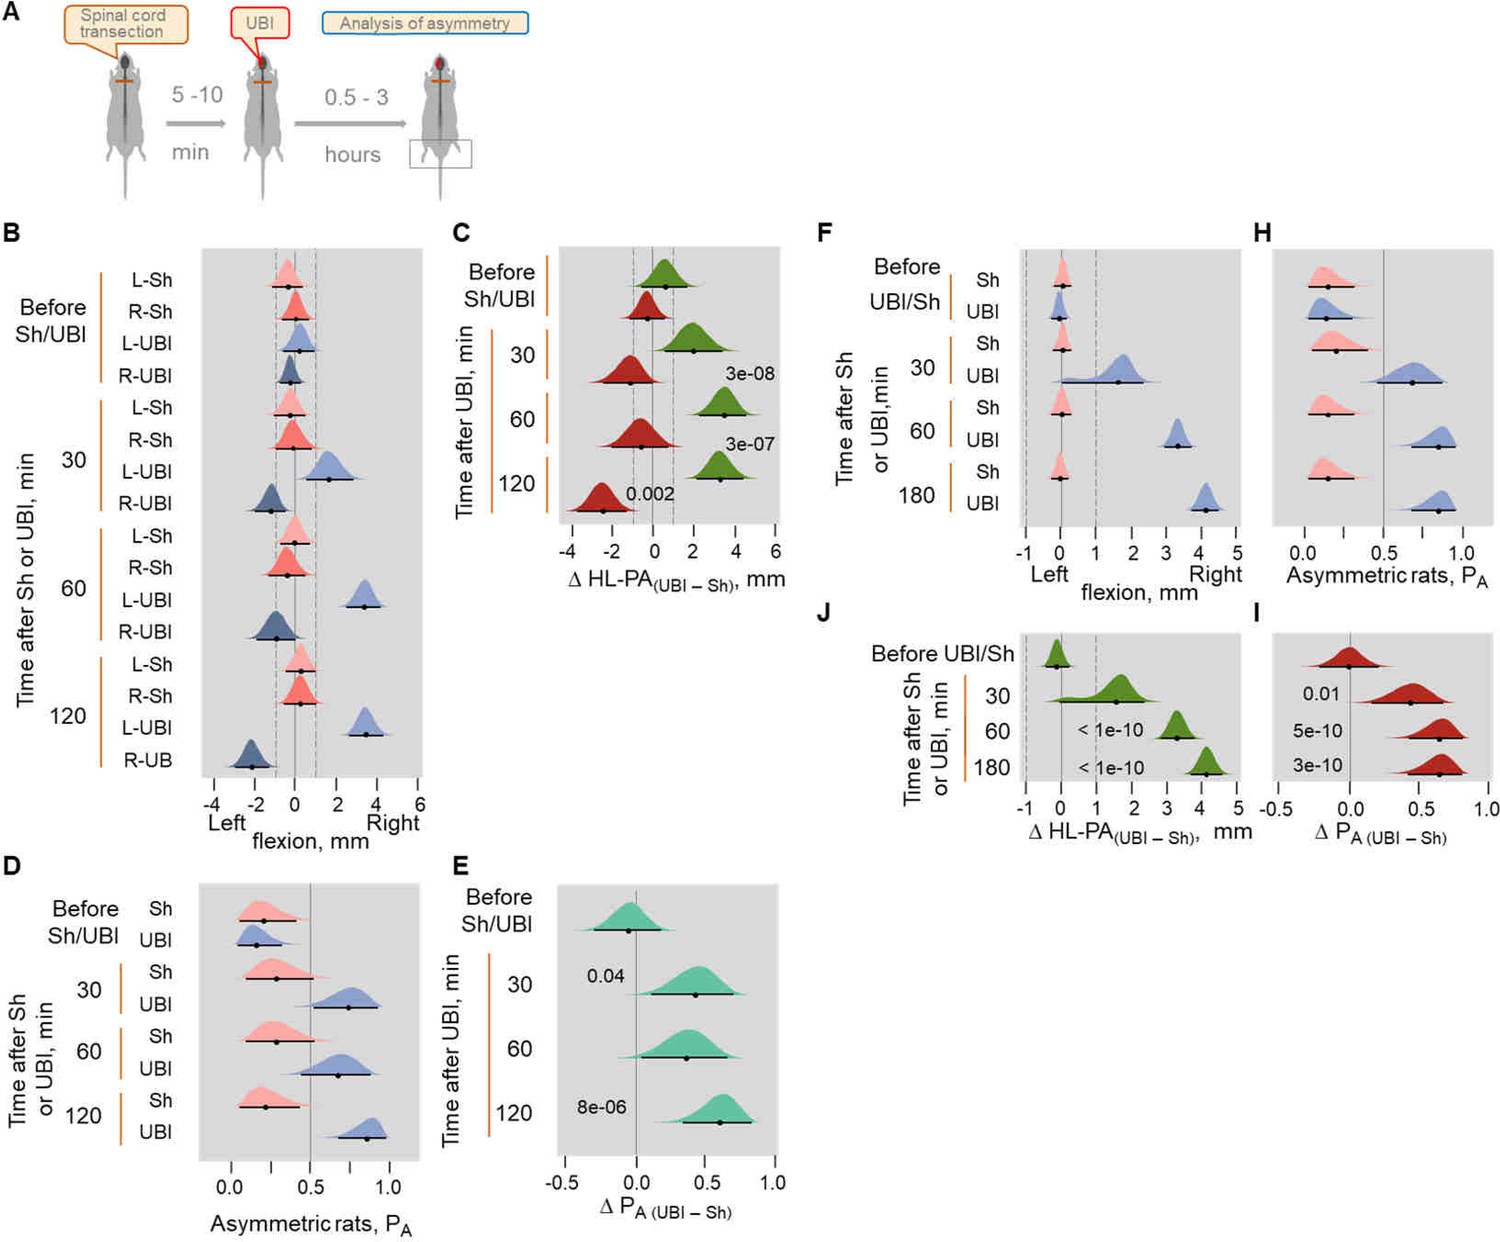
Postural asymmetry of hindlimbs induced by the unilateral ablation of the hindlimb representation area of sensorimotor cortex in rats with completely transected and intact spinal cord analyzed for comparison.
(A) Location of the right hindlimb representation area on the rat brain surface (adapted from Frost et al., 2013) and a representative UBI. (B) HL-PA analysis. (C–E) HL-PA 3 hr after left UBI (n = 9) or right UBI (n = 9), and left (n = 4) or right (n = 4) sham surgery, all performed after complete spinal cord transection. (F–H) HL-PA 3 hr after left UBI (n = 8) or left sham surgery (n = 7) in animals with intact spinal cord. (C,F) Experimental design. (D,G) The HL-PA in millimeters (mm), and (E,H) the probability to develop HL-PA (PA) above 1 mm threshold. Threshold is shown by vertical dotted lines in (D,G). The HL-PA and the probability are plotted as median (black circles), 95% HPDC intervals (black lines), and posterior density (colored distribution) from Bayesian regression. Negative and positive HL-PA values are assigned to rats with the left and right hindlimb flexion, respectively. Effects on asymmetry and differences between the groups: 95% HPDC intervals did not include zero, and adjusted p-values were ≤ 0.05. Adjusted p is shown for differences identified by Bayesian regression.
-
Figure 1—source code 1
Source code for Figure 1D,E.
- https://cdn.elifesciences.org/articles/65247/elife-65247-fig1-code1-v1.zip
-
Figure 1—source data 1
The EXCEL source data file contains HL-PA data for panels D, E, G and H of Figure 1.
- https://cdn.elifesciences.org/articles/65247/elife-65247-fig1-data1-v1.xlsx
Figure 1—figure supplement 1
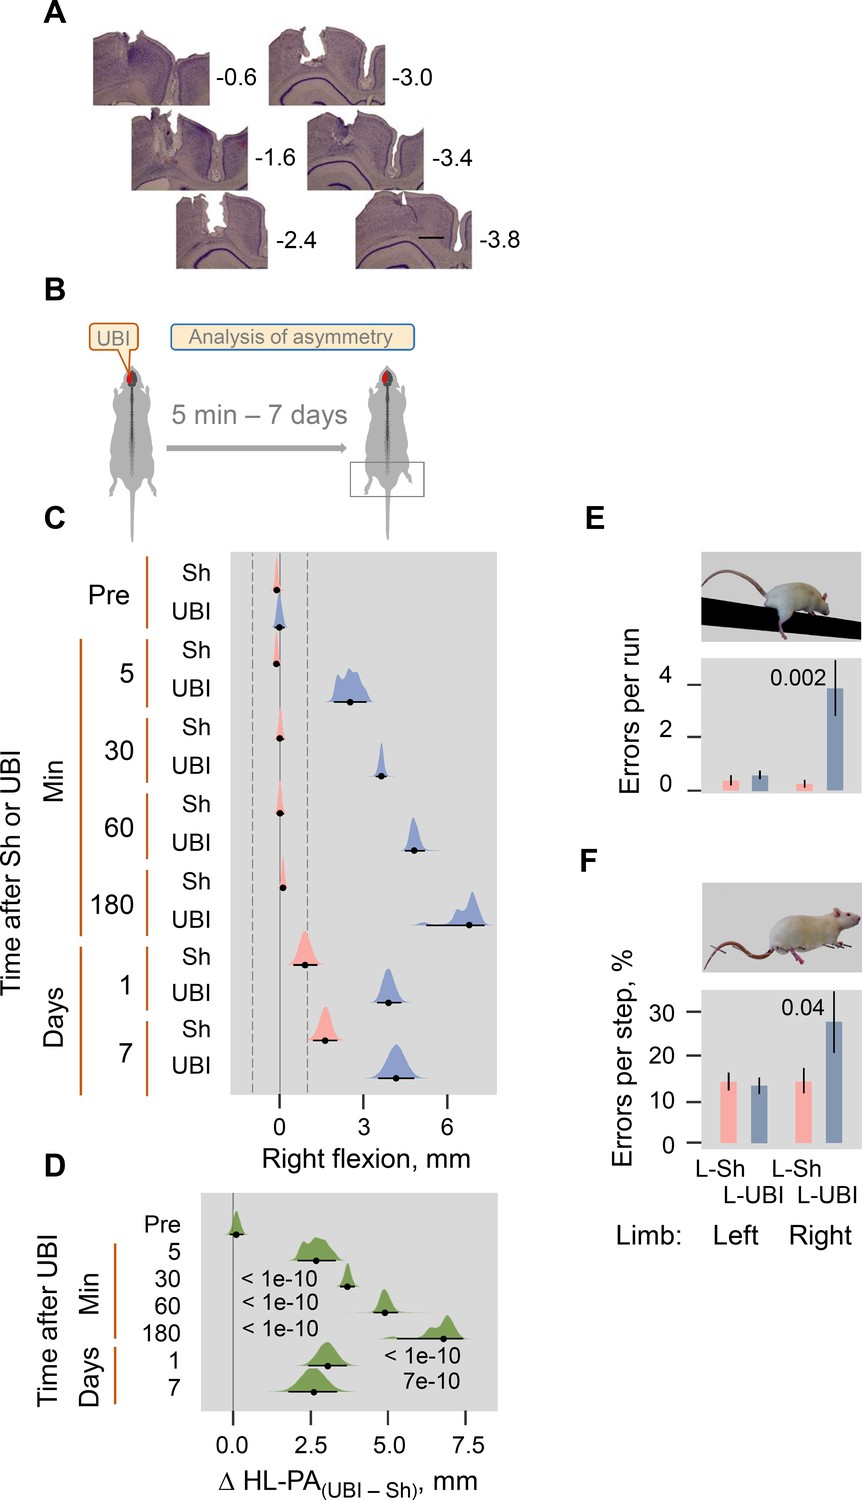
Histological verification and UBI-produced HL-PA and motor deficits in the beam-walking and ladder rung tests in rats with intact spinal cord.
(A) Histological verification of the size and location of UBI resulting from a stereotaxic aspiration of brain tissue at the following coordinates: 0.5–4.0 mm posterior to the bregma and 1.8–3.8 lateral to the midline. Series of Nissl-stained coronal brain sections show representative lesions of the rat sensorimotor cortex. The numbers on the right indicate distances (in mm) from bregma. Scale bar = 1 mm. Sections were analyzed from most rats in the study. The general distribution pattern and the extent of the lesions were reliably similar across subjects. (B) Experimental designs for (C,D). (C,D) The HL-PA was analyzed before (Pre) and after left UBI (UBI) or left sham surgery (Sh) within 5 min and at the 30, 60, and 180 min time points while they were still under pentobarbital anesthesia (UBI, n = 8, Sh, n = 7); and at the 1 and 7-day time points under isoflurane anesthesia (UBI, n = 12; Sh, n = 8). (C) HL-PA expressed in millimeters, mm. Negative and positive HL-PA values are assigned to rats with the left and right hindlimb flexion, respectively. (D) Differences in HL-PA [Δ HL-PA(UBI – Sh) in millimeters] between UBI and sham surgery goups. Medians, 95% HPDC intervals and densities from Bayesian sampler are plotted. Contrasts between the groups: 95% HPDC intervals did not include zero, and adjusted p-values were ≤ 0.05. Adjusted p is shown for differences identified by Bayesian regression. (E,F) The left UBI (L-UBI)-produced motor deficits in the beam-walking and ladder rung tests 1 day after the injury. The number of errors (slips) of the contralesional hindlimb in the UBI rats was significantly higher compared to the ipsilesional limb in these animals, and when compared to both hindlimbs in rats with sham surgery. Data are Mean ± SEM analyzed by two-way ANOVA followed by the Tukey HSD post-hoc test. (B) The main effect of left UBI (F1,36 = 8.21, p = 0.007) and hindlimb side (F1,36 = 5.80, p = 0.021); interaction: F1,36 = 6.78, p = 0.01. Right limb in the left UBI (n = 12) versus either left and right limb in left sham surgery (L-Sh; n = 8; p = 0.002), or left limb in the left UBI (P = 0.002) group. (C) The main effect of the left UBI (F1,34 = 3.43, p = 0.072) and hindlimb side (F1,34 = 4.11, p = 0.050); interaction: F1,34 = 4.22, p = 0.048. Right limb in the left UBI (n = 11) versus either right limb in left sham surgery (n = 8; p = 0.043) or left limb in the left UBI (p = 0.017) group.
Figure 1—figure supplement 2
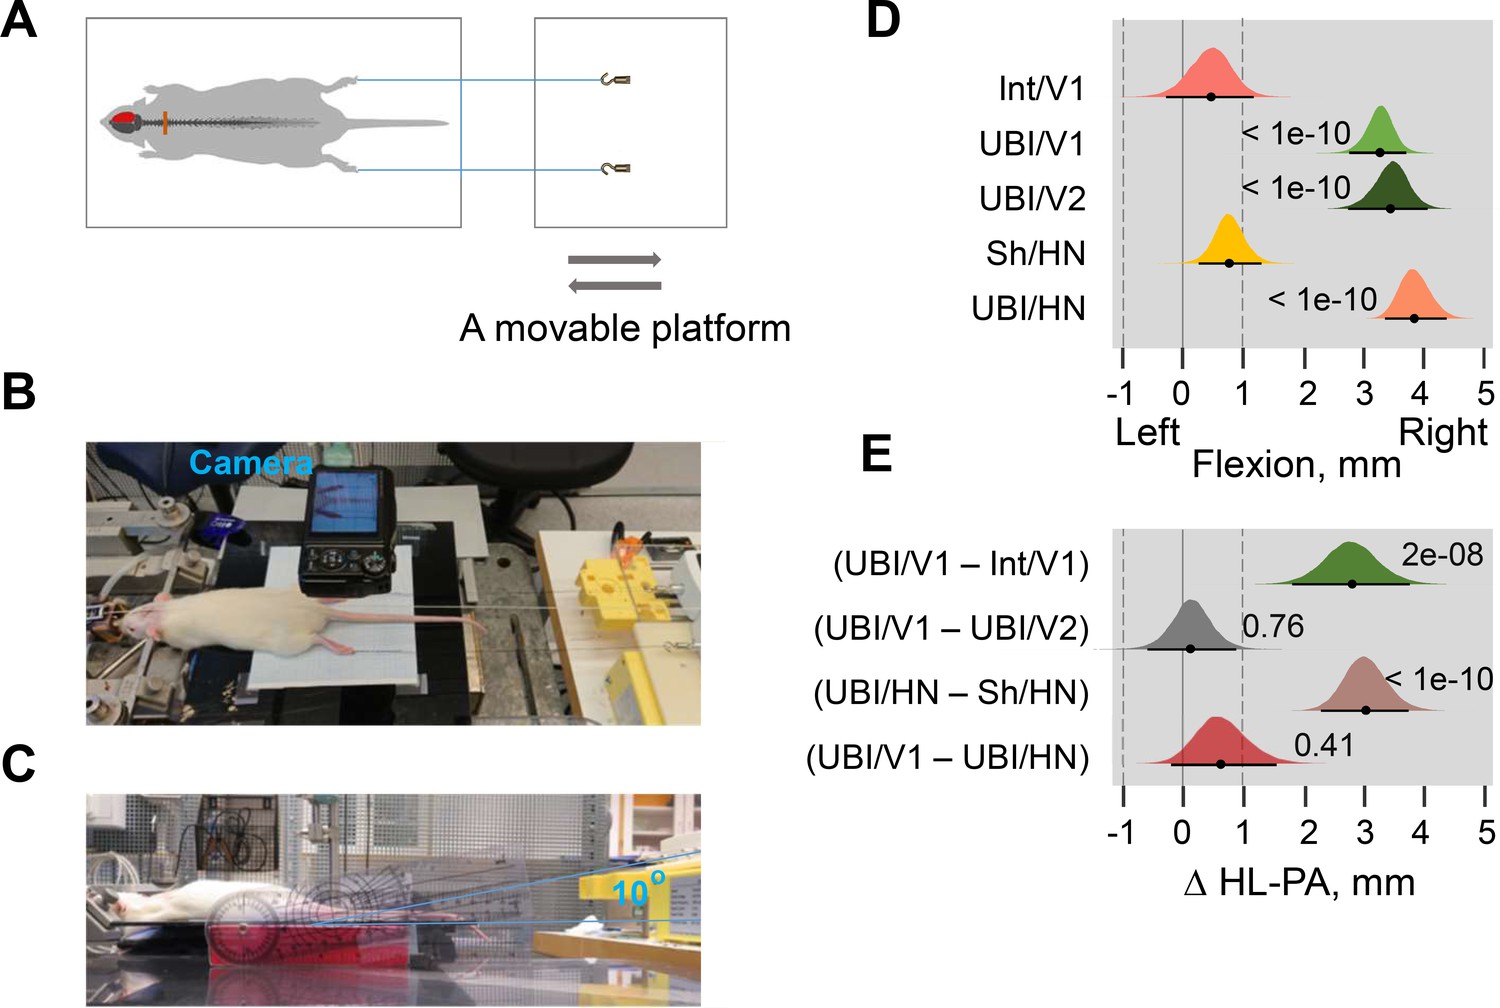
Analysis of HL-PA by the hands-off method of hindlimb stretching followed by photographic recording of the asymmetry.
(A–C) Experimental setup. The anesthetized Sprague Dawley rats were placed on the bench in the prone position. Silk threads were glued to the nails of the middle three toes of both hindlimbs, and their other ends were tied to hooks attached to the movable platform that was operated by a micromanipulator. To reduce friction of hindlimbs with the surface upon changes in their position, the bench under the rat was covered with plastic sheet and the movable platform was raised up to form a 10° angle between the threads and the bench surface. First, stretching was initiated at the ‘natural’ hindlimb position that was either symmetric or asymmetric, and performed for the 20 mm distance at the 2 cm/s speed (Variant 1, V1; Figure 1—video 1, episodes 1 and 2). Second, the limbs were adjusted to approximately symmetric position by gentle pulling the thread on the flexed limb and then stretched at 2 cm/s for the 15 mm distance (Variant 2, V2; Figure 1—video 1, episode 3). The threads were then relaxed, the limbs were set free, and the resulting HL-PA was photographically recorded. The procedure was repeated six times in succession, and the mean value of postural asymmetry for a given rat was calculated and used in statistical analyses. (D) The HL-PA in intact rats (Int; n = 5) and rats with left UBI (n = 5) analyzed by the Variants 1 (V1) or 2 (V2) of the hands-off method (Int/V1, UBI/V1 and UBI/V2); and rats with left sham surgery (Sh/HN; n = 8) or left UBI (UBI/HN; n = 12) analyzed by the hands-on (HN) method. The UBI and sham surgery were performed 1 day before the HL-PA analysis. Negative and positive HL-PA values were assigned to rats with the left and right hindlimb flexion, respectively, and are shown in mm. Medians, 95% HPDC intervals and densities from Bayesian sampler are plotted. (E) Contrasts between (a) the UBI and intact rats analyzed by the hands-off Variant 1 (V1) method [Δ HL-PA (UBI/V1 – Int/V1)]; (b) the UBI rats analyzed by the hands-off Variant 1 (V1) and Variant 2 (V2) methods [Δ HL-PA (UBI/V1 – UBI/V2)]; (c) the UBI and sham surgery rats [Δ HL-PA (UBI/HN – Sh/HN)] analyzed by the hands-on method [Δ HL-PA (UBI/HN – Sh/HN)]; and (d) the UBI rats analyzed by the hands-off Variant one method and the hands-on method [Δ HL-PA (UBI/V1 – UBI/HN)]. Effects on asymmetry and differences between the groups: 95% HPDC intervals did not include zero, and adjusted p-values were ≤ 0.05. p is shown for differences of HL-PA from zero (0 corresponds to a symmetric pattern) in (D), and contrasts between the groups in (E). Both variants 1 and 2 (V1 and V2) of the hands-off method, and the hands-on method produced virtually the same results; no differences (p > 0.40) in the magnitude and its direction were revealed between them.
Figure 1—figure supplement 3
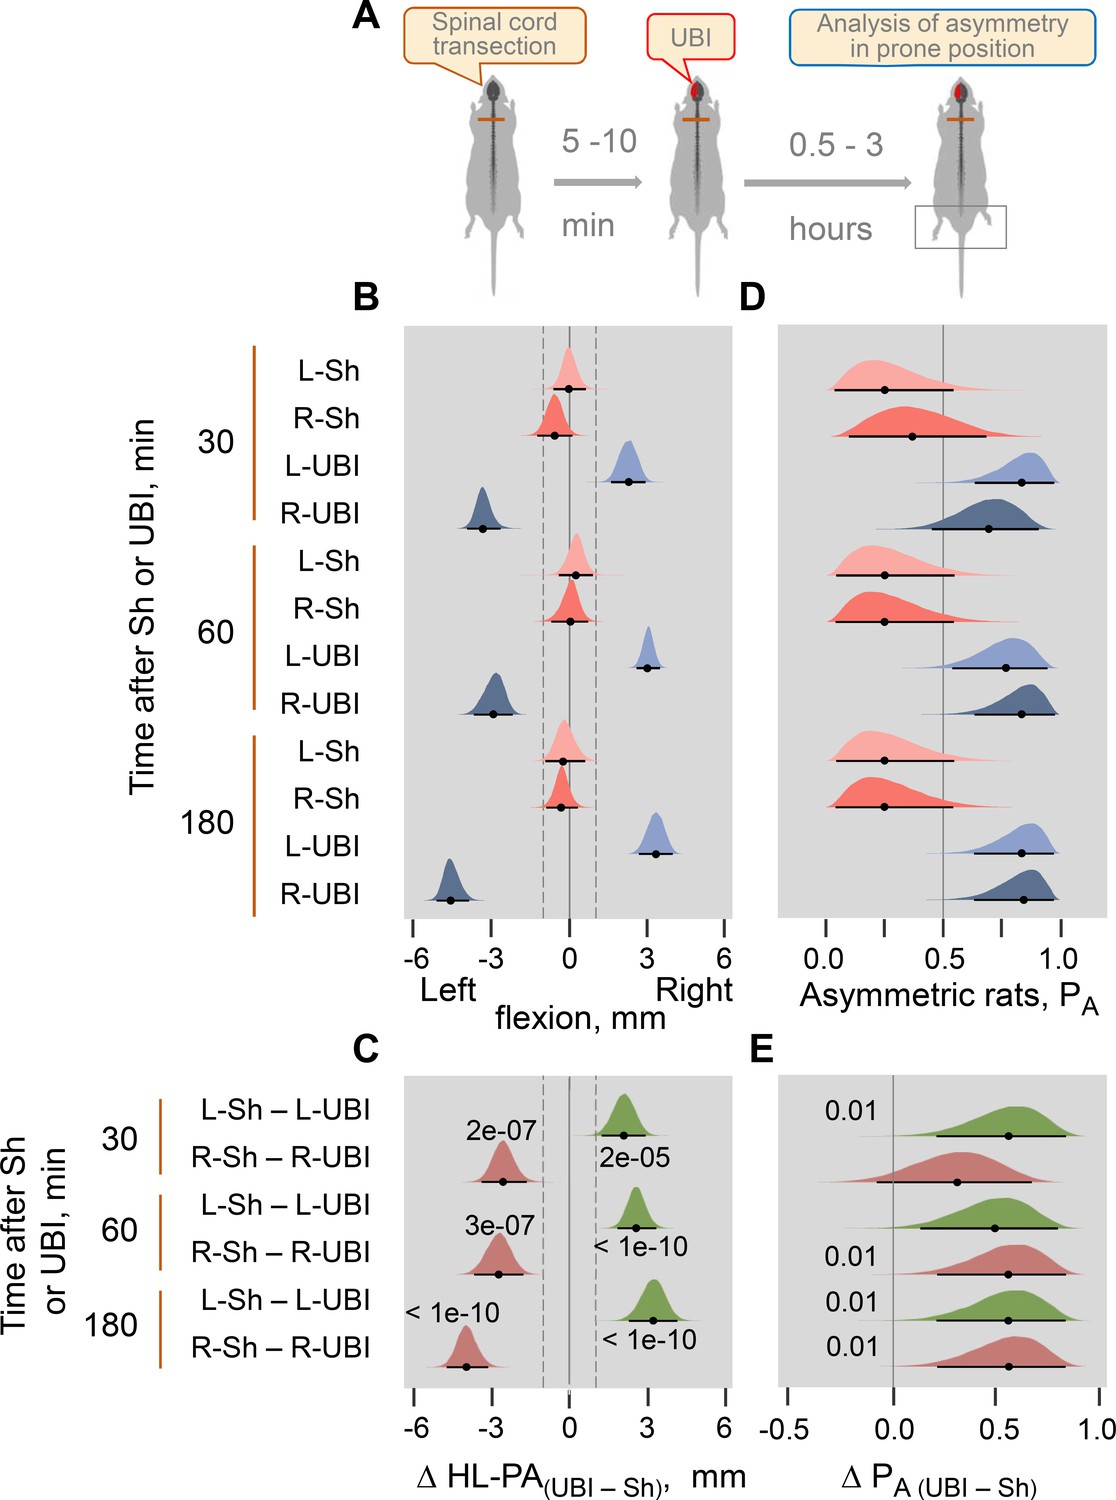
Time-course of HL-PA formation after the left-side (L-UBI) and right-side (R-UBI) UBI in Wistar rats with transected spinal cord.
(A) Experimental designs. The UBI was conducted 5–10 min after complete spinal cord transection at the T2-T3 level. The HL-PA was analyzed while the rats were under pentobarbital anesthesia 30, 60, and 180 min after the brain injury. Data presented for the 180 min time point on Figure 1D,E, are shown here for comparison. The left UBI and right UBI groups consisted of nine rats each, while the control groups consisted of four left- (L–Sh) and four right- (R–Sh) sham animals. (B,D) Effects of UBI on the formation of HL-PA (expressed in millimeters, mm), and on the probability to develop HL-PA (PA) are shown. The rats with HL-PA magnitude greater than the 1 mm threshold (i.e. 99th HL-PA magnitude percentile in sham groups; shown by vertical dashed lines) were defined as asymmetric. Negative and positive HL-PA values are assigned to rats with the left and right hindlimb flexion, respectively. (C,E) Differences in the HL-PA [Δ HL-PA(UBI – Sh) in millimeters] and in the probability to develop HL-PA [Δ PA (UBI – Sh)] between UBI and sham surgery groups are shown. Medians, 95% HPDC intervals and densities from Bayesian sampler are plotted. Contrasts between the groups: 95% HPDC intervals did not include zero, and adjusted p-values were ≤ 0.05. Adjusted p is shown for differences identified by Bayesian regression.
Figure 1—figure supplement 4
UBI induced formation of HL-PA in Sprague Dawley (B–E) and Wistar (F–I) rats with transected spinal cord.
(A) Experimental design. Induction of HL-PA by the UBI in rats with transected spinal cord. (B–E) The HL-PA in Sprague Dawley rats was analyzed with rats under pentobarbital anesthesia at 30, 60, and 120 min after the left (n = 5) or right (n = 6) UBI, and the left (n = 5) or right (n = 5) sham surgery performed after complete spinal cord transection at the T2-T3 level. (D,E) The left and right UBI groups, as well as the left and right sham surgery groups were combined into the UBI and sham groups, respectively. (F–I) The HL-PA in Wistar rats was analyzed in rats under pentobarbital anesthesia at 30, 60, and 180 min after the left UBI (n = 12) and the left sham surgery (n = 11) performed after complete spinal cord transection at the T2-T3 level. Negative and positive HL-PA values are assigned to rats with the left and right hindlimb flexion, respectively. Differences in the HL-PA [ΔHL-PA(UBI – Sh) in millimeters] and in the probability to develop HL-PA [ΔPA(UBI – Sh)] between UBI and respective sham surgery groups. Medians, 95% HPDC intervals and densities from Bayesian sampler are plotted. Contrasts between the groups: 95% HPDC intervals did not include zero, and adjusted p-values were ≤ 0.05. Adjusted p is shown for differences identified by Bayesian regression.
Figure 1—figure supplement 5
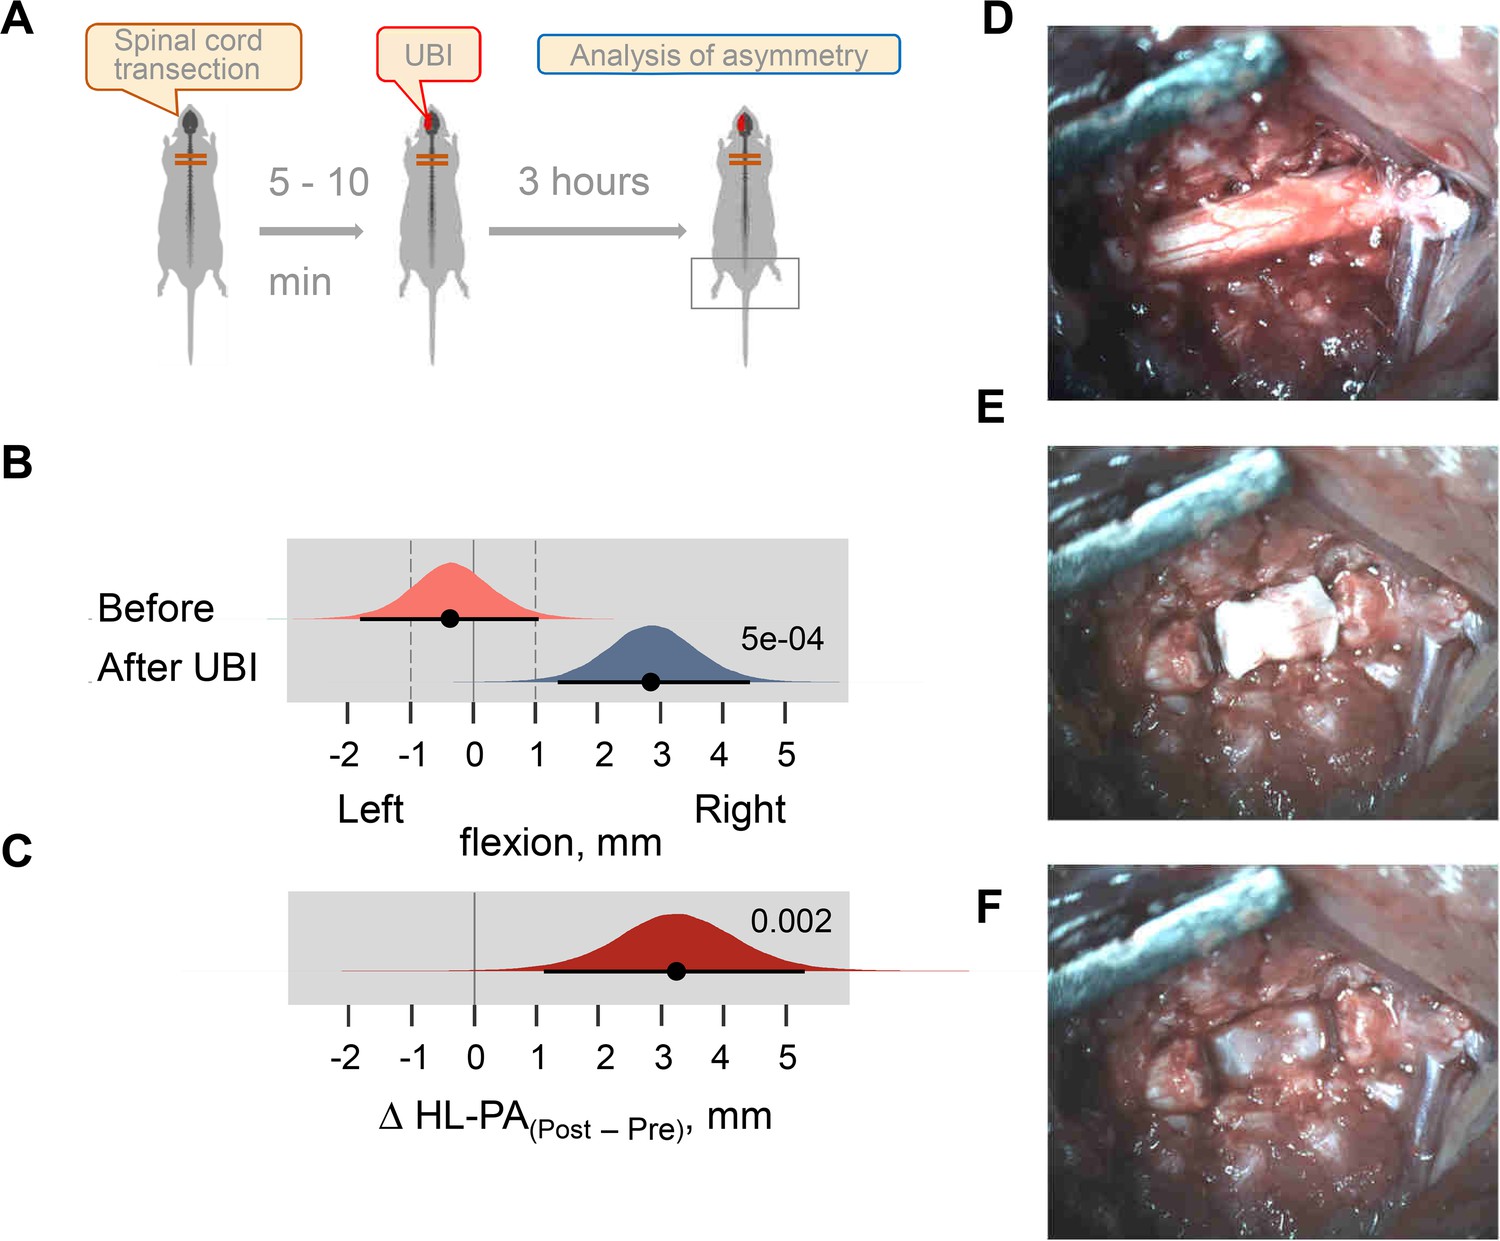
Induction of HL-PA by the left UBI in Sprague Dawley rats with dissected spinal cord segment.
(A) Experimental design. A 3–4 mm spinal cord segment at the T2-T3 level was dissected and removed. (B,C) The HL-PA was analyzed with rats under pentobarbital anesthesia before and 180 min after the UBI (n = 5). Negative and positive HL-PA values are assigned to rats with the left and right hindlimb flexion, respectively. Medians, 95% HPDC intervals and densities from Bayesian sampler are plotted. Contrasts between the analyses: 95% HPDC intervals did not include zero, and adjusted p-values were ≤ 0.05. p is shown for (B) differences from zero in HL-PA analyzed 3 hr after UBI (0 corresponds to a symmetric pattern), and (C) differences between HL-PA analyzed 3 hr after UBI (Post) and before it (Pre) [Δ HL-PA (Post – Pre)]. (D–F) Photographs show the spinal cord after laminectomy at the T2-T4 level (the rostral-caudal direction is from right to left) before (D) and after dissection of the 3–4 mm segment (E) that was then removed (F). Inspection under the microscope demonstrate that the transection is complete. The posterior longitudinal ligament, which spreads over the posterior aspects of the vertebral bodies in the vertebral canal, can be clearly seen (with no remains of other tissues) in the image (F).
Figure 1—video 1
Video recording of HL-PA by the hands-off method (see Materials and methods) in intact rat (episode 1), and rat subjected to the left UBI 1 day before the analysis (episodes 2 and 3).
First, stretching was initiated at the ‘natural’ hindlimb position that was either symmetric or asymmetric, and performed for the 20 mm distance at a speed of 2 cm/s (episodes 1 and 2, respectively). Second, the limbs were adjusted to an approximately symmetric position by gentle pulling the thread on the flexed limb and then stretched at a speed of 2 cm/s for the 15 mm distance (episode 3). Then the threads were relaxed, the limbs were set free and the resulting HL-PA was photographically recorded.
Figure 2 with 3 supplements
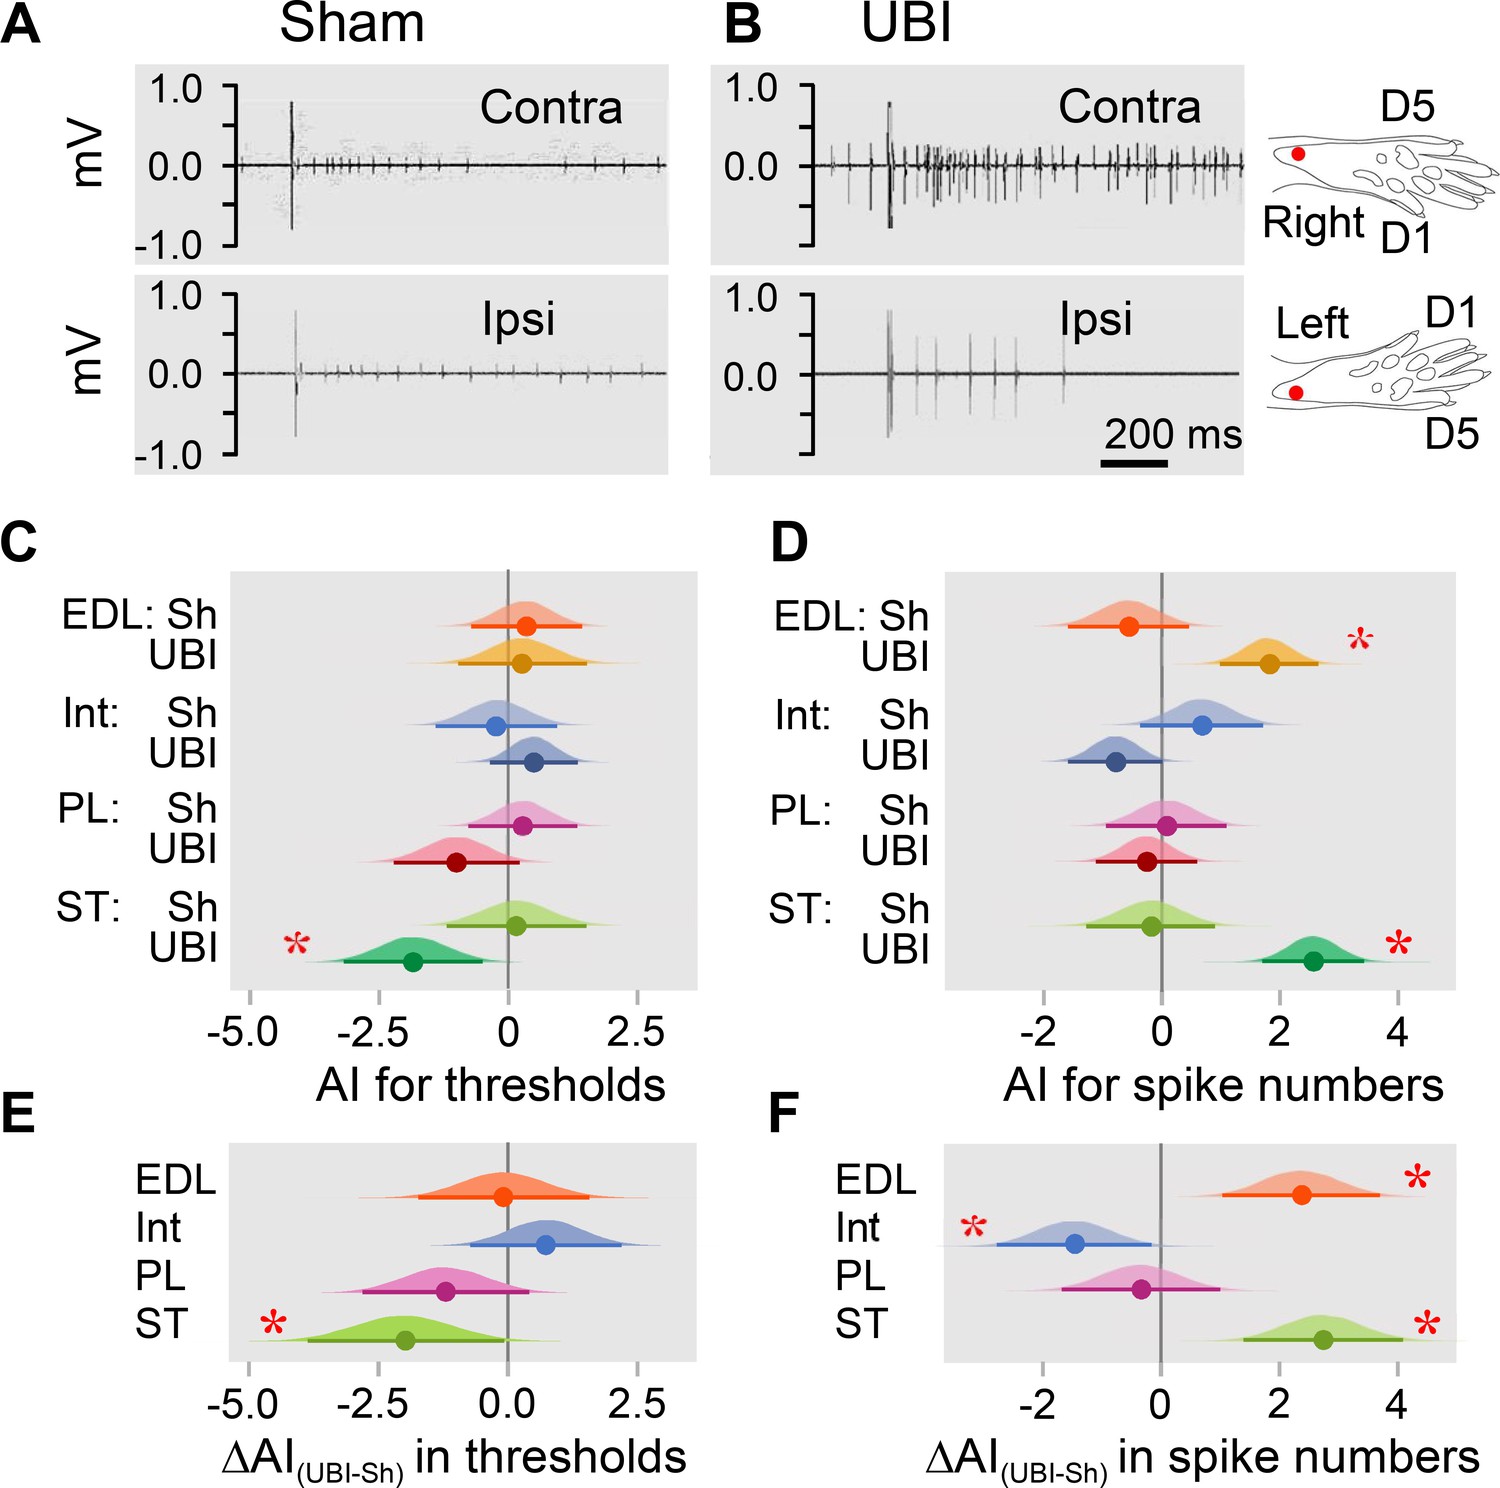
Hindlimb withdrawal reflexes in rats with UBI performed after complete spinal cord transection.
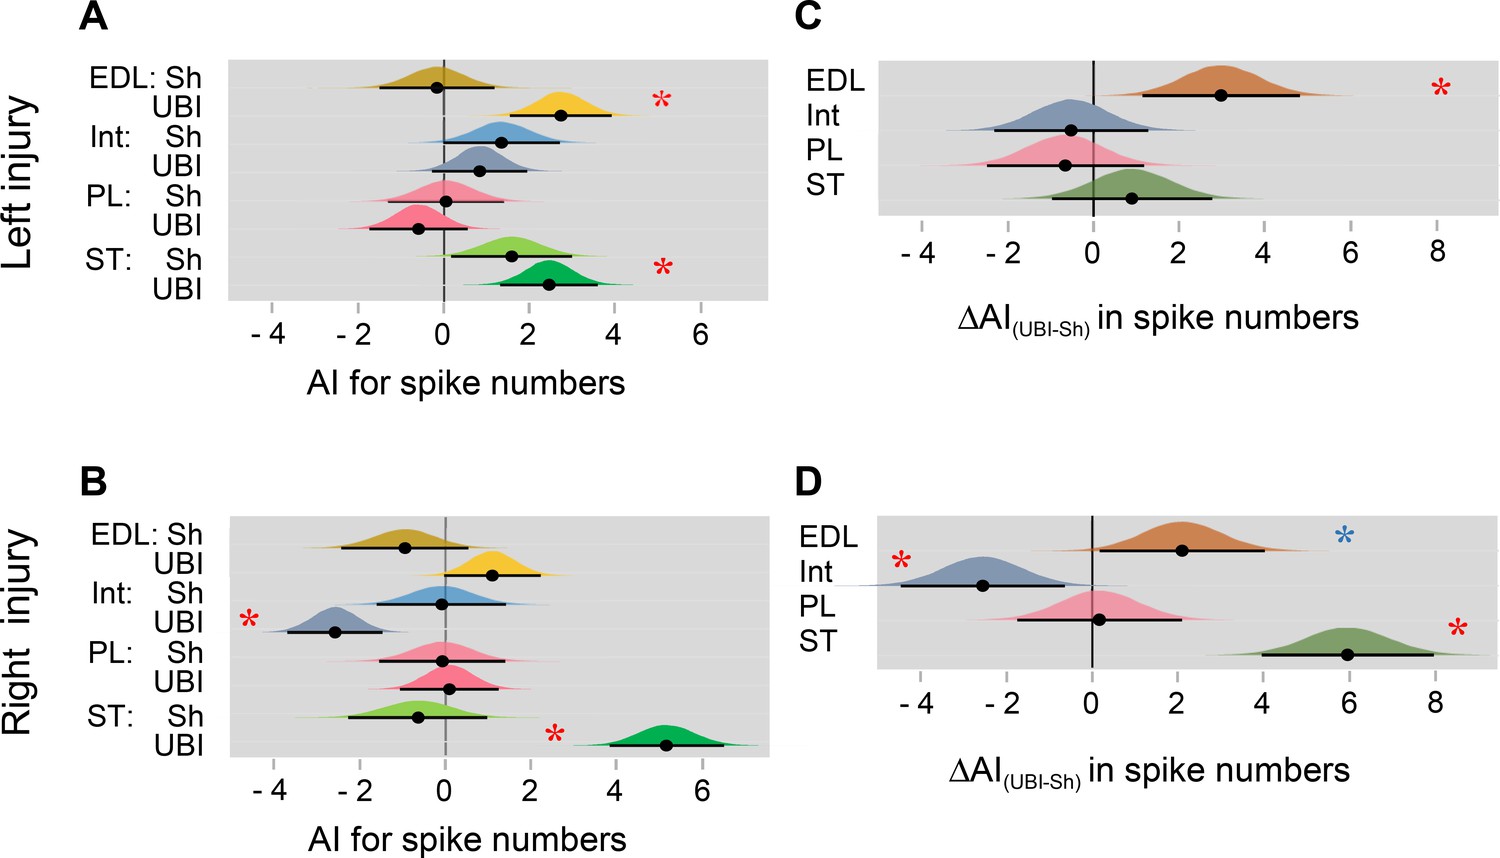
EMG activity of left and right extensor digitorum longus (EDL), interosseous (Int), peroneus longus (PL) and semitendinosus (ST) muscles were evoked by electrical stimulation of symmetric paw sites. The number of observations for both UBI and sham group is shown in Figure 2—figure supplement 2. The rats were subjected to left (n = 6) or right (n = 5) sham surgery, or to the left (n = 9) or right (n = 9) UBI. (A,B) Representative semitendinosus responses. (C,D) Asymmetry index (AI=log2[Contra/Ipsi]) for threshold and spike number. Differences in the asymmetry index from zero (AI = 0 when the ratio [Contra/Ipsi] = 1, that corresponds to a symmetric pattern) in UBI rats (C) in the current threshold for the semitendinosus muscle {median of the posterior distribution (median) = −1.840, 95% highest posterior density continuous interval (HPDCI) = [−3.169,–0.477], adjusted p-value (p) = 0.015, fold difference = 3.6}; and (D) in the number of spikes for the extensor digitorum longus (median = 1.818, HPDCI = [0.990, 2.655], p = 4×10⁻⁵, fold difference = 3.5) and semitendinosus (median = 2.560, HPDCI = [1.691, 3.415], p = 1×10⁻⁸, fold difference = 5.9) muscles. (E,F) Differences in the asymmetry index between the UBI and sham surgery (Sh) groups [ΔAI(UBI – Sh)]. Differences in the asymmetry index between the UBI and sham surgery groups for (E) the current threshold of the semitendinosus (median = −1.992, HPDCI = [−3.911,–0.106], p = 0.040, fold difference = 4.0); and (F) the number of spikes of the interosseous (median = −1.463, HPDCI = [−2.782,–0.159], p = 0.028, fold difference = 2.8), extensor digitorum longus (median = 2.379, HPDCI = [1.080, 3.743], p = 4×10⁻⁴, fold difference = 5.2), and semitendinosus (median = 2.745, HPDCI = [1.419, 4.128], p = 6×10⁻⁵, fold difference = 6.7). Medians, 95% HPDC intervals and densities from Bayesian sampler are plotted. * Asymmetry and differences between the groups: 95% HPDC intervals did not include zero, and adjusted p-values were ≤ 0.05.
-
Figure 2—source code 1
Source code for Figure 2C,E.
- https://cdn.elifesciences.org/articles/65247/elife-65247-fig2-code1-v1.zip
-
Figure 2—source code 2
Source code for Figure 2D,F.
- https://cdn.elifesciences.org/articles/65247/elife-65247-fig2-code2-v1.zip
-
Figure 2—source data 1
The EXCEL source data file contains EMG data for panels C and D of Figure 2.
- https://cdn.elifesciences.org/articles/65247/elife-65247-fig2-data1-v1.xlsx
Figure 2—figure supplement 1

Effects of the UBI on hindlimb withdrawal reflexes.
(A,B) Representative EMG examples and respective stimulation sites of hindlimb muscles of the anesthetized rats with transected spinal cords. (A) Left panel: EMG responses of the extensor digitorum longus (EDL), semitendinosus (ST), peroneus longus (PL) and the fourth interosseous (Int) muscles to 18 electrical stimulations. Middle panel: Amplified view of EMG spikes from the regions delimited by the rectangles on the left panel. Right panel: Stimulation site for each muscle. (B) Peristimulus histogram of these muscles from 16 stimulations (from 2nd to 17th). (C–H) Representative examples of EMG responses of extensor digitorum longus (C,D; the same stimulation site), interosseous (E,F) and peroneus longus (G,H; the same stimulation site) muscles of the contra- and ipsilesional hindlimbs in rats that were subjected to UBI or sham surgery after transection of their spinal cord. Stimulation of the left and right hindlimbs of the UBI rat with the same current parameters induced larger EMG responses of the extensor digitorum longus muscle on the contra- compared to the ipsilesional side (D), and the interosseous muscle on the ipsi- compared to the contralesional side (F). Each of three muscles of sham rats (C,E,G) and of peroneus longus muscle of the UBI rat (H) demonstrated similar responses on both sides.
Figure 2—figure supplement 2
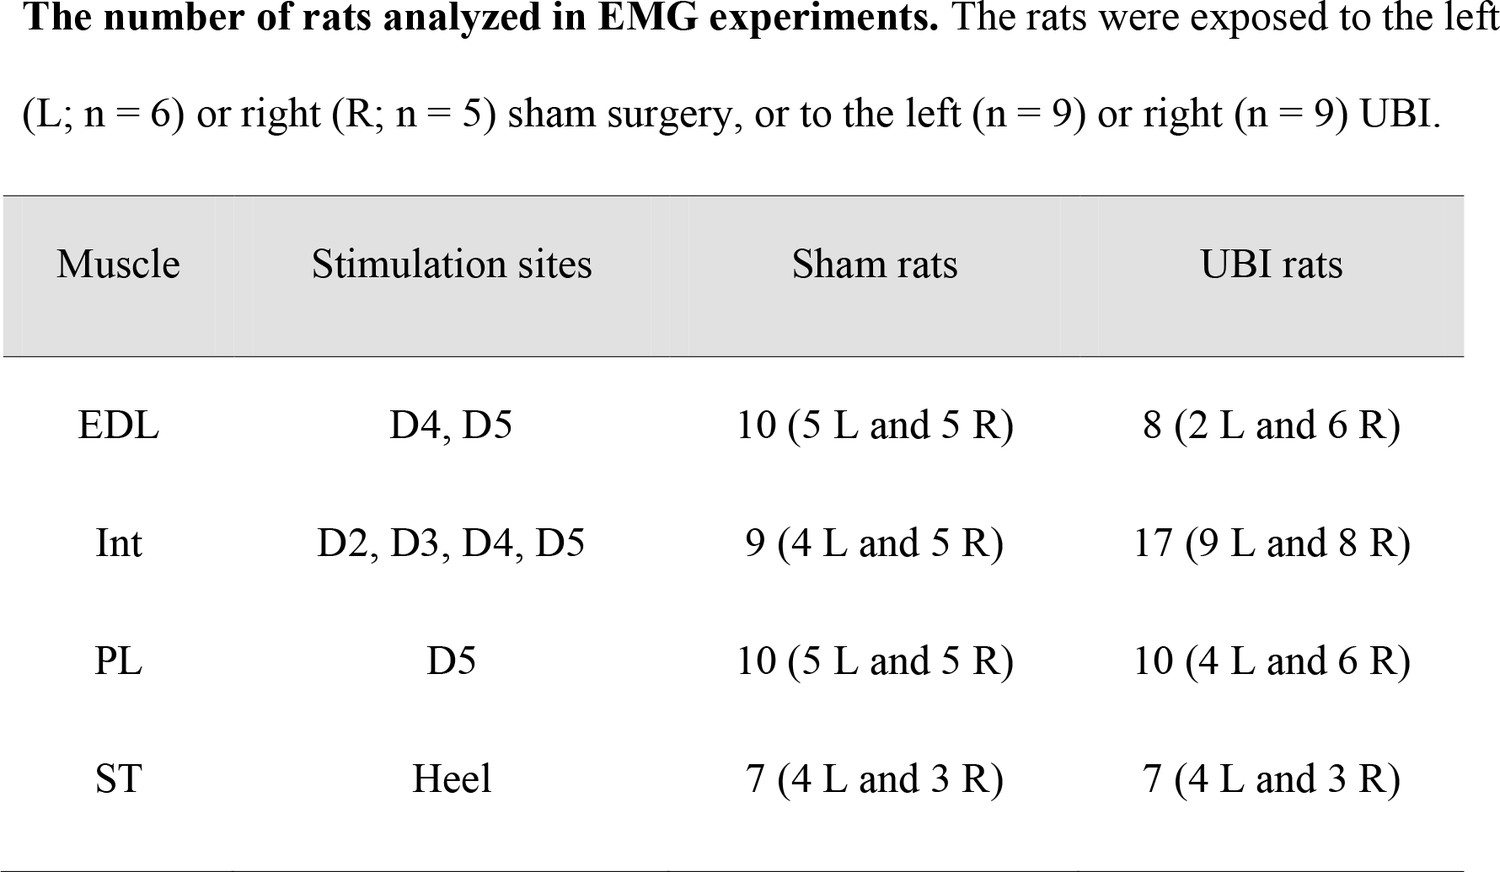
The number of rats analyzed in EMG experiments.
The rats that had left (L; n = 6) or right (R; n = 5) sham surgery, or left (n = 9) or right (n = 9) UBI.
Figure 2—figure supplement 3
The UBI effects on the hindlimb withdrawal reflexes: separate analysis of left or right brain injury.
The rats were subjected to the left (A,C) or right (B,D) UBI or sham surgery (Sh) after complete spinal cord transection. The number of observations is shown in Figure 2—figure supplement 2. The rats were subjected to the left (n = 6) or right (n = 5) sham surgery, or to the left (n = 9) or right (n = 9) UBI. EMG activity of left and right extensor digitorum longus (EDL), interosseous (Int), peroneus longus (PL), and semitendinosus (ST) muscles were evoked by electrical stimulation of symmetric paw sites. (A,B) Differences in the asymmetry index (AI=log2[Contra/Ipsi]) for spike numbers from zero (AI = 0 corresponds to a symmetric pattern) in UBI rats for the extensor digitorum longus (Left UBI: median = 2.705, HPDCI = [1.546, 3.900], p = 2×10⁻⁵); the interosseous (Right UBI: median = −2.614, HPDCI = [−3.699,–1.489], p = 1×10⁻⁵); and semitendinosus (Left UBI: median = 2.431, HPDCI = [1.280, 3.544], p = 9×10⁻⁵; Right UBI: median = 5.057, HPDCI = [3.725, 6.373], p = 2×10⁻¹³) muscles. (C,D) Differences in the asymmetry index between the UBI and sham surgery groups [ΔAI(UBI – Sh)] for the extensor digitorum longus (Left UBI: median = 2.872, HPDCI = [1.102, 4.654], p = 0.01; Right UBI: median = 2.022, HPDCI = [0.161, 3.879]); the interosseous (Right UBI: median = −2.471, HPDCI = [−4.325,–0.626], p = 0.06); and semitendinosus (Right UBI: median = 5.750, HPDCI = [3.8083.725, 7.6846.373], p = 1×10⁻⁸) muscles. Medians, 95% HPDC intervals and densities from Bayesian sampler are plotted. * Red star: asymmetry and differences between the groups: 95% HPDC intervals did not include zero, and adjusted p-values were ≤ 0.05; * Blue star: asymmetry and differences between the groups (95% HPDC intervals did not include zero).
Figure 3 with 3 supplements
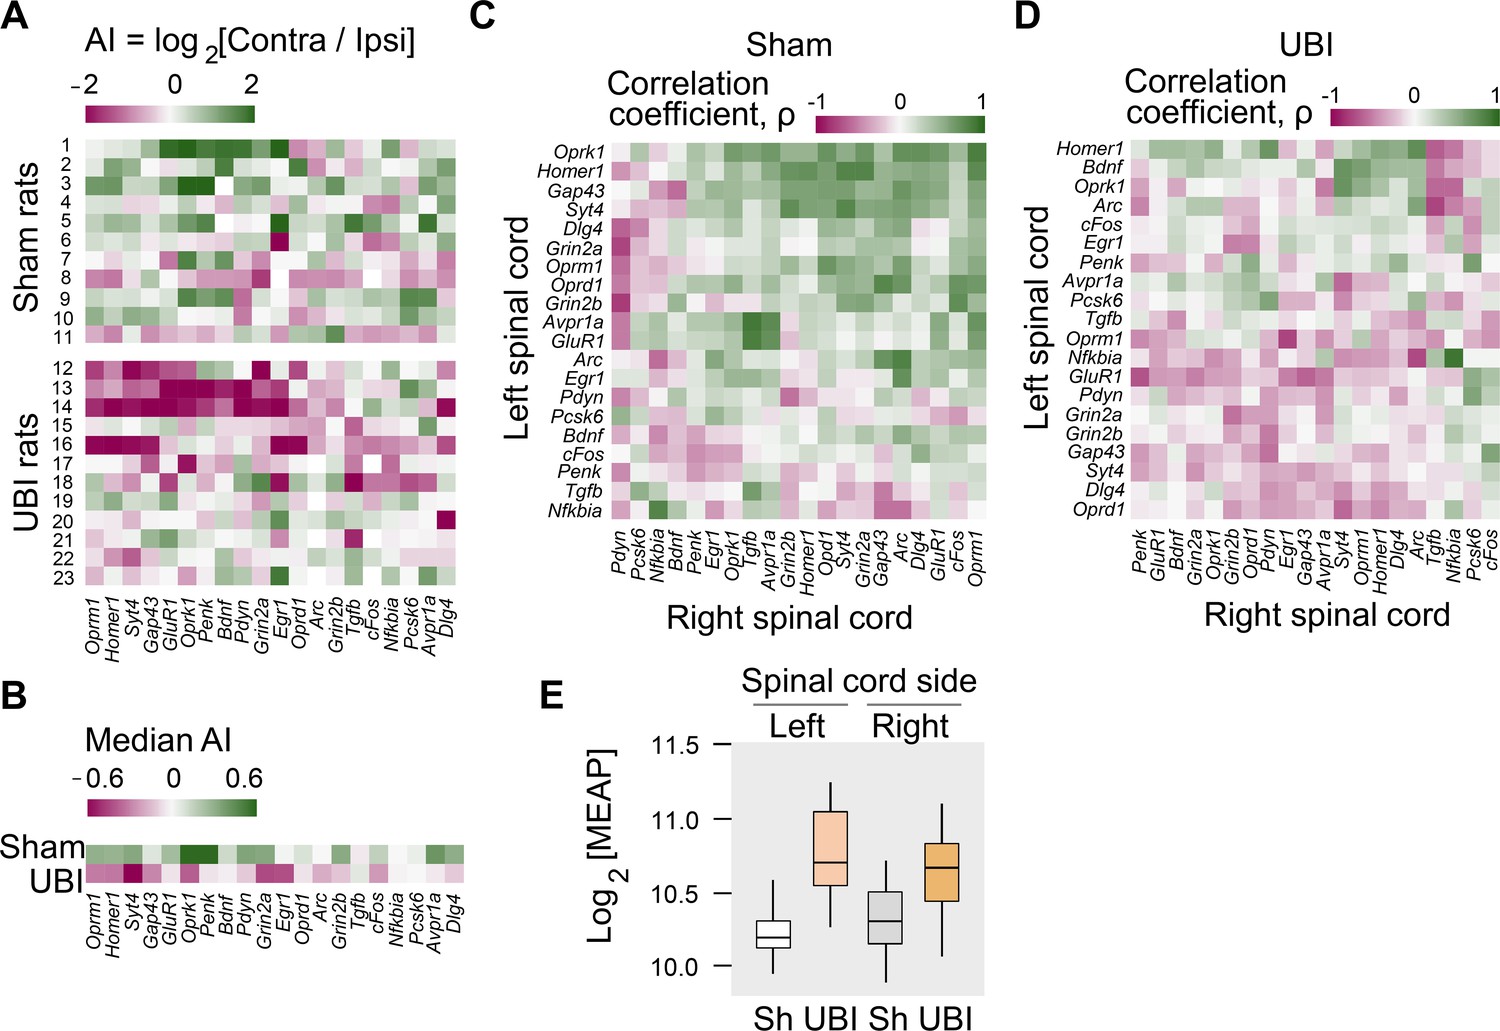
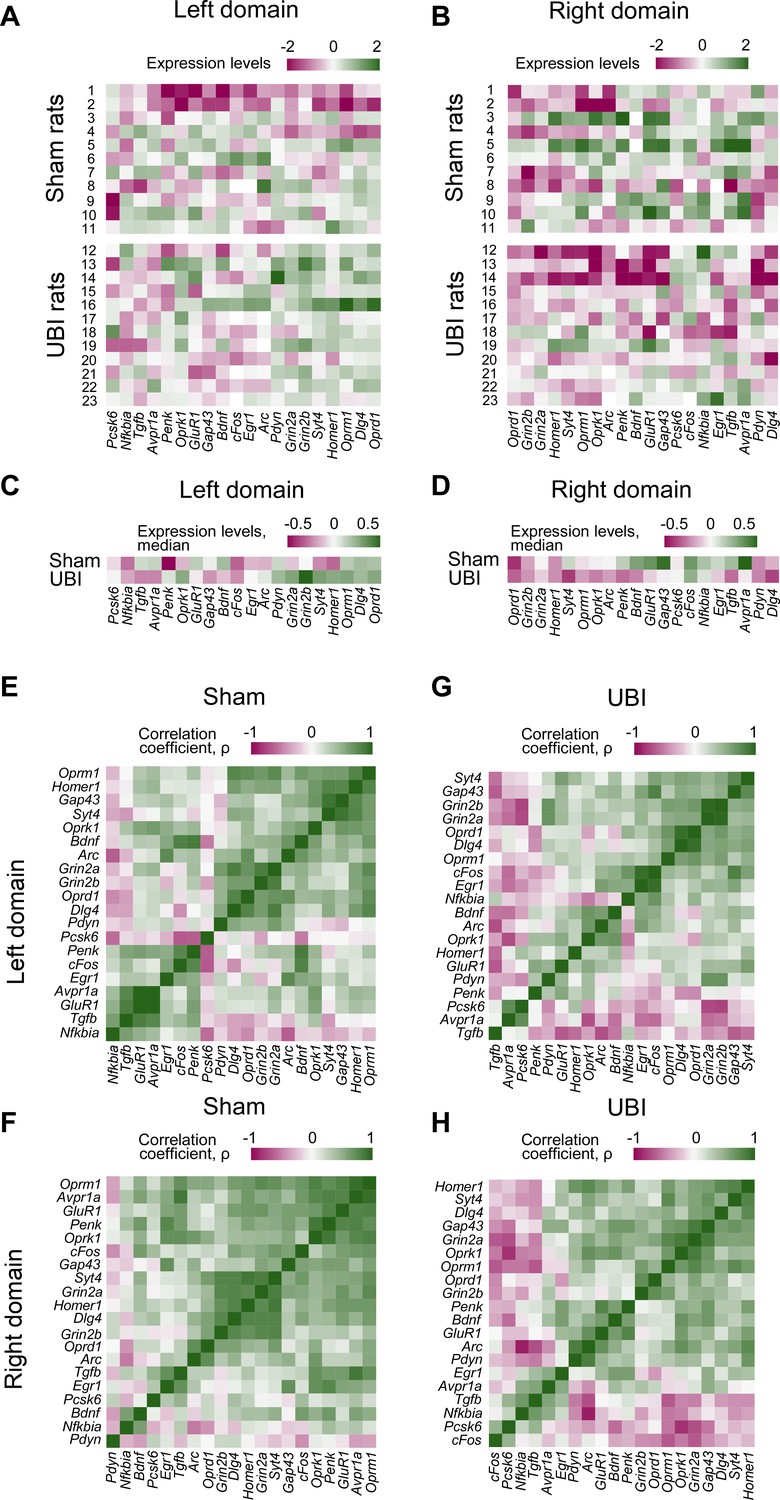
Expression of neuroplasticity-related and neuropeptide genes in the lumbar spinal cord of rats with left UBI performed after complete spinal cord transection.
The mRNA and peptide levels were analyzed in the ipsi- and contralesional halves of lumbar spinal cord isolated from rats 3 hr after the left UBI (n = 12) or left sham surgery (Sh; n = 11). (A,B) Heatmap for the (0,1)-standardized expression asymmetry index (AI=log2[Contra/Ipsi]) for each gene denoted for each rat individually, and as medians for rat groups. (C,D) Heatmap for Spearman’s rank correlation coefficients of expression levels between the left- and right lumbar halves for all gene pairs (inter-area correlations) in rats with transected spinal cord that were subjected to sham surgery or UBI. (E) UBI effects on the Met-enkephalin-Arg-Phe (MEAP) levels in the left (Padjusted = 9×10⁻⁴; fold change: 1.4×) and right (Pundjusted = 0.020; fold change: 1.3×) halves. Data are presented in fmol/mg tissue in the log2 scale as boxplots with median and hinges representing the first and third quartiles, and whiskers extending from the hinge to the highest/lowest value that lies within the 1.5 interquartile range of the hinge.
-
Figure 3—source data 1
The EXCEL source data file contains data for panels A,B of Figure 3.
- https://cdn.elifesciences.org/articles/65247/elife-65247-fig3-data1-v1.xlsx
-
Figure 3—source data 2
The EXCEL source data file contains data for panel E of Figure 3.
- https://cdn.elifesciences.org/articles/65247/elife-65247-fig3-data2-v1.xlsx
Figure 3—figure supplement 1
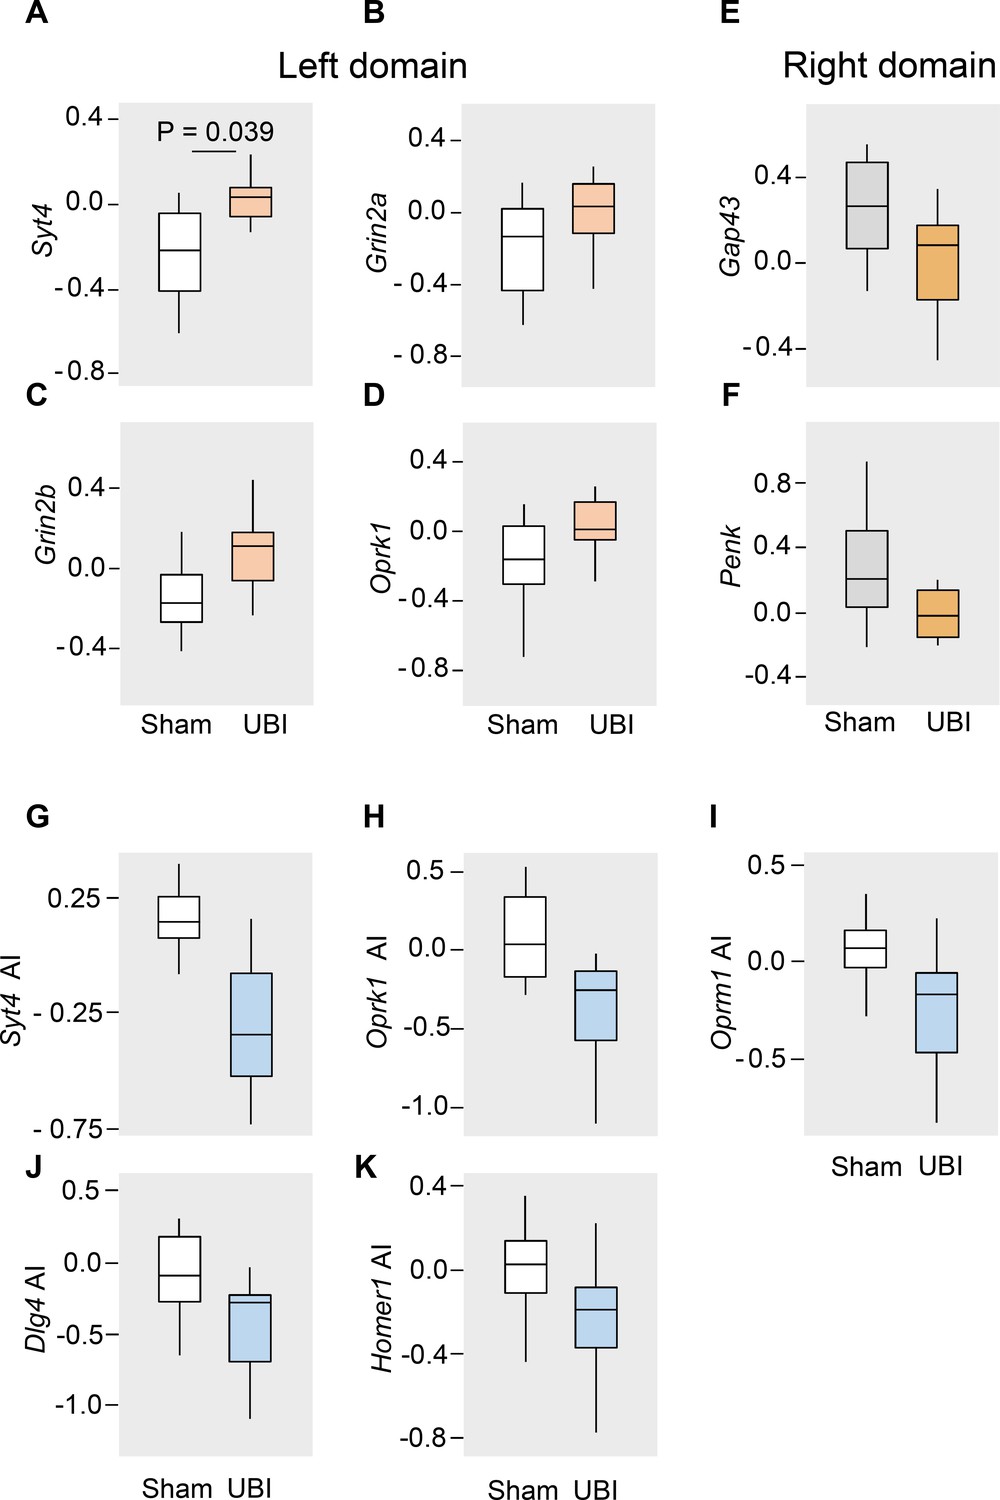
UBI effects on expression of neuroplasticity-related and neuropeptide genes (A–F), and the expression asymmetry index (G–K) in the lumbar spinal cord of rats with transected spinal cord.
Data are presented in the log2 scale as boxplots with median and hinges representing the first and third quartiles, and whiskers extending from the hinge to the highest/lowest value that lies within the 1.5 interquartile range of the hinge. The rats with spinal cord transection at the T2-T3 level were subjected to the left UBI (n = 12) or left sham surgery (n=11), and the mRNA levels were analyzed in the ipsi- (left) and contralesional (right) lumbar spinal cord isolated 3 hr after the injury. (A-F) The UBI-induced changes in expression of Syt4 (1.19-fold; Padjusted = 0.039), Grin2a (1.18-fold; Punadjusted = 0.04), Grin2b (1.22-fold; Punadjusted = 0.01) and Oprk1 (1.13-fold; Punadjusted = 0.03) in the left lumbar half; and Gap43 (1.13-fold; Punadjusted = 0.04) and Penk (1.17-fold; Punadjusted = 0.03) in the right lumbar half of the rats with transected spinal cord are shown. The mRNA levels of 20 genes were compared separately for the left and right halves of the lumbar spinal cord between the rats with UBI or sham surgery using Mann-Whitney test followed by Bonferroni correction for a number of tests (n = 40). (G-K) The expression asymmetry index (AI = log2[Contra/Ipsi], where Contra and Ipsi were the levels in the contra- and ipsilesional lumbar domains) for each of 20 genes was compared individually between the UBI and sham groups using Mann-Whitney test followed by Bonferroni correction. The expression asymmetry index for the Syt4 (median difference 0.38; Padjusted = 0.004), the Oprk1 (median difference 0.29; Punadjusted = 0.009), Oprm1 (median difference 0.24; Punadjusted = 0.032), Dlg4 (median difference 0.18; Punadjusted = 0.032) and Homer1 (median difference 0.19; Punadjusted = 0.037) are shown.
Figure 3—figure supplement 2
Heatmap for expression levels (A–D) and intra-area correlations (E–H) in the left (ipsilesional) (A,C,E,G) and right (contralesional) (B,D,F,H) lumbar spinal cord.
(A–D) Expression levels for each gene are denoted as (0,1)-standardized values for each sham and UBI rat individually (A,B), and as medians for the sham and UBI groups (C,D). In the left half 15 out of 20 analyzed genes have higher median expression in the UBI group (sign test: p = 0.041), while in the right half for 17 out of 20 genes median expression is higher in the sham group (sign test: p = 0.003). (E–H) Heatmap for Spearman’s rank correlation coefficients of expression levels for all gene pairs in the rats with left sham surgery (E,F) or left UBI (G,H). Differences between the UBI and sham groups in the proportion of positive and negative intra-area correlations were analyzed by the Fisher's Exact Test: for all correlations in the right half: p = 2.7×10⁻⁵; for significant correlations in the left and right halves, p = 8.1×10⁻³ and 8.9×10⁻³, respectively.
Figure 3—figure supplement 3
UBI effects on the levels of opioid peptides Dynorphin B (DynB) and Leu-enkephalin-Arg (LER) in the lumbar spinal cord of the rats with transected spinal cord.
The rats with spinal cord transection at the T2-T3 level were subjected to the left UBI (n = 12) or left sham surgery (n=11), and the peptide levels were analyzed in the ipsi- (left) and contralesional (right) halves of lumbar spinal cord isolated 3 hr after the injury. Changes in the levels of Dynorphin B (1.2-fold; Mann-Whitney test: Punadjusted = 0.03) and Leu-enkephalin-Arg (1.6-fold; Mann-Whitney Punadjusted = 0.02) in the ipsilesional (left) half are shown. Data are presented in fmol/mg tissue in the log2 scale as boxplots with median and hinges representing the first and third quartiles, and whiskers extending from the hinge to the highest/lowest value that lies within the 1.5 interquartile range of the hinge.
Figure 4 with 2 supplements
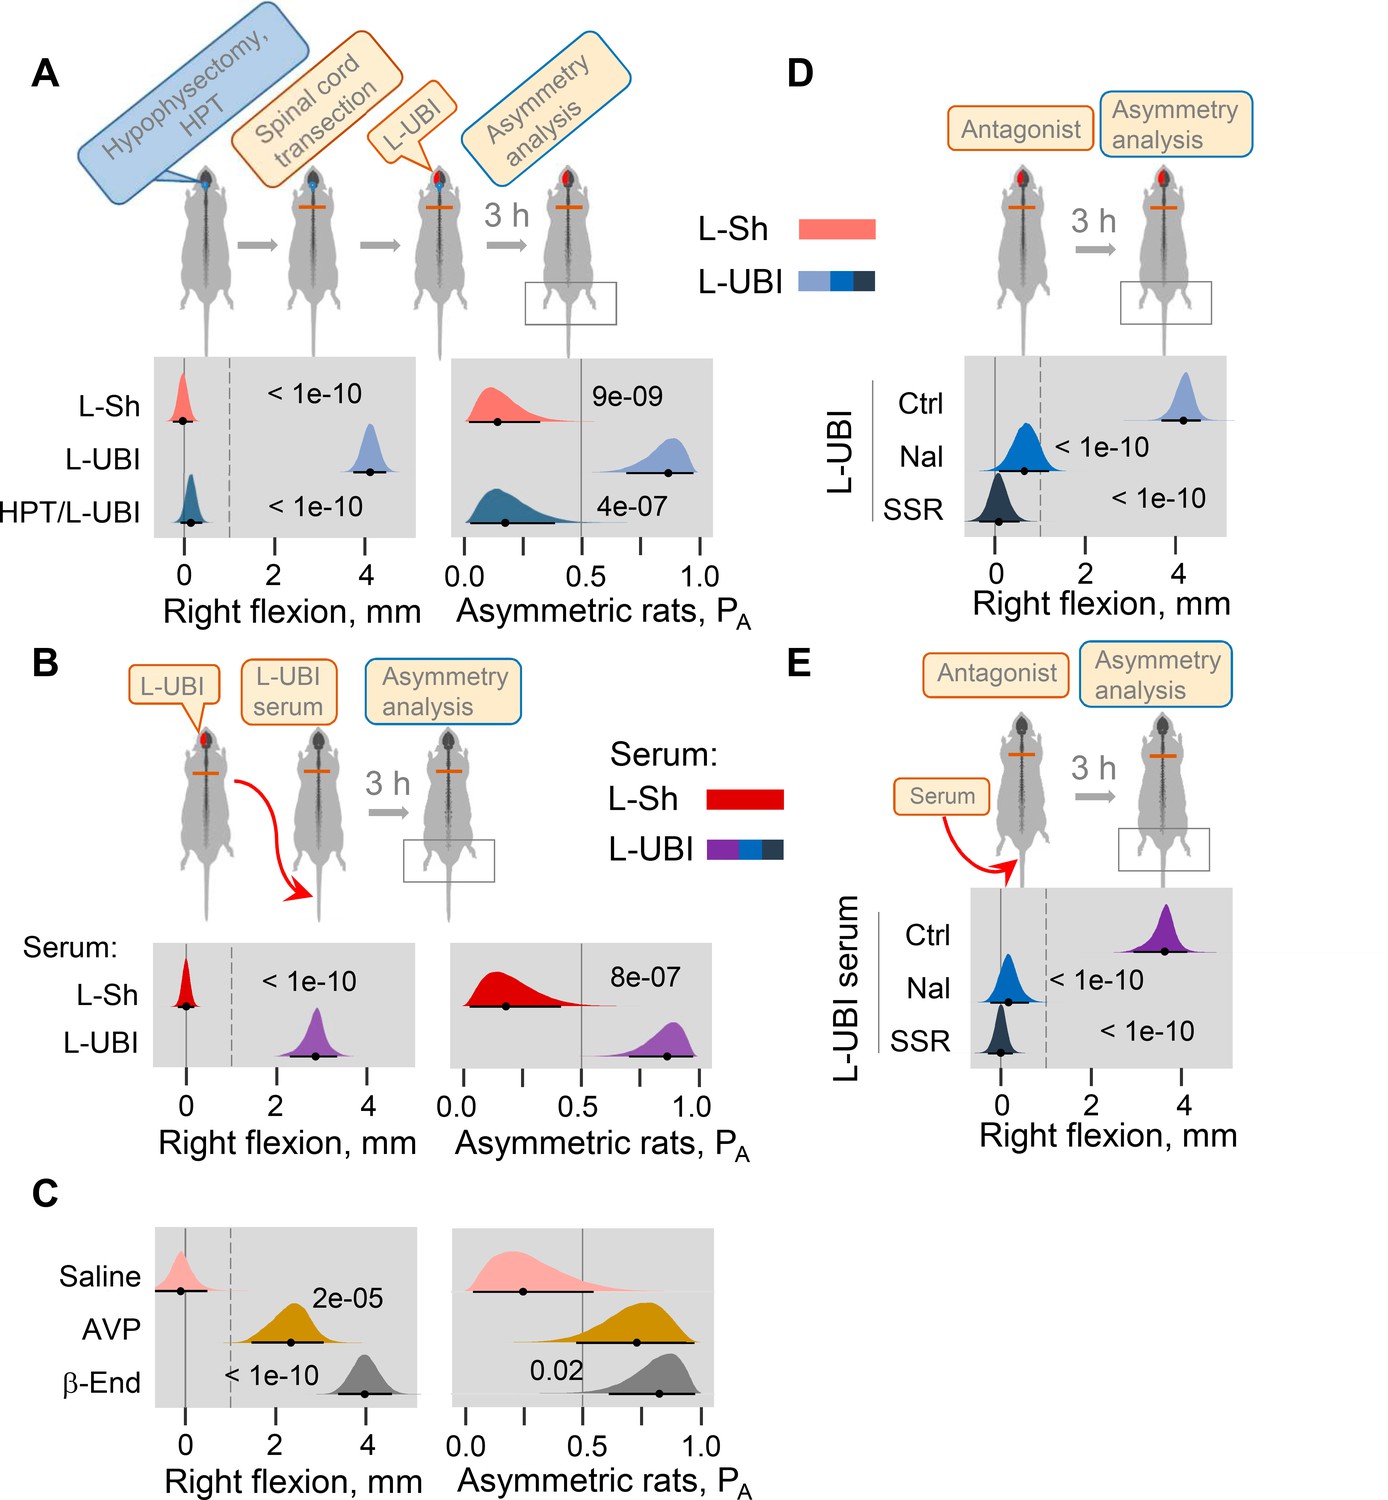
Neuroendocrine pathway mediating postural asymmetry formation in rats with transected spinal cord.
(A) HL-PA in hypophysectomized (HPT; n = 8) and control (n = 12) rats with transected spinal cord 3 hr after left UBI (L-UBI). Left sham surgery (L–Sh): n = 8. (B) HL-PA after intravenous administration of serum from rats with either left UBI (L-UBI serum) or left sham surgery (L-Sh serum) to rats with transected spinal cord (n = 13 and 7, respectively). (C) Induction of HL-PA by Arg-vasopressin (AVP) and β-endorphin (β-End) in rats with transected spinal cord. Synthetic β-endorphin or Arg-vasopressin (1 microgram and 10 nanogram / 0.3 ml saline / animal, respectively), or saline was administered intravenously to rats (n = 8, 7, and 4 rats, respectively) after spinal cord transection. The HL-PA was analyzed in rats 60 min after the injection and under pentobarbital anesthesia. (D) Effect of naloxone (Nal, n = 6) or saline (n = 6), and SSR-149415 (SSR, n = 6) or vehicle (n = 5) on HL-PA 3 h after left UBI in rats with transected spinal cord. Vehicle and saline groups were combined into a single control group (Ctrl; n = 11). (E) Effect of naloxone (n = 6) or saline (n = 3) and SSR-149415 (n = 6) or vehicle (n = 3) on HL-PA 3 hr after intravenous administration of the left UBI serum to rats with transected spinal cord. Ctrl = saline + vehicle; n = 6. In (D,E), naloxone (or saline) and SSR-149415 (or vehicle) were administered 0.5 and 3 hr before HL-PA analysis, respectively. HL-PA values in millimeters (mm) and probability (PA) to develop HL-PA above 1 mm threshold (denoted by vertical dotted lines) are plotted as median, 95% HPDC intervals, and posterior distribution from Bayesian regression. Negative and positive HL-PA values are assigned to rats with the left and right hindlimb flexion, respectively. Asymmetry and differences between the groups: 95% HPDC intervals did not include zero, and adjusted p-values were ≤ 0.05. Adjusted p is shown for differences identified by Bayesian regression.
-
Figure 4—source data 1
The EXCEL source data file contains data for panels A-E of Figure 4.
- https://cdn.elifesciences.org/articles/65247/elife-65247-fig4-data1-v1.xlsx
Figure 4—figure supplement 1
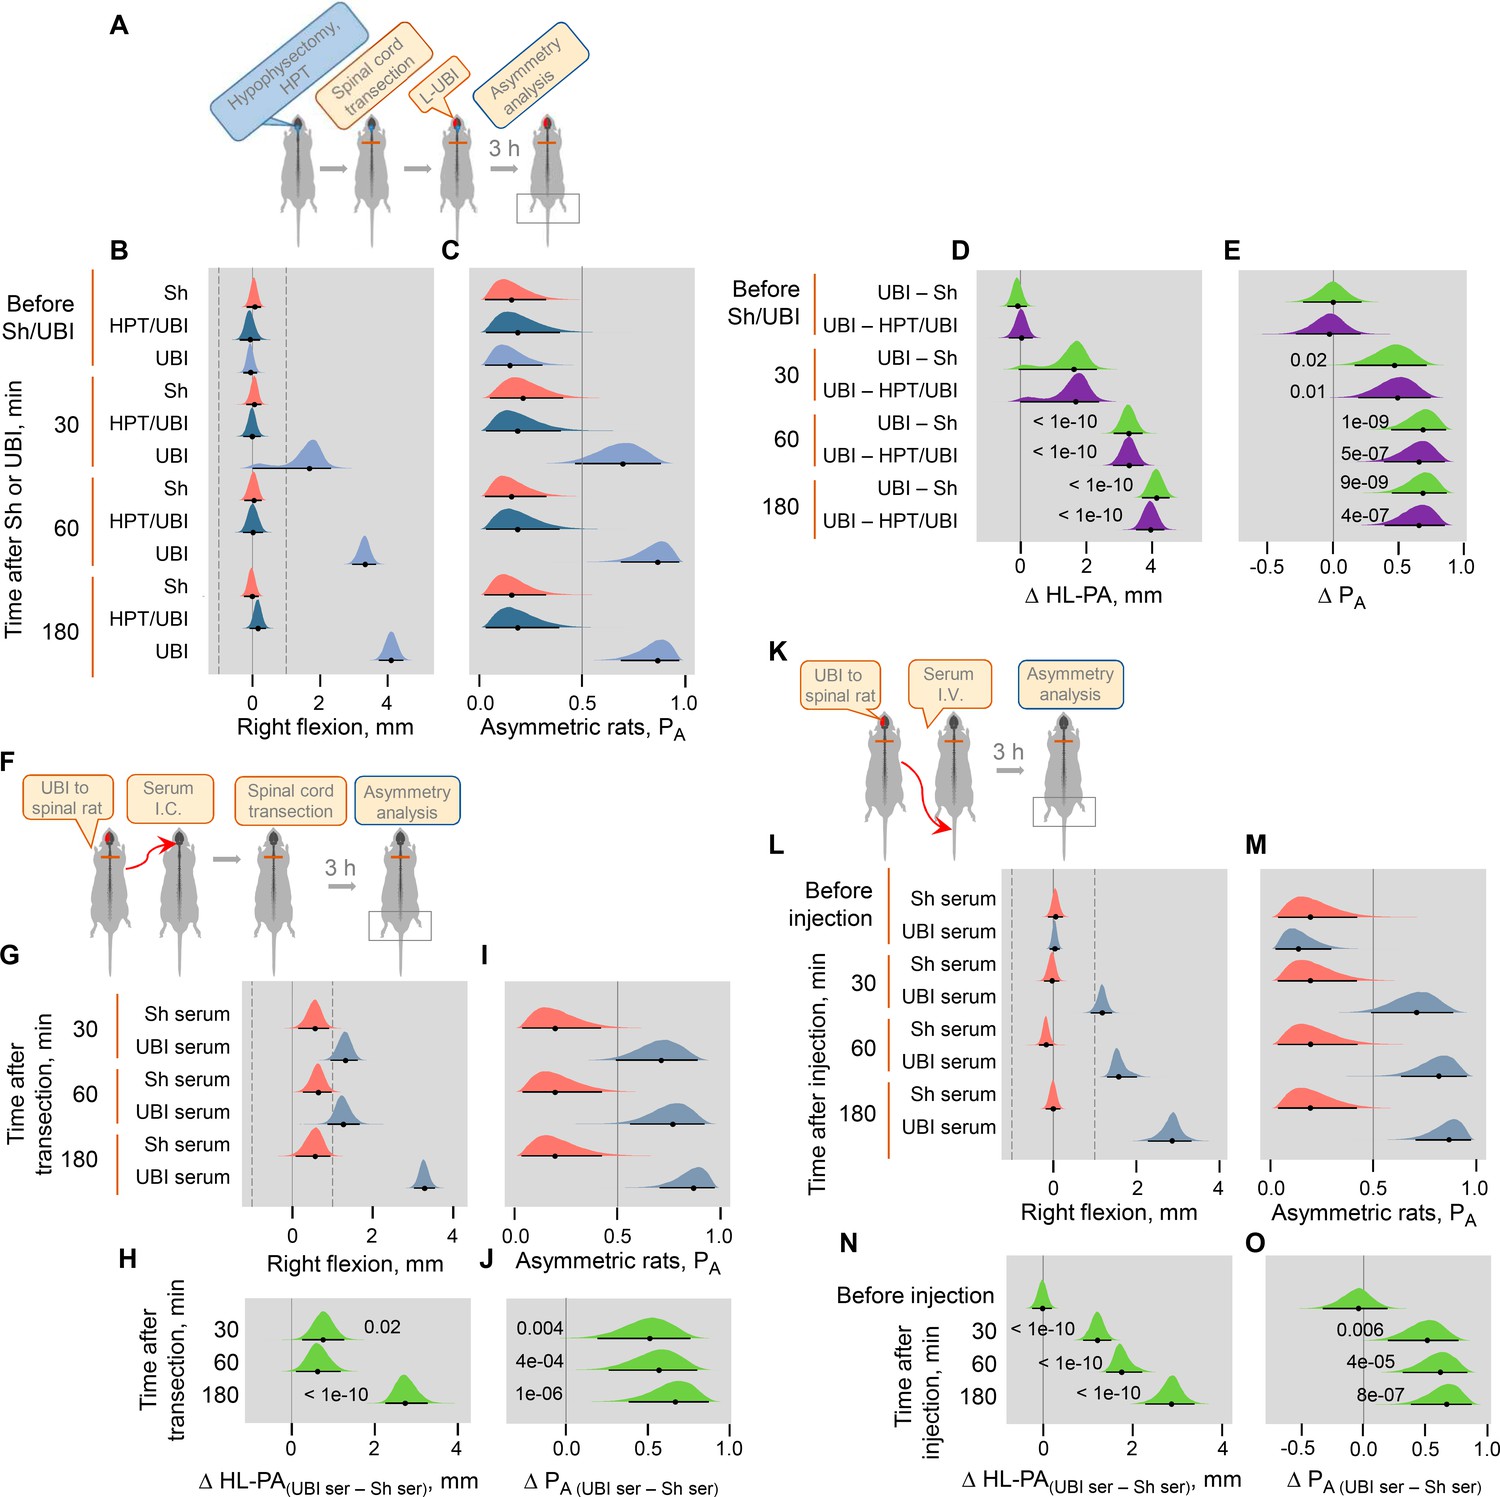
HL-PA formation in hypophysectomized rats with UBI, and in rats with intact brain after administration of serum of the UBI animals.
(A–E) The left UBI in hypophysectomized (HPT/UBI; n = 8) and control (UBI; n = 12) rats, and left sham surgery in control rats (Sh; n = 8) were performed after complete spinal cord transection at the T2-T3 level. (F–J) Induction of HL-PA by serum of the UBI animals. Serum collected from the rats with transected spinal cord 3 hr after the left UBI (UBI serum) or sham surgery (Sh serum) was administered to the cisterna magna (I.C.; 5 microliters / rat) to intact rats. The spinal cord was transected at the T2-T3 level 10–15 min after injection of the UBI (n = 13) or sham (n = 7) serum, and the HL-PA was analyzed 30, 60, and 180 min after the transection under pentobarbital anesthesia. (K–O) Time-course of HL-PA formation after intravenous administration of the left UBI serum to rats with transected spinal cord. HL-PA was analyzed after I.V. administration of serum collected from the rats with left-side UBI (UBI serum; n = 13) or sham surgery (Sham serum; n = 7), to the rats after their spinalization at the T2-T3 level. Data for the 180 min time point presented on Figure 4B are shown for comparison. Negative and positive HL-PA values are assigned to rats with the left and right hindlimb flexion, respectively. Differences in the HL-PA [ΔHL-PA(UBI – Sh) in millimeters] and in the probability to develop HL-PA [ΔPA(UBI – Sh)] between UBI and sham surgery groups. Medians, 95% HPDC intervals and densities from Bayesian sampler are plotted. Contrasts between the groups: 95% HPDC intervals did not include zero, and adjusted p-values were ≤ 0.05. Adjusted p is shown for differences identified by Bayesian regression.
Figure 4—figure supplement 2
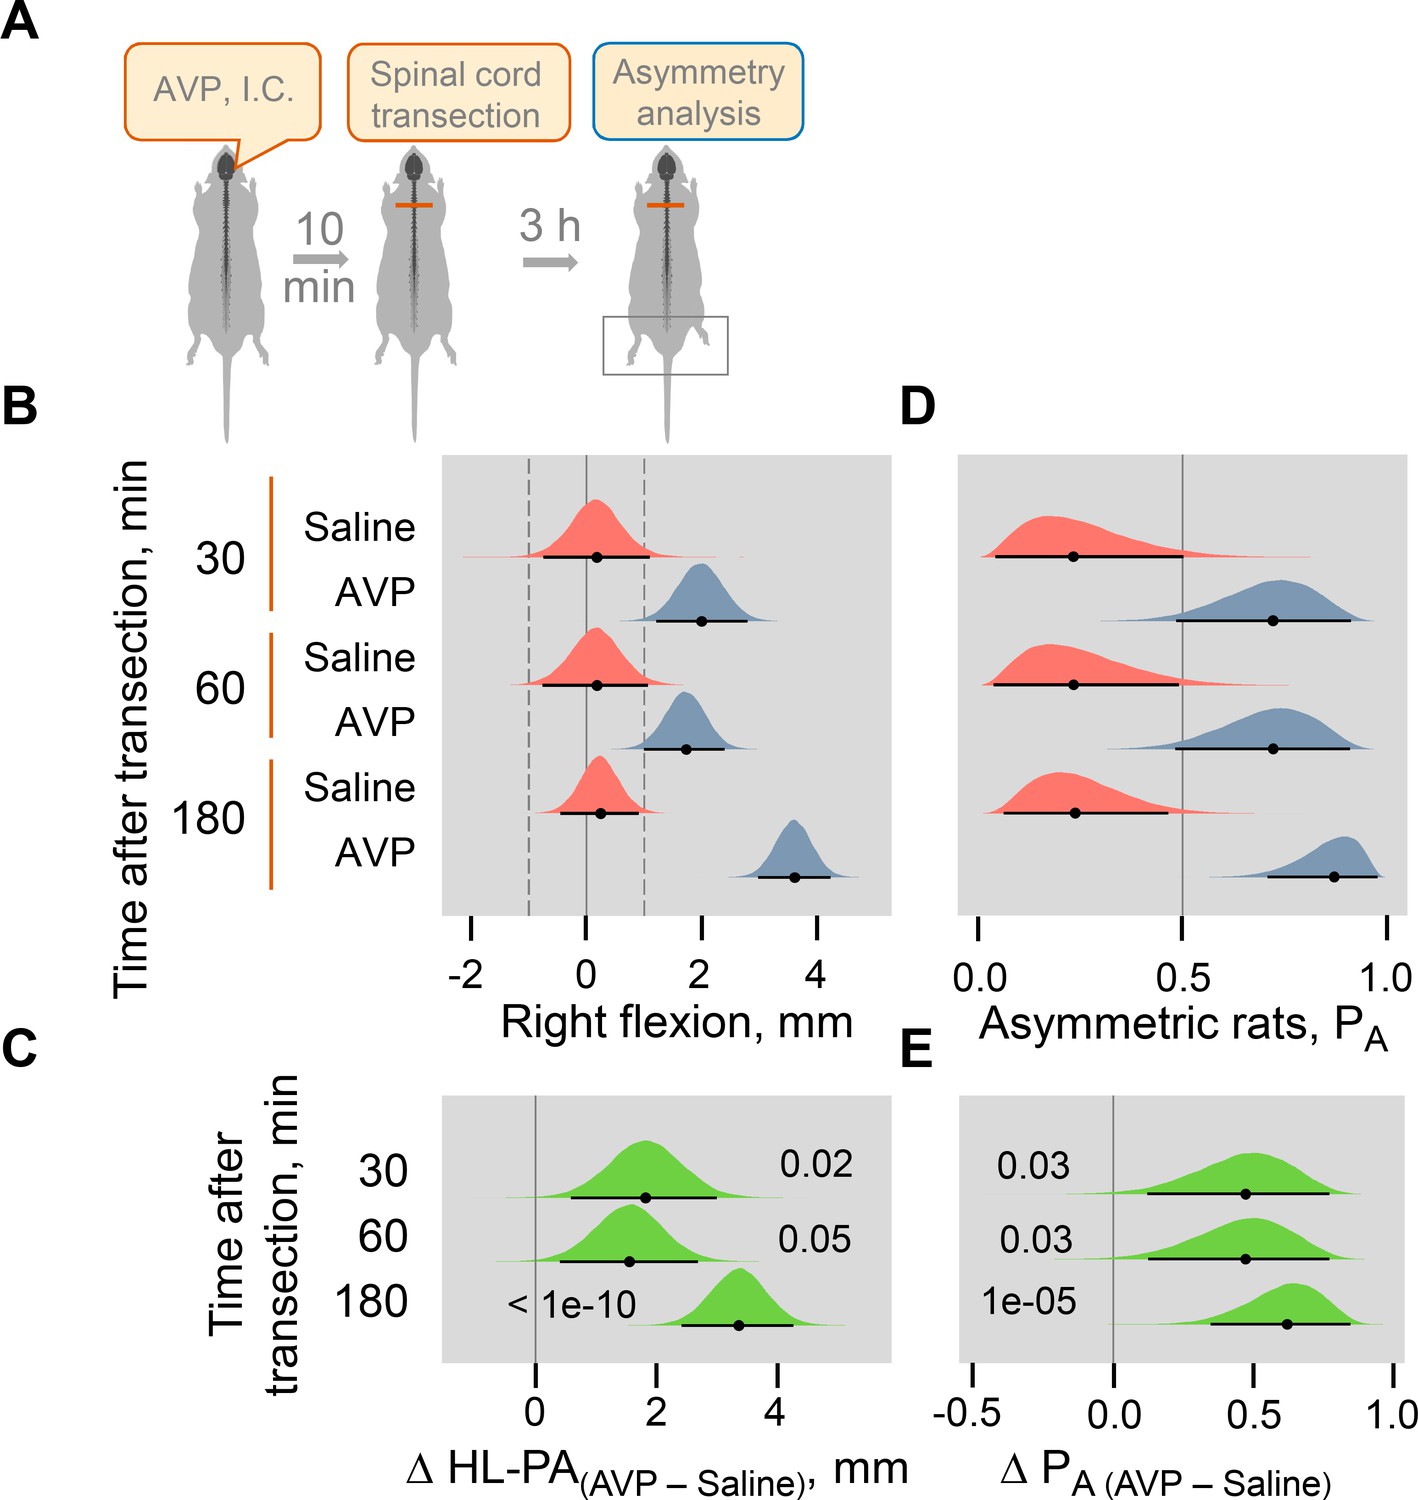
Induction of HL-PA by Arg-vasopressin (AVP) administered intracisternally to rats with intact brain.
(A) Experimental design. HL-PA formation was analyzed with the rats under pentobarbital anesthesia 30, 60, and 180 min after AVP (10 nanograms in five microliters / rat; n = 10 at the 30 and 60 min time points, and n = 22 at the 180 min time point) or saline (n = 5 at the 30 and 60 min time points, and n = nine rats at the 180 min time point) administration followed 10–15 min later by spinal cord transection. (B,D) Effects of Arg-vasopressin on the formation of HL-PA (expressed in millimeters, mm), and on the probability to develop HL-PA (PA). Negative and positive HL-PA values are assigned to rats with the left and right hindlimb flexion, respectively. (C,E) Differences in the HL-PA [ΔHL-PA(AVP – Saline) in millimeters] and in the probability to develop HL-PA [ΔPA(AVP – Saline)] between the Arg-vasopressin and saline groups. Medians, 95% HPDC intervals and densities from Bayesian sampler are plotted. Contrasts between the groups: 95% HPDC intervals did not include zero, and adjusted p-values were ≤ 0.05. Adjusted p is shown for differences identified by Bayesian regression.
Figure 5
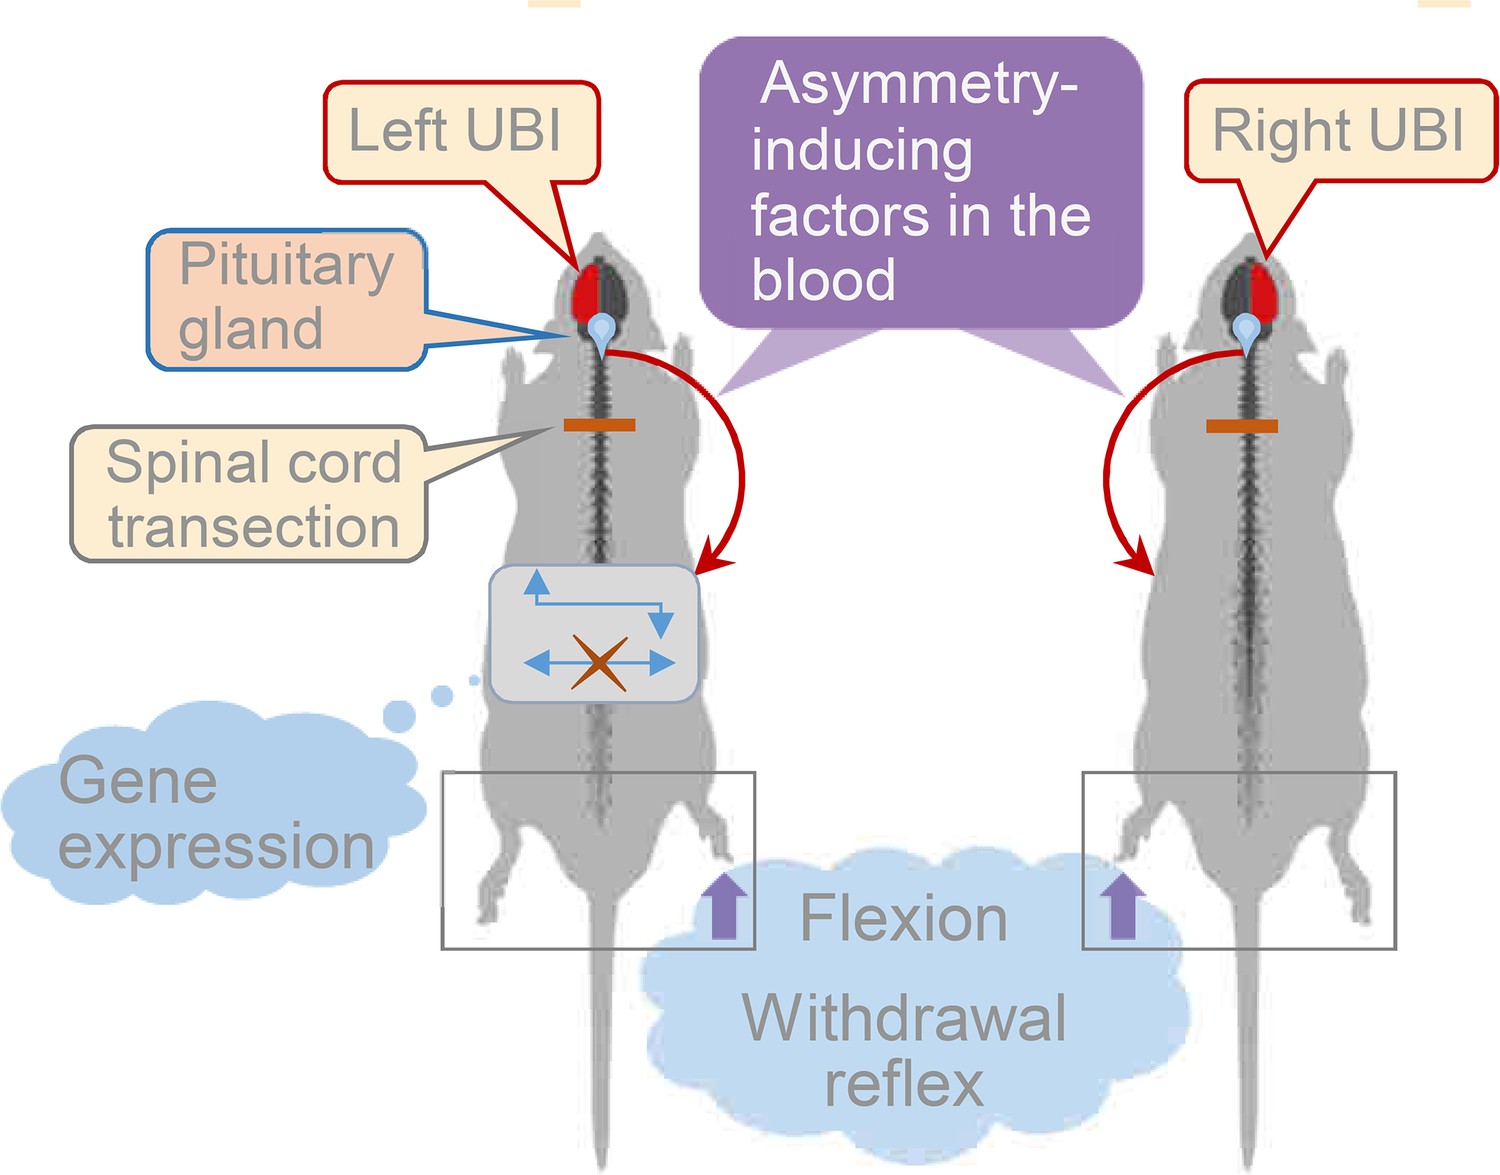
Model for the humoral neuroendocrine side-specific signaling from the unilaterally injured brain to the lumbar spinal cord.
In the rats with transected spinal cords, the UBI stimulates the release of the asymmetry inducing factors (neurohormones) from the pituitary gland into the circulation. They are transported to their target sites and induce flexion of the contralesional hindlimb and asymmetric, contra vs. ipsilesional side specific changes in withdrawal reflexes and spinal gene expression patterns.
Tables
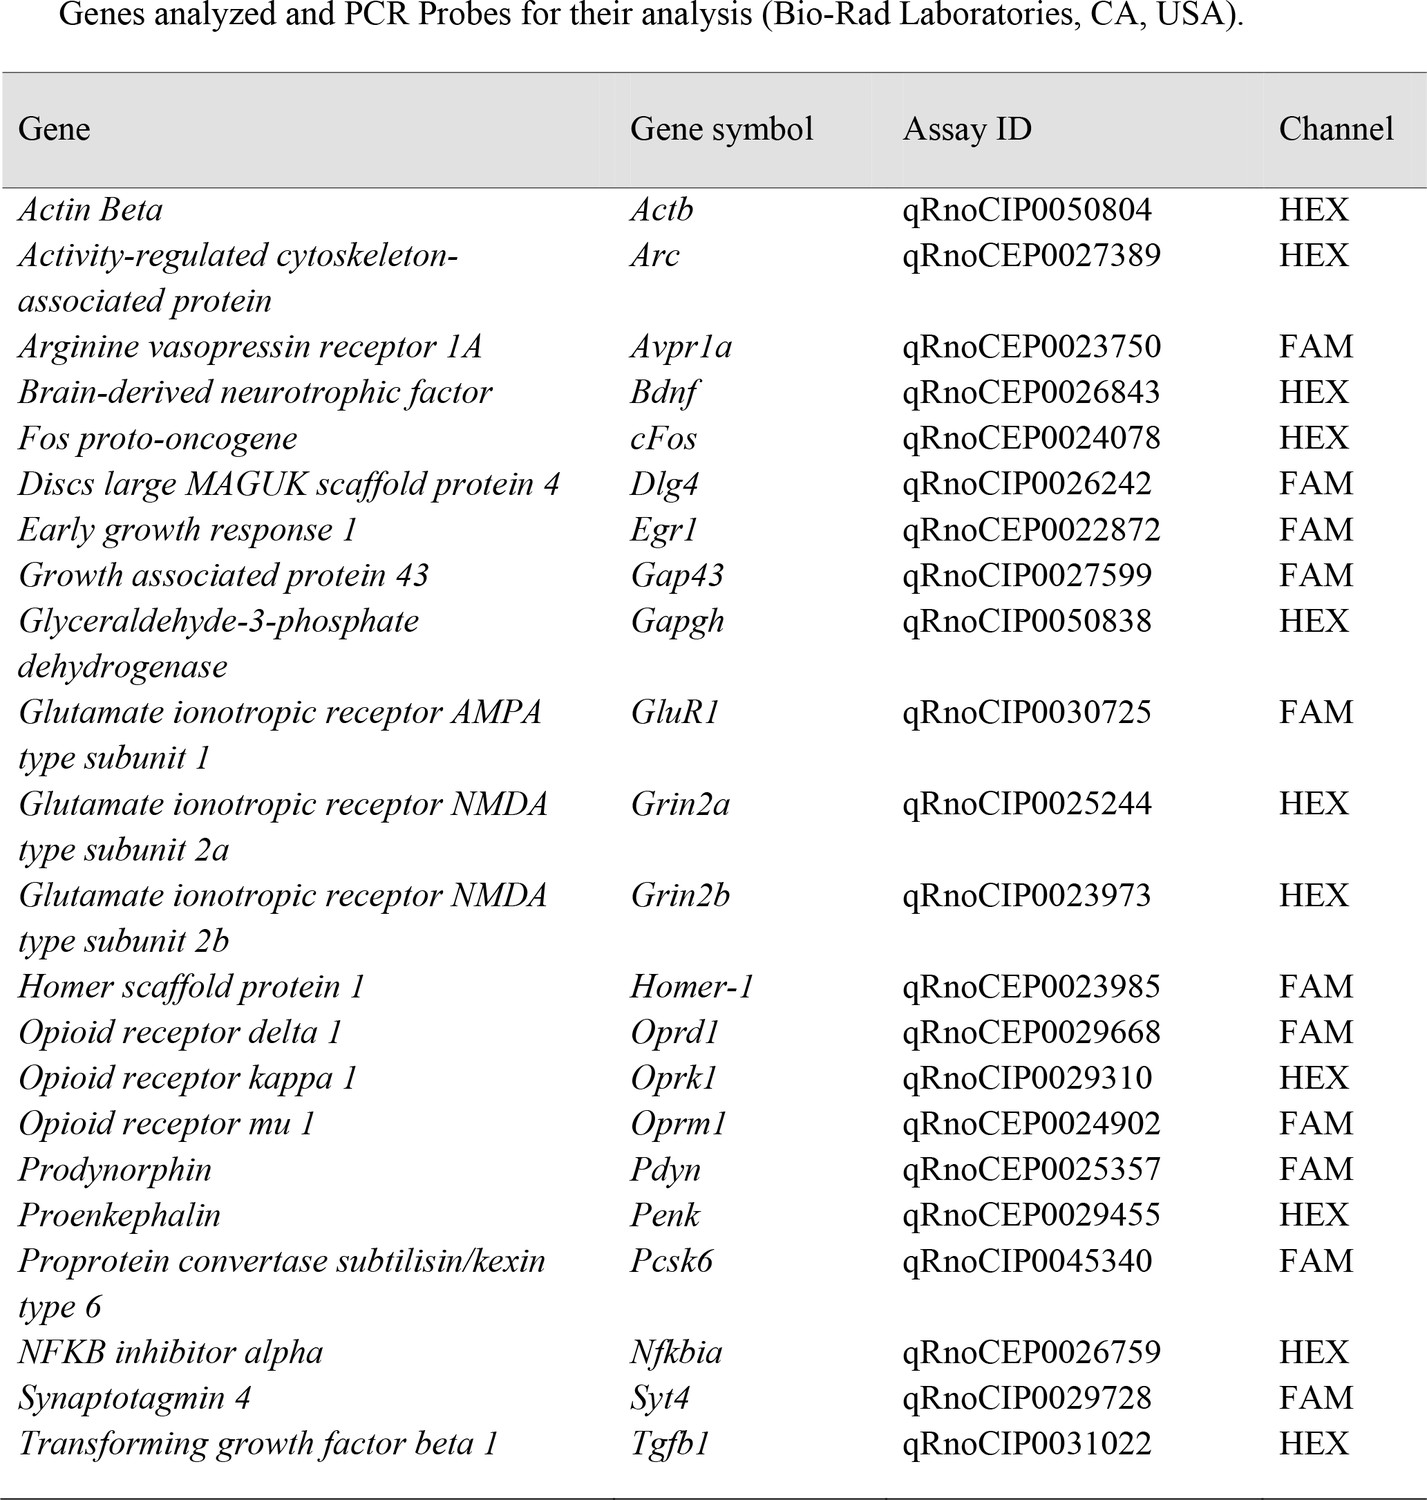
Key resources table
| Reagent type (species) or resource | Designation | Source or reference | Identifiers | Additional information |
|---|---|---|---|---|
| Strain, strain background (Rattus norvegicus) | Wistar Hannover rat, male | Charles River Laboratories, Spain | ||
| Strain, strain background (Rattus norvegicus) | Sprague Dawley rat, male | Taconic, Denmark and Charles River Laboratories, France | ||
| Chemical compound, drug | Isoflurane | Abbott Laboratories, Norway | NDC 0044-5260-03 | Anesthesia agent |
| Chemical compound, drug | Lidocaine hydrochloride | Merck Group, Germany | PHR1257 | Anesthetic |
| Chemical compound, drug | Paraformaldehyde | Sigma-Aldridge, USA | Cat#: 158127 | Perfusion |
| Chemical compound, drug | SSR-149415 | Tocris Bioscience, United Kingdom | Cat#: 6195 | vasopressin V1B antagonist |
| Chemical compound, drug | Naloxone | Tocris Bioscience, United Kingdom | Cat#: 0599 | Opioid antagonist |
| Commercial assay or kit | Giemsa Stain | Sigma-Aldridge, USA | Cat#: 32884 | Nissl staining |
| Commercial assay or kit | RNasy Plus Mini kit | Qiagen, CA, USA | Cat#: 74136 | Total RNA extraction |
| Commercial assay or kit | iScript cDNA Synthesis Kit | Bio-Rad Laboratories, USA | Cat#: 1708891 | cDNA Synthesis |
| Commercial assay or kit | iTaq Universal Probes supermix | Bio-Rad Laboratories, USA | Cat# 1725131 | Real-Time PCR reagent |
| Peptide, recombinant protein | ß-Endorphin | Bachem, Switzerland | Cat# H-2814 | Neurohormone |
| Peptide, recombinant protein | Arg-vasopressin | Bachem, Switzerland | Cat# H-1780 | Neurohormone |
| Antibody | Anti-Dynorphin B (rabbit, polyclonal) | Nguyen et al., 2005; Nylander et al., 1997; Yakovleva et al., 2006 | RIA 1: 350000 | |
| Antibody | Anti-Leu-enkephalin-Arg (rabbit, polyclonal) | Nguyen et al., 2005; Nylander et al., 1997; Yakovleva et al., 2006 | RIA 1: 35000 | |
| Antibody | Anti-Met-enkephalin-Arg-Phe (rabbit, polyclonal) | Nguyen et al., 2005; Nylander et al., 1997; Watanabe et al., 2015 | RIA 1: 15750 | |
| Sequence-based reagent | Actb (Rattus norvegicus) | Bio-Rad Laboratories, USA | qRnoCIP0050804 | PrimePCR Probe assay |
| Sequence-based reagent | Arc (Rattus norvegicus) | Bio-Rad Laboratories, USA | qRnoCEP0027389 | PrimePCR Probe assay |
| Sequence-based reagent | Avpr1a (Rattus norvegicus) | Bio-Rad Laboratories, USA | qRnoCEP0023750 | PrimePCR Probe assay |
| Sequence-based reagent | Bdnf (Rattus norvegicus) | Bio-Rad Laboratories, USA | qRnoCEP0026843 | PrimePCR Probe assay |
| Sequence-based reagent | cFos (Rattus norvegicus) | Bio-Rad Laboratories, USA | qRnoCEP0024078 | PrimePCR Probe assay |
| Sequence-based reagent | Dlg4 (Rattus norvegicus) | Bio-Rad Laboratories, USA | qRnoCIP0026242 | PrimePCR Probe assay |
| Sequence-based reagent | Egr1 (Rattus norvegicus) | Bio-Rad Laboratories, USA | qRnoCEP0022872 | PrimePCR Probe assay |
| Sequence-based reagent | Gap43 (Rattus norvegicus) | Bio-Rad Laboratories, USA | qRnoCIP0027599 | PrimePCR Probe assay |
| Sequence-based reagent | Gapgh (Rattus norvegicus) | Bio-Rad Laboratories, USA | qRnoCIP0050838 | PrimePCR Probe assay |
| Sequence-based reagent | GluR1 (Rattus norvegicus) | Bio-Rad Laboratories, USA | qRnoCIP0030725 | PrimePCR Probe assay |
| Sequence-based reagent | Grin2a (Rattus norvegicus) | Bio-Rad Laboratories, USA | qRnoCIP0025244 | PrimePCR Probe assay |
| Sequence-based reagent | Grin2b (Rattus norvegicus) | Bio-Rad Laboratories, USA | qRnoCIP0023973 | PrimePCR Probe assay |
| Sequence-based reagent | Homer-1 (Rattus norvegicus) | Bio-Rad Laboratories, USA | qRnoCEP0023985 | PrimePCR Probe assay |
| Sequence-based reagent | Oprd1 (Rattus norvegicus) | Bio-Rad Laboratories, USA | qRnoCEP0029668 | PrimePCR Probe assay |
| Sequence-based reagent | Oprk1 (Rattus norvegicus) | Bio-Rad Laboratories, USA | qRnoCIP0029310 | PrimePCR Probe assay |
| Sequence-based reagent | Oprm1 (Rattus norvegicus) | Bio-Rad Laboratories, USA | qRnoCEP0024902 | PrimePCR Probe assay |
| Sequence-based reagent | Pdyn (Rattus norvegicus) | Bio-Rad Laboratories, USA | qRnoCEP0025357 | PrimePCR Probe assay |
| Sequence-based reagent | Penk (Rattus norvegicus) | Bio-Rad Laboratories, USA | qRnoCEP0029455 | PrimePCR Probe assay |
| Sequence-based reagent | Pcsk6 (Rattus norvegicus) | Bio-Rad Laboratories, USA | qRnoCIP0045340 | PrimePCR Probe assay |
| Sequence-based reagent | Nfkbia (Rattus norvegicus) | Bio-Rad Laboratories, USA | qRnoCEP0026759 | PrimePCR Probe assay |
| Sequence-based reagent | Syt4 (Rattus norvegicus) | Bio-Rad Laboratories, USA | qRnoCIP0029728 | PrimePCR Probe assay |
| Sequence-based reagent | Tgfb1 (Rattus norvegicus) | Bio-Rad Laboratories, USA | qRnoCIP0031022 | PrimePCR Probe assay |
| Software, algorithm | Spike 2 | CED, UK | EMG recording | |
| Software, algorithm | Offline Sorter | Plexon, USA | version 3 | |
| Software, algorithm | NeuroExplorer | Nex Technologies, USA | ||
| Software, algorithm | Stan | Carpenter et al., 2017 | v 2.19.2 | Scaling the data |
| Software, algorithm | R program | R Development Core Team, 2018 | v 3.6.1 | |
| Software, algorithm | Brms | Burkner, 2017 | v 2.9.6 | Interface for R |
| Software, algorithm | Emmeans | Searle et al., 2012 | v 1.4 | R package |
| Other | TissuDura | Baxter, Germany | Cat#: 0600096 | Covering material |
Additional files
Download links
A two-part list of links to download the article, or parts of the article, in various formats.
Downloads (link to download the article as PDF)
Open citations (links to open the citations from this article in various online reference manager services)
Cite this article (links to download the citations from this article in formats compatible with various reference manager tools)
Left-right side-specific endocrine signaling complements neural pathways to mediate acute asymmetric effects of brain injury
eLife 10:e65247.
https://doi.org/10.7554/eLife.65247


