Amphiphysin I cleavage by asparagine endopeptidase leads to tau hyperphosphorylation and synaptic dysfunction
- Department of Neurology, Renmin Hospital of Wuhan University, China
- Department of Pathology and Laboratory Medicine, Emory University School of Medicine, United States
- Department of Oncology, Renmin Hospital of Wuhan University, China
- Department of Biochemistry, Emory University School of Medicine, United States
- Department of Neurology, Union Hospital, Tongji Medical College, Huazhong University of Science and Technology, China
Figures
Figure 1
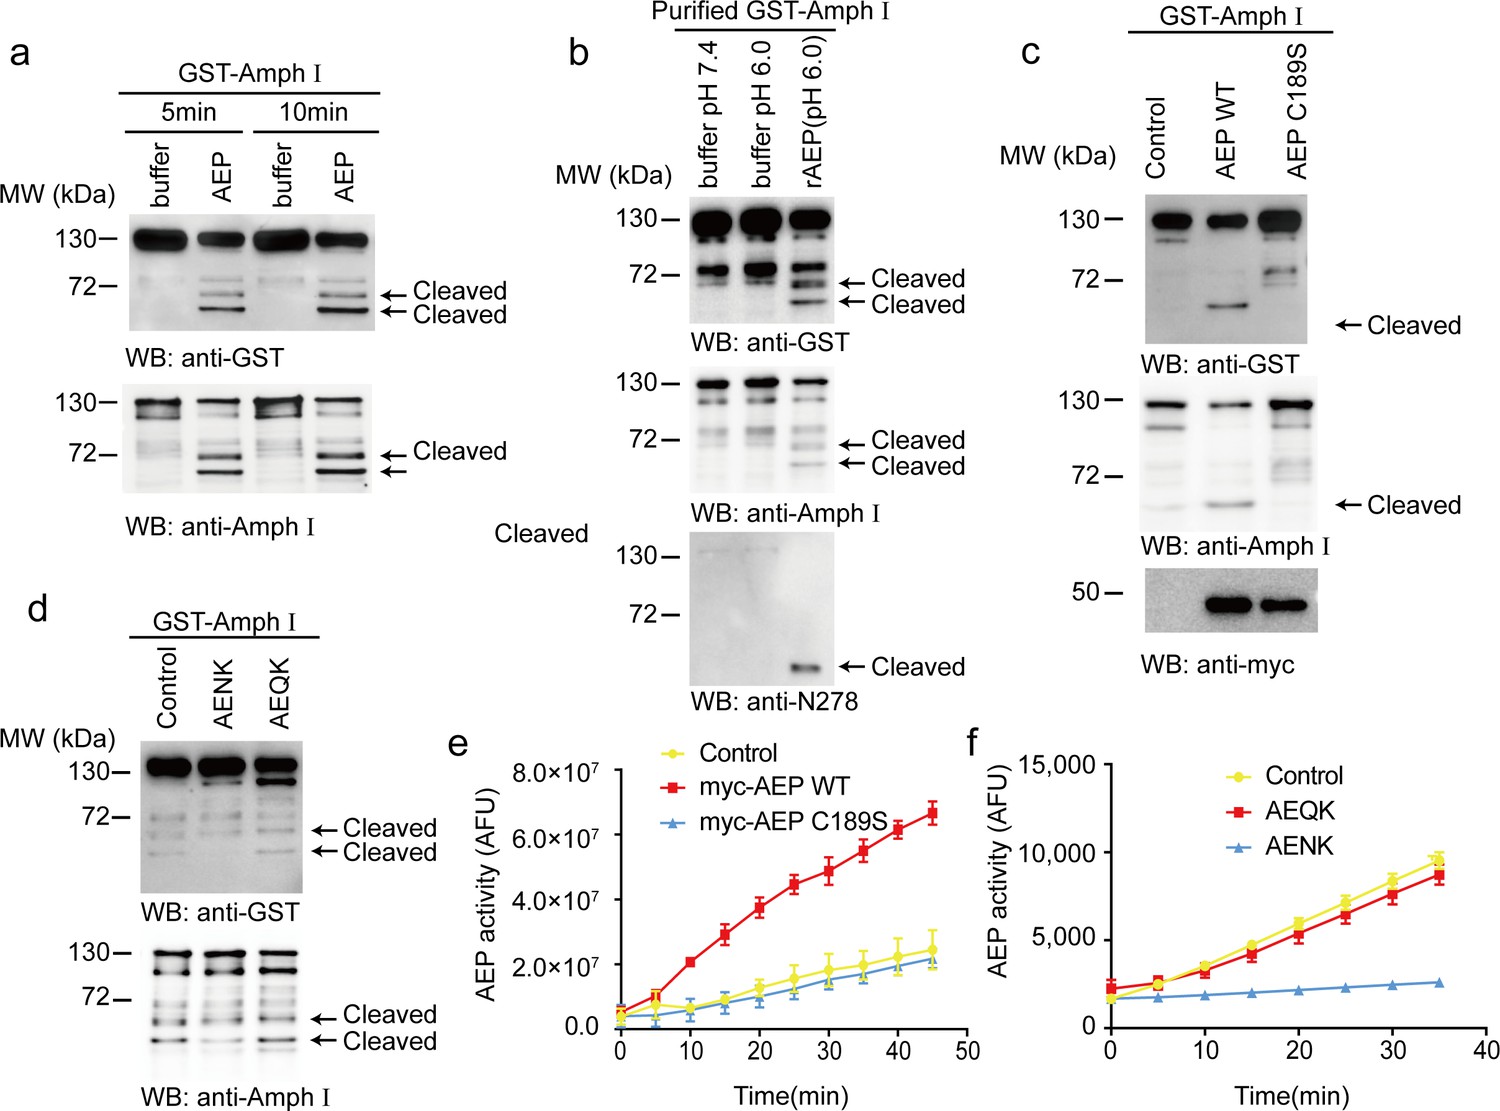
Asparagine endopeptidase (AEP) cleaves Amph I in vitro.
(a) The cell lysate of HEK293 cells overexpressing GST-Amph I were incubated with AEP buffer (pH 6.0) or recombinant AEP for 5 min and 10 min, respectively. Western blot showing the cleavage of Amph I by AEP is increased in a time-dependent manner. (b) GST-Amph I expressing in HEK293 cells was purified by GST pull-down and incubated with AEP buffer (pH 7.4), AEP buffer (pH 6.0), or AEP in AEP buffer (pH 6.0) for 10 min. Western blot showing the cleavage of purified GST-Amph I recombinant protein by purified active recombinant AEP. (c) Cells co-transfected with GST-Amph I with myc-AEP WT or myc-AEP C189S. Western blot showing that only the myc-AEP WT cleaved GST-Amph I. (d) The lysates of cells overexpressing GST- Amph I were incubated with AEP and AENK (AEP inhibitor), AEQK. Western blot showing that AENK peptide but not AEQK inhibited the AEP activity. (e) AEP activity assay in the cell lysates transfected with WT and mutant AEP. Data represent mean ± s.e.m. of three independent experiments. (f) AEP activity assay verifying the inhibitory effect of AENK but not AEQK. Data represent mean ± s.e.m. of three independent experiments. MW, molecular weight; WB, western blot; GST, glutathione S-transferase. AFU, arbitrary fluorescence unit; DMSO, dimethyl sulfoxide.
-
Figure 1—source data 1
AEP activity assay in the cell lysates transfected with WT and mutant AEP.
- https://cdn.elifesciences.org/articles/65301/elife-65301-fig1-data1-v1.xlsx
-
Figure 1—source data 2
AEP activity assay verifying the inhibitory effect of AENK but not AEQK.
- https://cdn.elifesciences.org/articles/65301/elife-65301-fig1-data2-v1.xlsx
Figure 2 with 2 supplements
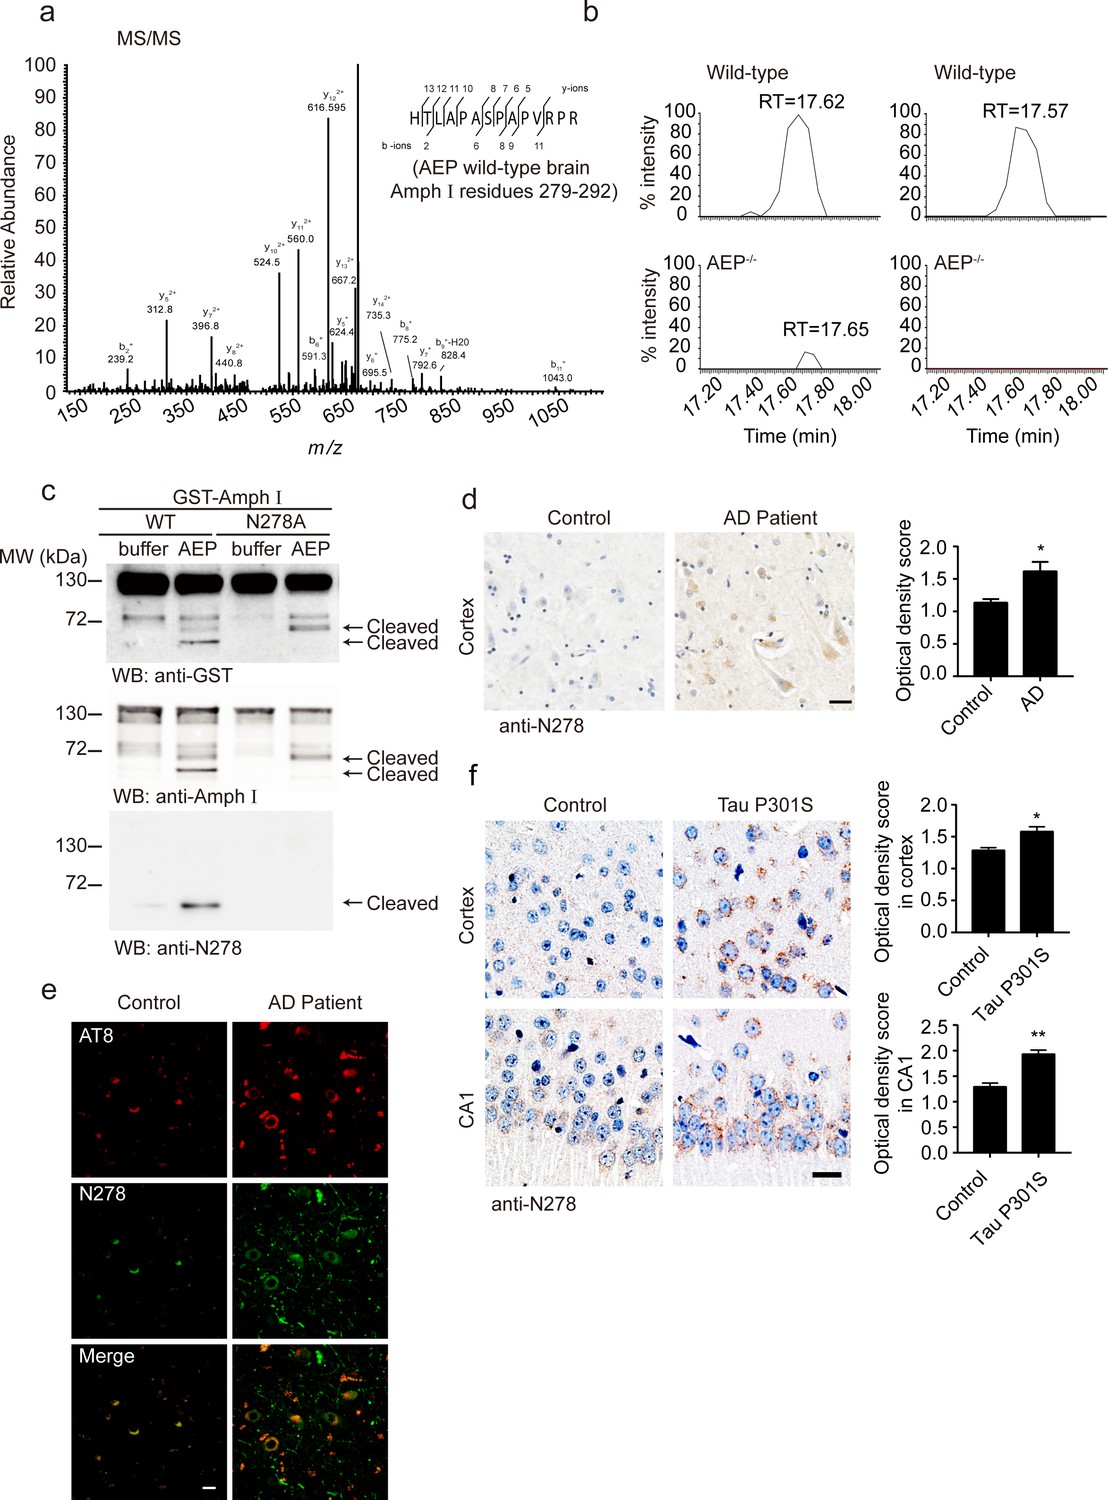
Asparagine endopeptidase (AEP) cleaves Amph I in N278 and generates the fragment 1–278 in Alzheimer’s disease (AD).
(a) MS/MS spectrum showing the cleavage of Amph I after N278 in AEP wild-type brain samples. (b) Representative extracted ion chromatograms for Amph I peptide from two wild-type and two AEP–/–/ mouse brain samples. Signal intensities were then normalized to wild-type samples, setting the maximum signal intensity to 100%. Values are represented as raw peptide extracted ion intensity. (c) Cleavage of mutant Amph I by AEP. Amph I cleavage was analyzed by Western blot after glutathione S-transferase (GST)-Amph I wild-type or N278A mutant was incubated with recombinant AEP. (d) Immunohistochemistry (IHC) of Amph I N278 fragments in brain sections from subjects with AD and control subjects (mean ± s.e.m.; Student’s t-test, n = 4 mice per group; ***p<0.001). Scale bar, 20 μm. (e) The co-immunostaining of anti-N278 (green) with p-tau (red) in brain sections from subjects with AD and control subjects. Scale bar, 20 μm. (f) Immunohistochemistry (IHC) of Amph I N278 fragments in brain sections from 8-month-old Tau P301S mice and wild-type mice (mean ± s.e.m.; Student’s t-test, n = 4 mice per group; ***p<0.001). Scale bar, 20 μm.
-
Figure 2—source data 1
Immunohistochemistry (IHC) of Amph I N278 fragments in brain sections from subjects with AD and control subjects.
- https://cdn.elifesciences.org/articles/65301/elife-65301-fig2-data1-v1.xlsx
-
Figure 2—source data 2
Immunohistochemistry (IHC) of Amph I N278 fragments in brain sections from 8-month-old tau P301S mice and wild-type mice.
- https://cdn.elifesciences.org/articles/65301/elife-65301-fig2-data2-v1.xlsx
Figure 2—figure supplement 1
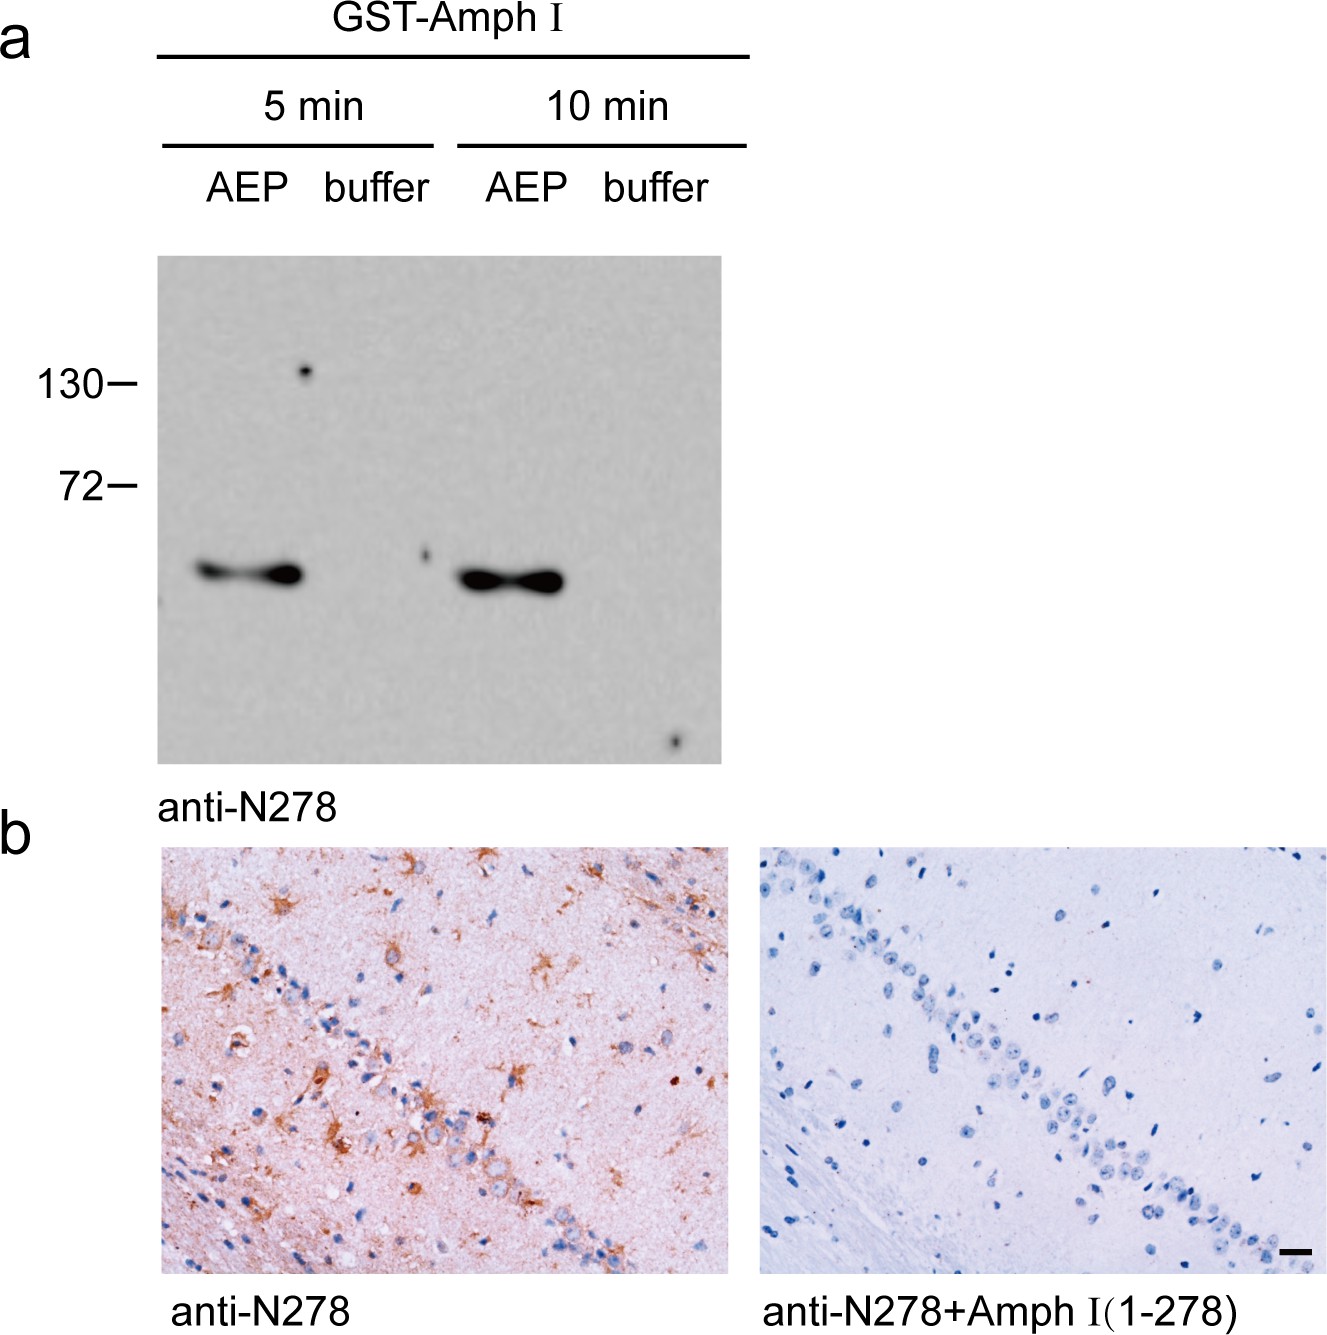
Verification of the anti-Amph I N278 antibody.
(a) Western blot showing the specificity of anti-Amph I N278 antibody. GST-Amph I was incubated with recombinant asparagine endopeptidase (AEP) for 5 min and 10 min, respectively. The anti-Amph I N278 antibody specifically recognized the Amph I (1-278) fragment, but not the full-length Amph I. (b) Immunohistochemistry showing the specificity of anti-Amph I N278 antibody. Preincubation of the anti-Amph I N278 antibody with purified GST-Amph I (1-278) fragment before immunohistochemistry blocked the signals. Scale bar, 20 μm.
Figure 2—figure supplement 2
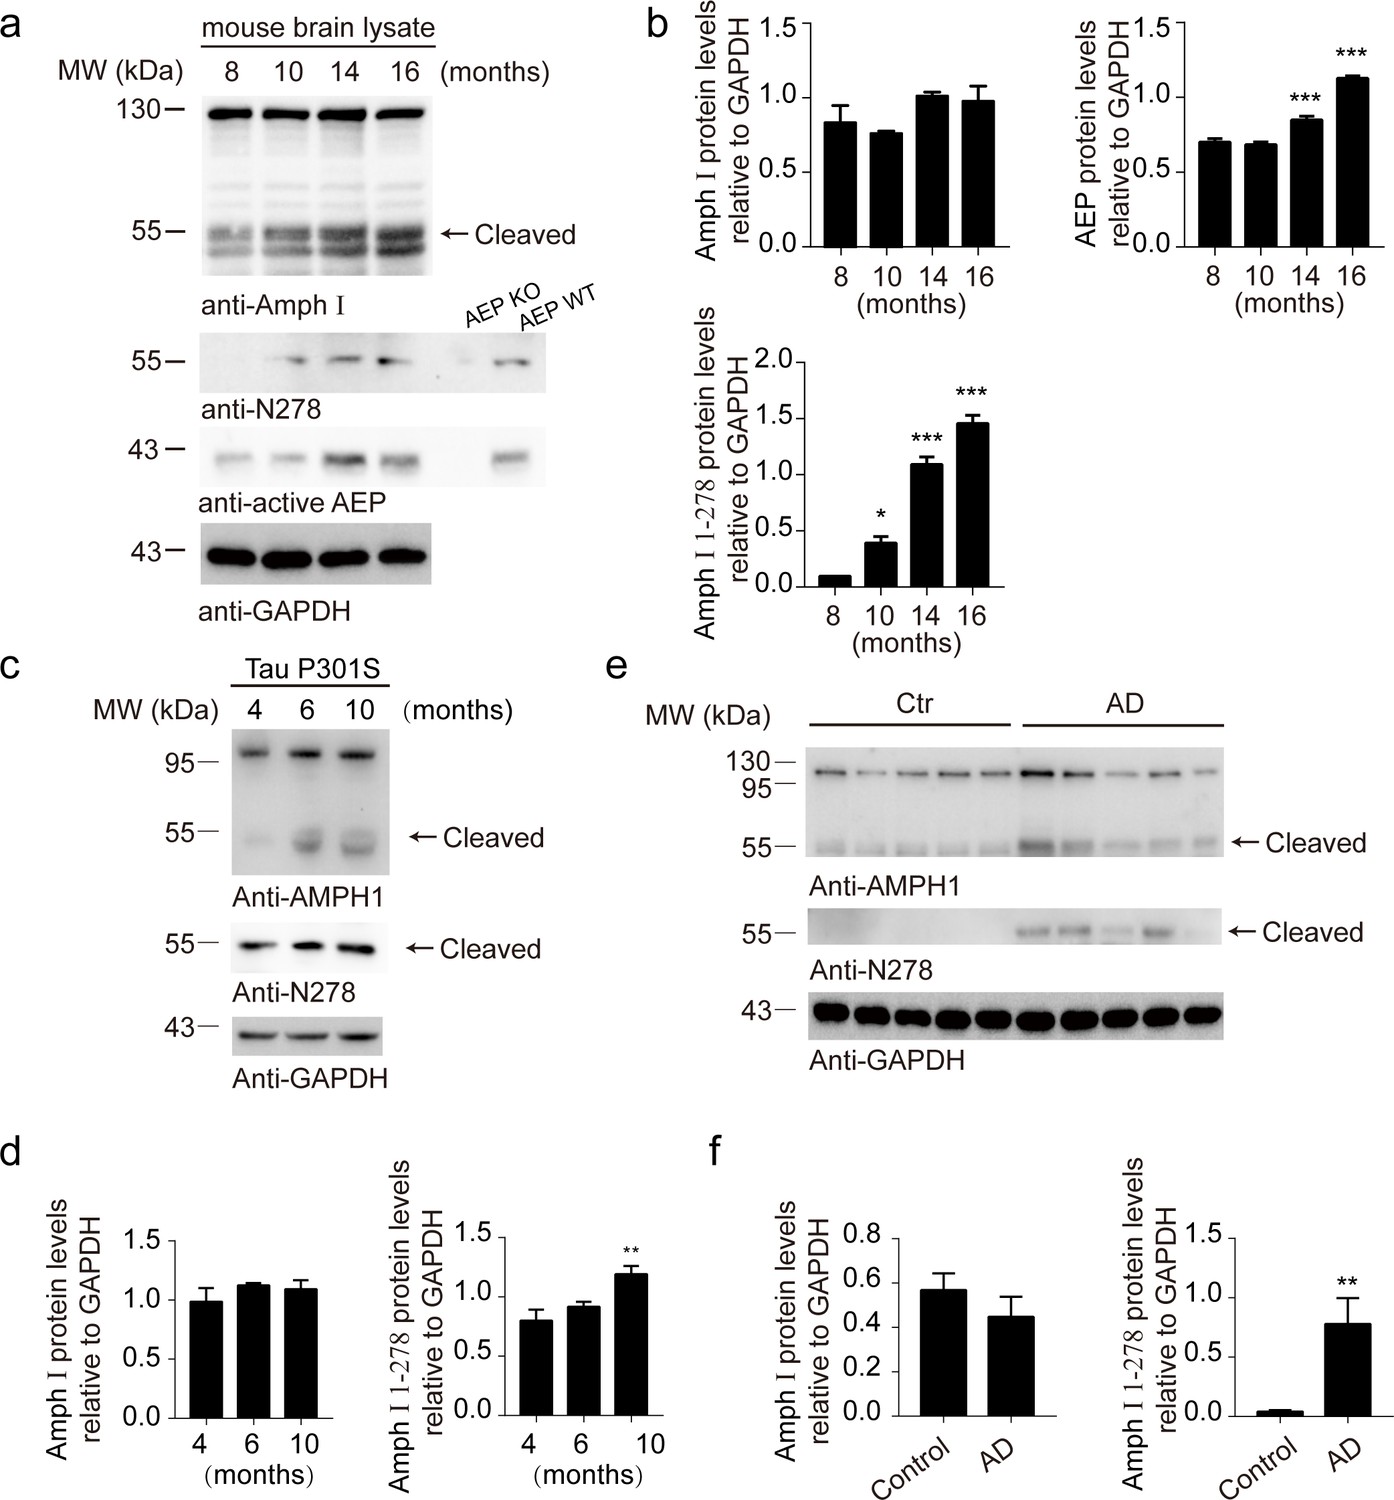
The Amph I (1-278) fragment exists in wild-type, Tau P301S mouse and Alzheimer’s disease (AD) patients.
(a) Western blot analysis of Amph I and asparagine endopeptidase (AEP) in wild-type mouse brain during aging. Brain lysates from AEP knockout mice were used as a negative control. Wild-type brain lysates were used as a positive control. (b) Quantification of immunoreactivity in (a) is shown (mean ± s.e.m.; one-way ANOVA, n = 4; *p<0.05, ***p<0.001 compared with 8-month-old mouse brain). (c, d) Western blot analysis of Amph I and Amph I (1-278) fragment in Tau P301S mouse brain during aging (mean ± s.e.m.; one-way ANOVA, n = 4; **p<0.01 compared with 4-month-old mouse brain). (e, f) Western blot analysis of Amph I and Amph I (1-278) fragment in control and AD human brain samples (mean ± s.e.m.; t-test, n = 5; *p<0.05, **p<0.01).
-
Figure 2—figure supplement 2—source data 1
Western blot analysis of Amph I, Amph I(1-278) and AEP in wild-type mouse brain during aging.
- https://cdn.elifesciences.org/articles/65301/elife-65301-fig2-figsupp2-data1-v1.xlsx
-
Figure 2—figure supplement 2—source data 2
Western blot analysis of Amph I and Amph I(1-278) in tau P301S mouse brain during aging.
- https://cdn.elifesciences.org/articles/65301/elife-65301-fig2-figsupp2-data2-v1.xlsx
-
Figure 2—figure supplement 2—source data 3
Western blot analysis of Amph I and Amph I (1-278) fragment in control and AD human brain samples.
- https://cdn.elifesciences.org/articles/65301/elife-65301-fig2-figsupp2-data3-v1.xlsx
Figure 3
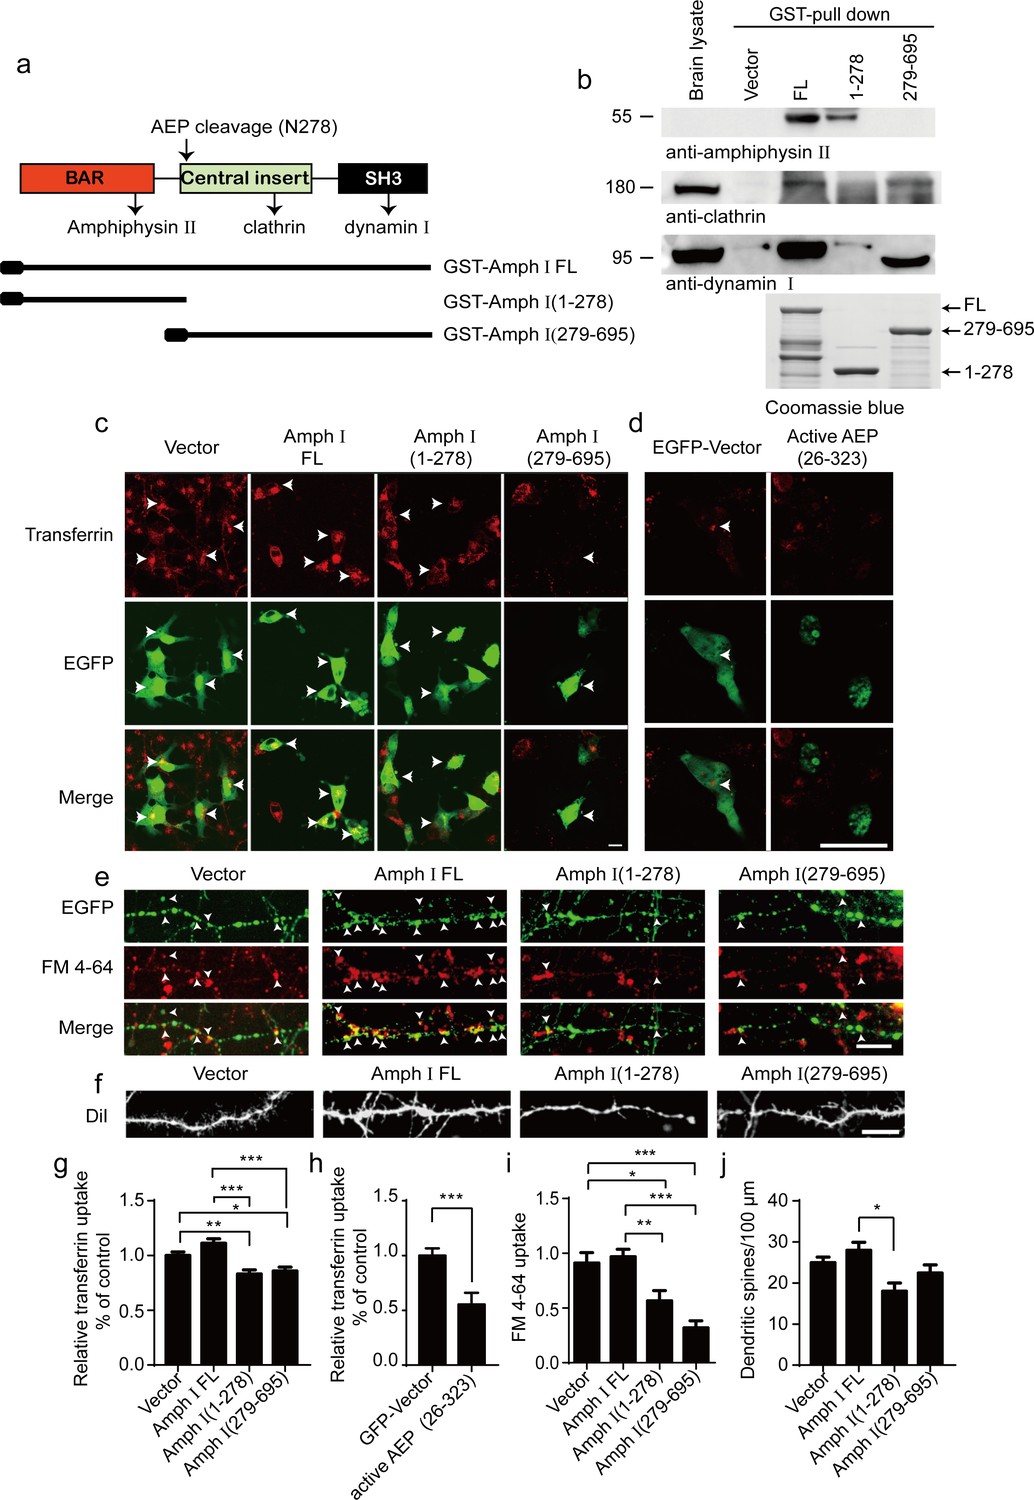
Amph I fragments disrupt clathrin-mediated endocytosis.
(a) Schematic diagram of Amph I domains and its cleavage by asparagine endopeptidase (AEP). The binding sites of Amph I to other dephosphins are also shown. (b) Glutathione S-transferase (GST) pull-down assay. GST vector, GST-Amph I, GST-Amph I (1-278), or GST-Amph I (279-695) bound to glutathione agarose beads were incubated with mice brain lysate. The bound proteins were detected by anti-amphiphysin II, anti-clathrin, anti-dynamin I antibodies. Bottom: The Coomassie blue stain of bGST-Amph I, bGST-Amph I (1-278), or bGST-Amph I (279-695). (c, d) Transferrin uptake assay. Confocal laser scanning micrographs showing the uptake of transferrin by COS-7 cells expressing EGFP, EGFP-Amph I FL, EGFP-Amph I (1-278), EGFP-Amph I (279-695), and EGFP-active AEP (26-323), respectively. Top: Transferrin uptake in transfected cells; middle, EGFP expression in COS-7 cells; bottom, the merge of EGFP and transferrin uptake. The arrows indicate transferrin uptaken by transfected cells. Scale bar, 20 μm. (e) FM 4–64 uptake assay in neurons expressing EGFP, EGFP-Amph I FL, EGFP-Amph I (1-278), or EGFP-Amph I (279-695). Top: EGFP expression; middle, images of FM 4–64; bottom, overlay of EGFP expression and FM 4–64 labeling. FM 4–64 labeling in boutons was inhibited by overexpressing EGFP-Amph I (1-278) and EGFP-Amph I (279-695). The arrows indicate the FM 4–64 labeling in boutons. Scale bar, 20 μm. (f) DiI staining of dendritic spines. The density of dendritic spines in neurons expressing EGFP-Amph I (1-278) is lower than that in neurons expressing EGFP, EGFP-Amph I FL, or EGFP-Amph I (279-695). Scale bar, 20 μm. (g, h) Quantification of the transferrin uptake in COS-7 cells transfected with EGFP, EGFP-Amph I FL, EGFP-Amph I (1-278), EGFP-Amph I (279-695) (g); or EGFP and EGFP-active AEP (26-323) (h). The uptake of transferrin was calculated as the mean fluorescence density of 70–80 cells under each condition. The fluorescence density was normalized to the untransfected cells (mean ± s.e.m. n = 67–83; *p<0.05, **p<0. 01, ***p<0.001). (i) Quantitative analysis of FM 4–64 uptake. FM 4–64 labeling was calculated as the integral fluorescence intensity of 52–70 boutons under each condition. The mean values (± s.e.m) were expressed as the percentage of FM 4–64 labeling in untransfected boutons. ***p<0.001. (j) The dendritic spines density was quantified by calculating the number of dendritic branch per 100 μm dendrite. Data represent mean ± s.e.m. of five independent experiments. **p <0.01.
-
Figure 3—source data 1
Quantification of the transferrin uptake in COS-7 cells transfected with EGFP, EGFP-Amph I FL, EGFP-Amph I (1-278), and EGFP-Amph I (279-695).
- https://cdn.elifesciences.org/articles/65301/elife-65301-fig3-data1-v1.xlsx
-
Figure 3—source data 2
Quantification of the transferrin uptake in COS-7 cells transfected with EGFP and EGFP- active AEP (26-323).
- https://cdn.elifesciences.org/articles/65301/elife-65301-fig3-data2-v1.xlsx
-
Figure 3—source data 3
Quantitative analysis of FM 4-64 uptake.
- https://cdn.elifesciences.org/articles/65301/elife-65301-fig3-data3-v1.xlsx
-
Figure 3—source data 4
Quantification of the dendritic spines density.
- https://cdn.elifesciences.org/articles/65301/elife-65301-fig3-data4-v1.xlsx
Figure 4 with 1 supplement
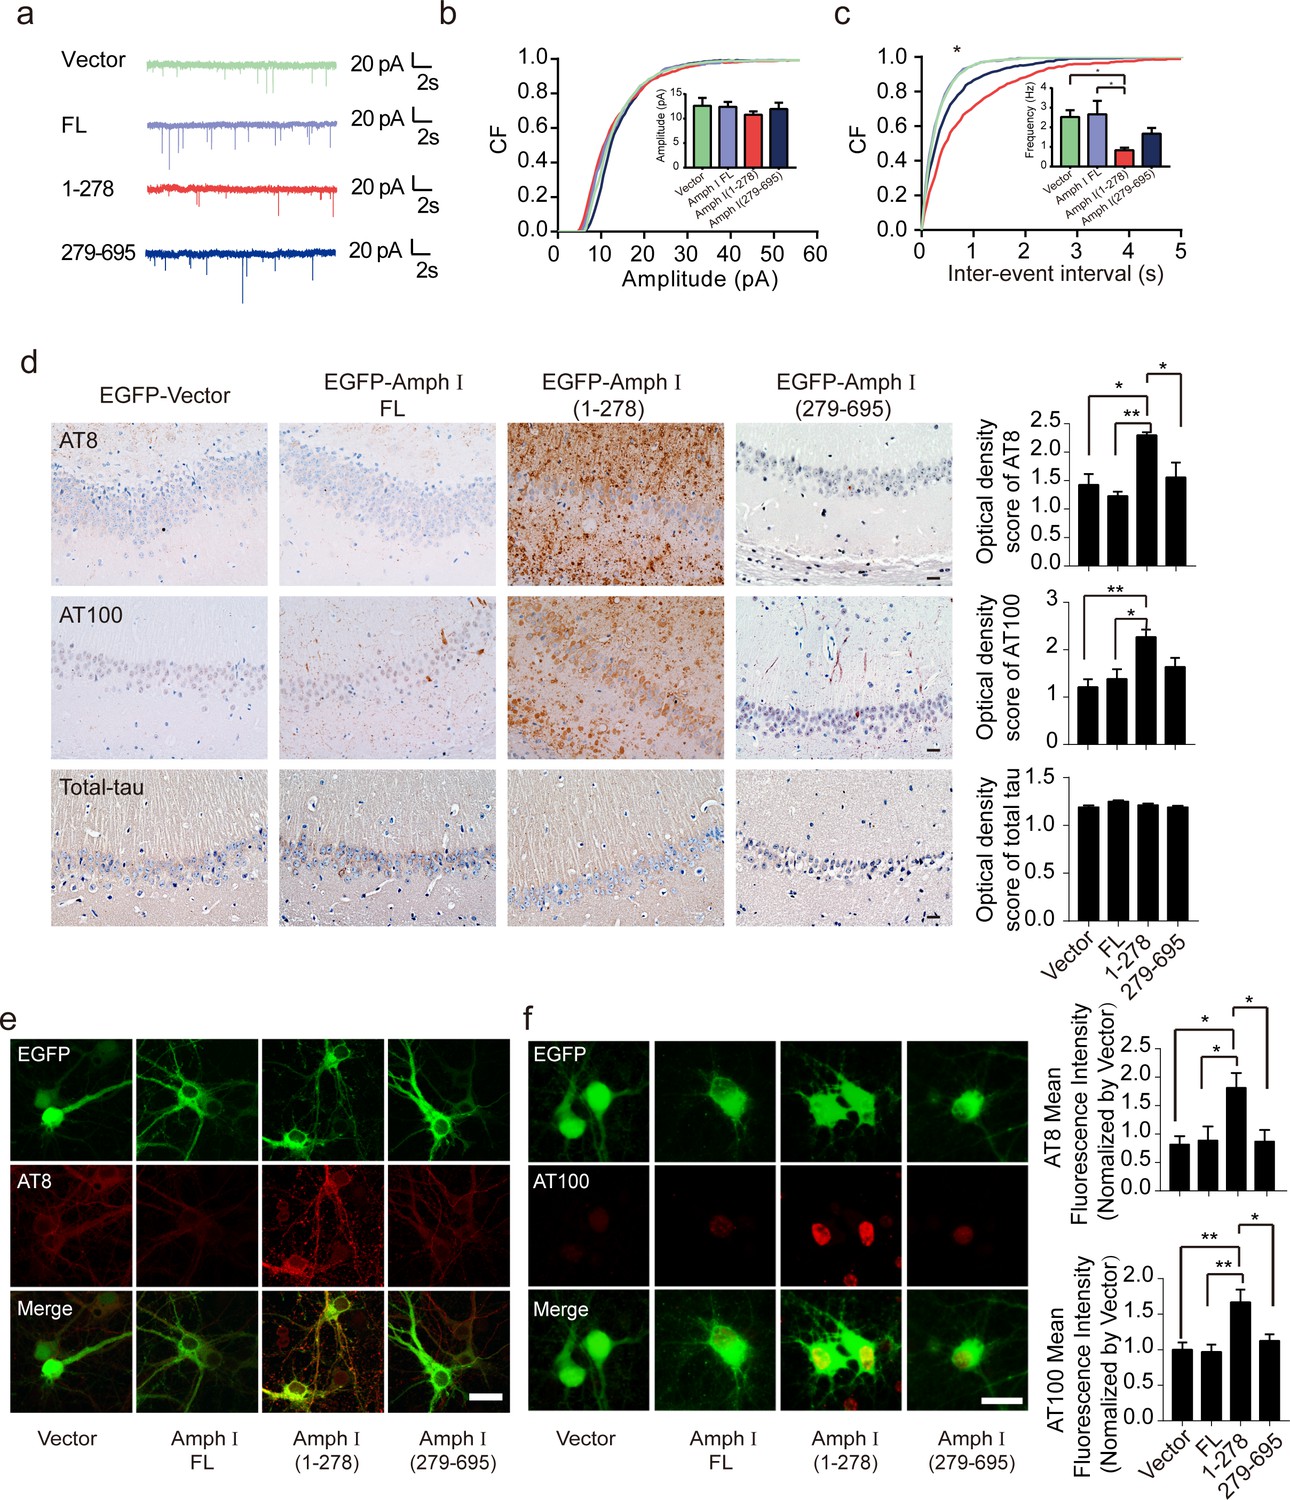
Amph I (1-278) fragment disrupts presynaptic function and promotes the hyperphosphorylation of tau.
(a) Representative traces of miniature excitatory autaptic currents (mEACs) recorded from isolated hippocampal neurons expressing EGFP-Amph I FL, EGFP-Amph I (1-278), or EGFP-Amph I (279-695). (b) Cumulative plots and mean values (inset) of mEAC amplitude in isolated hippocampal neurons expressing full-length Amph I or its fragments. (c) Cumulative plots and mean values (inset) of mEAC frequency in isolated hippocampal neurons in various conditions. Kolmogorov-Smirnov test in c; one-way ANOVA with post hoc Dunnett’s test in d; *p<0.05; **p<0.01; ***p<0.001; n = 5 independent experiment per group. Data are mean ± s.e.m. (d) AT8, AT100, and total-tau immunostaining of hippocampus in Tau P301S injected with adeno-associated virus (AAV) encoding Amph I FL, Amph I (1-278), or Amph I (279-695). Scale bar, 20 μm. Quantification of AT8, AT100, and total tau immunostaining was analyzed by Image J (mean ± s.e.m.; one-way ANOVA, n = 4 mice per group; *p<0.05, **p<0.01). (e) AT8 immunostaining of wild-type rat primary cortical neurons transfected with AAVs encoding EGFP-vector, EGFP-Amph I FL, EGFP-Amph I (1-278), and EGFP-Amph I (279-695). Scale bar, 40 μm. Quantification of AT8 immunostaining was analyzed by Image J. The fluorescence intensity was normalized to EGFP-vector group (mean ± s.e.m.; one-way ANOVA, n = 5 independent experiment per group; *p<0.05). (f) AT100 immunostaining of wild-type rat primary cortical neurons transfected with EGFP-vector, EGFP-Amph I FL, EGFP-Amph I (1-278), EGFP-Amph I (279-695). Scale bar, 20 μm. Quantification of AT100 immunostaining was analyzed by Image J. The fluorescence intensity was normalized to EGFP-vector group (mean ± s.e.m.; one-way ANOVA, n = 5 independent experiment per group; *p<0.05, **p<0.01).
-
Figure 4—source data 1
Cumulative plots and mean values of mEAC amplitude in isolated hippocampal neurons expressing full-length Amph I or its fragments.
- https://cdn.elifesciences.org/articles/65301/elife-65301-fig4-data1-v1.xlsx
-
Figure 4—source data 2
Cumulative plots and mean values of mEAC frequency in isolated hippocampal neurons expressing full-length Amph I or its fragments.
- https://cdn.elifesciences.org/articles/65301/elife-65301-fig4-data2-v1.xlsx
-
Figure 4—source data 3
AT8, AT100 and total-tau immunostaining of hippocampus in Tau P301S injected with AAVs encoding Amph I FL, Amph I (1-278), or Amph I (279-695).
- https://cdn.elifesciences.org/articles/65301/elife-65301-fig4-data3-v1.xlsx
-
Figure 4—source data 4
Quantification of AT8 and AT100 immunostaining were analyzed by Image J.
- https://cdn.elifesciences.org/articles/65301/elife-65301-fig4-data4-v1.xlsx
Figure 4—figure supplement 1
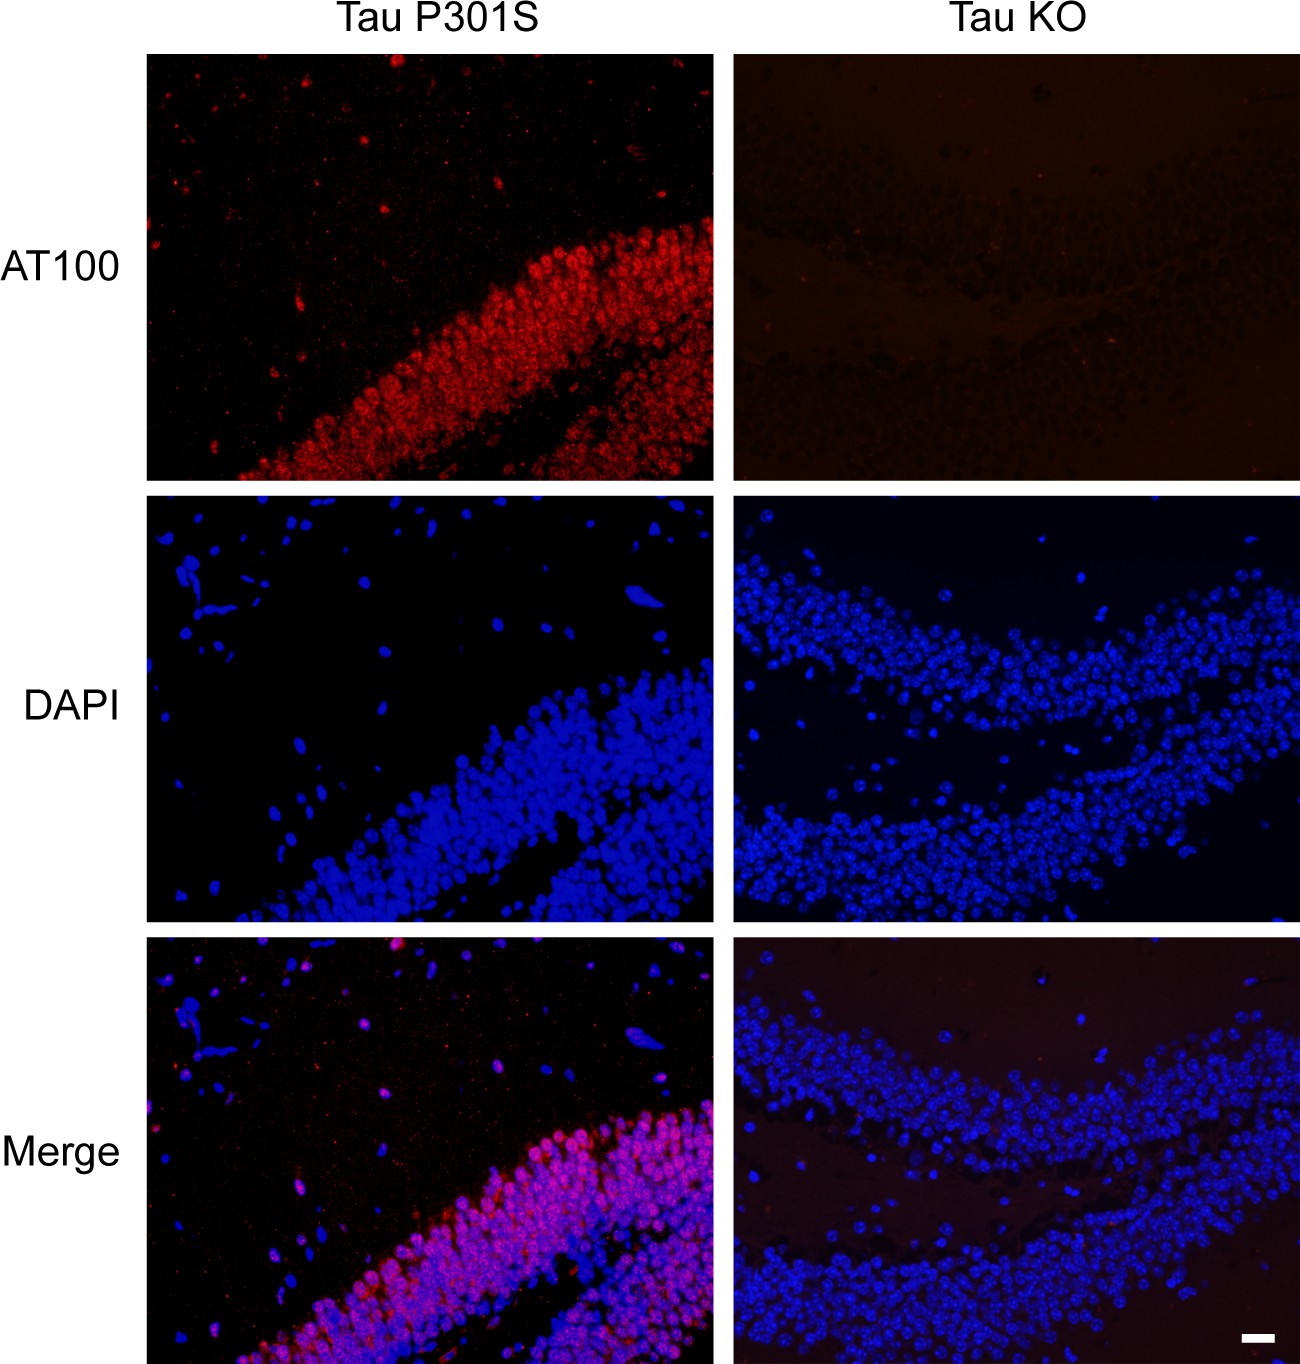
Verification of the AT100 antibody.
Immunostaining of the Tau P301S and tau knockout (KO) mice brain sections by AT100 are shown. The signals were completely abolished in the tau KO mice brain sections. Scale bar, 20 μm.
Figure 5
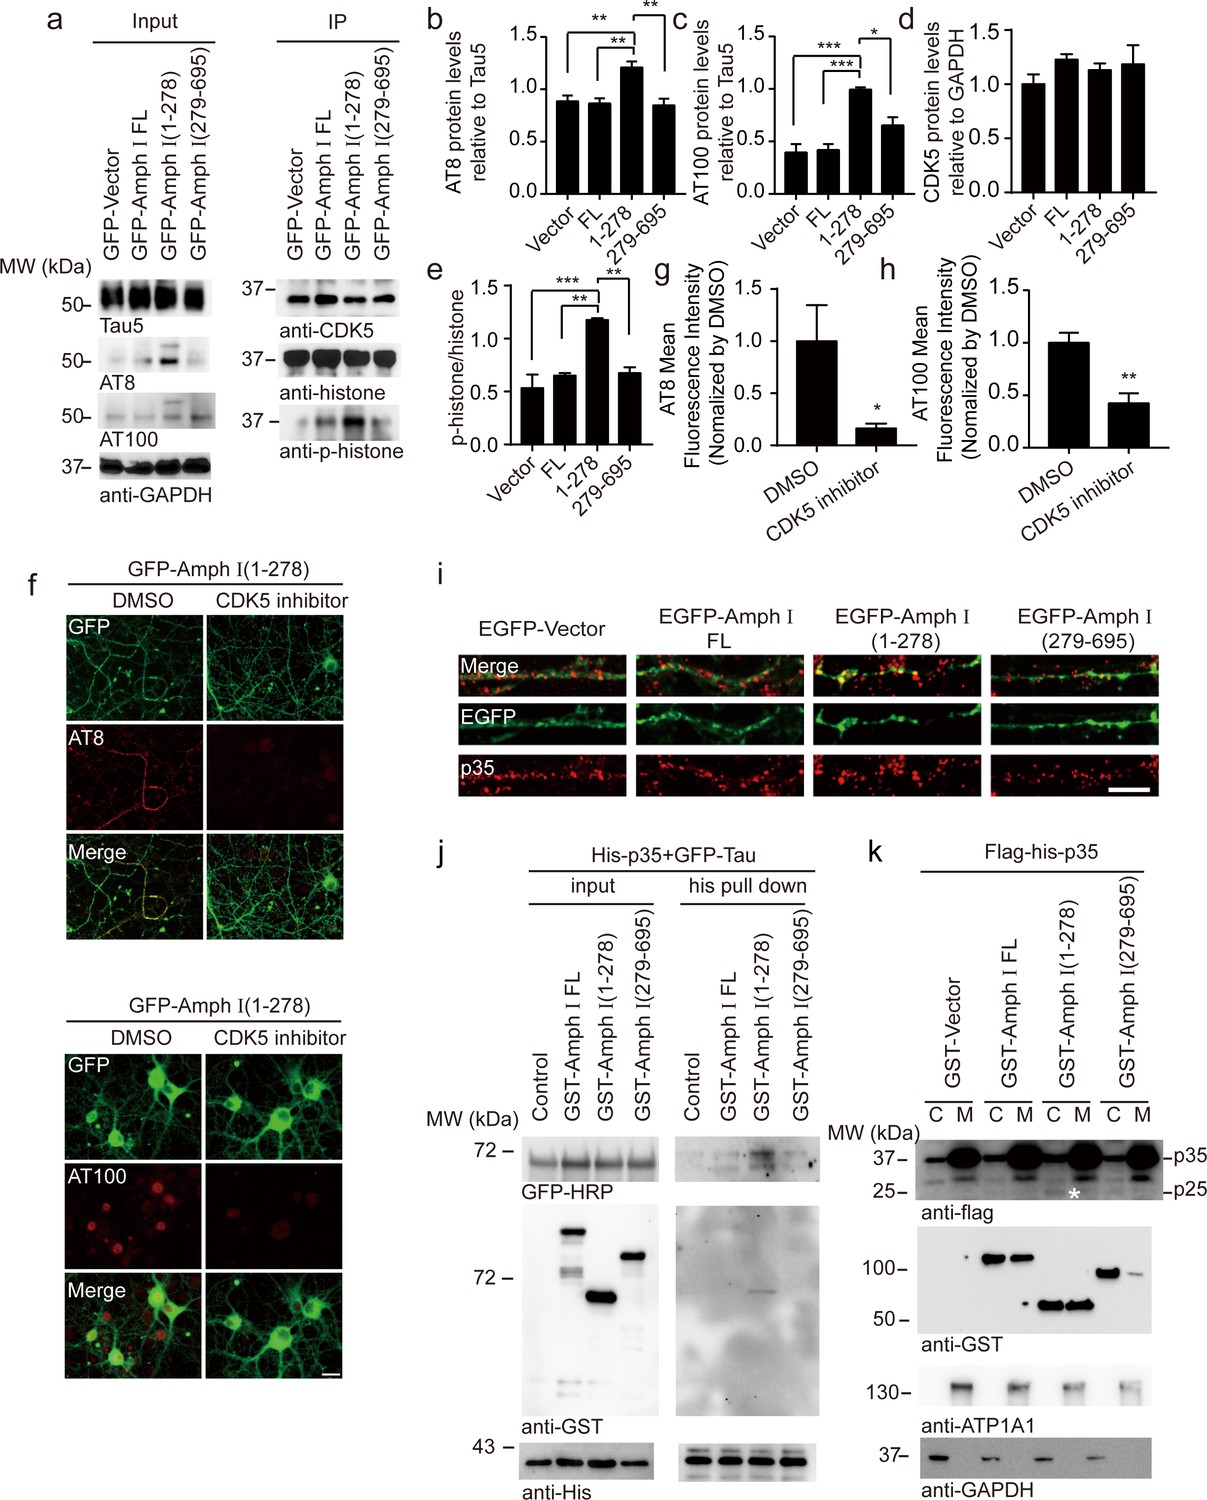
Amph I (1-278) fragment enhances CDK5 kinase activity.
(a) Western blot showing the tau hyperphosphorylation of primary cortical neurons transfected with EGFP-vector, EGFP-Amph I FL, EGFP-Amph I (1-278), EGFP-Amph I (279-695). Left: The neuron lysate was detected by AT8, AT100, Tau5, and GAPDH antibodies. Right: The neuron lysate was immunoprecipitated with the anti-CDK5 antibody conjugated to protein A/G sepharose. The CDK5 activity was measured as the level of histone H1 phosphorylation. (b–e) Quantification of the immunoreactivity in (a) (mean ± s.e.m.; one-way ANOVA, n = 4 independent experiments per group; *p<0.05, **p<0.01, ***p<0.001). (f) AT8 and AT100 immunostaining of primary neurons showing the effect of 10 μM CDK5 inhibitor roscovitine on tau hyperphosphorylation. Scale bar, 20 μm. (g, h) Quantification of AT8, AT100 immunostaining shown in (f). The fluorescence intensity was normalized to dimethyl sulfoxide (DMSO) group (mean ± s.e.m.; one-way ANOVA, n = 5 independent experiment per group; *p<0.05, **p<0.01). (i) Immunostaining of primary neurons showing the localization of p35 in boutons expressing Amph I and its fragments. Scale bar, 10 μm. (j) His pull-down assay showing the interaction between p35, Tau, and Amph I fragments. His-p35, EGFP-Tau, GST-vector, GST-Amph I FL, GST-Amph I (1-278), or GST-Amph I (279-695) was expressed in HEK293 as indicated. (k) Western blot showing the distribution of Flag-His-p35 and GST-vector, GST-Amph I FL, GST-Amph I (1-278) or GST-Amph I (279-695) in cytoplasm and membrane. ATP1A1 is the marker of the membrane. Asterisks indicate p25. C, cytoplasm; M, membrane.
-
Figure 5—source data 1
Quantification of the immunoreactivity of AT8, AT100, CDK5, p-histone/histone.
- https://cdn.elifesciences.org/articles/65301/elife-65301-fig5-data1-v1.xlsx
-
Figure 5—source data 2
Quantification of AT8, AT100 immunostaining .
- https://cdn.elifesciences.org/articles/65301/elife-65301-fig5-data2-v1.xlsx
Figure 6

Amph I fragments induce synaptic dysfunction and cognitive impairments in Tau P301S transgenic mice.
(a) The expression of EGFP in Tau P301S mice injected with AAV-EGFP. Scale bar, 1 mm. (b) Electron microscopy of synapses. Arrows indicate the synapses. Scale bar, 5 μm. (c) Quantification of synaptic density (mean ± s.e.m.; n = 5 mice per group; ***p<0.001, one-way ANOVA). (d) Golgi staining revealed the dendritic spines from the apical dendritic layer of the CA1 region. Scale bar, 20 μm. (e) Quantification of spine density (mean ± s.e.m.; n = 5 mice per group; *p<0.05, one-way ANOVA). (f, g) Morris water maze analysis as the escape latency (g) and escape latency in day 4 (h) (mean ± s.e.m.; n = 8; ***p<0.001, one-way ANOVA). (h) Probe trial of Morris water maze test (mean ± s.e.m.; n = 8 mice per group; *p<0.05, **p<0.01, one-way ANOVA). (i) Swim speed of mice injected with AAVs encoding EGFP, EGFP-Amph I FL, EGFP-Amph I (1-278), and EGFP-Amph I (279-695) (mean ± s.e.m.; n = 8 mice per group; one-way ANOVA). (j) Y-maze analysis as time spent in new arms (mean ± s.e.m.; n = 8 mice per group; *p<0.05, **p<0.01, one-way ANOVA). (k) The slope of fEPSP after HFS recorded on hippocampal slices. Arrow indicates HFS onset. Shown traces are representative fEPSPs of three samples recorded before and after LTP induction. (l) Quantitative analyses for normalized fEPSPs 70–90 min after HFS (mean ± s.e.m.; n = 3 mice per group; ***p<0.001, two-way ANOVA). AAV, adeno-associated virus; HFS, high-frequency stimulation; LTP, long-term potentiation.
-
Figure 6—source data 1
Quantification of synaptic density.
- https://cdn.elifesciences.org/articles/65301/elife-65301-fig6-data1-v1.xlsx
-
Figure 6—source data 2
Quantification of spine number.
- https://cdn.elifesciences.org/articles/65301/elife-65301-fig6-data2-v1.xlsx
-
Figure 6—source data 3
Escape latency of Morris water maze analysis.
- https://cdn.elifesciences.org/articles/65301/elife-65301-fig6-data3-v1.xlsx
-
Figure 6—source data 4
Escape latency of Morris water maze analysis in day 4.
- https://cdn.elifesciences.org/articles/65301/elife-65301-fig6-data4-v1.xlsx
-
Figure 6—source data 5
Probe trial of Morris water maze test.
- https://cdn.elifesciences.org/articles/65301/elife-65301-fig6-data5-v1.xlsx
-
Figure 6—source data 6
Swim speed of mice injected with AAVs encoding EGFP, EGFP-Amph I FL, EGFP-Amph I (1-278), and EGFP-Amph I (279-695).
- https://cdn.elifesciences.org/articles/65301/elife-65301-fig6-data6-v1.xlsx
-
Figure 6—source data 7
Y maze analysis as time spent in new arms.
- https://cdn.elifesciences.org/articles/65301/elife-65301-fig6-data7-v1.xlsx
-
Figure 6—source data 8
The slope of fEPSP after HFS recorded on hippocampal slices.
- https://cdn.elifesciences.org/articles/65301/elife-65301-fig6-data8-v1.xlsx
-
Figure 6—source data 9
Quantitative analyses for the average of normalized fEPSPs 70-90 min after HFS.
- https://cdn.elifesciences.org/articles/65301/elife-65301-fig6-data9-v1.xlsx
Figure 7 with 1 supplement
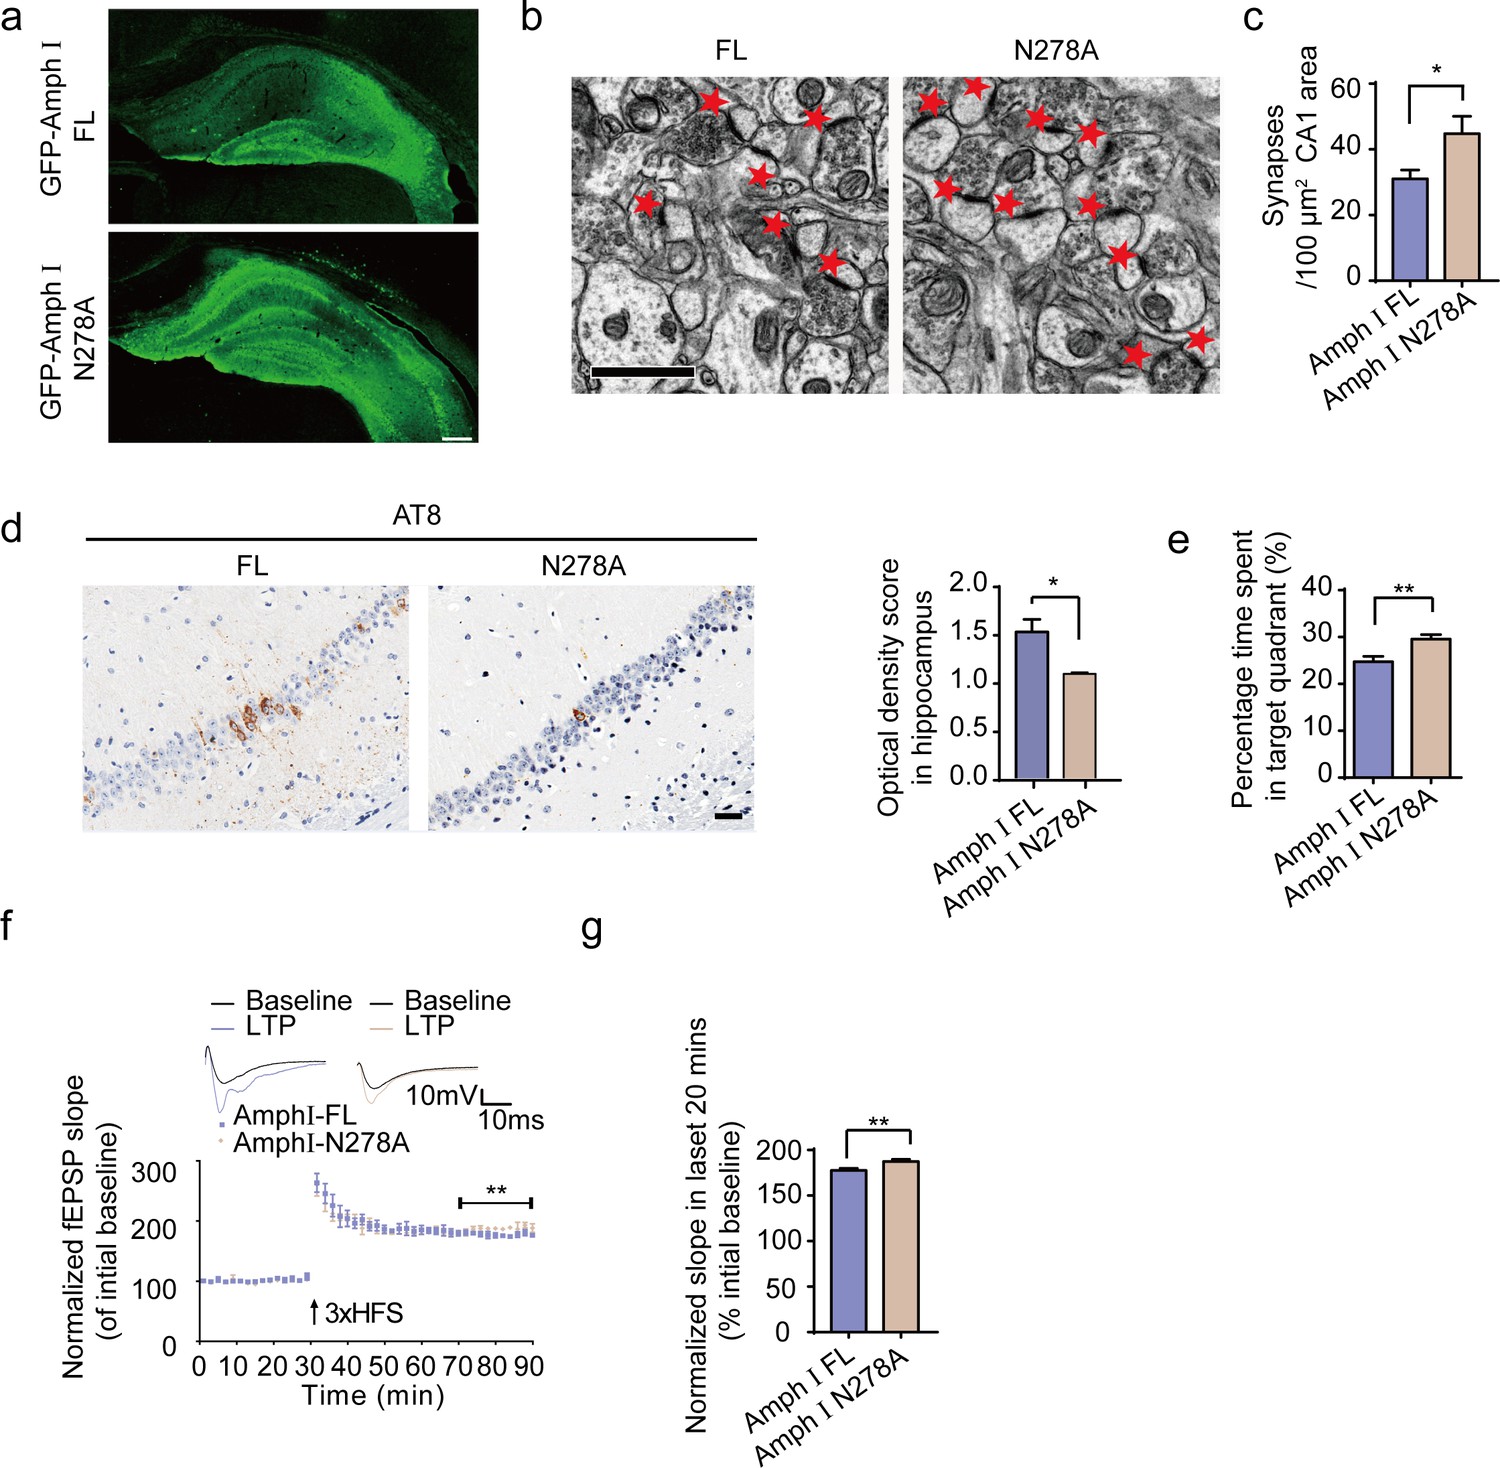
Expression of Amph1 N278A enhances synaptic and cognitive function in Tau P301S mice.
(a) The expression of wild-type Amph I and N278A Amph I in Tau P301S mice. Scale bar, 200 μm. (b, c) Electron microscopy of synapses. Arrows indicate the synapses (n = 5 mice per group). Scale bar, 5 μm. (c) Quantification of synaptic density (mean ± s.e.m.; n = 5 mice per group; *p<0.05, Student’s t-test). (d) AT8 immunostaining of hippocampus in Tau P301S injected with AAVs encoding Amph I FL and Amph I N278A. Scale bar, 20 μm. Quantification of the immunoreactivity (mean ± s.e.m.; one-way ANOVA, n = 4 mice per group; *p<0.05). (e) Probe trial of Morris water maze test (mean ± s.e.m.; n = 8 mice per group; *p<0.05, Student’s t-test). (f) The slope of fEPSP after HFS recorded on hippocampal slices expressing wild-type and N278A mutant Amph I. Arrow indicates HFS onset. Shown traces are representative fEPSPs of three samples recorded before and after LTP induction. (g) Quantitative analyses for normalized fEPSPs 70–90 min after HFS (mean ± s.e.m.; n = 3 mice per group; **p<0.01, Paired t-test). AAV, adeno-associated virus; HFS, high-frequency stimulation; LTP, long-term potentiation.
-
Figure 7—source data 1
Quantification of synaptic density.
- https://cdn.elifesciences.org/articles/65301/elife-65301-fig7-data1-v1.xlsx
-
Figure 7—source data 2
AT8 immunostaining of hippocampus in Tau P301S injected with AAVs encoding Amph I FL and Amph I N278A.
- https://cdn.elifesciences.org/articles/65301/elife-65301-fig7-data2-v1.xlsx
-
Figure 7—source data 3
Probe trial of Morris water maze test.
- https://cdn.elifesciences.org/articles/65301/elife-65301-fig7-data3-v1.xlsx
-
Figure 7—source data 4
The slope of fEPSP after HFS recorded on hippocampal slices.
- https://cdn.elifesciences.org/articles/65301/elife-65301-fig7-data4-v1.xlsx
-
Figure 7—source data 5
Quantitative analyses for the normalized fEPSPs 70-90 min after HFS.
- https://cdn.elifesciences.org/articles/65301/elife-65301-fig7-data5-v1.xlsx
Figure 7—figure supplement 1
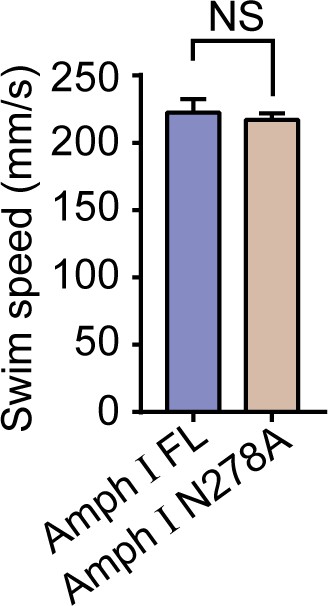
Expression of Amph1 N278A does not affect motor function.
Swim speed of mice injected with AAVs-EGFP-Amph I FL and EGFP-Amph I N278A (mean ± s.e.m.; n = 8 mice pre group; Student’s t-test). AAV, adeno-associated virus.
-
Figure 7—figure supplement 1—source data 1
Swim speed of mice injected with AAVs encoding EGFP-Amph I FL and EGFP-Amph I N278A.
- https://cdn.elifesciences.org/articles/65301/elife-65301-fig7-figsupp1-data1-v1.xlsx
Tables
Key resources table
| Reagent type (species) or resource | Designation | Source or reference | Identifiers | Additional information |
|---|---|---|---|---|
| Antibody | Anti-GST | Proteintech | Cat # 66001–2-Ig | WB (1:5000) |
| (mouse monoclonal) | RRID:AB_2881488 | |||
| Antibody | EGFP-HRP | Proteintech | Cat # HRP-66002 | WB (1:5000) |
| (mouse monoclonal) | RRID:AB_2883834 | |||
| Antibody | Anti-HIS | Proteintech | Cat # 66005–1-Ig | WB (1:5000) |
| (mouse monoclonal) | RRID:AB_11232599 | |||
| Antibody | Anti-GAPDH | Proteintech | Cat # 60004–1-Ig | WB (1:5000) |
| (mouse monoclonal) | RRID:AB_2107436 | |||
| Antibody | Anti-Amphiphysin I | Santa cruz | Cat # sc-21710 | WB (1:1000) |
| (mouse monoclonal) | RRID:AB_673386 | |||
| Antibody | Anti-Amphiphysin 2 | Santa cruz | Cat # sc-23918 | WB (1:1000) |
| (mouse monoclonal) | RRID:AB_667901 | |||
| Antibody | Anti-dynamin 1 | Proteintech | Cat # 18205–1-AP | WB (1:1000) |
| (mouse monoclonal) | RRID:AB_2093197 | |||
| Antibody | AT8 | Thermo | Cat # MN1020 | WB/IF/IHC (1:1000) |
| (mouse monoclonal) | RRID:AB_223647 | |||
| Antibody | AT100 | Thermo | Cat # MN1060 | WB/IF/IHC (1:1000) |
| (mouse monoclonal) | RRID:AB_223652 | |||
| Antibody | tau5 | Thermo | Cat # MA5-12805 | WB/IHC (1:1000) |
| (mouse monoclonal) | RRID:AB_10978000 | |||
| Antibody | Anti-CDK5 | Santa cruz | Cat # sc-6247 | WB (1:1000) |
| (mouse monoclonal) | RRID:AB_627241 | |||
| Antibody | Anti-Histone H1 | Abcam | Cat # ab61177 | WB (1:1000) |
| (polyclonal antibody) | RRID:AB_941946 | |||
| Antibody | Anti-p-histone H1 | Abcam | Cat # ab3596 | WB (1:1000) |
| (polyclonal antibody) | RRID:AB_303939 | |||
| Chemical compound | Transferrin Alexa Fluor 546 | Thermo | Cat # T23364 | |
| Chemical compound | FM 4–64 | Thermo | Cat # T13320 | |
| Protein | Recombinant AEP | Sino Biological | Cat # 50051-M07H |
Additional files
-
Supplementary file 1
The demographic and pathological characteristics of human samples.
- https://cdn.elifesciences.org/articles/65301/elife-65301-supp1-v1.xlsx
-
Transparent reporting form
- https://cdn.elifesciences.org/articles/65301/elife-65301-transrepform-v1.docx
Download links
A two-part list of links to download the article, or parts of the article, in various formats.
Downloads (link to download the article as PDF)
Open citations (links to open the citations from this article in various online reference manager services)
Cite this article (links to download the citations from this article in formats compatible with various reference manager tools)
Amphiphysin I cleavage by asparagine endopeptidase leads to tau hyperphosphorylation and synaptic dysfunction
eLife 10:e65301.
https://doi.org/10.7554/eLife.65301


