A fungal member of the Arabidopsis thaliana phyllosphere antagonizes Albugo laibachii via a GH25 lysozyme
- Institute for Plant Sciences and Cluster of Excellence on Plant Sciences (CEPLAS), University of Cologne, Center for Molecular Biosciences, Germany
- Max Planck Institute for Plant Breeding Research, Germany
- Department of Microbial Interactions, IMIT/ZMBP, University of Tübingen, Germany
Figures
Figure 1 with 2 supplements
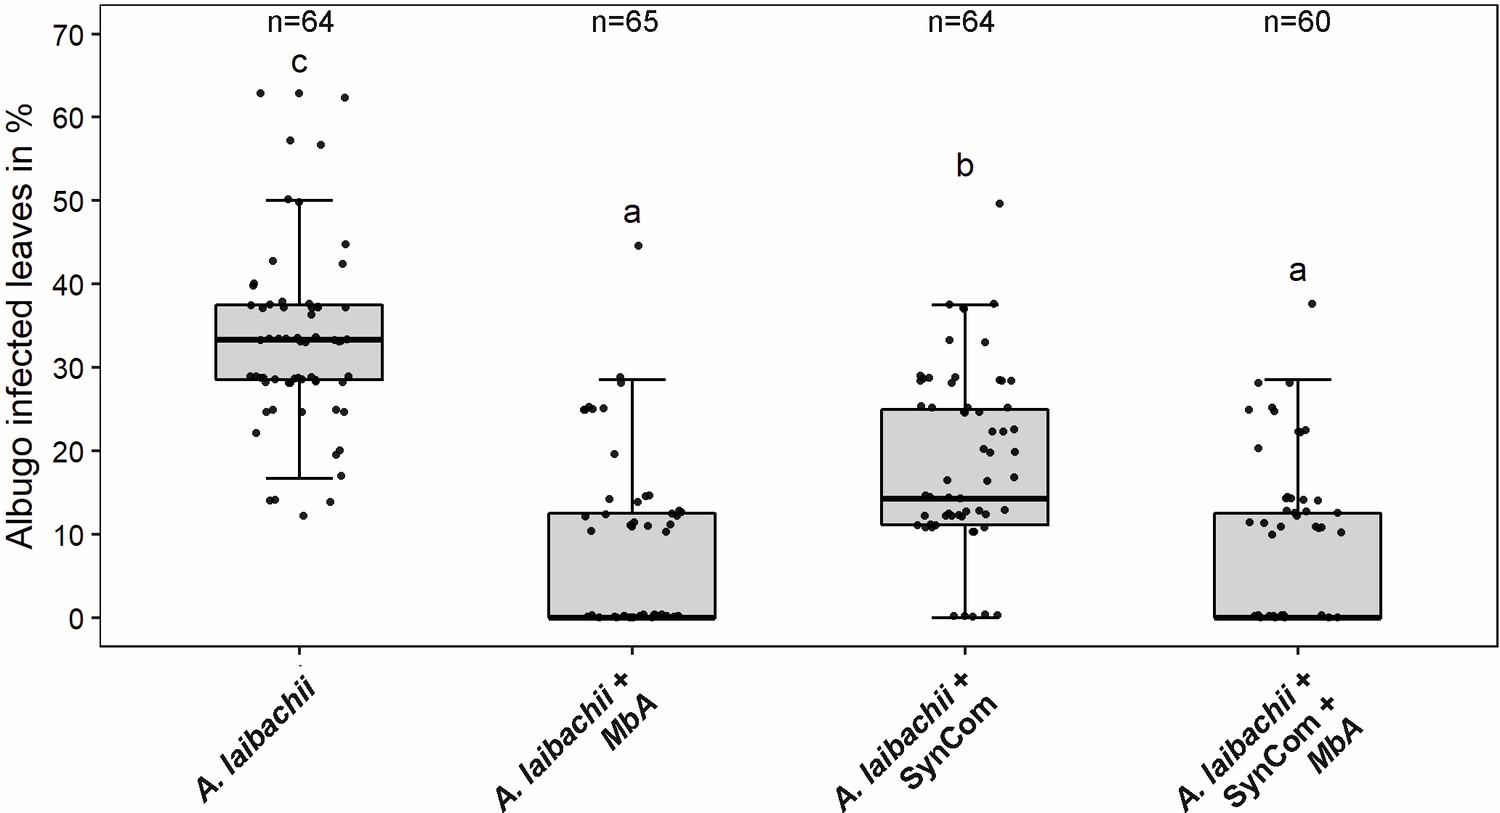
Infection assay of A. laibachii on A. thaliana.
Addition of a bacterial SynCom reduces the infection symptoms of A. laibachii at 14 days post infection. Those symptoms can be almost abolished by spraying MbA to the plant, independently of the presence of the bacterial community. Infections were performed in six individual replicates with 12 technical replicates. N indicates the number of infected plants that were scored for symptoms. An analysis of variance (ANOVA) model was used for pairwise comparison of the conditions, with Tukey's HSD test to determine differences among them. Different letters indicate significant differences (p-values <0.05).
-
Figure 1—source data 1
Quantification of A. laibachii infection on A. thaliana.
- https://cdn.elifesciences.org/articles/65306/elife-65306-fig1-data1-v2.xlsx
Figure 1—figure supplement 1
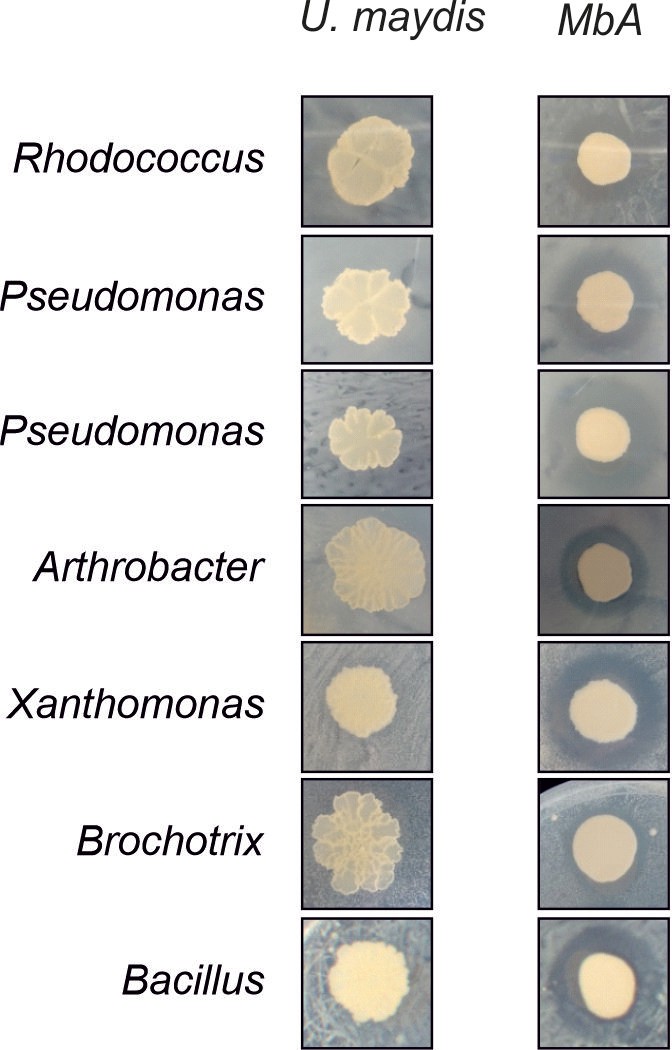
Biocontrol activity of MbA, but not U. maydis, against bacterial SynCom members (Agler et al., 2016).
Inhibition by Moesziomyces can be seen as a characteristic halo after 48 hr of co-incubation.
Figure 1—figure supplement 2

Trypan blue staining of A. thaliana leaves 15 days post infection with A. laibachii.
(A) and (B) Control set with only A. laibachii (error bar 50 µm); (A) thick hyphal growth of A. laibachii on the leaf surface, and (B) appressoria formation can be seen (red arrow). (C) and (D) Treatment set (MbA sprayed 2 days before Albugo); (C): zoospores aggregated together, with few of them forming hyphae (green box); in addition, short, broken hyphae visualized in some regions (red box), which have not been found in control sets; (error bar 200 µm); (D): a closer look at the broken hyphae, yellow arrow indicates germinating cysts of A. laibachii (error bar 50 µm).
Figure 2 with 1 supplement

Circos comparison of MbA and U. maydis chromosome structure (A).
We highlighted potential secondary metabolite clusters, secreted proteins, and gene predictions on both strands (±). (B) Homology-based comparisons identified three chromosomal recombination events, which affects the MbA contigs 2, 6, and 8.
Figure 2—figure supplement 1

Genome comparison of MbA and Moesziomyces antarctica T-34.
Highlighted regions show that contigs with chromosomal rearrangements in MBA can be also found in the genome of the related species Moesziomyces antarctica T-34.
Figure 3 with 3 supplements
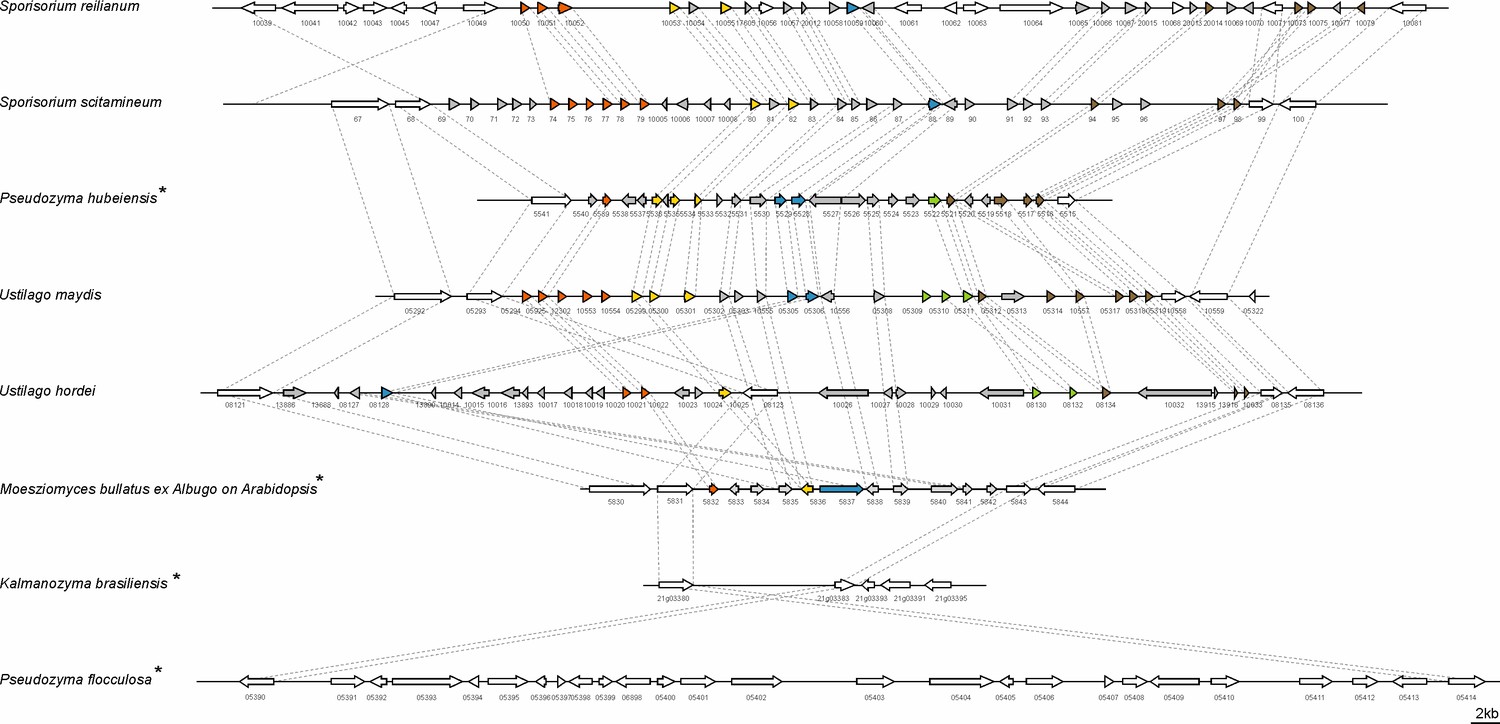
Structure of the largest virulence cluster (Cluster 19A) in pathogenic smut fungi and anamorphic smut yeasts (marked with*).
Colors indicate genes with homology to each other: related gene families are indicated in orange, yellow, blue, green, and brown, whereas unique effector genes are shown in gray. Genes encoding proteins without a secretion signal are shown in white (Brefort et al., 2014).
Figure 3—figure supplement 1
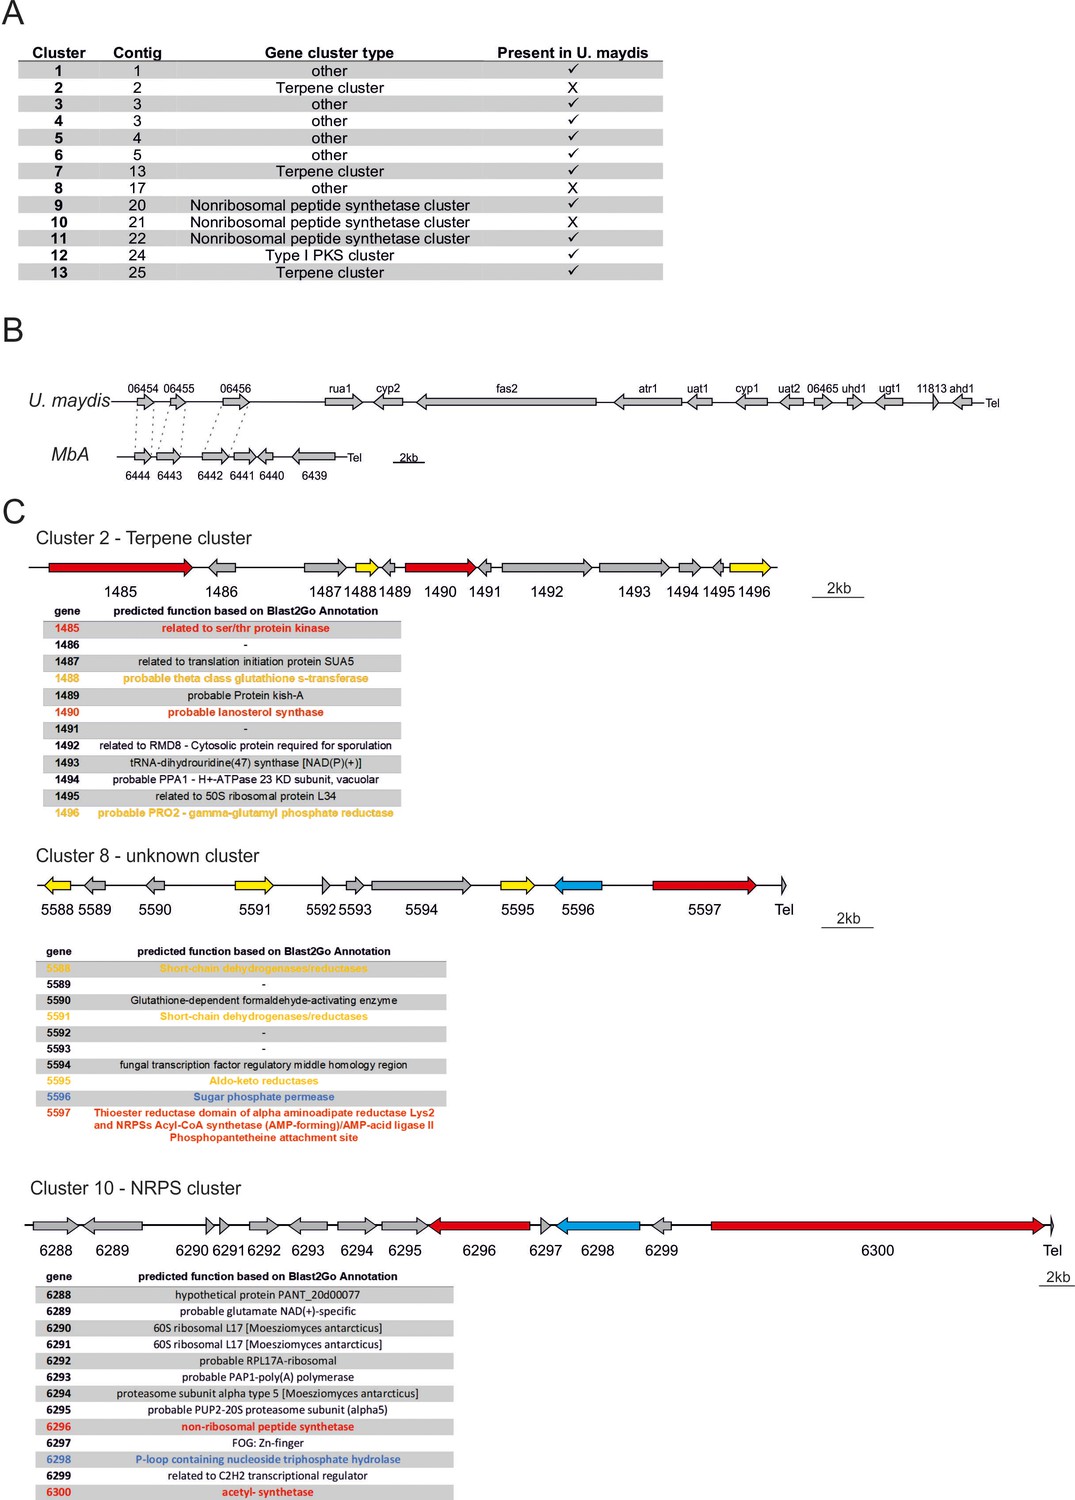
Secondary metabolite gene in the genome of MbA.
(A) Predicted secondary metabolite clusters in the genome of MbA. Most clusters have unpredictable functions, three belong to the type of terpene or nonribosomal peptide synthetase types and one is a polyketide synthetase cluster type I. (B) The gene cluster encoding for production of ustilagic acid, a well-studied secondary metabolite of smut fungi (Teichmann et al., 2007), is not present in the genome of MbA. (C) Out of the 13 predicted secondary metabolite clusters, three are unique to MbA. Cluster 2 is predicted to encode a terpene, cluster 8 is a cluster of unknown function, and cluster 10 is predicted as NRPS cluster. Core biosynthetic genes are highlighted in red, additional biosynthetic genes in yellow, and transport-related genes in blue, based on AntiSMASH predictions.
Figure 3—figure supplement 2
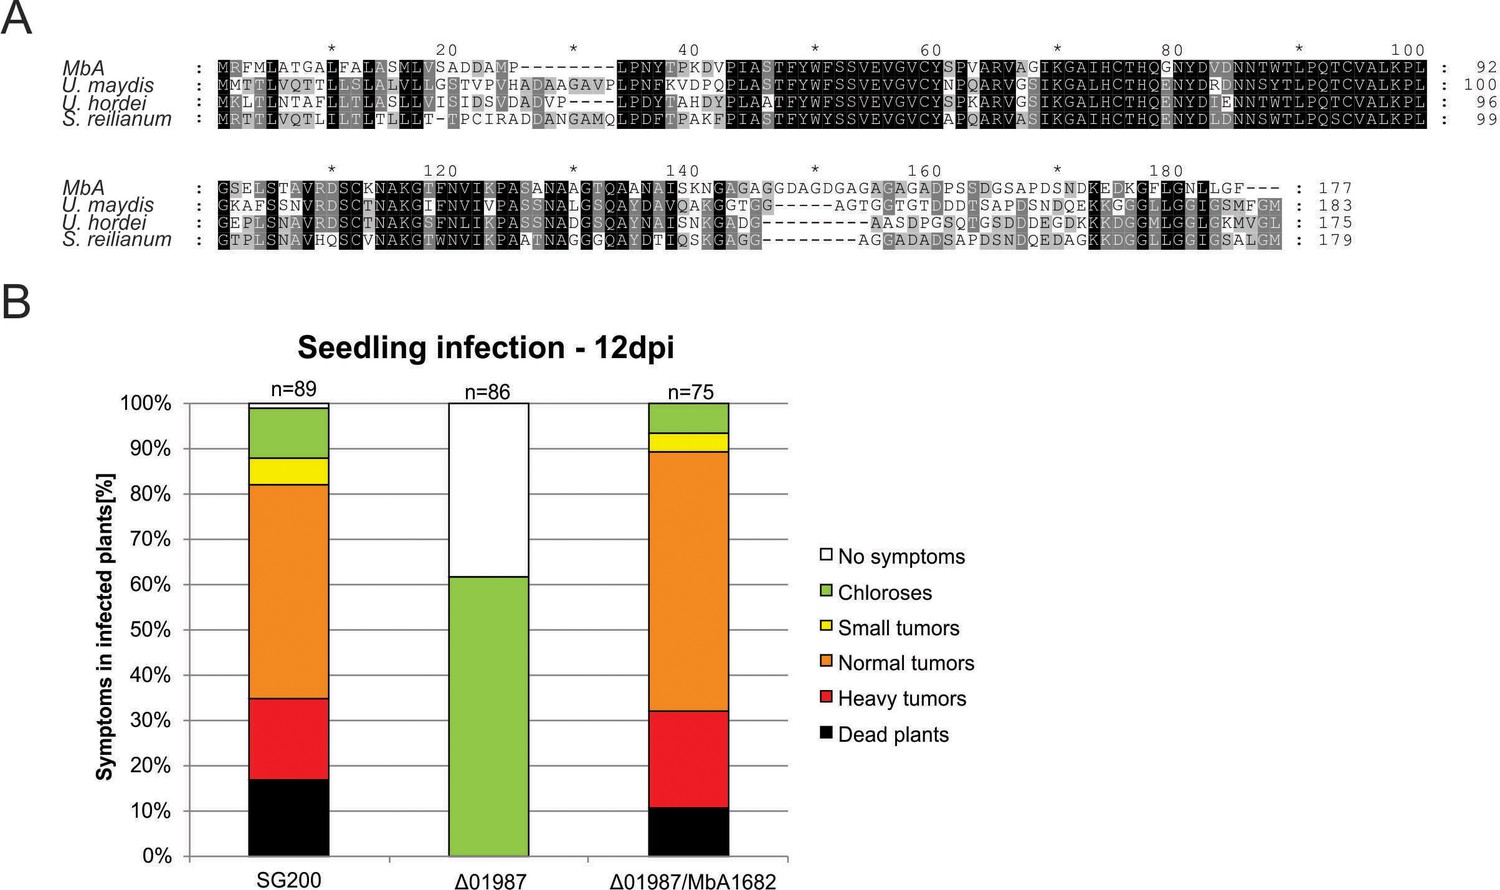
Protein alignment of the core effector Pep1 (Hemetsberger et al., 2015) from different Ustilaginomycetes.
(A) Pep1 regions important for functionality are present in all the aligned sequences. Deletion of the pep1 gene (UMAG_01987) in U. maydis leads to complete loss of virulence, which can be restored by complementing the deletion mutant with the MbA pep1 gene (Ma1682). Infection of maize leaves was done as described in Redkar et al., 2015. Disease symptoms were scored at 12 days post infection in three independent biological replicates. n = number of plants infected.
Figure 3—figure supplement 3
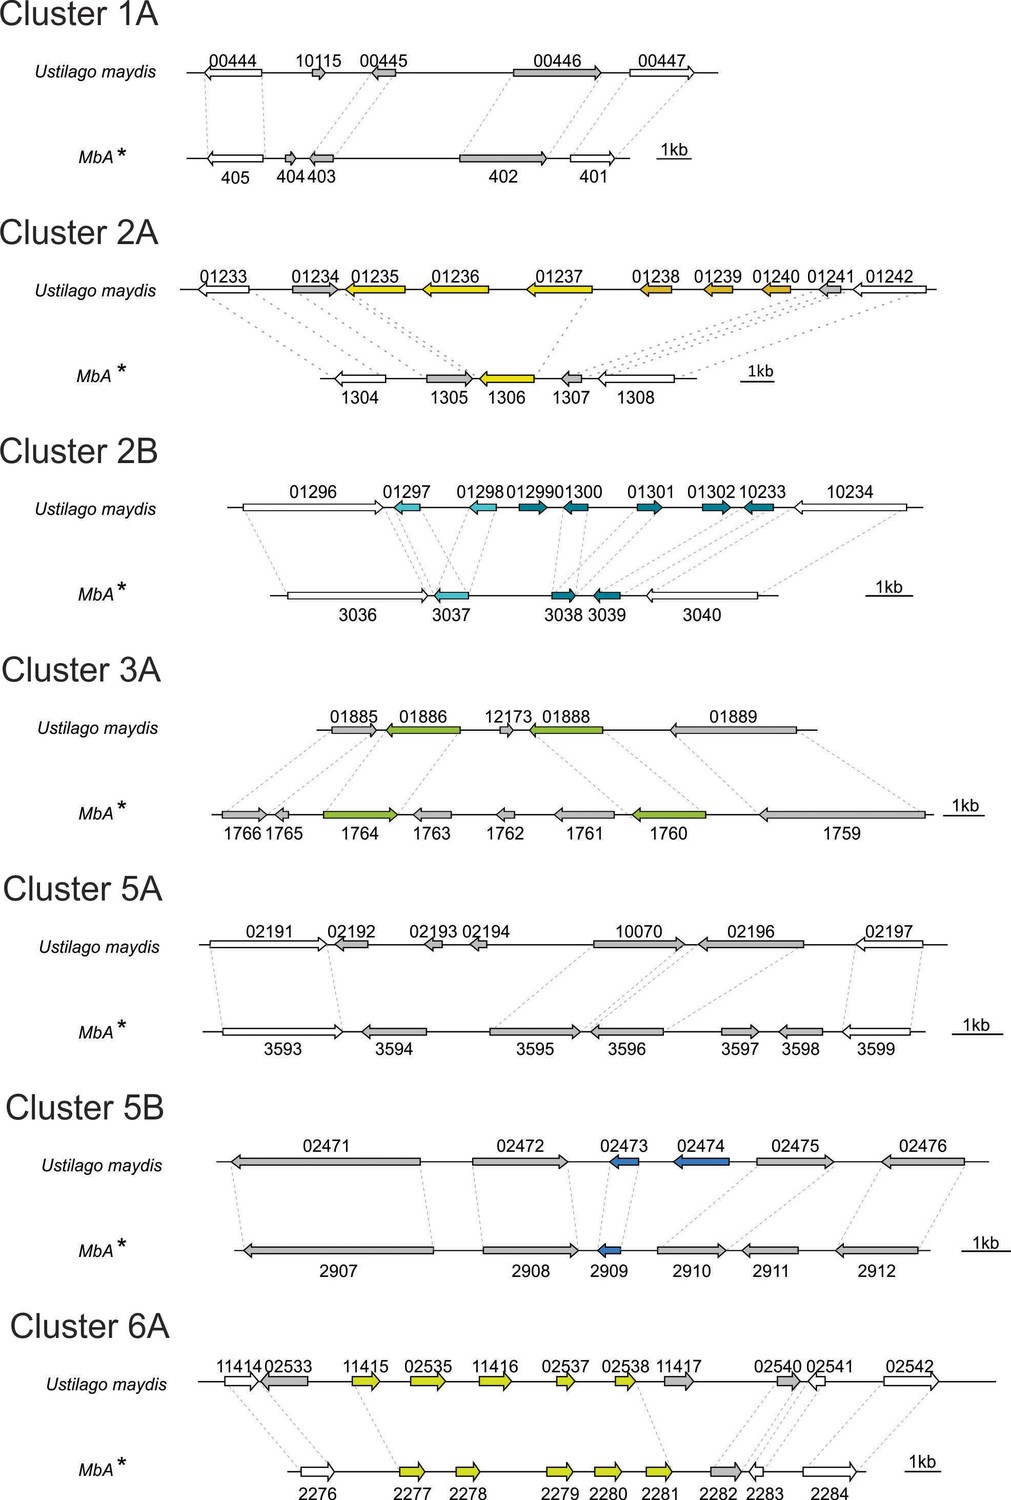
Comparison of known virulence clusters (Kämper et al., 2006) between U. maydis and MbA.
Numbers are gene numbers (*UMAG_NUMBER* for U. maydis; *gNUMBER* for MbA).
Figure 4
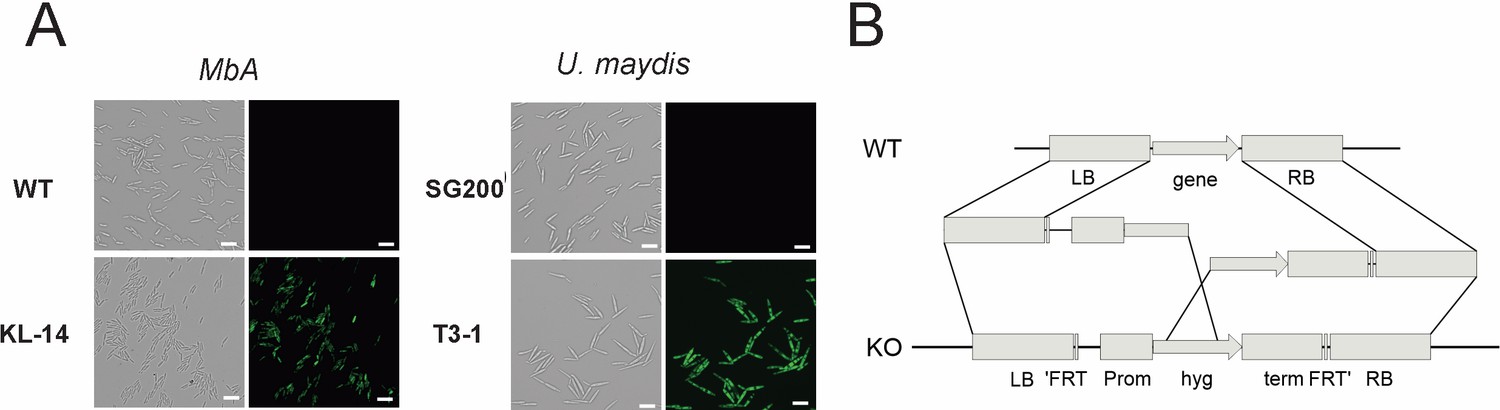
Genetic transformation of MbA.
(A) Stable transformants that express cytosolic GFP could be obtained by generating protoplasts with Glucanex and ectopically integrating linear DNA fragments into the genome via polyethylene glycol (PEG)-mediated transformation. (B) Overview of the split-marker approach that was used to generate deletion mutants via homologous recombination.
Figure 5 with 1 supplement
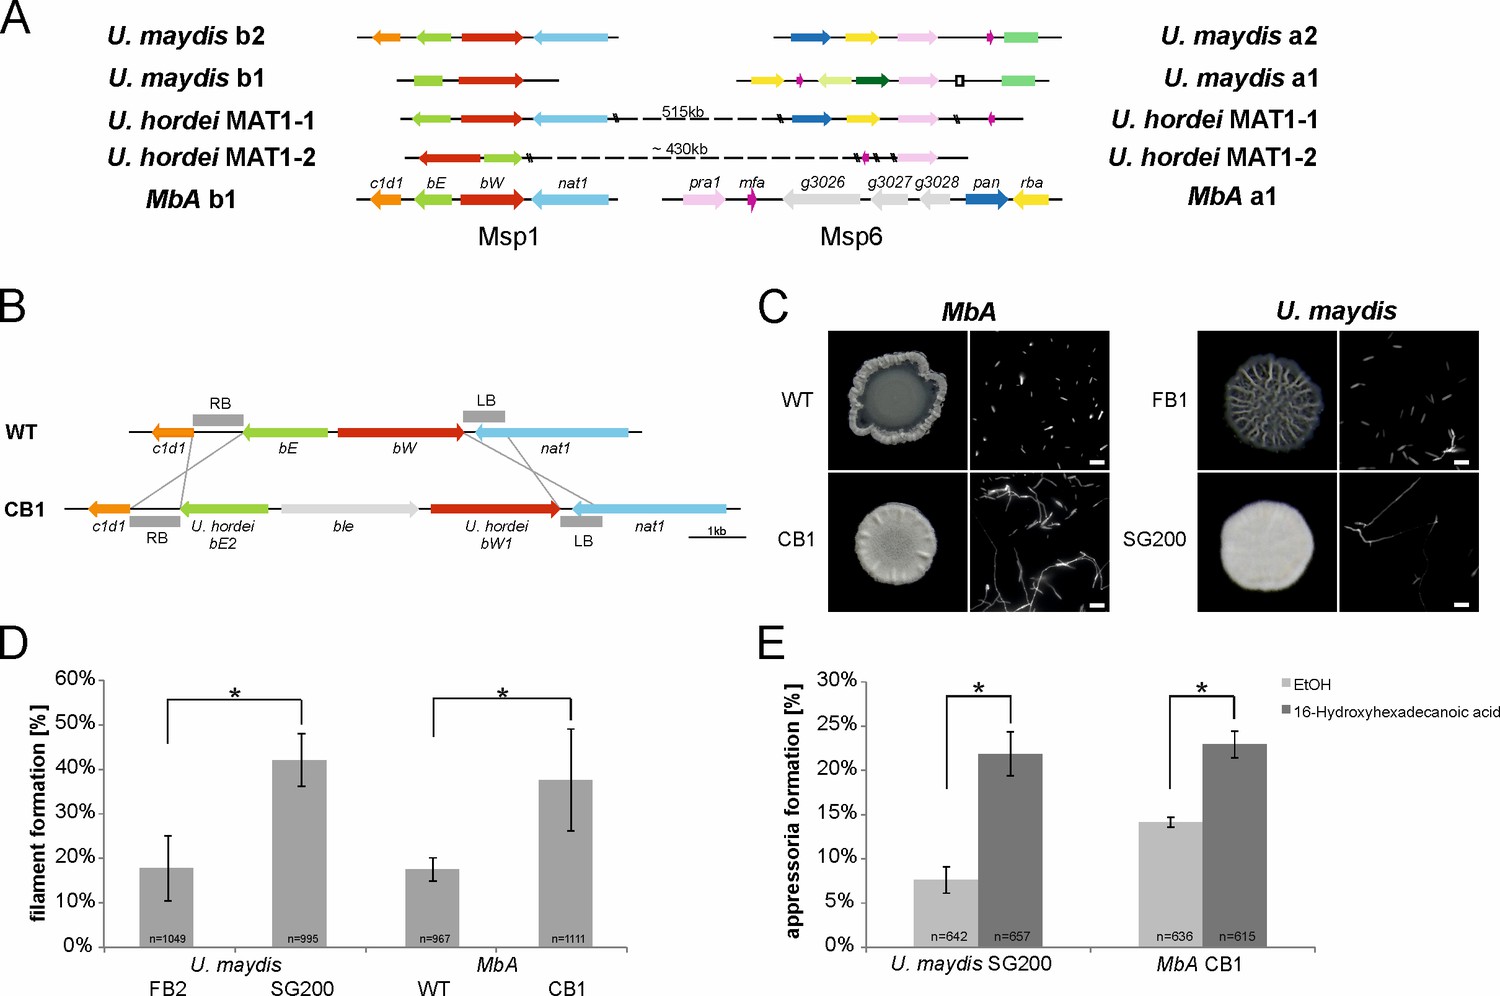
The self-compatible MbA strain CB1.
(A) MbA mating type genes, unlike the ones of U. hordei, can be found on two different chromosomes similar to the tetrapolar mating type system of U. maydis. (B) To generate a self-compatible strain (CB1), the b-mating genes of U. hordei were integrated at the native MbA b-locus. (C) Unlike the MbA wild-type strain (top left), strain CB1 (bottom left) shows a fluffy phenotype on charcoal plates and filamentous growth. U. maydis haploid F1 strain (top right) and self-compatible SG200 strain (bottom right) were used as negative and positive control, respectively. (D and E) Induction of filamentation and appressoria formation in strain CB1 was studied in three independent experiments. For this around 1000 cells for filament formation and around 600 cells for appressoria formation were analyzed and error bars indicate standard error. After incubation on a hydrophobic surface, both, filament and appressoria formation in strain CB1, were significantly different (*chi-squared test for Independence – α = 0.0001) when compared to MbA wild type and similar to the level of the self-compatible U. maydis strain SG00. U. maydis haploid F2 strain was used as negative control (Kämper et al., 2006). Scale bar: 20 µm. 16-HDD: 16-hydroxyhexadecanoic acid.
-
Figure 5—source data 1
Appressoria quantification of MbA.
- https://cdn.elifesciences.org/articles/65306/elife-65306-fig5-data1-v2.xlsx
Figure 5—figure supplement 1
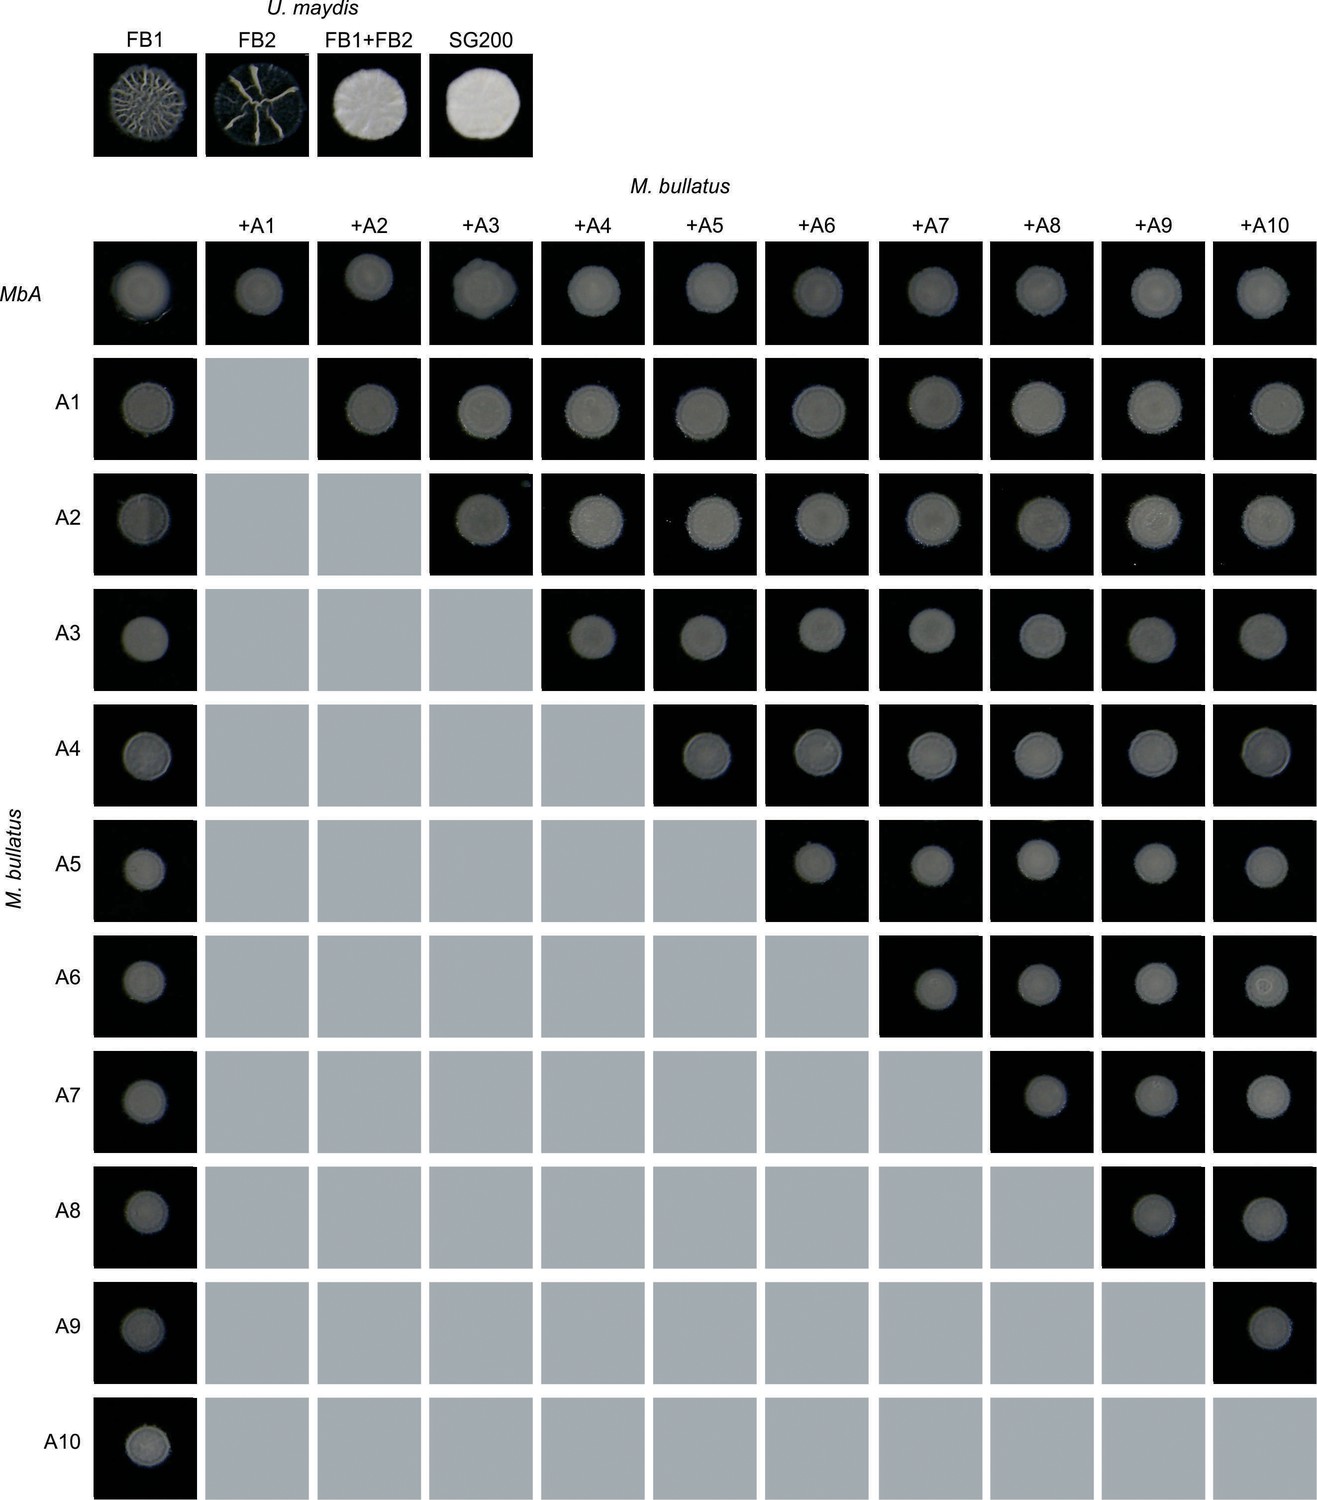
Mating assays of MbA and different M. bullatus isolates.
Mixing of haploid U. maydis strains FB1 and FB2 and the solopathogenic strain SG200 served as a positive control for mating on charcoal plates, wherein filamentous growth is indicated by white, fluffy appearance of colonies. Haploid wild-type strains without mating partner do not show a fluffy phenotype. For all combinations of Moesziomyces strains, no mating event resulting in filamentous growth on charcoal plates was observed.
Figure 6 with 2 supplements
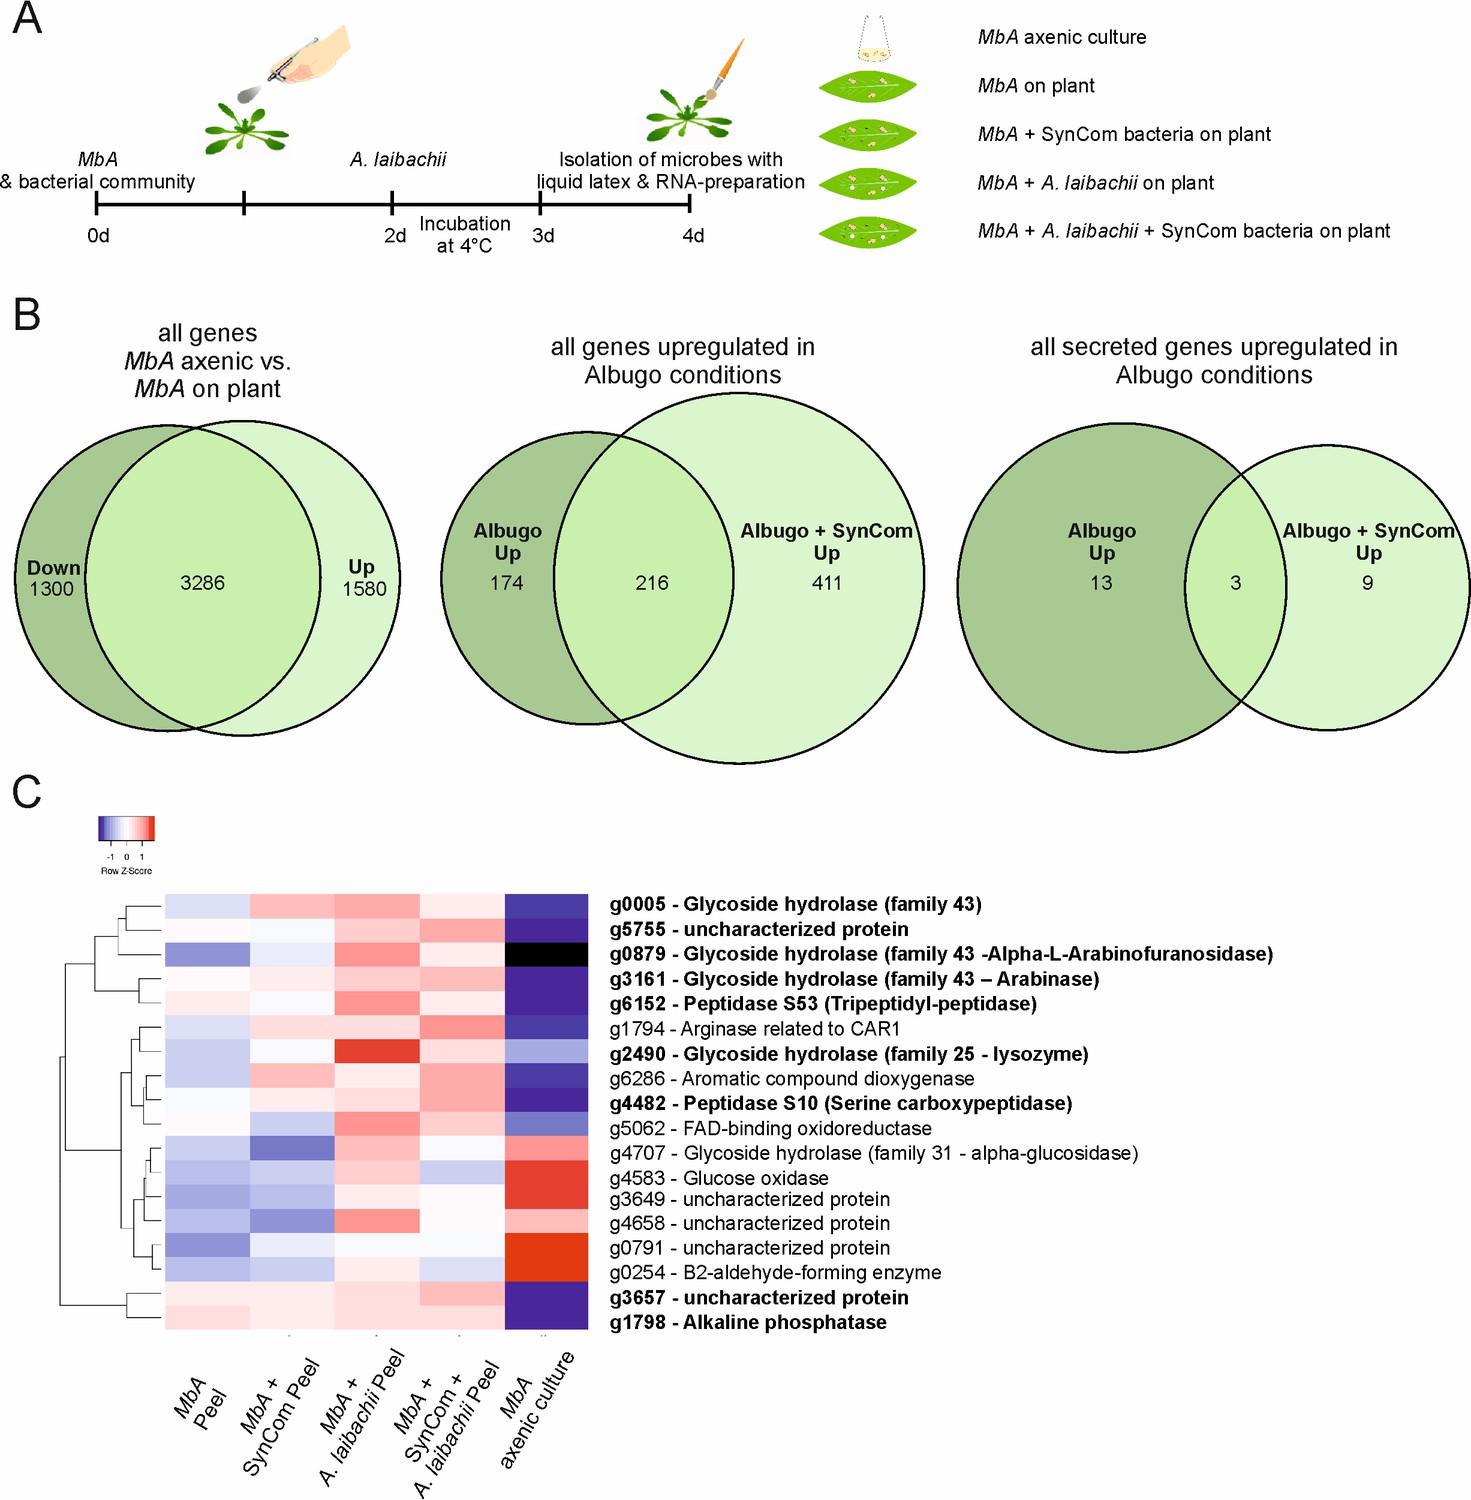
Transcriptome analysis of MbA.
(A) Experimental setup used for the transcriptomic (RNA-Sequencing) analysis in MbA. (B) Venn diagrams showing differential regulated MbA genes after spraying of haploid cells onto the A. thaliana leaf surface. A total number of 801 genes were upregulated in response to A. laibachii in the presence and absence of bacterial SynCom. Of the 801 genes, 216 were upregulated in both conditions (Supplementary file 2). (C) Hierarchical clustering of the 18 A. laibachii-induced MbA genes that are predicted to encode secreted proteins. Of these genes, nine were selected as candidate microbe–microbe effector genes, based on their transcriptional upregulation and prediction to encode for extracellularly localized proteins.
-
Figure 6—source data 1
Gene expression data of candidate effector genes.
- https://cdn.elifesciences.org/articles/65306/elife-65306-fig6-data1-v2.xlsx
Figure 6—figure supplement 1
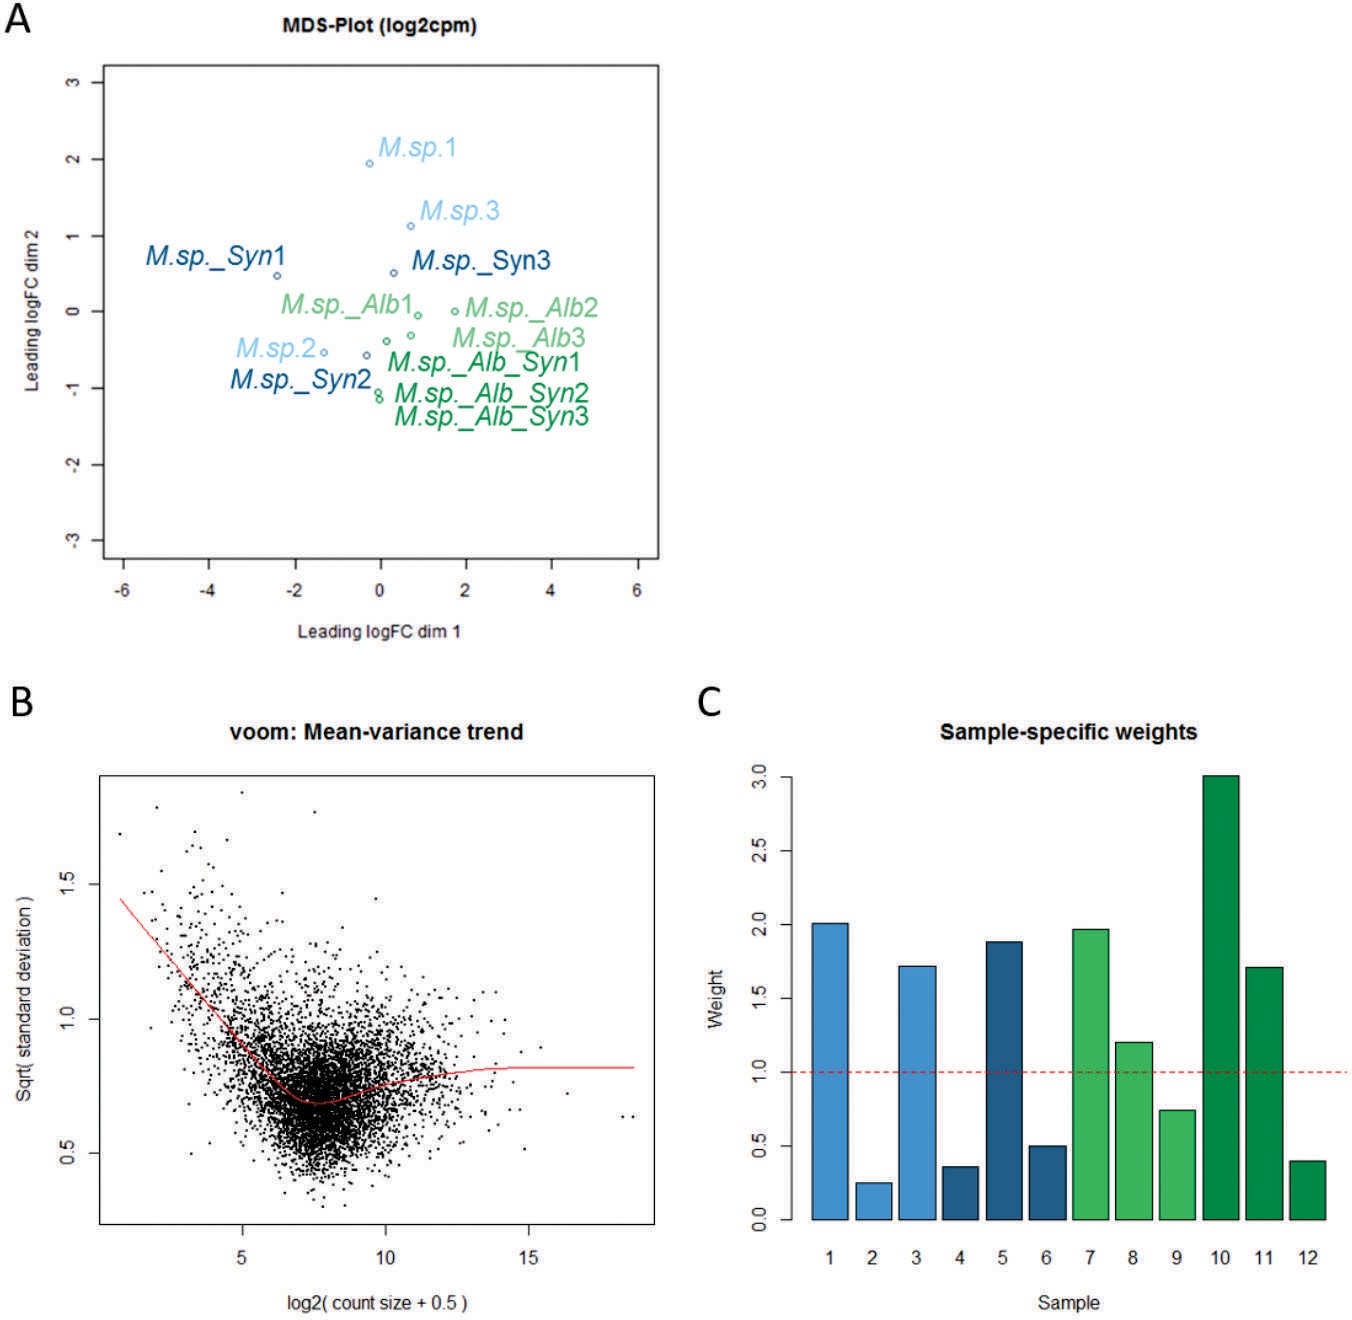
Gene expression analysis of MbA in response to SynCom bacteria and A. laibachii.
(A) Multi-dimensional scaling (MDS) plot based on the interactions of Moesziomyces sp. (M. sp.)/MbA in response to the SynCom bacteria and Albugo laibachii in three biological replicates. The MDS plot shows Albugo and non-Albugo samples grouping together based on gene-level logCPM. (B) Voom mean-variance trend of the data set where points represent genes, and (C) sample-specific weights obtained from the limma-voom function. Colors represent three replicates for each treatment. Light blue: MbA on plant; Dark blue: MbA on plant + SynCom; Light green: MbA on plant + Albugo; Dark green: MbA on plant + Albugo + SynCom.
Figure 6—figure supplement 2
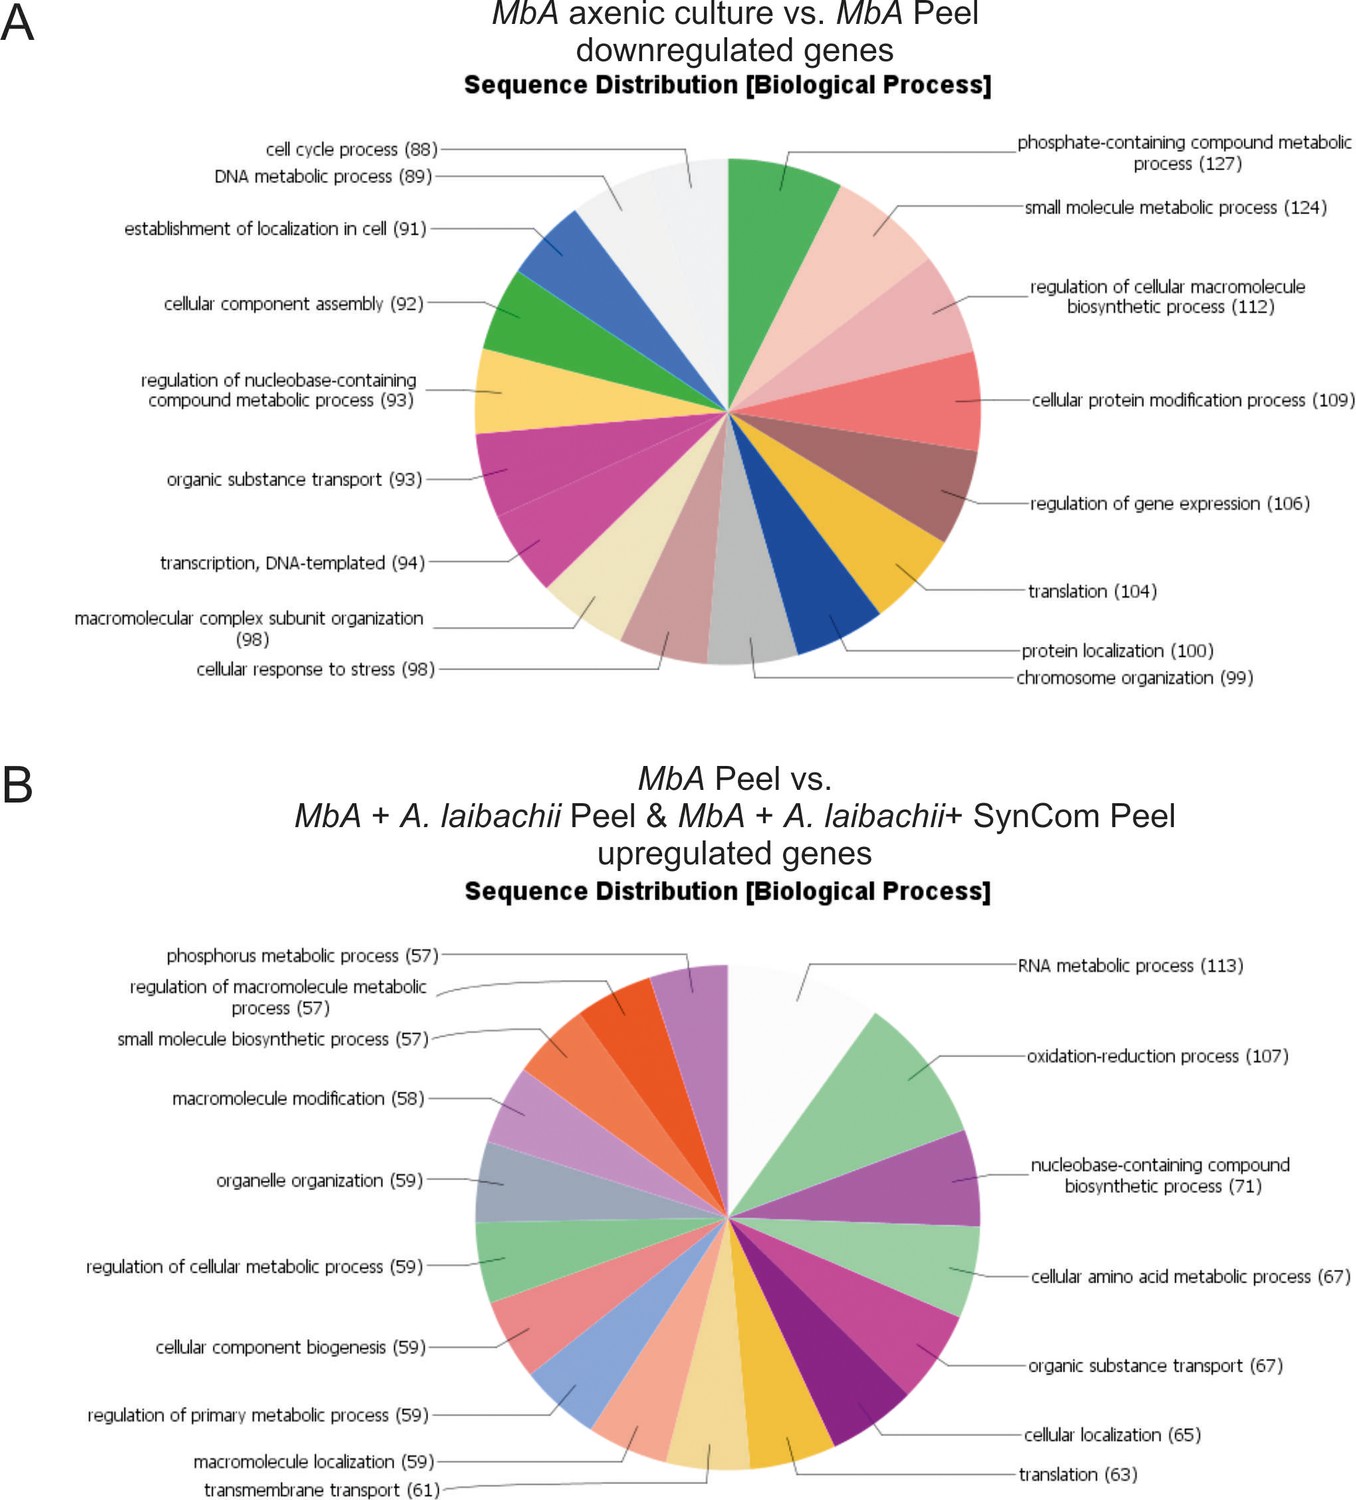
Gene ontology (GO) analysis of differentially regulated MbA genes.
(A) Sequence distribution of gene ontology (GO) terms. Sixty percent of all the genes that are downregulated in MbA on plant compared to axenic culture growth can be assigned to GO terms related to metabolism and cell cycle. (B) In contrast, the presence of A. laibachii leads to transcriptional activation of metabolic processes. Fifty-two percent of all GO terms associated with genes upregulated in the presence of A. laibachii are related to metabolic processes.
Figure 7 with 5 supplements
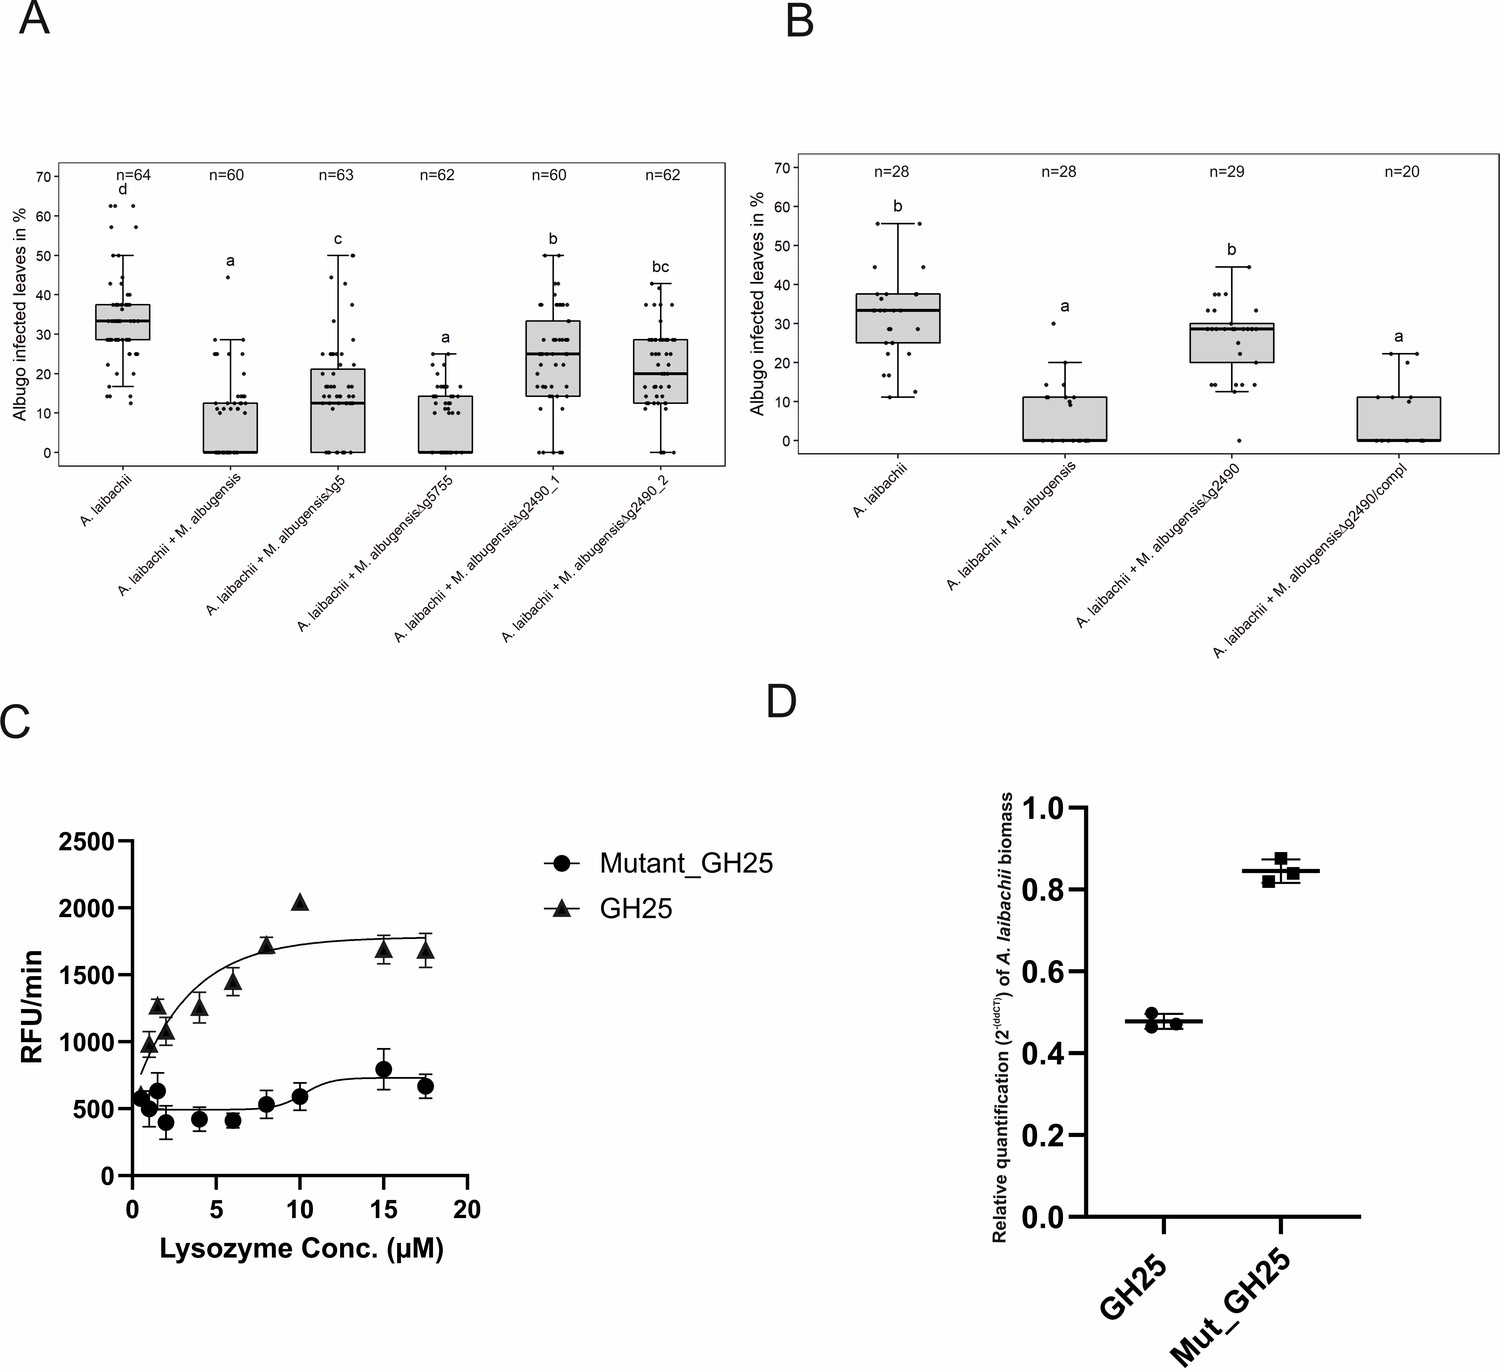
A reverse-genetic approach to identify the MbA gene that is responsible for the suppression of A.
laibachii infection. (A) Three candidate microbe–microbe effector genes (g5, g5755, and g2490) were deleted in MbA and deletion strains were individually inoculated on A. thaliana together with A. laibachii. Inoculation of two independent g2490 null strains (Δg2490_1; Δg2490_2) resulted in significant and almost complete loss of the biocontrol activity of MbA. While deletion of g5 resulted in a marginal reduction of disease symptoms at 14 days post infection, deletion of g5755 had no effect on A. laibachii. (B) Genetic complementation of the g2490 deletion restores the biocontrol activity to wild-type levels. Infections in (A) were performed in six, in (B) in three individual replicates. In each replicate 12 plants were infected. N indicates the number of infected plants that were scored for symptoms. Different letters indicate significant differences (p-values <0.05; ANOVA model for pairwise comparison with Tukey's HSD test). (C) Detection of lysozyme. Increasing concentrations of purified MbA_GH25 and MbA_GH25(D124E) were incubated with the DQ lysozyme substrate for an hour at 37°C. The fluorescence was recorded every minute in a fluorescence microplate reader using excitation/emission of 485/530 nm. Finally, relative fluorescence unit (RFU)/min was calculated for each concentration and plotted on the graph. Each data point represents three technical replicates and three independent biological replicates as indicated by the standard error measurement (SEM) bars. An unpaired t-test was performed for the active GH25 and Mutant_GH25 sets giving the p-value of <0.0001 and R2 value of 77.24%. (D) Relative quantification of A. laibachii biomass in response to MbA_GH25 (active and mutant) treatment via qPCR. The oomycete internal transcribed spacer (ITS) 5.8 s was normalized to A. thaliana EF1-α gene to quantify the amount of A. laibachii DNA in the samples, 10 days post infection. Then relative biomass was calculated comparing control sets (only Albugo) with A. laibachii treated with GH25 and A. laibachii treated with Mutant_GH25 by ddCT method. Unpaired t-test between GH25 and Mutant_GH25 sets gave a p-value of <0.0001 and an R2 value of 98.88%.
-
Figure 7—source data 1
Infection data of A. laibachii on A. thaliana.
- https://cdn.elifesciences.org/articles/65306/elife-65306-fig7-data1-v2.xlsx
Figure 7—figure supplement 1
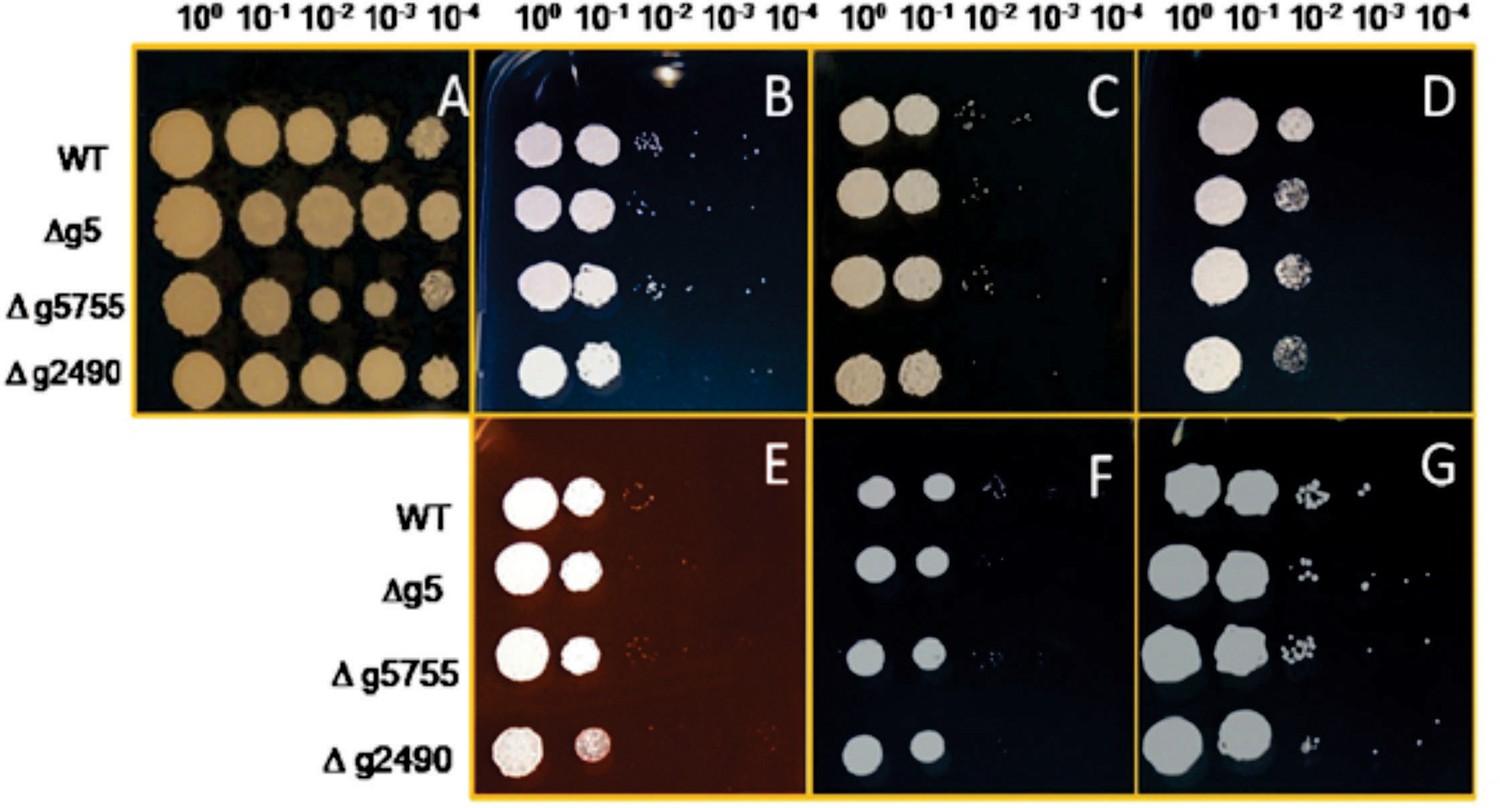
Stress assay of MbA wild-type and knockout mutants of gene (g5, g5755, and g2490) respectively, on CM medium and 2% glucose (A) with different conditions (B: 100 μg/ml calcofluor; C: 150 μg/ml calcofluor; D: 1 mM H2O2; E: 45 μg/ml Congo-red; F: 1 M NaCl; G: 1 M sorbitol).
The strains were dropped on the CM plates containing different stress supplements in a dilution series from 100 to 10−4.
Figure 7—figure supplement 2
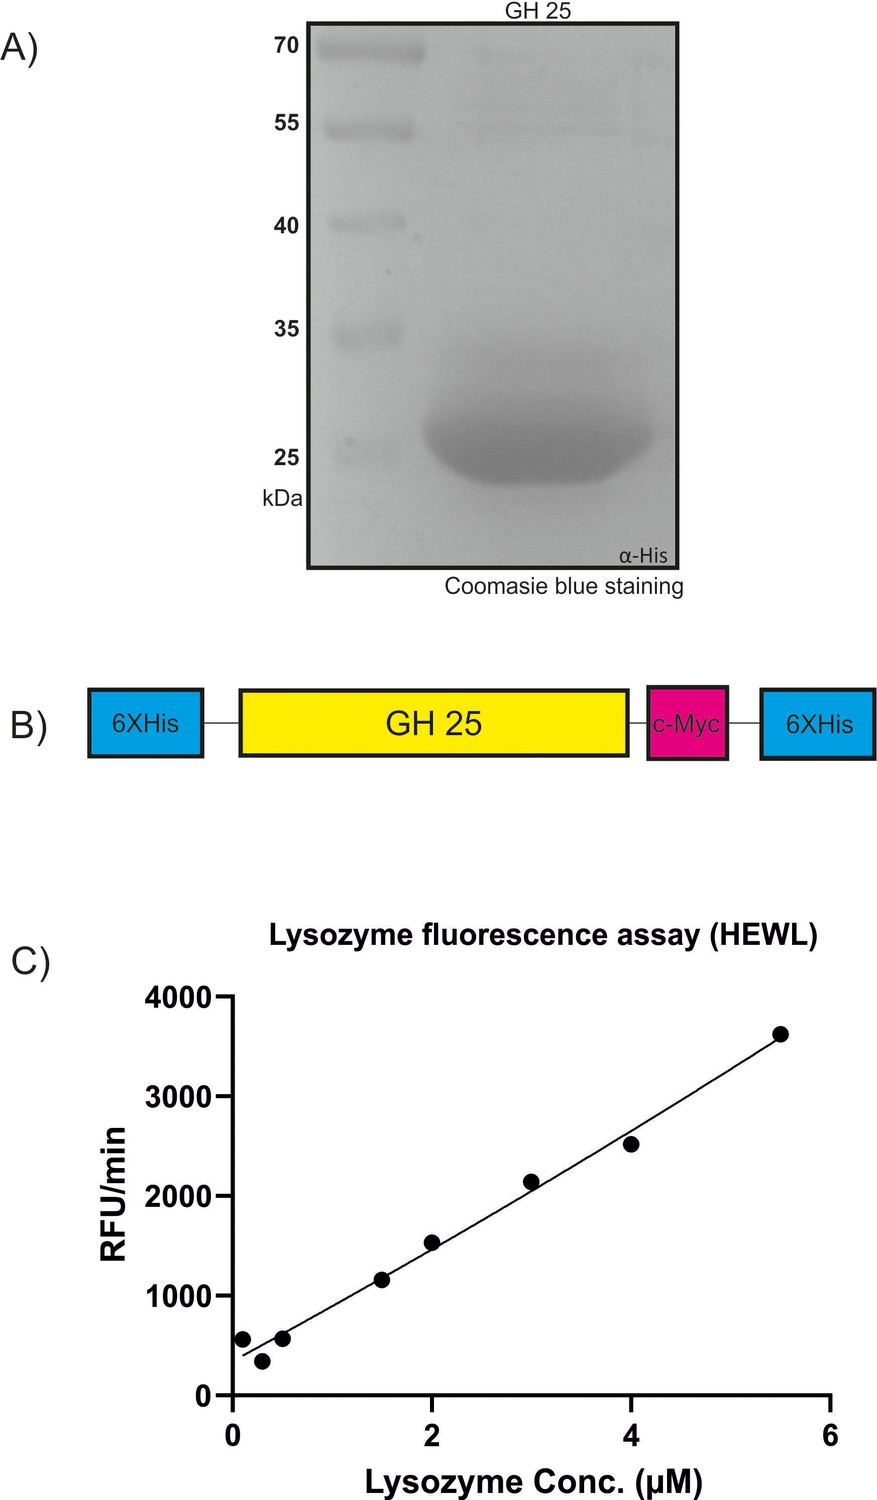
Recombinant production of MbA_Gh25 for quantitative lysozyme assay.
(A) Recombinant MbA_GH25 was produced and purified using the Pichia pastoris protein expression system. The purified protein was loaded in a 12% SDS gel for visualization of an expected molecular weight of 27 kDa for His-Tagged GH25. (B) Schematic diagram of the recombinant construct, where the GH25 domain from MBA is tagged with an N-terminal polyhistidine Tag and a C-terminal peptide containing the c-myc epitope and a polyhistidine tag. (C) Detection of lysozyme activity for commercial Hen-egg white lysozyme (stock solution, 11 µM) using the EnzChek1 Lysozyme Assay Kit. The fluorescence was recorded every minute in a fluorescence microplate reader using excitation/emission of 485/530 nm in increasing concentrations from 0.1 µM to 5.5 µM. Finally, relative fluorescence unit (RFU)/min was calculated for each concentration and plotted on the graph.
Figure 7—figure supplement 3
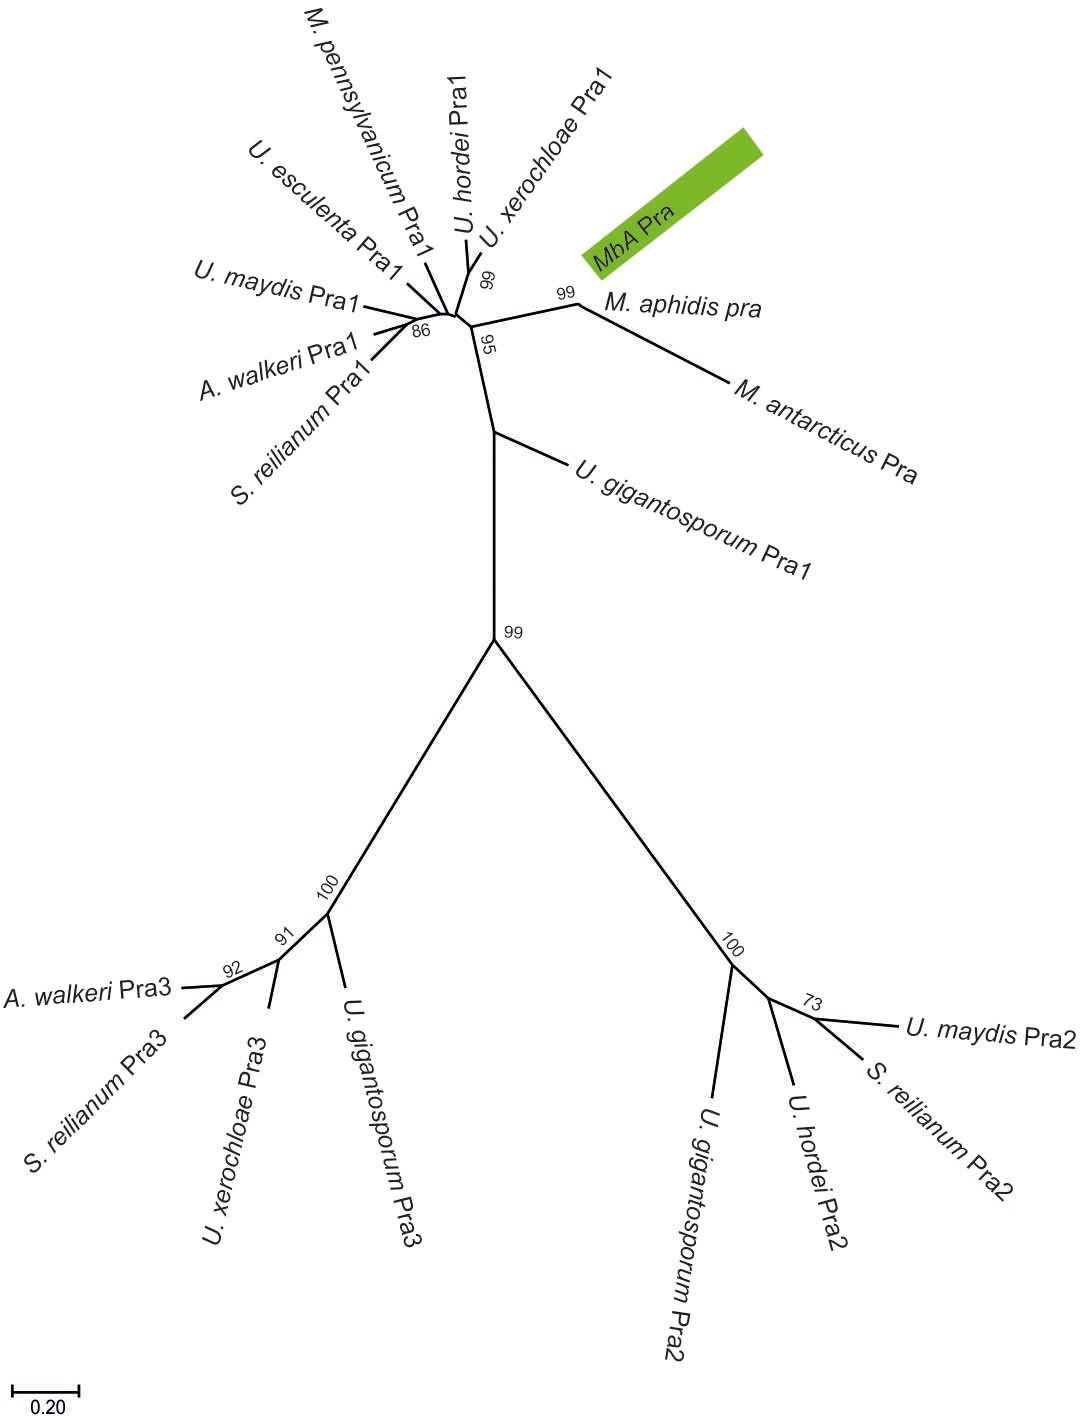
A molecular phylogenetic analysis using maximum likelihood estimation and based on pheromone receptor protein sequences similarity.
MbA protein sequence clusters together with type one pheromone receptors of other Ustilaginomycetes.
Figure 7—figure supplement 4
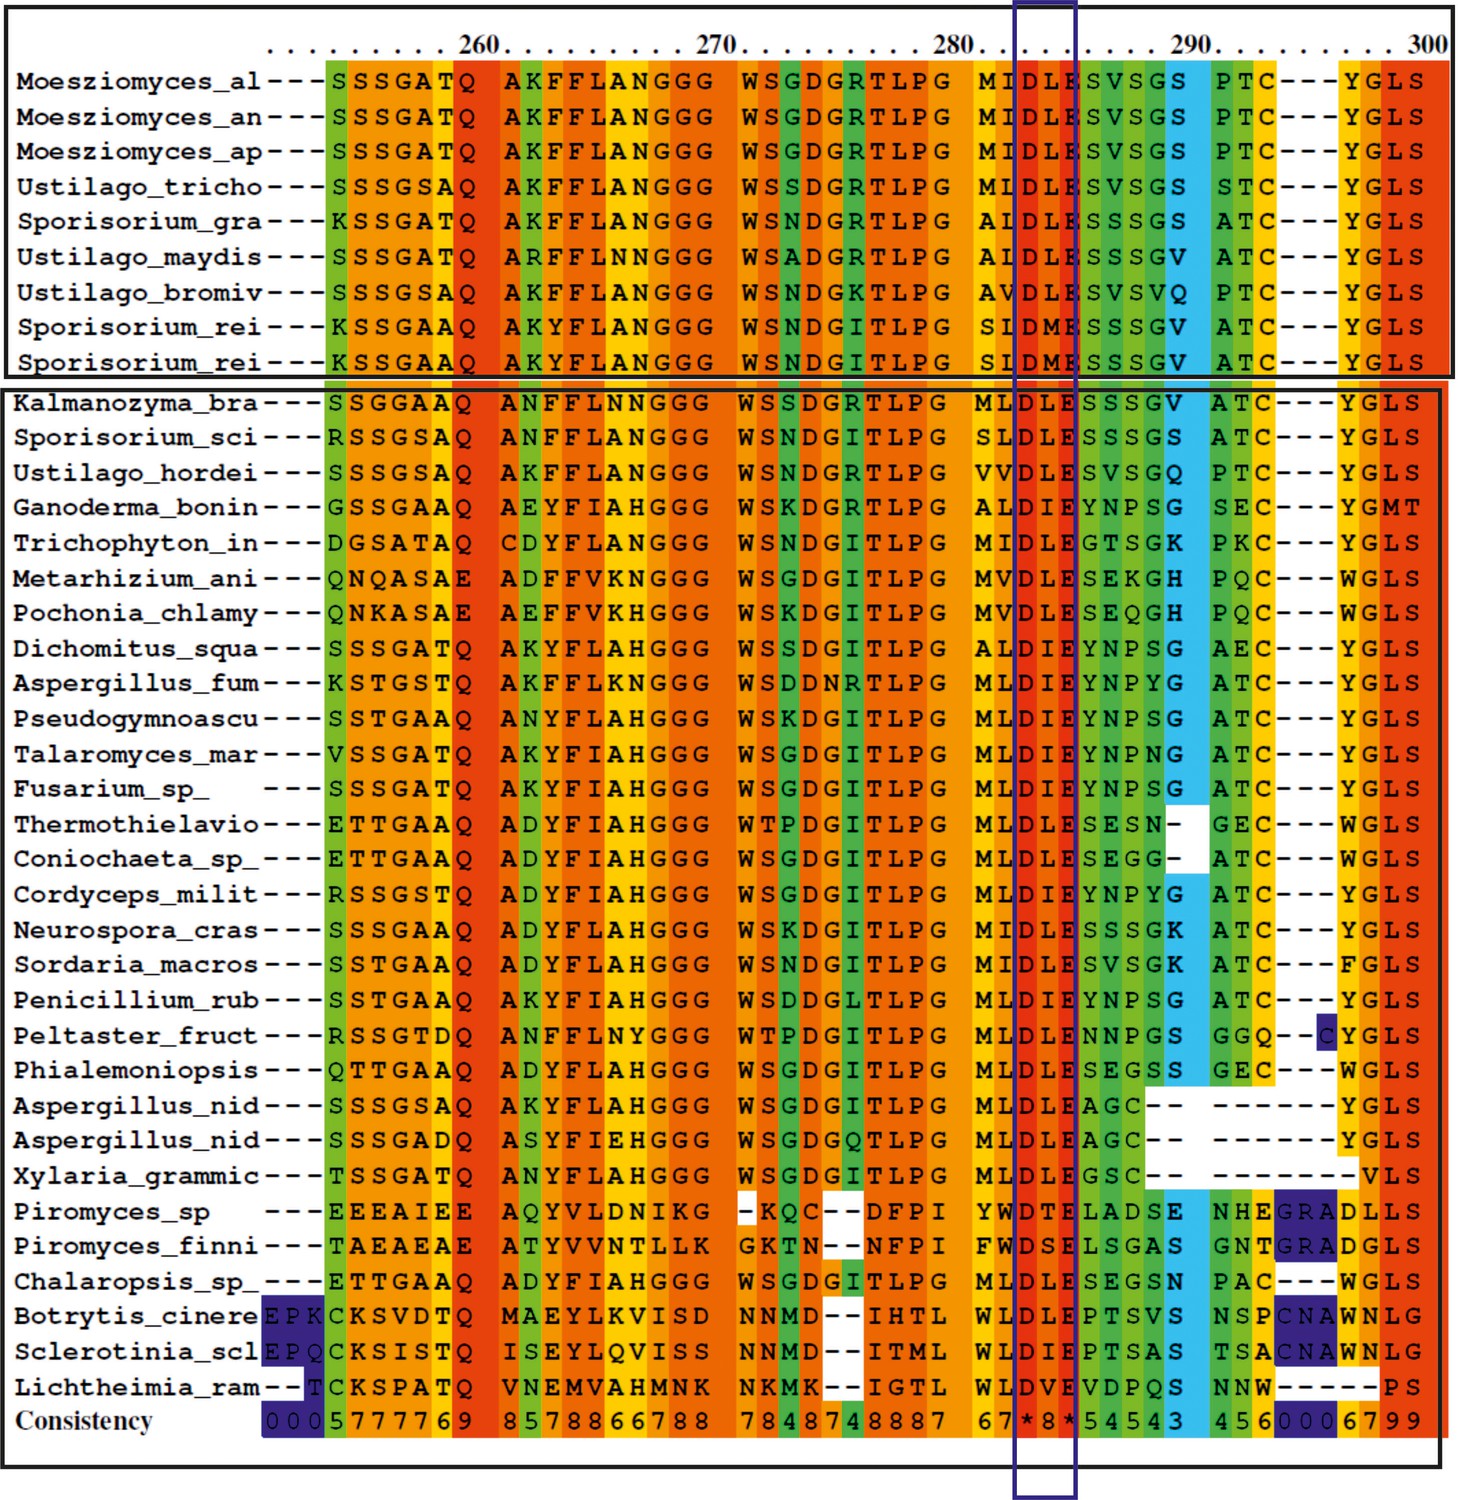
Amino acid alignment of GH25 sequences from different fungi (see attached list ‘GH25 with accession number’, for full length sequences).
The protein sequences were obtained from the NCBI database. Alignment was achieved using the PRALINE multiple sequence alignment program with default parameters. The scoring scheme works from 0 for the least conserved alignment position, up to 10 (indicated by *) for the most conserved alignment position. A conserved active-site DxE motif has been predicted for glycoside hydrolase family 25. Sequences tested from different basiodiomycete, ascomycete, and chytrids have the active site residue conserved (purple box).
Figure 7—figure supplement 5
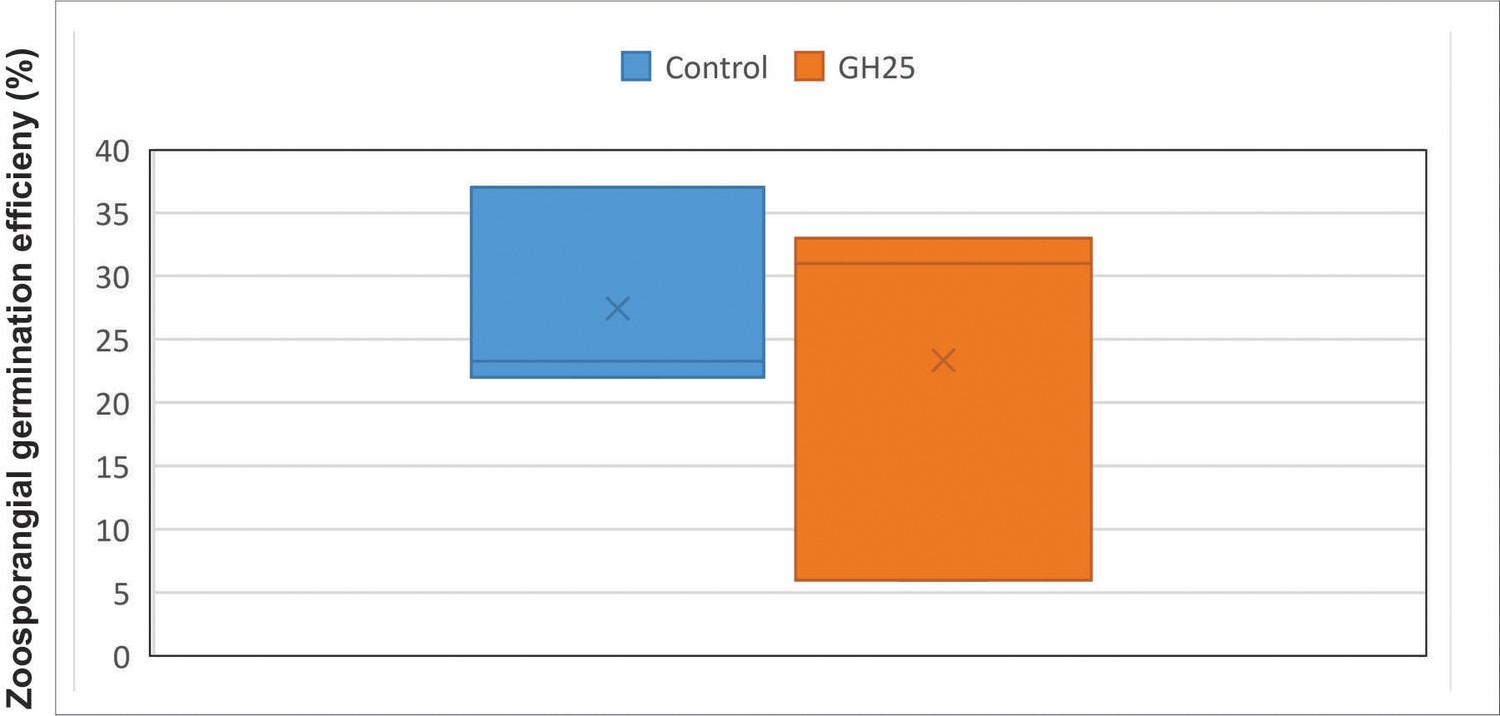
Boxplot analysis of GH 25 treatment on in vitro A. laibachii zoosporangial germination in three biological replicates analyzing about 100 zoosporangial cells for each replicate.
A p-value of 0.3 was obtained for paired t-test using one-tailed distribution.
Tables
Table 1
Comparison of genomes and genomic features of known pathogenic and anamorphic Ustilaginomycetes.
| MbA | U. bromivora | S. scitamineum | S. reilianum | U. maydis | U. hordei | M. pennsylvanicum | A. flocculosa | |
|---|---|---|---|---|---|---|---|---|
| Assembly statistics | ||||||||
| Total contig length (Mb) | 18.3 | 19.5 | 18.2 | 19.7 | 20.7 | 19.2 | 23.2 | |
| Total scaffold length (Mb) | 20.5 | 19.6 | 18.4 | 19.8 | 21.15 | 19.2 | 23.3 | |
| Average base coverage | 50× | 154× | 30× | 20× | 10× | 25× | 339× | 28× |
| N50 contig (kb) | 705.1 | 37.6 | 50.3 | 127.4 | 48.7 | 43.4 | 38.6 | |
| N50 scaffold length (kb) | 877 | 759.2 | 738.5 | 817.8 | 307.7 | 121.7 | 919.9 | |
| Chromosomes | 21 | 23 | 23 | 23 | 23 | |||
| GC-content (%) | 60.9 | 52.4 | 54.4 | 59.7 | 54 | 52 | 50.9 | 65.1 |
| Coding (%) | 62.8 | 54.4 | 57.8 | 62.6 | 56.3 | 54.3 | 54 | 66.3 |
| Coding sequence | ||||||||
| Percentage CDS (%) | 69.5 | 59.8 | 62 | 65.9 | 61.1 | 57.5 | 56.6 | 54.3 |
| Average gene size (bp) | 1935 | 1699 | 1819 | 1858 | 1836 | 1708 | 1734 | 2097 |
| Average gene density (gene/kb) | 0.36 | 0.35 | 0.34 | 0.37 | 0.34 | 0.34 | 0.33 | 0.30 |
| Protein-coding genes | 6653 | 7233 | 6693 | 6648 | 6786 | 7113 | 6279 | 6877 |
| Exons | 11,645 | 11,154 | 10,214 | 9776 | 9783 | 10,907 | 9278 | 19,318 |
| Average exon size (bp) | 1091 | 1101 | 1191 | 1221 | 1230 | 1107 | 527 | 658 |
| Exons/gene | 1.75 | 1.5 | 1.5 | 1.47 | 1.44 | 1.53 | 1.48 | 2.8 |
| tRNA genes | 150 | 133 | 116 | 96 | 111 | 110 | 126 | 176 |
| Noncoding sequence | ||||||||
| Introns | 9333 | 3921 | 3521 | 3103 | 2997 | 3161 | 2999 | 12,427 |
| Introns/gene | 1.40 | 0.54 | 0.53 | 0.47 | 0.44 | 0.44 | 0.48 | 1.81 |
| Average intron length (base) | 163 | 163 | 130.1 | 144 | 142 | 141 | 191.4 | 141 |
| Average intergenic distance (bp) | 769 | 1054 | 1114 | 929 | 1127 | 1186 | 1328 | 1273 |
| Secretome | ||||||||
| Protein with signal peptide | 559 | 622 | 632 | 625 | 538 | 419 | 622 | |
| Secreted without TMD | 380 | 467 | 737 | |||||
| – with known domain | 260 | 264 | 554 |
Table 2
MbA proteins homologous to U. maydis effector genes with known virulence function.
| Name | Homologue | Query cover | E-value | Identity (%) | U. maydis knockout phenotype | Reference |
|---|---|---|---|---|---|---|
| g1653 | UMAG_01987 (Pep1) | 82% | 3-e56 | 60.96 | Complete loss of tumor formation – blocked in early stages of infection | Doehlemann et al., 2009 |
| g1828 | UMAG_01829 (Afu1) | 99% | 0.0 | 71.57 | Organ-specific effector – reduced virulence in seedling leaves | Schilling et al., 2014 |
| g2626 | UMAG_12197 (Cce1) | 98% | 1e-48 | 60.16 | Complete loss of tumor formation – blocked in early stages of infection | Seitner et al., 2018 |
| g2765 | UMAG_11938 (Scp2) | 100% | 1e-73 | 93.44 | Reduced in virulence | Krombach et al., 2018 |
| g2910 | UMAG_02475 (Stp1) | 32% | 3e-42 | 60.71 | Complete loss of tumor formation – blocked in early stages of infection | Schipper, 2009 |
| g3652 | UMAG_02239 (See1) | 43% | 9e-11 | 54.90 | Organ-specific effector – reduced virulence in seedling leaves | Redkar et al., 2015 |
| g3113 | UMAG_01375 (Pit2) | * | * | * | Complete loss of tumor formation – blocked in early stages of infection | Doehlemann et al., 2011 |
| g3279 | UMAG_03274 (Rsp3) | 10% | 5e-20 | 70.11 | Strong attenuation of virulence – reduced tumor size and number | Ma et al., 2018 |
| g5296 | UMAG_05731 (Cmu1) | 98% | 3e-70 | 43.84 | Reduced virulence | Djamei et al., 2011 |
| g6183 | UMAG_06098 (Fly1) | 100% | 0.0 | 81.85 | Reduced virulence | Ökmen et al., 2018 |
| g5835 | UMAG_05302 (Tin2) | 87% | 8e-24 | 37.81 | Minor impact on tumor formation – reduced anthocyanin biosynthesis | Brefort et al., 2014 |
Key resources table
| Reagent type (species) or resource | Designation | Source or reference | Identifiers | Additional information |
|---|---|---|---|---|
| Gene (MbA_g2490) | g2490 | This paper | ||
| Strain, strain background (Escherichia coli) | DH5α | Other | Doehlemann lab | |
| Genetic reagent (Pichia pastoris) | KM71H-OCH | Other | Doehlemann lab | |
| Antibody | Monoclonal 6x-His tag antibody | Sigma (St. Louis; Mississippi; USA) | 1/10,000 | |
| Antibody | Mouse IgG (Monoclonal) | Thermo Fischer Scientific (Waltham; Massachusetts; USA) | 1/3000 | |
| Recombinant DNA reagent | pGAPzα (plasmid) | Invitrogen, Carlsbad, CA, USA | ||
| Sequence-based reagent | A. thaliana EF1-α:forward | Ruhe et al., 2016 | PCR primers | AAGGAGGCTGCTGAGATGAA |
| Sequence-based reagent | A. thaliana EF1-α:reverse | Ruhe et al., 2016 | PCR primers | TGGTGGTCTCGAACTTCCAG |
| Sequence-based reagent | Oomycete internal transcribed spacer (ITS) 5.8 s: forward | Ruhe et al., 2016 | PCR primers | ACTTTCAGCAGTGGATGTCTA |
| Sequence-based reagent | Oomycete internal transcribed spacer (ITS) 5.8 s: reverse | Ruhe et al., 2016 | PCR primers | GATGACTCACTGAATTCTGCA |
| Commercial assay or kit | EnzChek Lysozyme Assay Kit | Invitrogen | E22013 | Lysozyme activity assay |
| Chemical compound, drug | Trypan blue stain | Sigma Aldrich (No. 302643) | CAS-Number: 72-57-1 |
Additional files
-
Supplementary file 1
Composition of the bacterial SynCom.
- https://cdn.elifesciences.org/articles/65306/elife-65306-supp1-v2.docx
-
Supplementary file 2
MbA gene expression data.
- https://cdn.elifesciences.org/articles/65306/elife-65306-supp2-v2.xlsx
-
Supplementary file 3
Growth media and buffers used in this study.
- https://cdn.elifesciences.org/articles/65306/elife-65306-supp3-v2.docx
-
Supplementary file 4
PCR primers used in this study.
- https://cdn.elifesciences.org/articles/65306/elife-65306-supp4-v2.xlsx
-
Transparent reporting form
- https://cdn.elifesciences.org/articles/65306/elife-65306-transrepform-v2.docx
Download links
A two-part list of links to download the article, or parts of the article, in various formats.
Downloads (link to download the article as PDF)
Open citations (links to open the citations from this article in various online reference manager services)
Cite this article (links to download the citations from this article in formats compatible with various reference manager tools)
A fungal member of the Arabidopsis thaliana phyllosphere antagonizes Albugo laibachii via a GH25 lysozyme
eLife 10:e65306.
https://doi.org/10.7554/eLife.65306


