Identification of autosomal cis expression quantitative trait methylation (cis eQTMs) in children’s blood
- Centro de Investigación Biomédica en Red de Enfermedades Raras (CIBERER), Spain
- Universitat Pompeu Fabra (UPF), Spain
- Centro Nacional de Análisis Genómico (CNAG-CRG), Center for Genomic Regulation, Barcelona Institute of Science and Technology (BIST), Spain
- ISGlobal, Spain
- Center for Genomic Regulation (CRG), Barcelona Institute of Science and Technology, Spain
- CIBER Epidemiología y Salud Pública (CIBERESP), Spain
- Medicine Genomics Group, University of Santiago de Compostela, Spain
- Bradford Institute for Health Research, Bradford Teaching Hospitals NHS Foundation Trust, United Kingdom
- University Grenoble Alpes, Inserm, CNRS, Team of Environmental Epidemiology Applied to Reproduction and Respiratory Health, France
- Department of Environmental Science, Vytautas Magnus University, Lithuania
- Department of Environmental Health, Norwegian Institute of Public Health, Norway
- Department of Social Medicine, University of Crete, Greece
- Department of Preventive Medicine, Keck School of Medicine, University of Southern California, Los Angeles, United States
- Medicine Genomics Group, CIBERER, University of Santiago de Compostela, Spain
- Galician Foundation of Genomic Medicine, Spain
- Quantitative Genomics Medicine Laboratories (qGenomics), Esplugues del Llobrega, Spain
- Departament de Biomedicina, Institut de Neurociències, Universitat de Barcelona, Spain
Figures
Figure 1 with 5 supplements
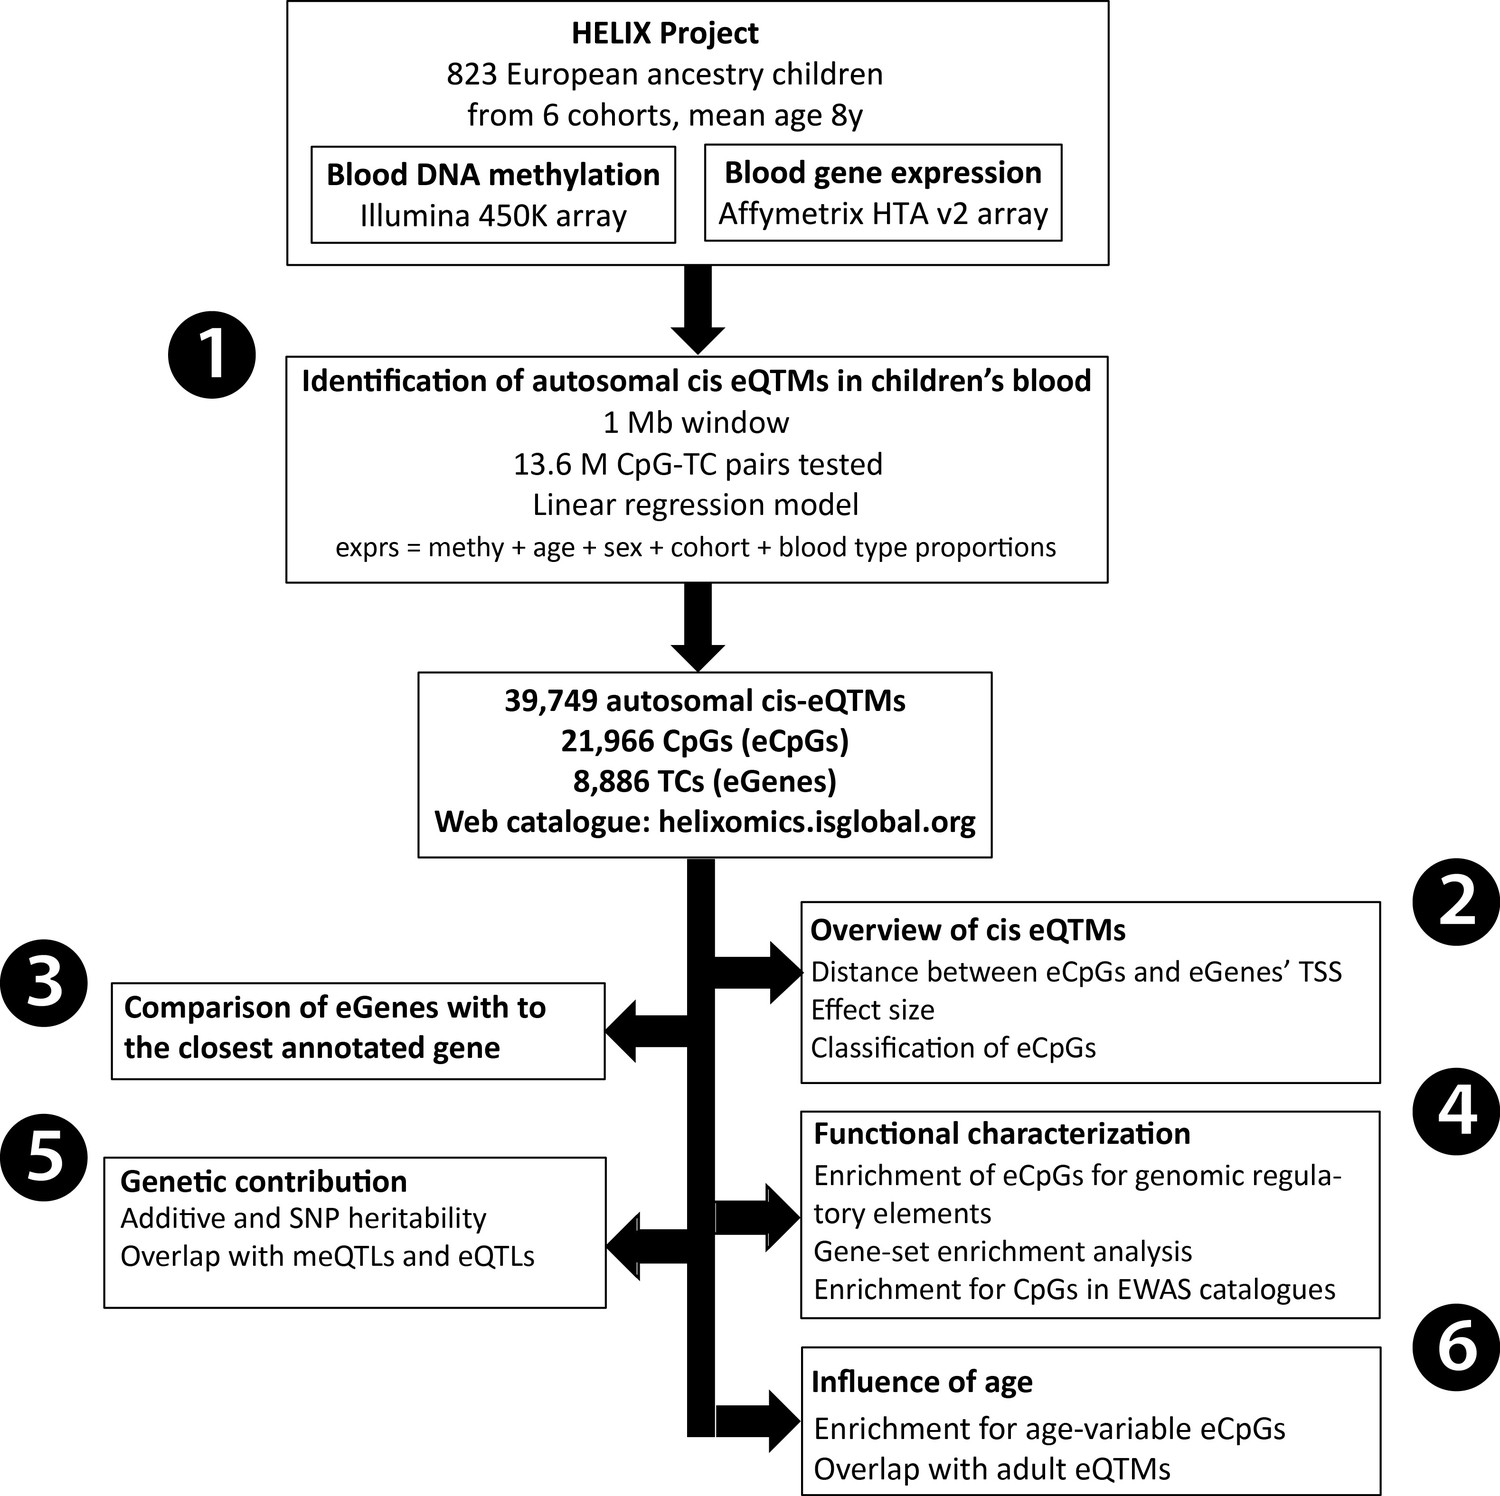
Analysis workflow.
The figure summarizes the analyses conducted in this study. The first step was (1) the identification of blood autosomal cis eQTMs (1 Mb window centered at the transcription start site, TSS, of the gene) in 823 European ancestry children from the HELIX project, by linear regression models adjusted for age, sex, cohort, and blood cell type proportions. All the associations are reported in the web catalogue (http://www.helixomics.isglobal.org/) and in Dryad (doi:10.5061/dryad.fxpnvx0t0). Then, (2) we explored the distance from the eCpG (CpG involved in an eQTM) to eGene’s TSS (gene involved in an eQTM), the effect size of the association, and classified eCpGs in different types. Next, (3) we evaluated the proportion of eGenes potentially inferred through annotation of eCpGs to the closest gene. Finally, (4) we functionally characterized eCpGs and eGenes; (5) assessed the contribution of genetic variants; and (6) evaluated the influence of age.
Figure 1—figure supplement 1
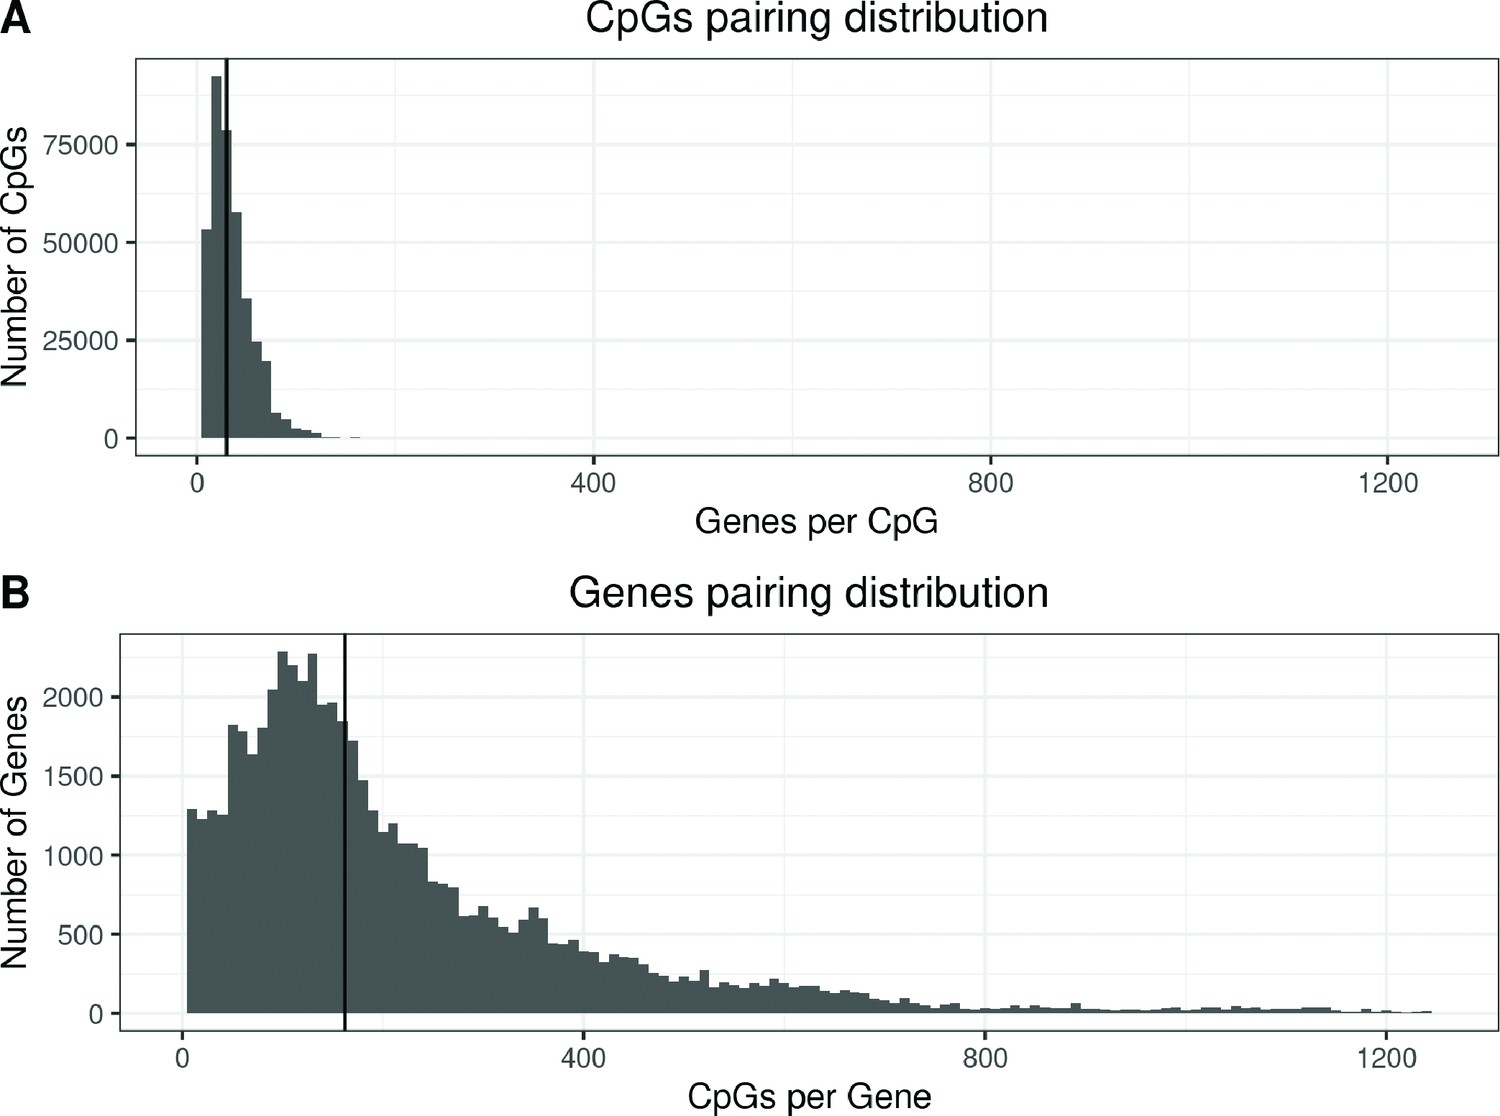
Distribution of enes and CpGs in all CpG-Gene pairs.
(A) Distribution of the number of enes paired with each CpG. The y-axis represents the number of CpGs that are paired with a given number of enes, indicated in the x-axis. The vertical line marks the median of the distribution. Each CpG was paired to a median of 30 Genes (IQR: 20; 46). (B) Distribution of the number of CpGs paired with each ene. The y-axis represents the number of enes that are paired with a given number of CpGs, indicated in the x-axis. The vertical line marks the median of the distribution. Each ene was paired to a median of 162 CpGs (IQR: 93; 297).
Figure 1—figure supplement 2
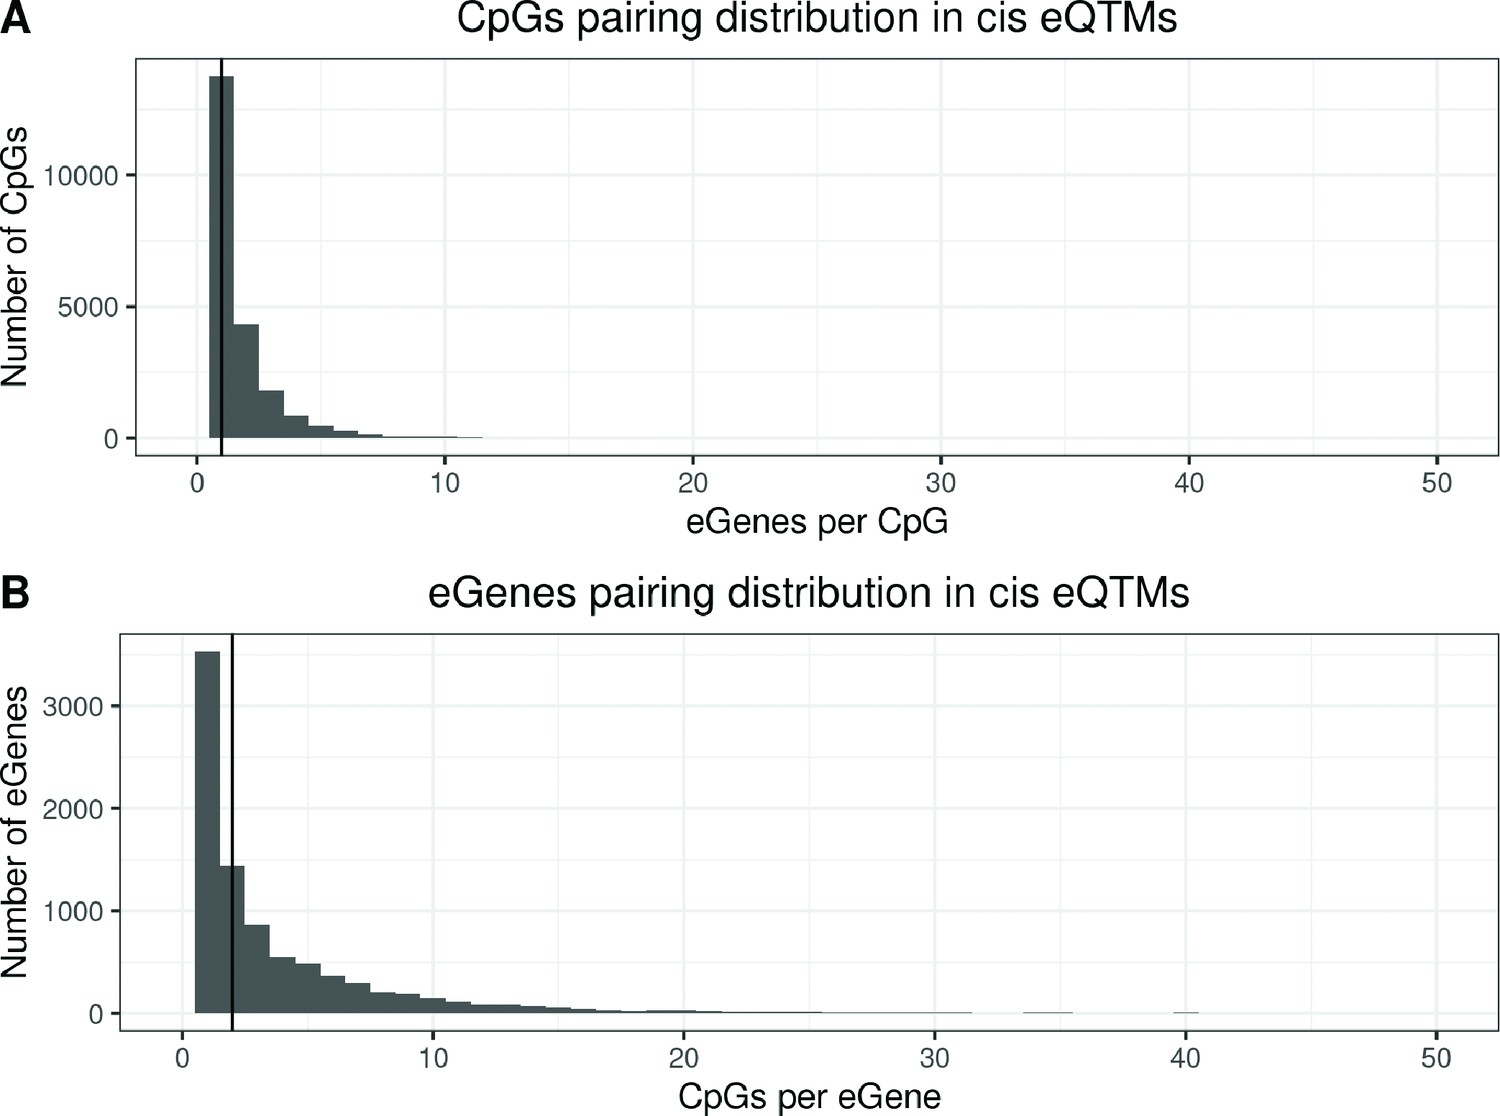
Distribution of eGenes and eCpGs in autosomal cis eQTMs.
(A) Distribution of the number of eGenes paired with each eCpG in eQTMs. The y-axis represents the number of eCpGs that are paired with a given number of eGenes, indicated in the x-axis. Each eCpG was associated with a median of 1 eGene (IQR = 1; 2). (B) Distribution of the number of eCpGs paired with each eGenes in eQTMs. The y-axis represents the number of eGenes that are paired with a given number of eCpGs, indicated in the x-axis. Each eGene was associated with a median of 2 eCpGs (IQR = 1; 5).
Figure 1—figure supplement 3
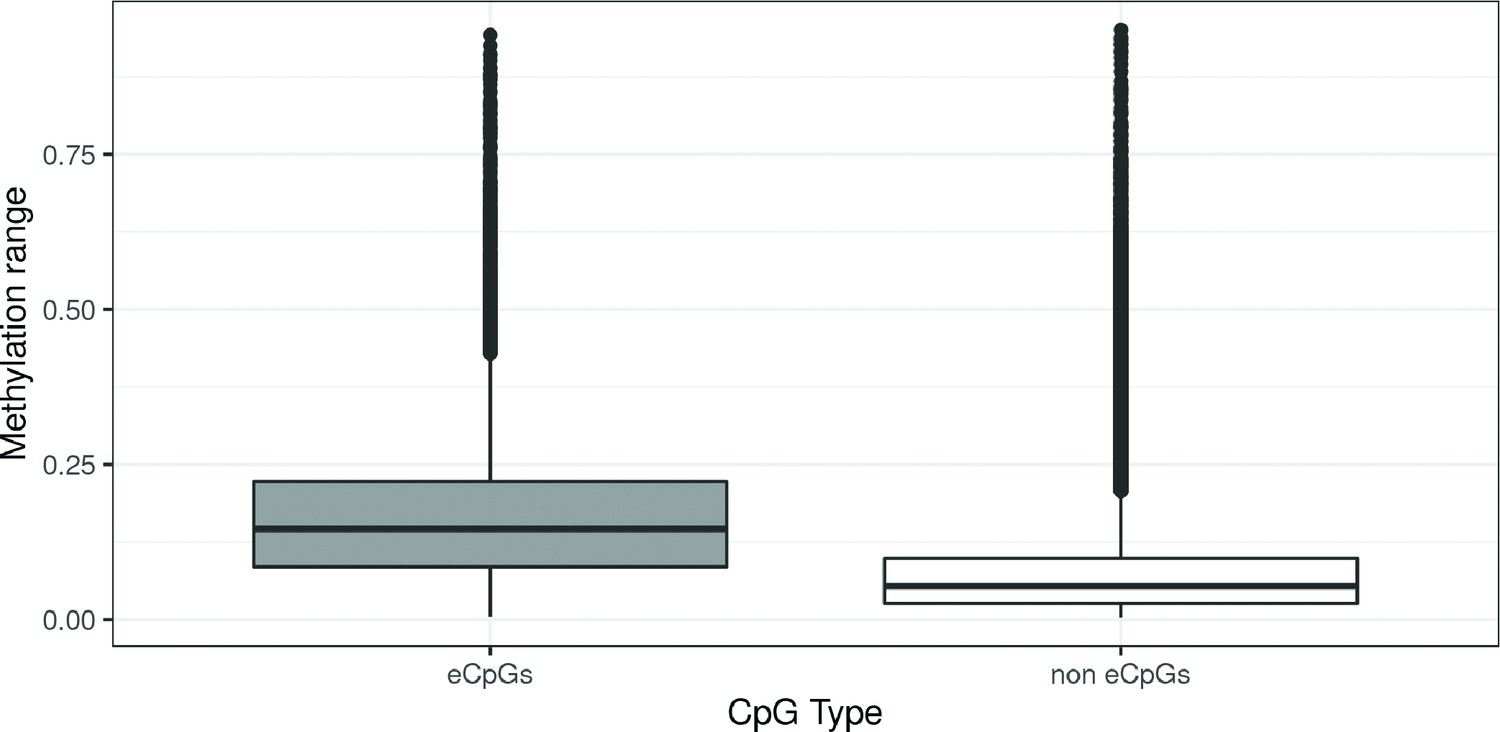
DNA methylation range by CpG type.
CpGs were classified in: eCpGs (CpGs associated with gene expression, N = 21,966, in grey) and non eCpGs (N = 364,452, in white). Methylation range was computed as the difference between the methylation values in percentile 1 and percentile 99 (Lin et al., 2017).
Figure 1—figure supplement 4
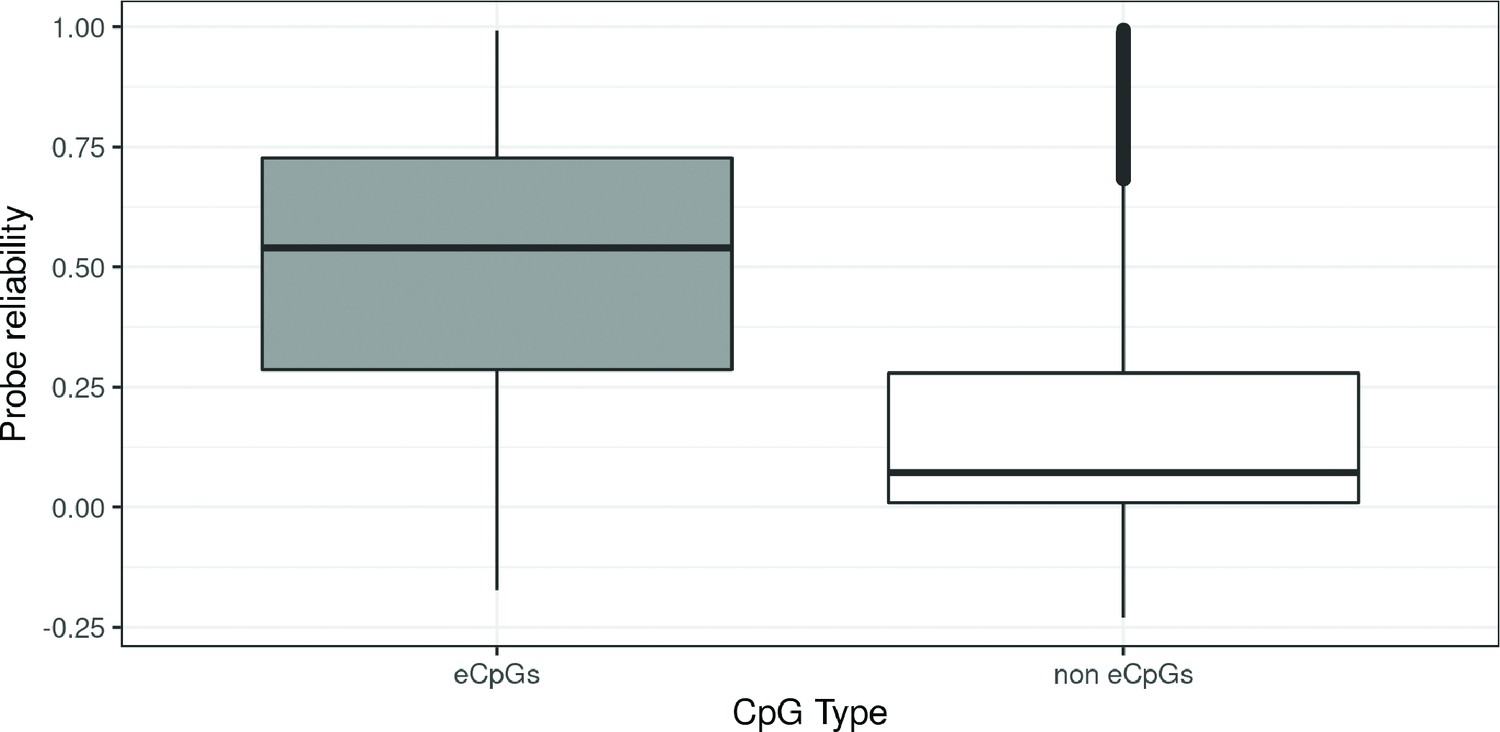
Probe reliability by CpG type.
CpGs were classified in: eCpGs (CpGs associated with gene expression, N = 21,966, in grey) and non eCpGs (N = 364,452, in white). Probe reliability was based on intraclass correlation coefficients (ICC) obtained from Sugden et al., 2020.
Figure 1—figure supplement 5

Genes call rate distribution by Gene type.
Genes were classified in: eGenes (Genes associated DNA methylation, N = 8,886, in grey) and non eGenes (N = 51,806, in white). For a given Gene, call rate is the proportion of children with gene expression levels over the background noise.
Figure 2 with 1 supplement
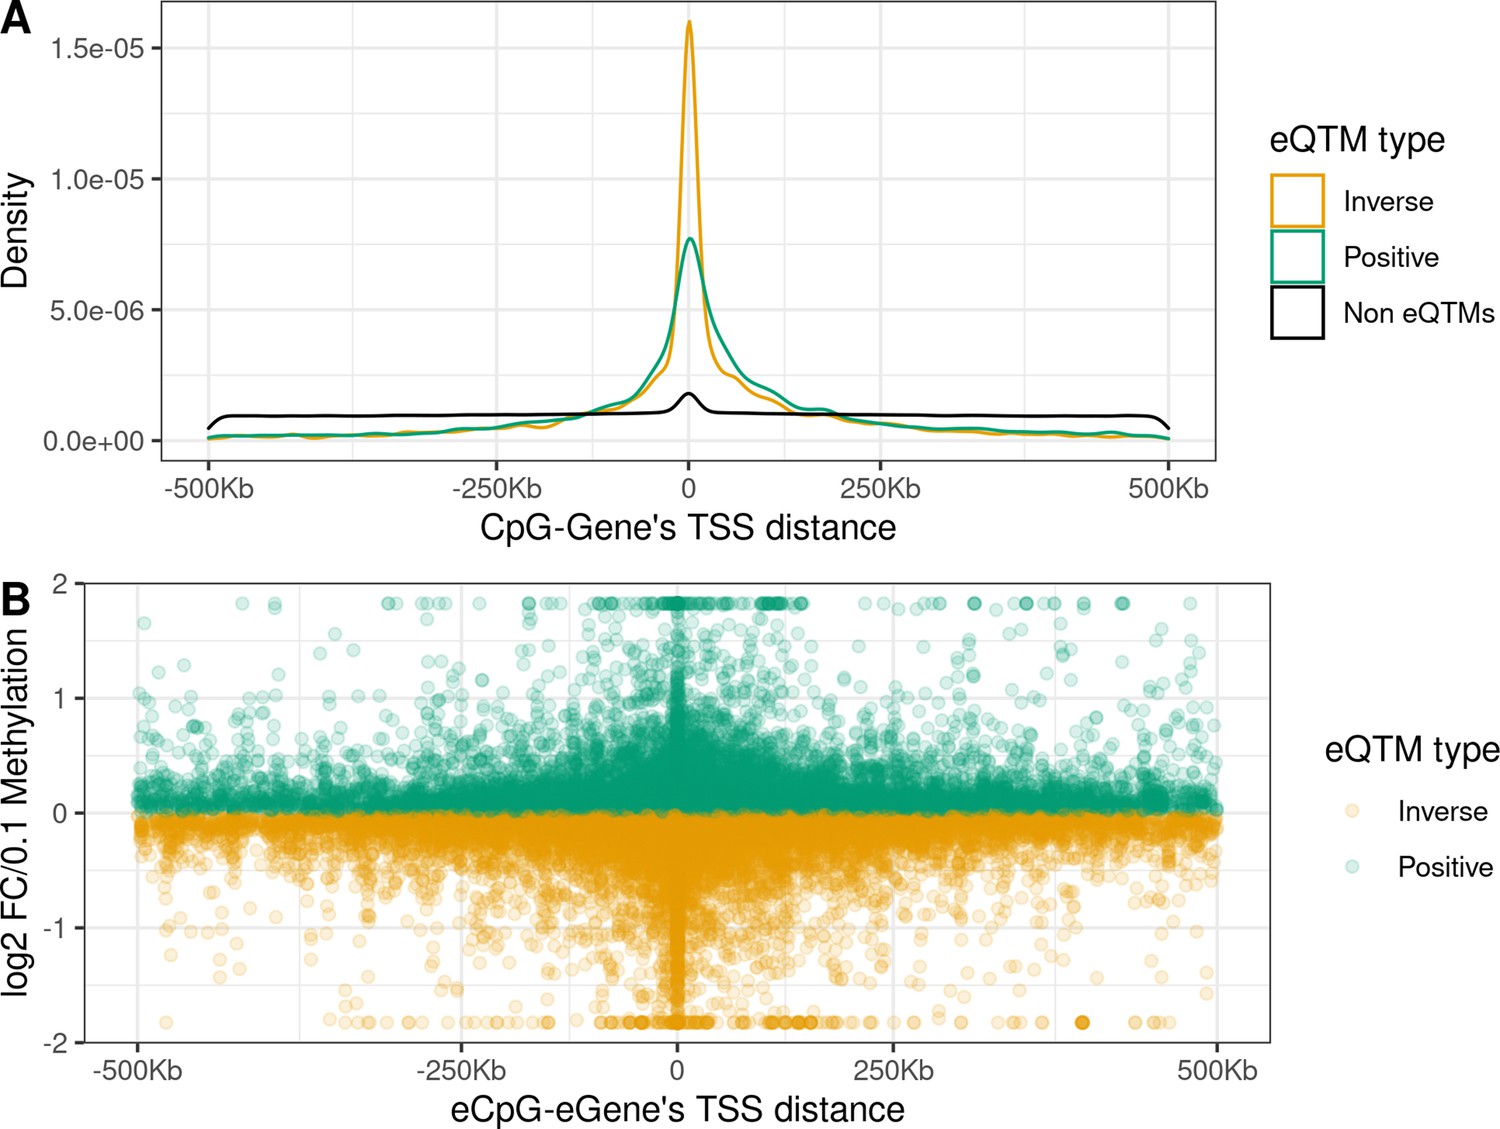
Distance between CpG and ene’s TSS and effect size in child blood autosomal cis eQTMs.
(A) Distribution of the distance between CpG and ene’s TSS by eQTM type. CpG-Gene pairs were classified in non eQTMs (black); inverse eQTMs (yellow); and positive eQTMs (green). The x-axis represents the distance between the CpG and the ene’s TSS (kb). Non eQTMs median distance: –0.013 kb (interquartile range - IQR = –237; 236). Positive eQTMs median distance: –4.9 kb (IQR = –38; 79). Inverse eQTMs median distance: –0.7 kb (IQR = –29; 54). (B) Effect size versus eCpG-Gene’s TSS distance in eQTMs. The x-axis represents the distance between the eCpG and the eGene’s TSS (kb). The y-axis represents the effect size as the log2 fold change in gene expression produced by a 0.1 increase in DNA methylation (or 10 percentile increase). To improve visualization, a 99% winsorization has been applied to log2 fold change values: values more extreme than 99% percentile have been changed for the 99% quantile value. eQTMs are classified in inverse (yellow) and positive (green). Each eQTM is represented by one dot. The darker the color, the more dots overlapping, and so the higher the number of eQTMs with the same effect size and eCpG-eGene’s TSS distance.
Figure 2—figure supplement 1
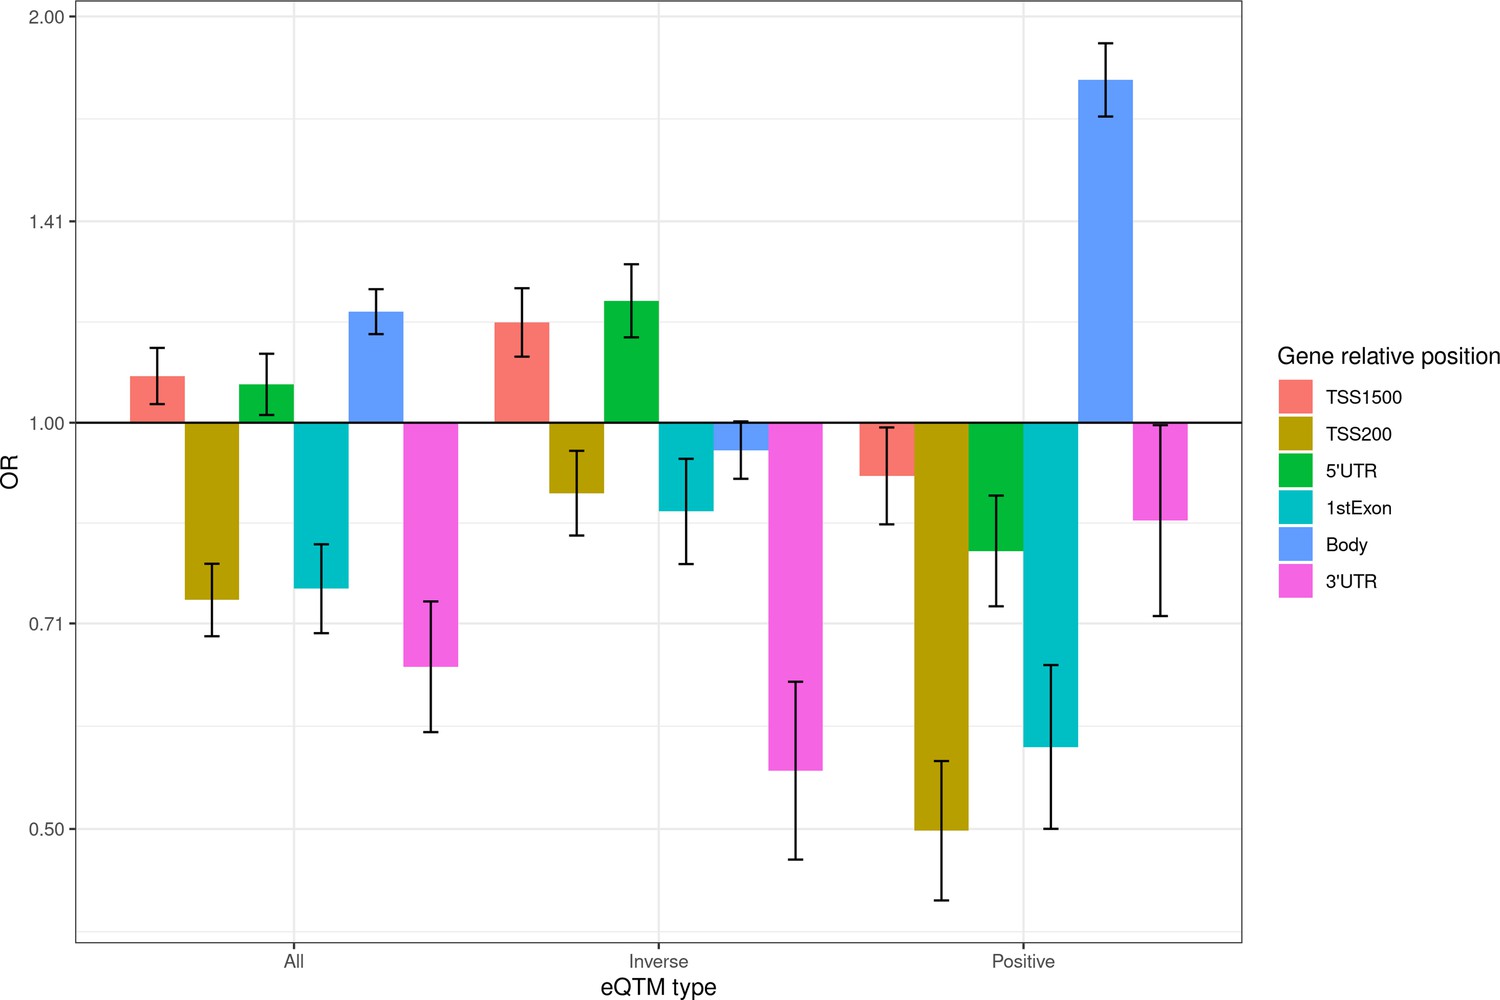
Enrichment of eCpGs for gene relative positions.
We selected the subset of 327,931 CpG-Gene pairs where the CpG and the Gene were annotated to the same gene. Enrichment was computed for all eCpGs in this subset, and for inverse and positive eCpGs. Genic regions are classified in distal promoter from 200 to 1500 bp (TSS1500); proximal promoter up to 200 bp (TSS200), 5’ untranslated region (5’UTR); 1st exon; gene body; and 3’ untranslated region (3’UTR). The y-axis represents the odds ratio (OR) of the enrichment. For all gene relative positions, the enrichment was computed against CpG-Gene pairs with CpG and Gene annotated to the same gene that were not eQTMs.
Figure 3 with 2 supplements
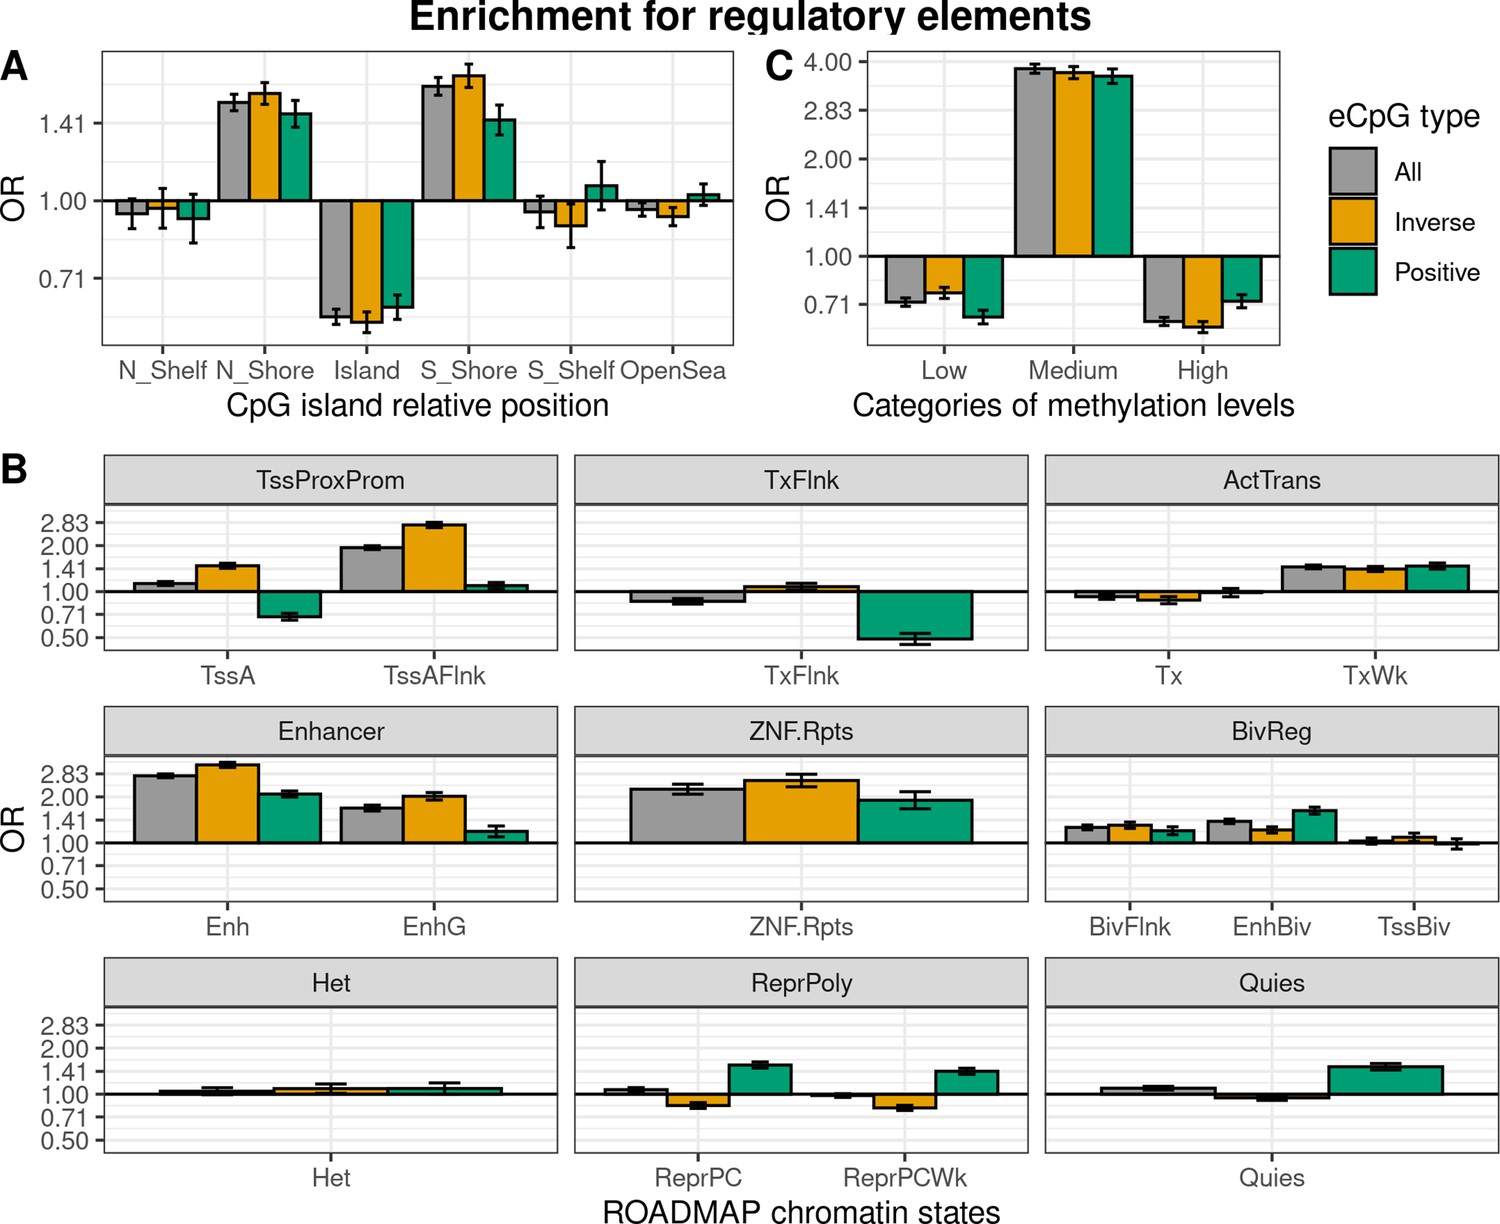
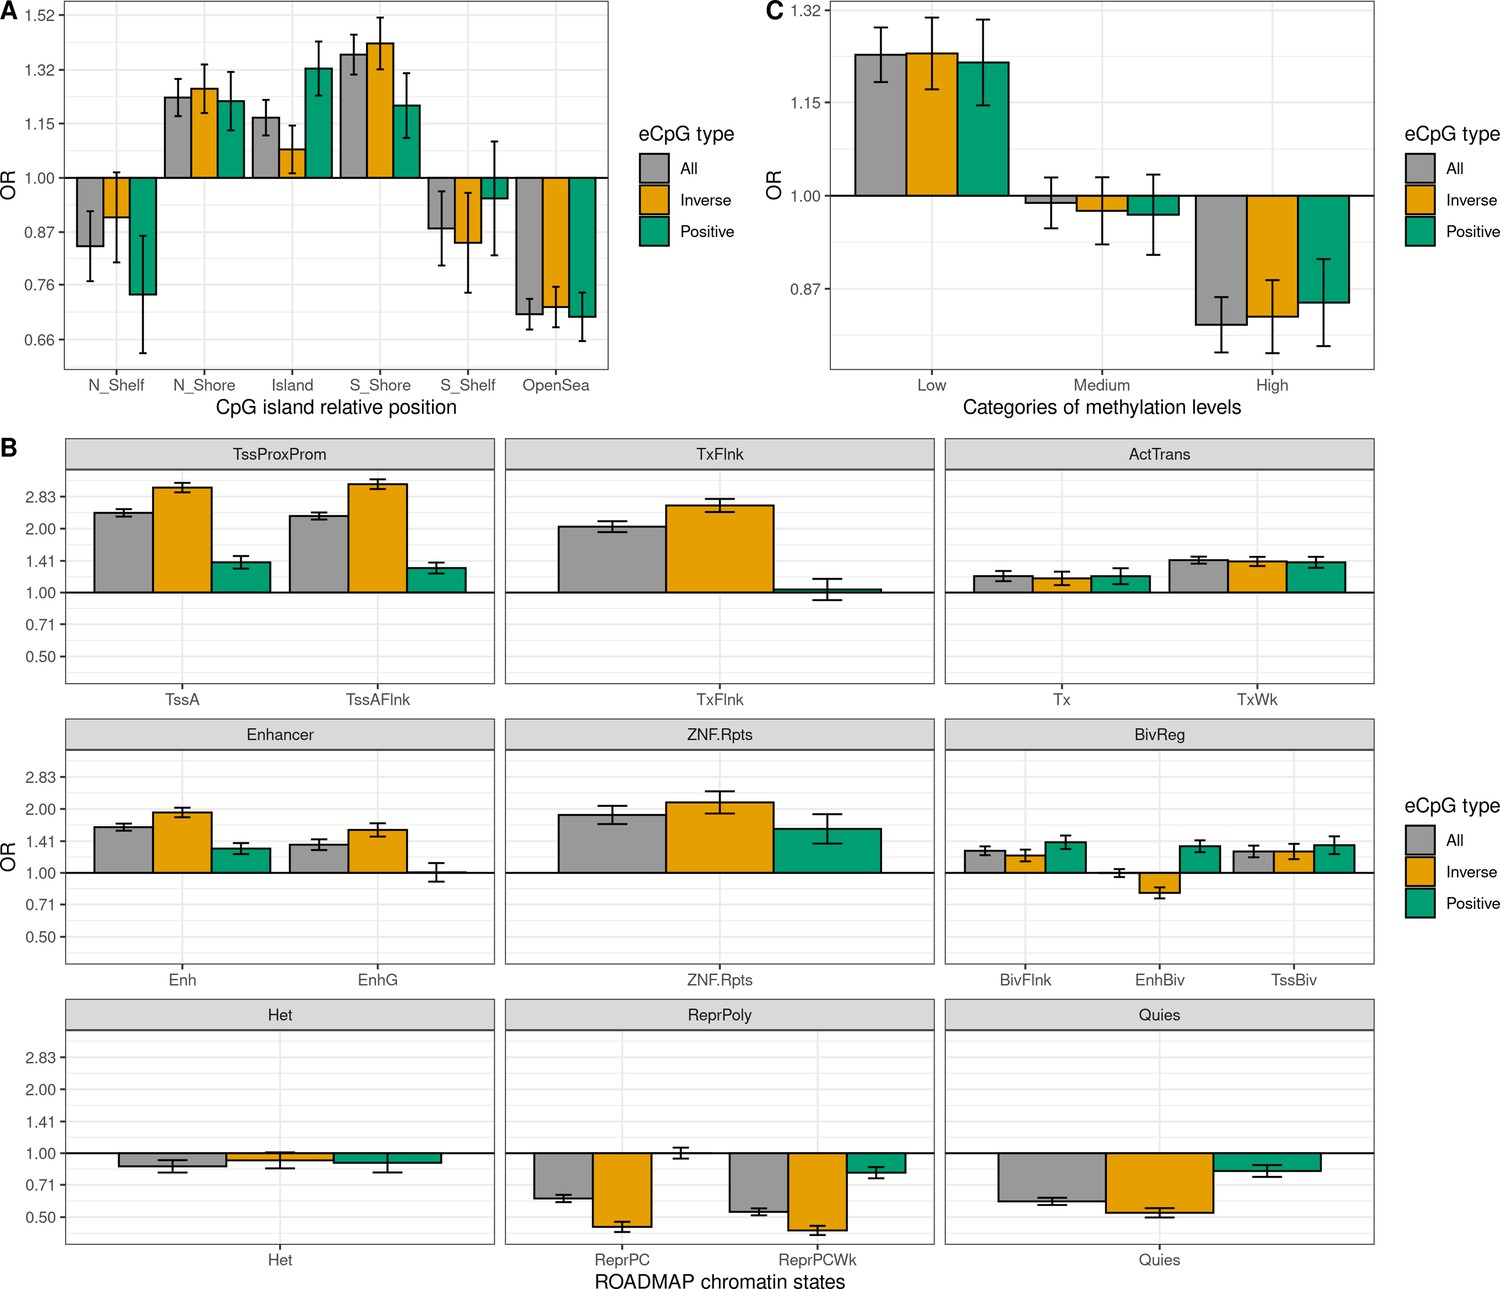
Enrichment of cis autosomal eCpGs in children’s blood for different regulatory elements.
eCpGs were classified in all (grey), inverse (yellow), and positive (green). The y-axis represents the odds ratio (OR) of the enrichment. In all cases, the enrichment was computed against non eCpGs. (A) Enrichment for CpG island relative positions: CpG island, N- and S-shore, N- and S-shelf, and open sea. (B) Enrichment for ROADMAP blood chromatin states (Roadmap Epigenomics Consortium et al., 2015): active TSS (TssA); flanking active TSS (TssAFlnk); transcription at 5’ and 3’ (TxFlnk); transcription region (Tx); weak transcription region (TxWk); enhancer (Enh); genic enhancer (EnhG); zinc finger genes and repeats (ZNF.Rpts); flanking bivalent region (BivFlnx); bivalent enhancer (EnhBiv); bivalent TSS (TssBiv); heterochromatin (Het); repressed Polycomb (ReprPC); weak repressed Polycomb (ReprPCWk); and quiescent region (Quies). Chromatin states can be grouped in active transcription start site proximal promoter states (TssProxProm), active transcribed states (ActTrans), enhancers (Enhancers), bivalent regulatory states (BivReg), and repressed Polycomb states (ReprPoly). (C) Enrichment for categories of CpGs with different median methylation levels: low (0–0.3), medium (0.3–0.7), and high (0.7–1) (Huse et al., 2015).
Figure 3—figure supplement 1
Enrichment of eCpGs with reliable measurement for different regulatory elements.
Only eCpGs with reliable measurements (ICC >0.4) were considered (Sugden et al., 2020). eCpGs were classified in all (grey), inverse (yellow), and positive (green). The y-axis represents the odds ratio (OR) of the enrichment. In all cases, the enrichment was computed against non eCpGs. (A) Enrichment for CpG island relative positions: CpG island, N- and S-shore, N- and S-shelf, and open sea. (B) Enrichment for ROADMAP blood chromatin states (Roadmap Epigenomics Consortium et al., 2015): active TSS (TssA), flanking active TSS (TssAFlnk), transcription at 5’ and 3’ (TxFlnk), transcription region (Tx), weak transcription region (TxWk), enhancer (Enh); genic enhancer (EnhG), zinc finger genes and repeats (ZNF.Rpts), flanking bivalent region (BivFlnx), bivalent enhancer (EnhBiv), bivalent TSS (TssBiv), heterochromatin (Het), repressed Polycomb (ReprPC), weak repressed Polycomb (ReprPCWk), and quiescent region (Quies). Chromatin states can be grouped in active transcription start site proximal promoter states (TssProxProm), active transcribed states (ActTrans), enhancers (Enhancers), bivalent regulatory states (BivReg) and repressed Polycomb states (ReprPoly). (C) Enrichment for groups of CpGs with different median methylation levels: low (0–0.3), medium (0.3–0.7), and high (0.7–1) (Huse et al., 2015).
Figure 3—figure supplement 2
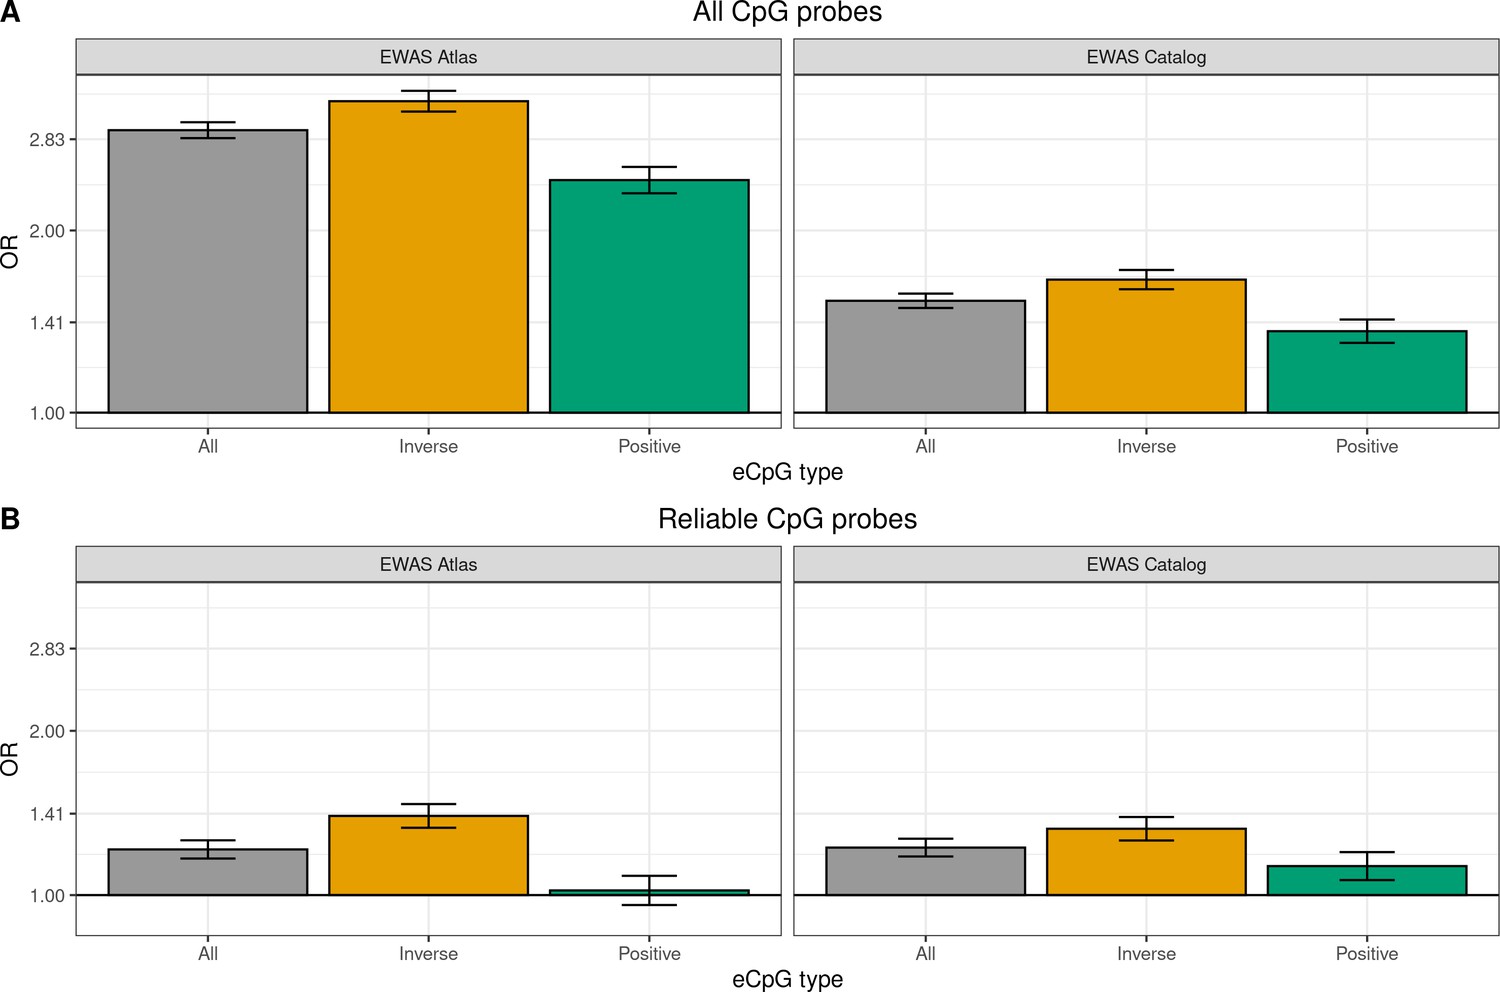
Enrichment of autosomal cis eCpGs in children’s blood for CpGs reported to be associated with phenotypic traits and/or environmental exposures.
Enrichment for CpGs present in EWAS datasets: the EWAS Atlas (Li et al., 2019), and the EWAS Catalog (Battram et al., 2021). eCpGs were classified in all (grey), inverse (yellow), and positive (green). In all cases, the enrichment was computed against non eCpGs. The y-axis represents the odds ratio (OR) of the enrichment. (A) Enrichment considering all CpGs. (B) Enrichment considering only CpGs measured with reliable probes (ICC > 0.4) (Sugden et al., 2020). intraclass correlation coefficient.
Figure 4 with 4 supplements
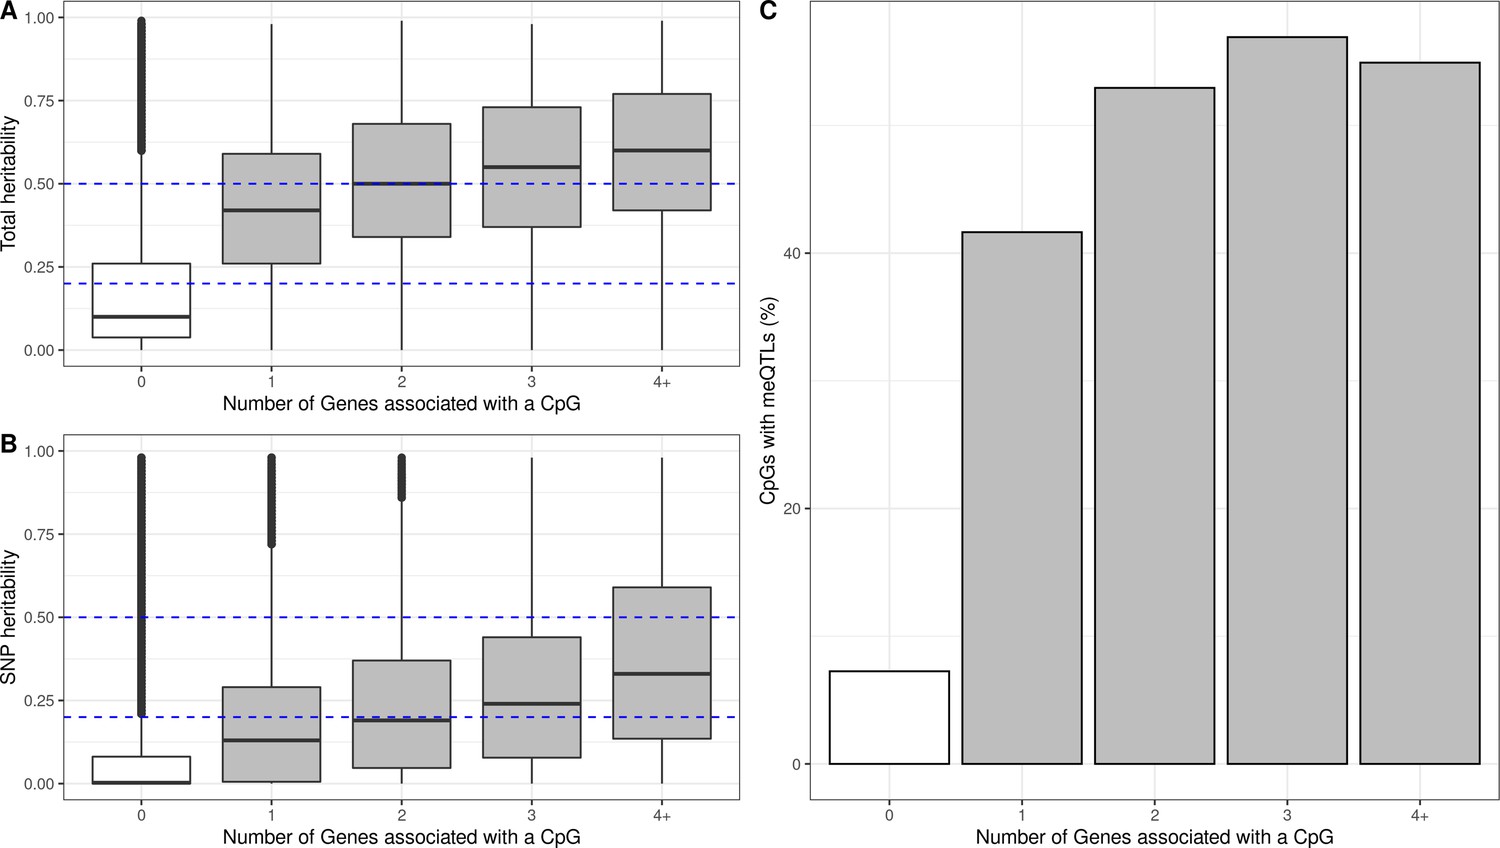
Genetic contribution to autosomal cis eQTMs in children’s blood.
CpGs were grouped by the number of Genes they were associated with, where 0 means that a CpG was not associated with any Gene (non eCpG). (A) Total additive heritability and (B) SNP heritability as inferred by Van Dongen and colleagues (van Dongen et al., 2016). The y-axis represents heritability and the x-axis each group of CpGs associated with a given number of Genes. (C) Proportion of CpGs having a meQTL (methylation quantitative trait locus), by each group of CpGs associated with a given number of Genes.
Figure 4—figure supplement 1

Heritability of methylation levels in CpGs with reliable measurements.
Only CpGs measured with reliable probes (ICC >0.4) were considered (Sugden et al., 2020). CpGs were grouped by the number of Genes they were associated with, where 0 means that a CpG was not associated with any Gene (non eCpGs, in white). (A) Total additive heritability as inferred by Van Dongen and colleagues (van Dongen et al., 2016), by each group of CpGs associated with a given number of Genes. (B) SNP heritability as inferred by Van Dongen and colleagues (van Dongen et al., 2016), by each group of CpGs associated with a given number of Genes.
Figure 4—figure supplement 2
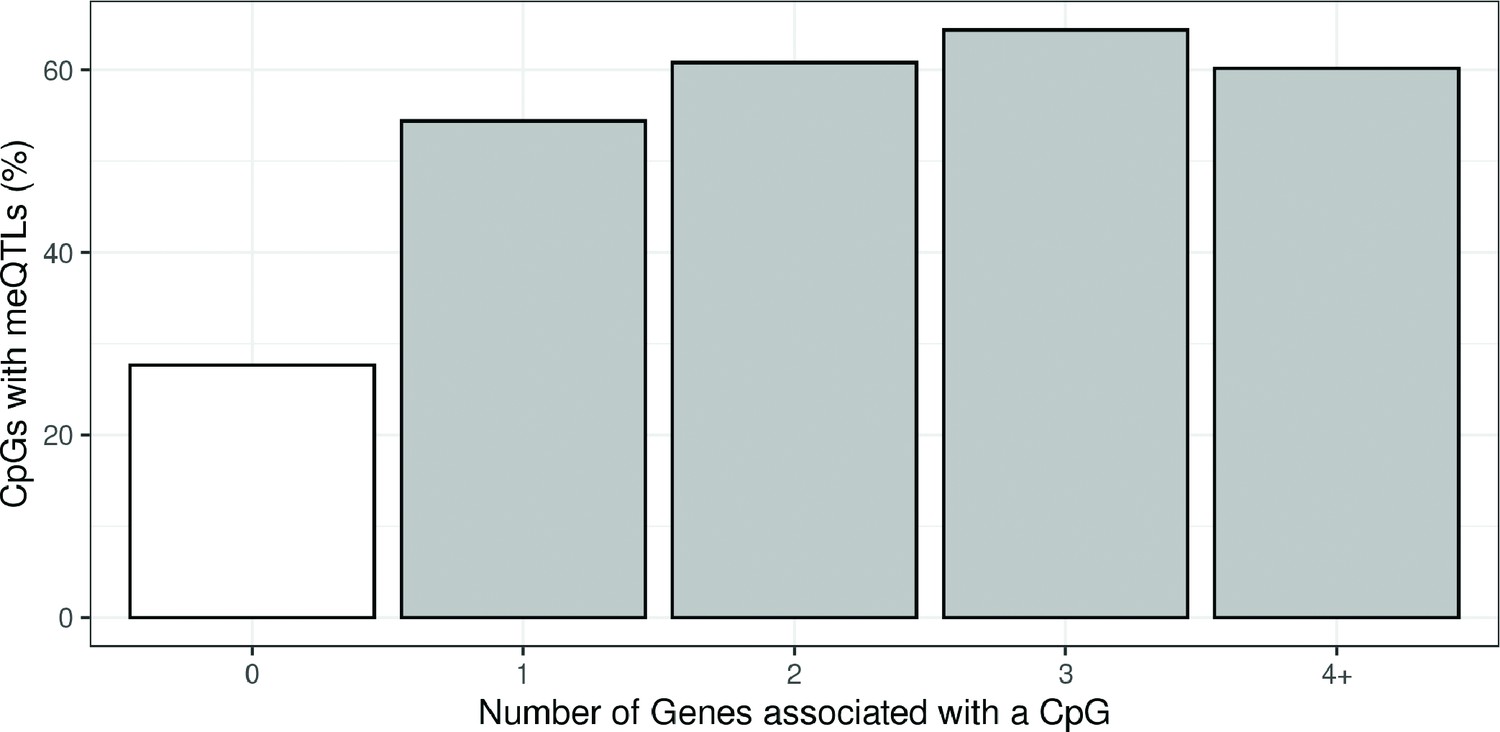
Proportion of CpGs having a meQTL (methylation quantitative trait loci) among CpGs with reliable measurements.
Only CpGs measured with reliable probes (ICC > 0.4) were considered (Sugden et al., 2020). CpGs were grouped by the number of Genes they were associated with.
Figure 4—figure supplement 3
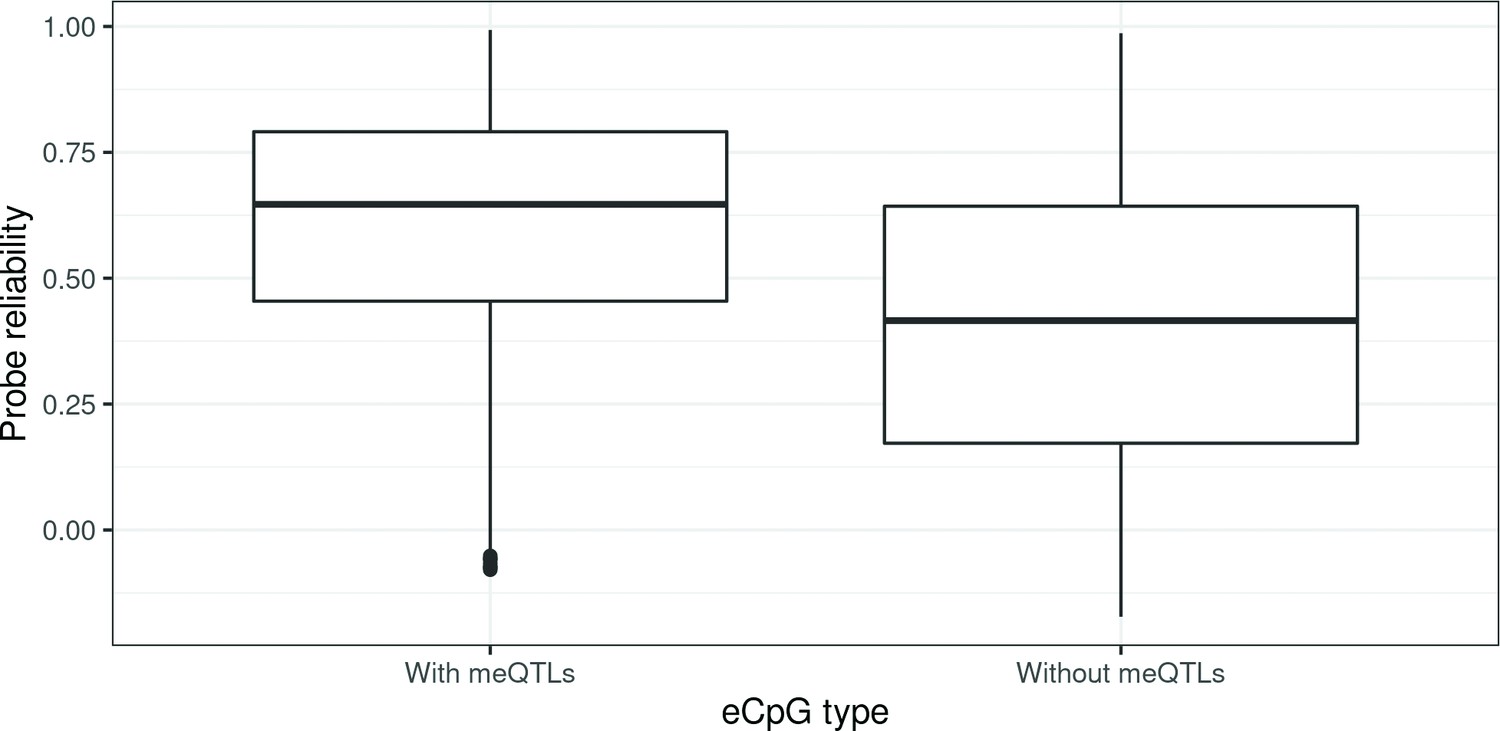
Probe reliability in autosomal cis eCpGs according to association with genetic variants.
eCpGs were classified in two groups, depending on whether their methylation values were associated with any genetic variant. Probe reliabilities were based on intraclass correlations (ICCs) obtained from Sugden et al., 2020.
Figure 4—figure supplement 4
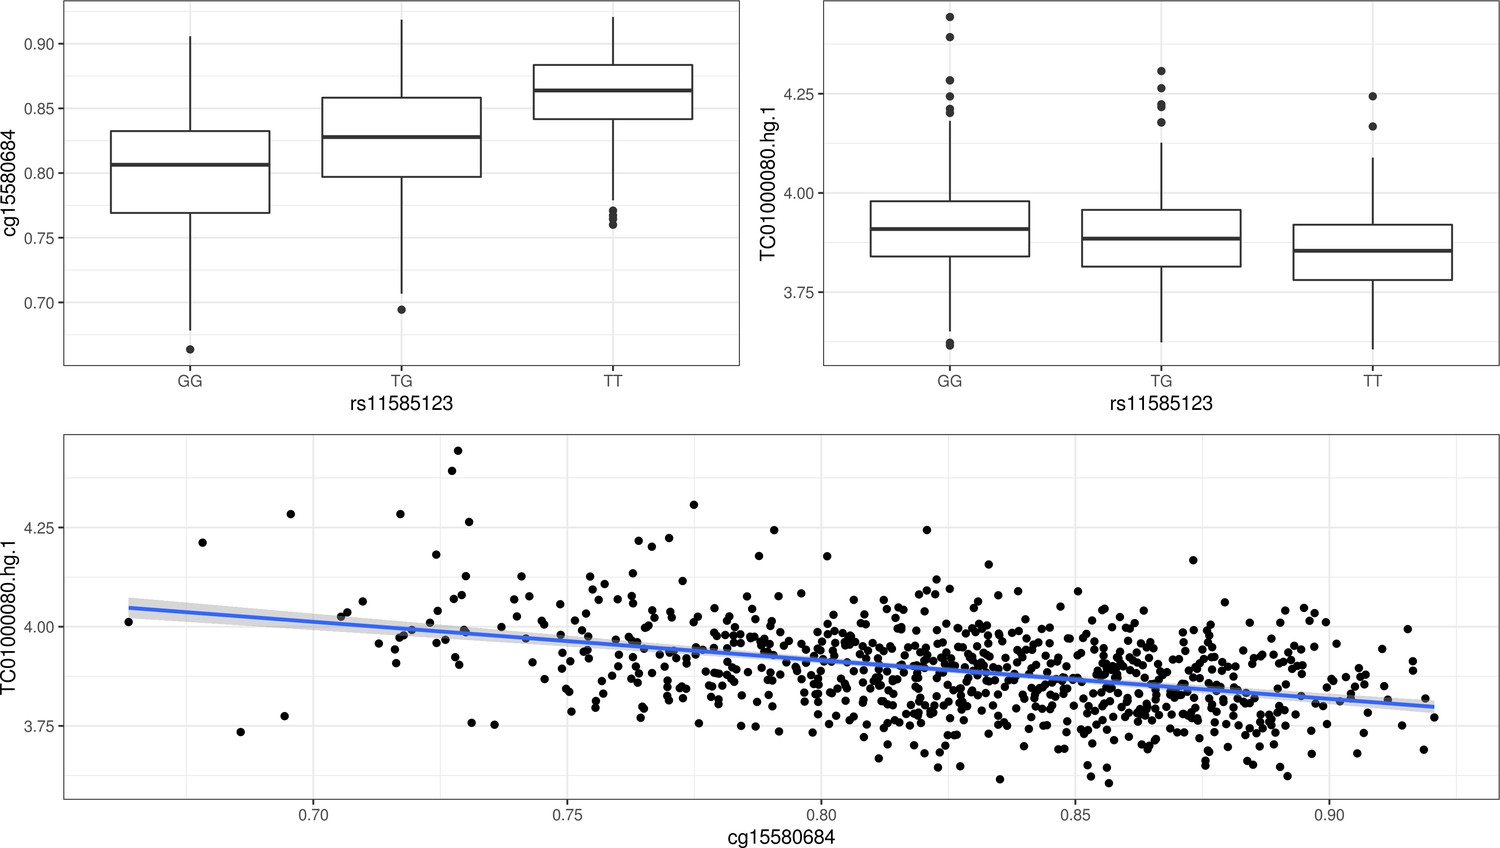
Example of a trio of SNP-CpG-Gene.
(A) Methylation levels (cg15580684) by SNP genotypes (rs11585123). (B) Gene expression levels (TC01000080.hg.1, AJAP1 gene) by SNP genotypes (rs11585123). (C) Correlation between gene expression (TC01000080.hg.1, AJAP1 gene) and methylation levels (cg15580684).
Figure 5 with 4 supplements
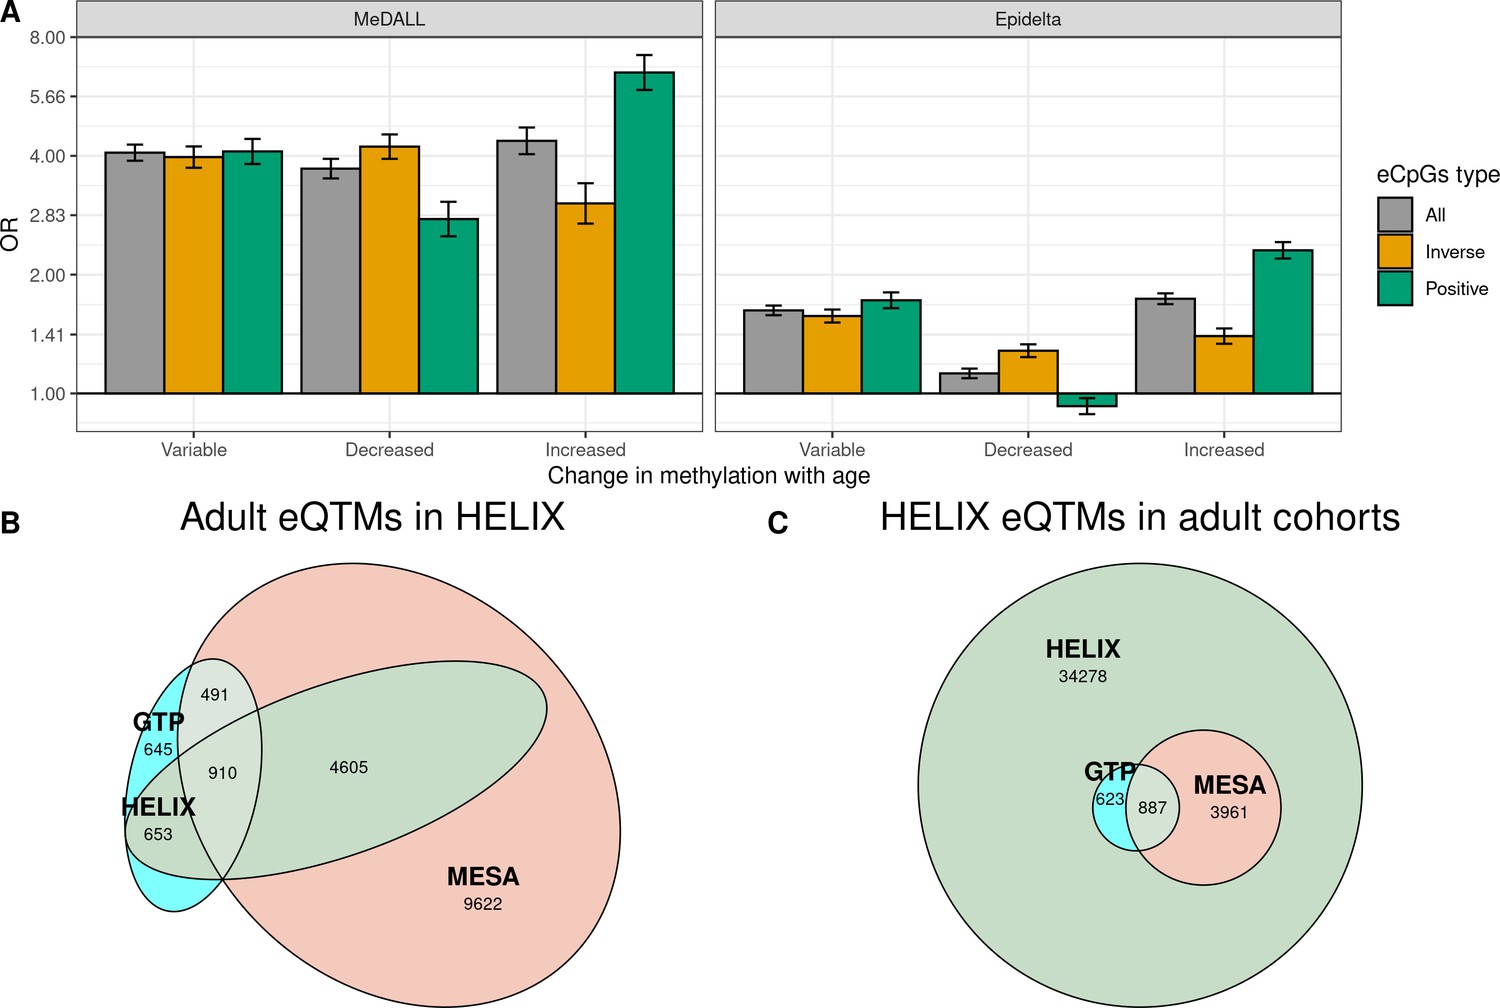
Influence of age on autosomal cis eQTMs in children’s blood.
(A) Enrichment of eCpGs for CpGs whose methylation levels change with age, in comparison to non eCpGs. eCpGs were classified in all (grey); inverse (yellow); and positive (green). CpGs whose methylation change with age were retrieved from the MeDALL project (from birth to childhood Xu et al., 2017) and from the Epidelta project (from birth to adolescence Mulder et al., 2021). They were classified in variable (CpGs with methylation levels that change with age); decreased (CpGs with methylation levels that decrease with age); and increased (CpGs with methylation levels that increase with age). The y-axis represents the odds ratio (OR) of the enrichment. (B) Overlap between autosomal cis/trans eQTMs identified in adults (GTP: whole blood; MESA: monocytes) (Kennedy et al., 2018) with cis eQTMs identified in children (HELIX: whole blood). All CpG-gene pairs reported at P-value < 1e-5 in GTP or MESA that could be compared with pairs in HELIX are shown. (C) Overlap between blood autosomal cis eQTMs identified in HELIX children with cis/trans eQTMs identified in adults (GTP: whole blood; MESA: monocytes) (Kennedy et al., 2018). All CpG-gene pairs in HELIX that could be compared with pairs in GTP or MESA are shown. Note: The comparison has been split into two plots because one eGene in HELIX can be mapped to different expression probes in GTP and MESA, and vice-versa. Only comparable CpG-Gene pairs are shown (see Materials and methods).
Figure 5—figure supplement 1

Enrichment of eCpGs with reliable measurements for CpGs with age-variable methylation levels.
Only CpGs with reliable measurements (ICC > 0.4) were considered (Sugden et al., 2020). eCpGs were classified in all (grey), inverse (yellow); and positive (green). Age-variable CpGs were retrieved from the MeDALL project (from birth to childhood Xu et al., 2017) and the Epidelta project (from birth to adolescence Mulder et al., 2021), and they were classified in: variable (CpGs with methylation levels that change with age), decreased (CpGs with methylation levels that decrease with age), and increased (CpGs with methylation levels that increase with age). The y-axis represents the odds ratio (OR) of the enrichment. For all eCpG types, the enrichment was computed against non eCpGs.
Figure 5—figure supplement 2
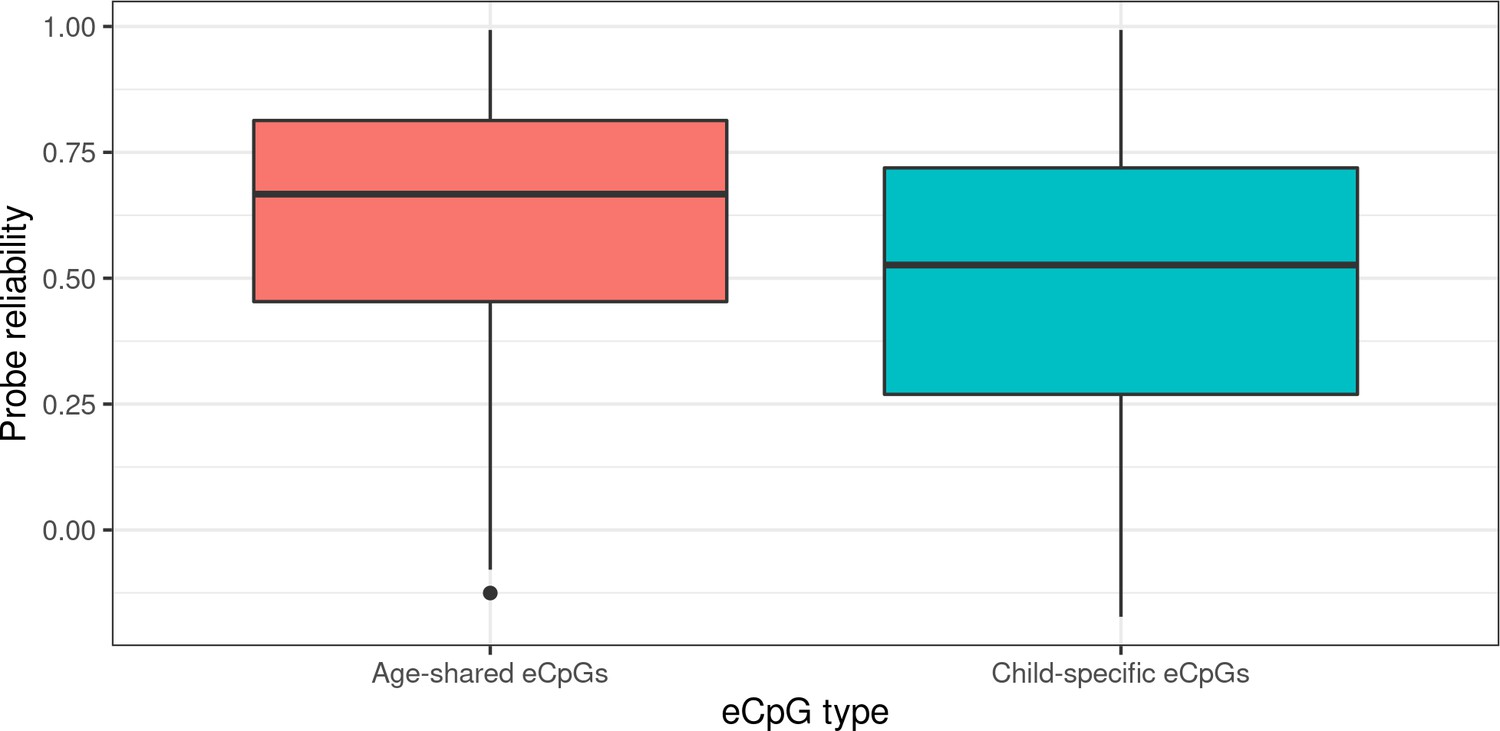
Probe reliability in eCpGs according to overlap with adult eQTMs.
eCpGs were classified in age-shared eCpGs (eCpGs identified in HELIX children and also in adults from MESA and/or GTP studies, in red); and child-specific eCpGs (eCpGs only identified in HELIX children and not in the adult cohorts, in blue). Probe reliabilities were based on intraclass correlation coefficients (ICCs) obtained from Sugden et al., 2020.
Figure 5—figure supplement 3

Distribution of the distance between CpG-Gene’s TSS by eQTM type.
eQTMs were classified in age-shared (eQTMs identified in HELIX children and also in adults from MESA or GTP studies, in red); and child-specific (eQTMs only identified in HELIX children and not in adult cohorts, in blue). Distance between eCpG and eGene’s TSS is expressed in kb. Age-shared eQTMs median distance: 1.2 kb (IQR: –2.4; 35.4 kb). Child-specific eQTMs median distance: –1.1 kb (IQR: –39.4; 70.7 kb).
Figure 5—figure supplement 4
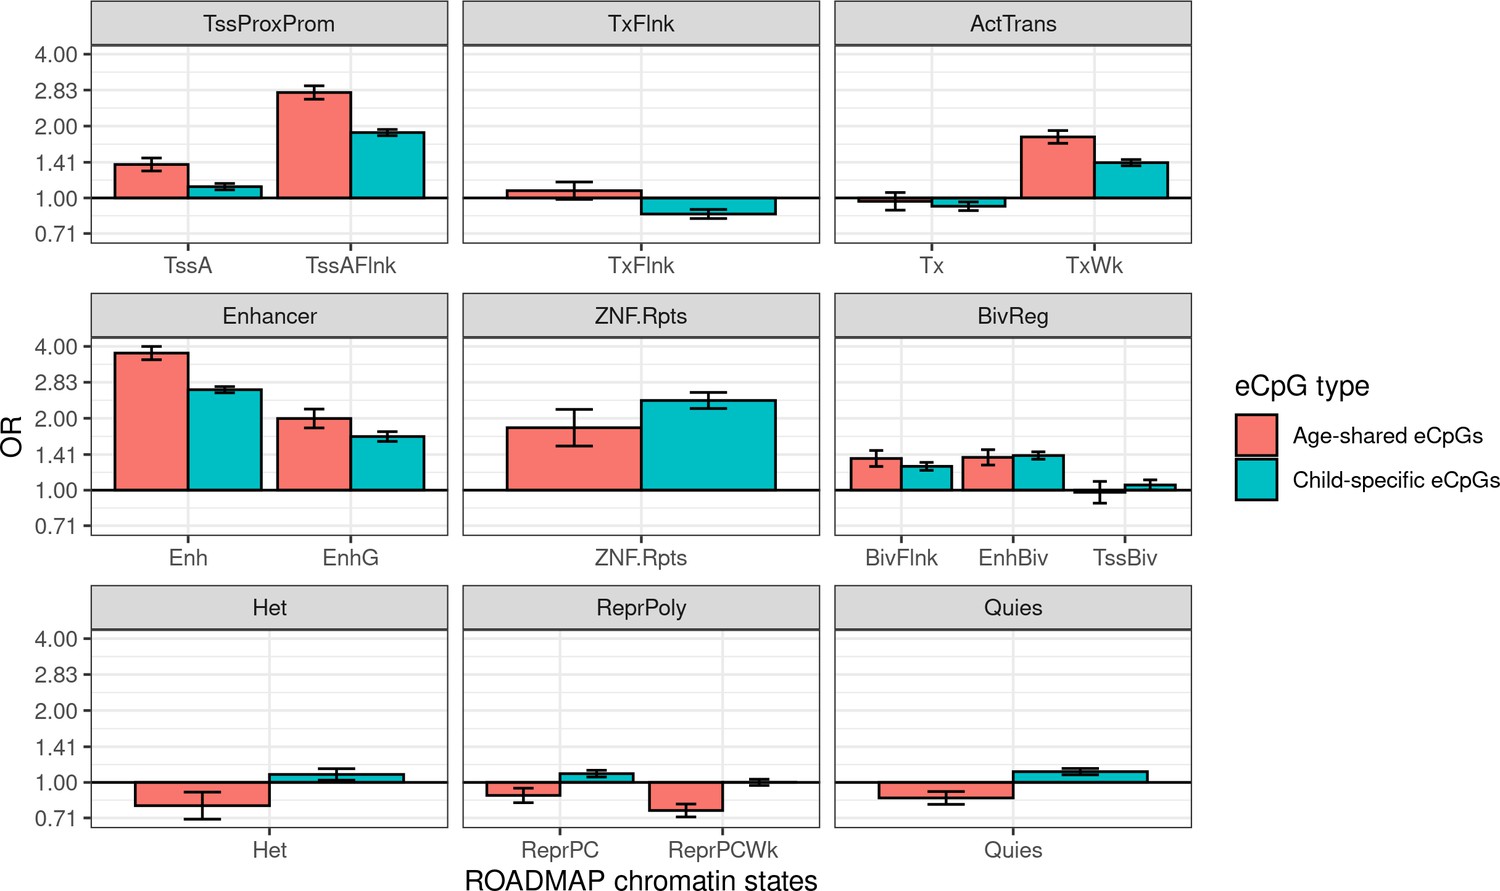
Enrichment of age-shared and child-specific eCpGs for blood ROADMAP blood chromatin states.
eCpGs were classified in age-shared (eCpGs identified in HELIX children and also in adults from MESA or GTP studies, in red); and child-specific (eCpGs only identified in HELIX children and not in adult cohorts, in blue). ROADMAP blood chromatin states (Roadmap Epigenomics Consortium et al., 2015) are: active TSS (TssA), flanking active TSS (TssAFlnk), transcription at 5’ and 3’ (TxFlnk), transcription region (Tx), weak transcription region (TxWk), enhancer (Enh); genic enhancer (EnhG), zinc finger genes and repeats (ZNF.Rpts), flanking bivalent region (BivFlnx), bivalent enhancer (EnhBiv), bivalent TSS (TssBiv), heterochromatin (Het), repressed Polycomb (ReprPC), weak repressed Polycomb (ReprPCWk), and quiescent region (Quies). Chromatin states can be grouped in active transcription start site proximal promoter states (TssProxProm), active transcribed states (ActTrans), bivalent regulatory states (BivReg), and repressed Polycomb states (ReprPoly). The y-axis represents the odds ratio (OR) of the enrichment. For each regulatory element, the enrichment was computed against non eCpGs.
Tables
Table 1
Descriptive of the study population.
BiB: Born in Bradford study (UK). EDEN: Étude des Déterminants pré et postnatals du développement et de la santé de l’Enfant (France). KANC: Kaunus cohort (Lithuania). MoBa: Norwegian Mother, Father and Child Cohort Study (Norway). RHEA: Mother Child Cohort study (Greece). INMA: INfancia y Medio Ambiente cohort (Spain).
| Variable | BiB | EDEN | KANC | MoBa | RHEA | INMA | All |
|---|---|---|---|---|---|---|---|
| N (%) | 80 (9.7%) | 80 (9.7%) | 143 (17.4%) | 188 (22.9%) | 154 (18.7%) | 178 (21.6%) | 823 (100%) |
| Female (%) | 36 (45%) | 35 (43.8%) | 64 (44.8%) | 88 (46.8%) | 69 (44.8%) | 80 (44.9%) | 372 (45.2%) |
| Male (%) | 44 (55%) | 45 (56.2%) | 79 (55.2%) | 100 (53.2%) | 85 (55.2%) | 98 (55.1%) | 451 (54.8%) |
| Age, in years (IQR) | 6.65 (6.44–6.84) | 10.76 (10.37–11.22) | 6.40 (6.12–6.88) | 8.53 (8.17–8.83) | 6.45 (6.36–6.62) | 8.84 (8.44–9.21) | 8.06 (6.49–8.86) |
| Natural Killer cells (IQR) | 0.01 (0.00–0.03) | 0.02 (0.00–0.04) | 0.04 (0.01–0.07) | 0.02 (0.00–0.07) | 0.01 (0.00–0.03) | 0.03 (0.01–0.05) | 0.02 (0.00–0.05) |
| B-cell (IQR) | 0.12 (0.11–0.15) | 0.09 (0.07–0.11) | 0.11 (0.09–0.13) | 0.11 (0.09–0.14) | 0.14 (0.11–0.16) | 0.10 (0.08–0.13) | 0.11 (0.09–0.14) |
| CD4+ T cell (IQR) | 0.21 (0.18–0.25) | 0.16 (0.14–0.20) | 0.17 (0.14–0.21) | 0.21 (0.17–0.25) | 0.20 (0.16–0.26) | 0.17 (0.14–0.21) | 0.19 (0.15–0.23) |
| CD8+ T cell (IQR) | 0.13 (0.11–0.17) | 0.11 (0.08–0.13) | 0.13 (0.10–0.16) | 0.14 (0.11–0.17) | 0.14 (0.11–0.16) | 0.12 (0.09–0.14) | 0.13 (0.10–0.16) |
| Monocytes (IQR) | 0.09 (0.07–0.10) | 0.09 (0.07–0.11) | 0.08 (0.06–0.09) | 0.08 (0.07–0.10) | 0.09 (0.07–0.10) | 0.09 (0.07–0.11) | 0.08 (0.07–0.10) |
| Granulocytes (IQR) | 0.41 (0.35–0.47) | 0.52 (0.47–0.56) | 0.46 (0.40–0.53) | 0.41 (0.32–0.48) | 0.41 (0.34–0.48) | 0.48 (0.42–0.55) | 0.44 (0.37–0.52) |
-
Continuous variables are expressed as mean and interquartile range (IQR).
Table 2
Classification of eCpGs by type.
Percentages refer to the total number of eCpGs.
| Inverse (N, %) | Positive (N, %) | Bivalent (N, %) | Total (N, %) | |
|---|---|---|---|---|
| Mono | 8,084 (36.8%) | 5,681 (25.9%) | 0, by definition | 13,765 (62.7%) |
| Multi | 3,738 (17.0%) | 2,400 (10.9%) | 2,063 (9.4%) | 8,201 (37.3%) |
| Total | 11,822 (53.8%) | 8,081 (36.8%) | 2,063 (9.4%) | 21,966 (100%) |
Additional files
-
Supplementary file 1
Supplementary tables.
(A) Enrichment of eGenes for GO-BP terms. (B) Summary of GO-BP terms of all eGenes, eGenes of eQTMs measured with reliable CpG probes (ICC > 0.4), and eGenes under genetic control (with meQTLs/eQTLs). (C) Summary of autosomal cis eQTMs in adults' blood. (D) Correlation and concordance of effect sizes between eQTMs in HELIX and in GTP and MESA.
- https://cdn.elifesciences.org/articles/65310/elife-65310-supp1-v1.xlsx
-
Transparent reporting form
- https://cdn.elifesciences.org/articles/65310/elife-65310-transrepform1-v1.docx
-
Source code 1
Code used to run the analyses and generate the tables and figures.
- https://cdn.elifesciences.org/articles/65310/elife-65310-code1-v1.zip
Download links
A two-part list of links to download the article, or parts of the article, in various formats.
Downloads (link to download the article as PDF)
Open citations (links to open the citations from this article in various online reference manager services)
Cite this article (links to download the citations from this article in formats compatible with various reference manager tools)
Identification of autosomal cis expression quantitative trait methylation (cis eQTMs) in children’s blood
eLife 11:e65310.
https://doi.org/10.7554/eLife.65310


