Genetic and pharmacological evidence for kinetic competition between alternative poly(A) sites in yeast
- Development and Stem Cells Program, Monash Biomedicine Discovery Institute and Department of Biochemistry and Molecular Biology, Monash University, Australia
- Monash Bioinformatics Platform, Monash University, Australia
- Drug Delivery, Disposition and Dynamics, Monash Institute of Pharmaceutical Sciences, Monash University, Australia
- Monash Proteomics & Metabolomics Facility, Department of Biochemistry and Molecular Biology, Monash Biomedicine Discovery Institute, Monash University, Australia
- School of Life and Environmental Sciences, Deakin University, Australia
Figures
Figure 1
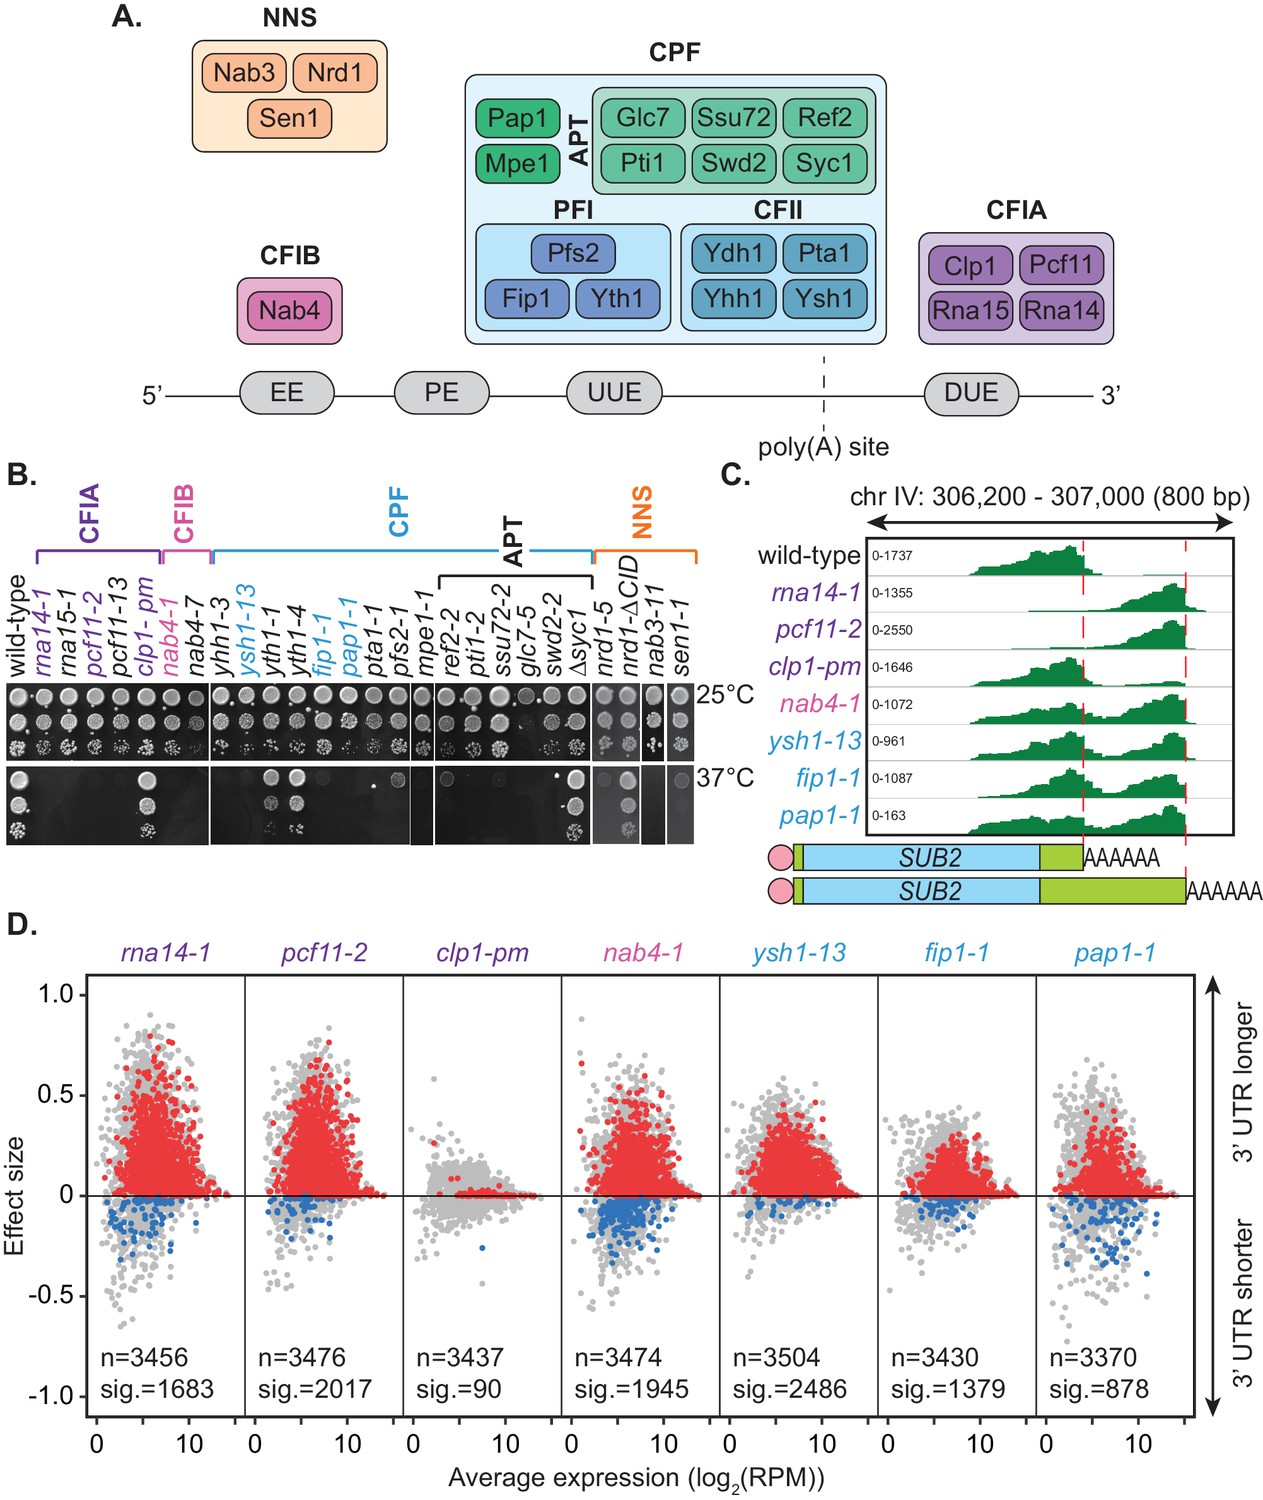
Mutation of the yeast cleavage and polyadenylation machinery subunits confer changes in cleavage site choice.
(A) Schematic of the yeast core cleavage and polyadenylation machinery and their interactions with the nascent mRNA strand. Cleavage and polyadenylation factor (CPF), Cleavage factor IA (CFIA) and Cleavage factor IB (CFIB) are involved in canonical 3’ end formation whereas the Nrd1-Nab3-Sen1 (NNS) complex represents an alternative cleavage pathway utilised by snRNAs, snoRNAs, CUTs and some mRNAs. (B) Yeast strains, as indicated, were serially diluted 10-fold onto YPAD rich media plates and grown at 25°C or 37°C for 2 days. (C) Integrative Genomics Viewer (IGV) (Robinson et al., 2011) representation of PAT-seq reads aligned to the 3’ end of the SUB2 gene. Indicated yeast strains were grown at 25°C until OD600 0.6 then switched to 37°C for 1 hr. Peaks indicate nucleotide depth of coverage by sequencing reads and data ranges for each sample are shown on the left. The ratio of these peaks is used to calculate 3’ end shifts. Schematic of 3’ UTR length for each peak is shown below. (D) Global 3’ end shift effects of genes observed in mutants of the indicated 3’ end processing factor subunits. Values are relative to the wild-type strain W303 at 37°C using PAT-seq data. Each dot corresponds to one gene. A positive effect size indicates a general lengthening of the 3’ UTR in the mutant relative to the wild-type, whereas a negative effect size indicates shifts towards shorter 3’ UTRs. Grey dots are the estimated effect size. Where this is significant, a corresponding dot shows the ‘confect’, a confident inner bound of this effect size (FDR < 0.05) found using the Limma and TopConfects R packages. Red indicates significant lengthening in the mutant whereas blue indicates significant shortening. The total number of detected genes (grey dots) and the number of significant shifts (red and blue dots) are indicated for each strain. Log2(RPM) is the logarithmic average number of reads per million. Data is representative of two biological replicates and is available in the Figure 1—source data 1.
-
Figure 1—source data 1
3’end processing mutant allele PAT-seq end shift values.
The full list of genes undergoing APA in the 3’end processing mutant allele PAT-assay experiment and their effect size and confect values.
- https://cdn.elifesciences.org/articles/65331/elife-65331-fig1-data1-v1.xlsx
Figure 2
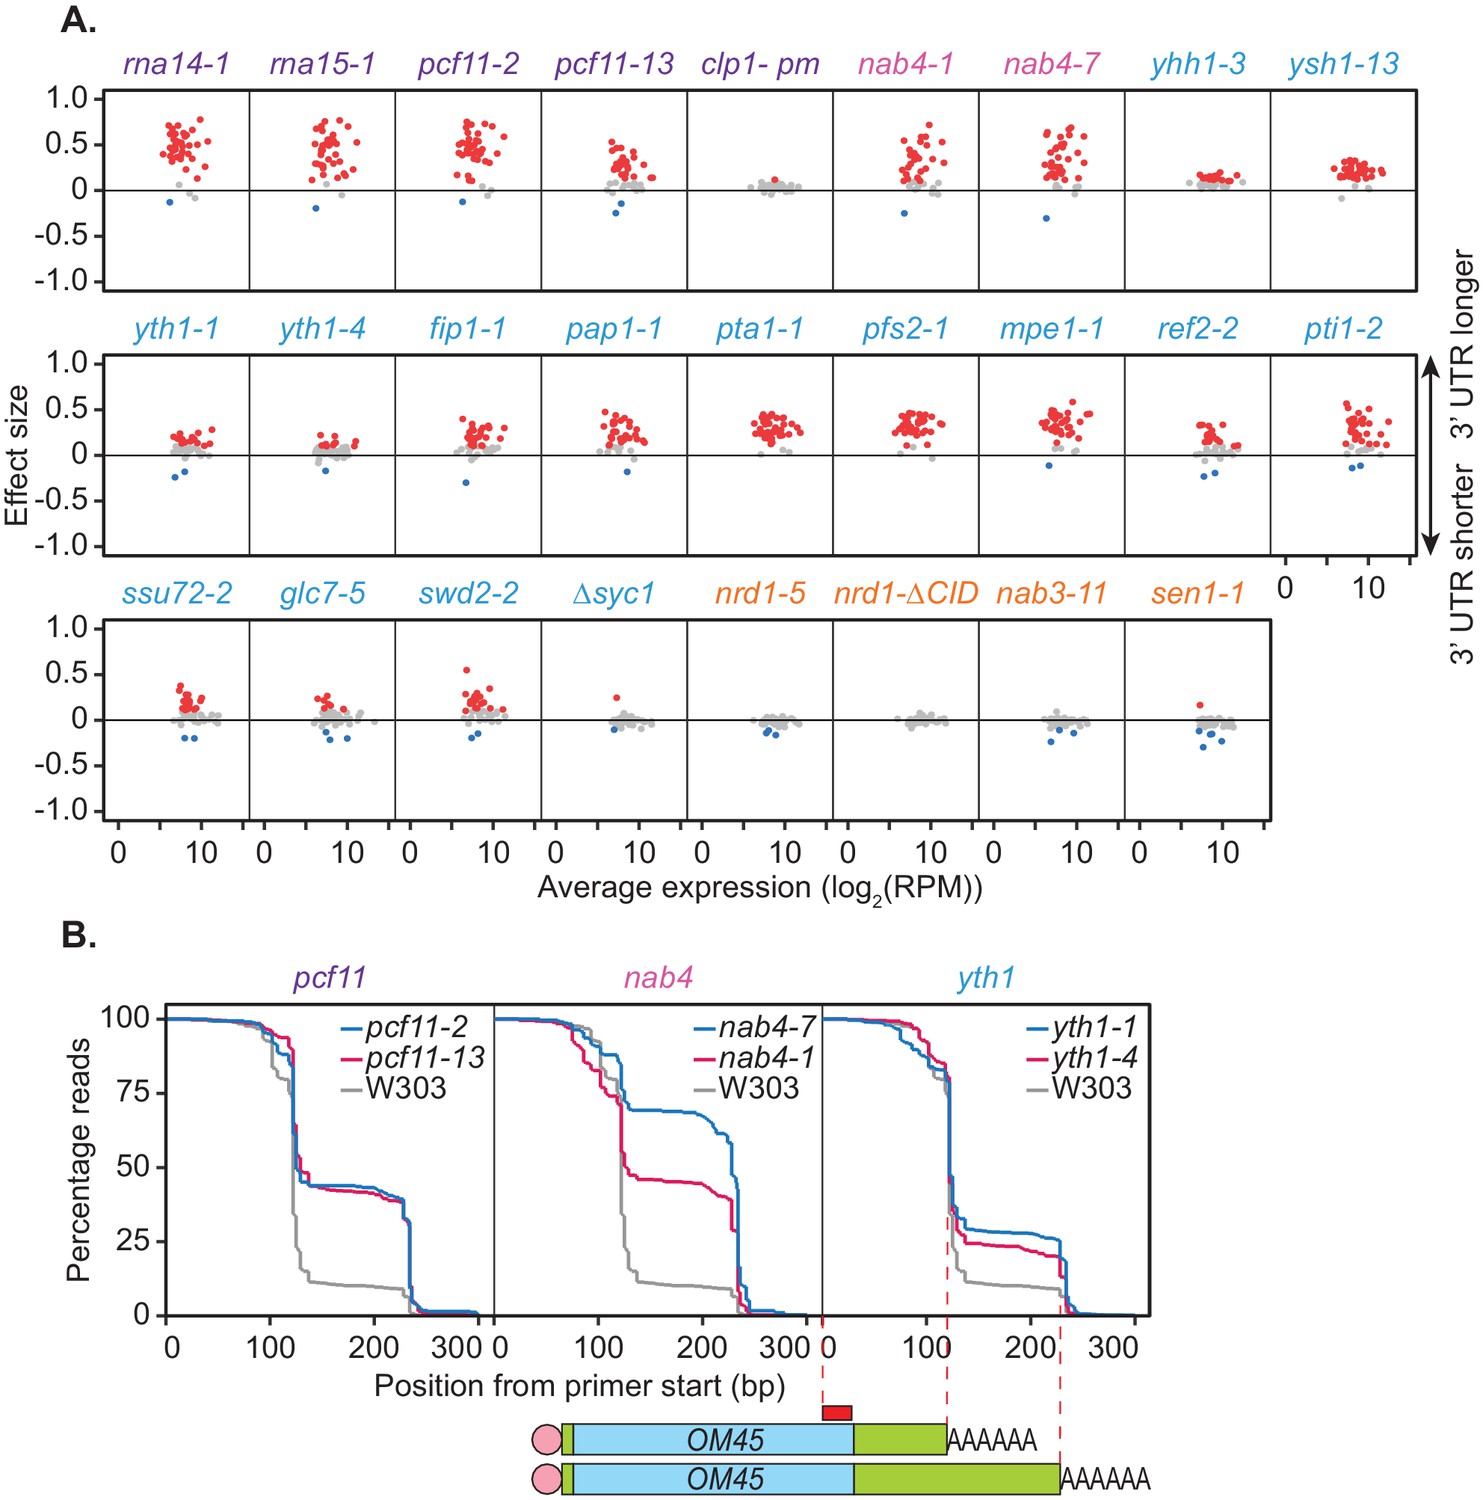
Mutations within the yeast cleavage and polyadenylation machinery subunits promote lengthening of mRNA 3’ UTRs.
(A) 3’ end shift effects of genes observed upon mutation of the 3’ end processing factor subunits. Values are relative to the wild-type strain W303 at 37°C using mPAT data. Each dot corresponds to a one gene as above. Grey dots indicate an effect size between −0.1 and 0.1, red dots indicate an effect size greater than 0.1 and blue dots indicate an effect size less than −0.1. Data is representative of two biological replicates. (B) Comparison of 3’ end shifting in different alleles of the same 3’ end processing factor. Reverse cumulative distribution plots show raw templated nucleotide length of reads aligned to the gene OM45 from mPAT data, starting from the forward primer position as illustrated (red box) in the schematic. Mutant alleles for a single cleavage factor are shown within the same plot in comparison to the wild-type strain W303.
Figure 3
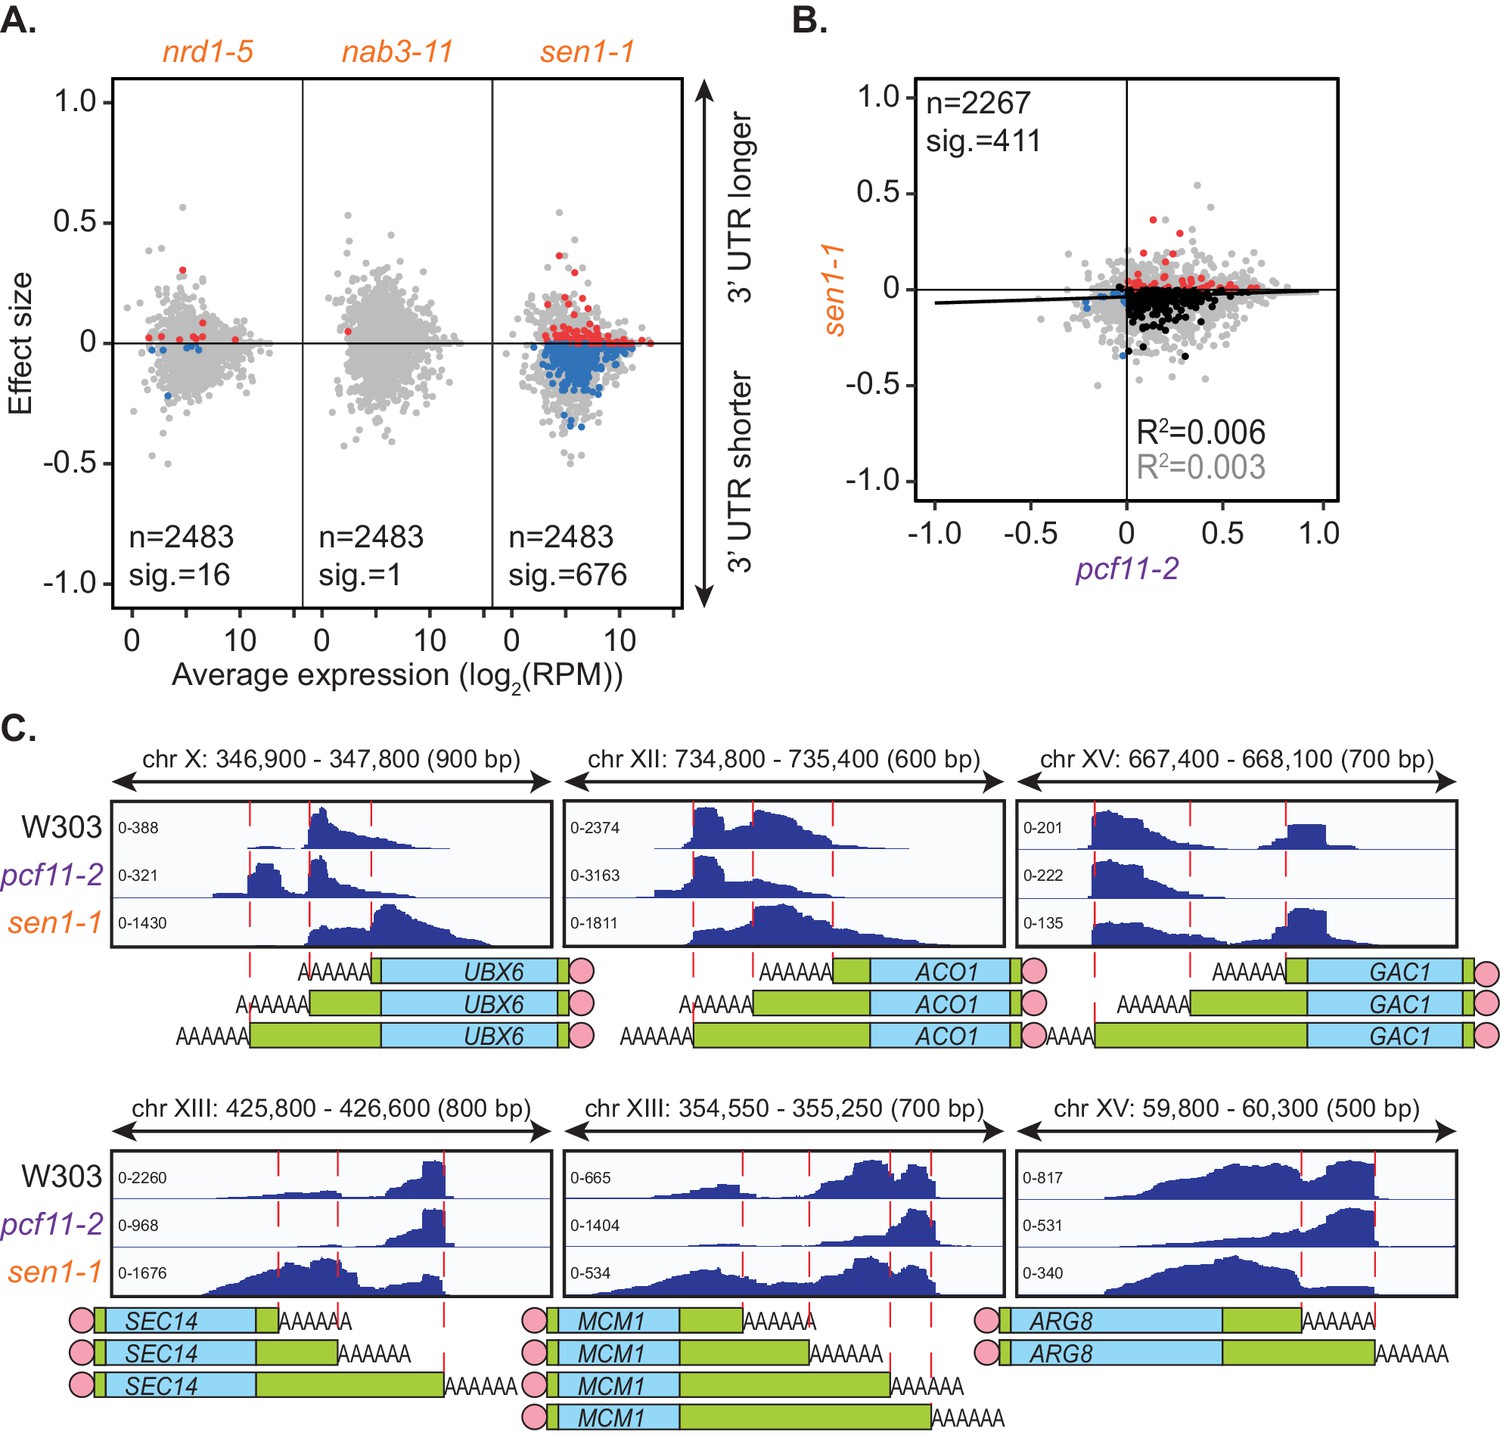
Sen1 mutation promotes 3’ UTR shortening.
(A) 3’ end shift effects of genes observed upon mutation of the NNS subunits. Values are relative to the wild-type strain W303 at 37°C using PAT-seq data as in Figure 1D. Data is representative of two biological replicates and is available in the Figure 3—source data 1. (B) Comparison of 3’ end shift effects of genes upon mutation of PCF11 (x-axis) and SEN1 (y-axis). pcf11-2 and sen1-1 shifts relative to their respective wild-type control at 37°C were compared. Grey dots indicate the estimated shift effects for all analysed features in common (n = 2267), black, red and blue dots indicate the significant shifts (n = 411, FDR < 0.05). Red indicates significant lengthening, blue indicates significant shortening and black indicates APA in opposite directions in both mutants. Lines show the linear regression for effect (grey) and confect (black) values respectively. (C) IGV representation of PAT-seq results aligned to the 3’ end of the indicated genes in W303, pcf11-2, and sen1-1 yeast strains at 37°C. Peaks indicate nucleotide depth of coverage by sequencing reads and data ranges for each sample are shown on the left. Schematic of 3’ UTR length for each peak is shown below.
-
Figure 3—source data 1
NNS mutant allele PAT-seq end shift values.
The full list of genes undergoing APA in the NNS subunit mutant allele PAT-assay experiment and their effect size and confect values.
- https://cdn.elifesciences.org/articles/65331/elife-65331-fig3-data1-v1.xlsx
Figure 4 with 2 supplements
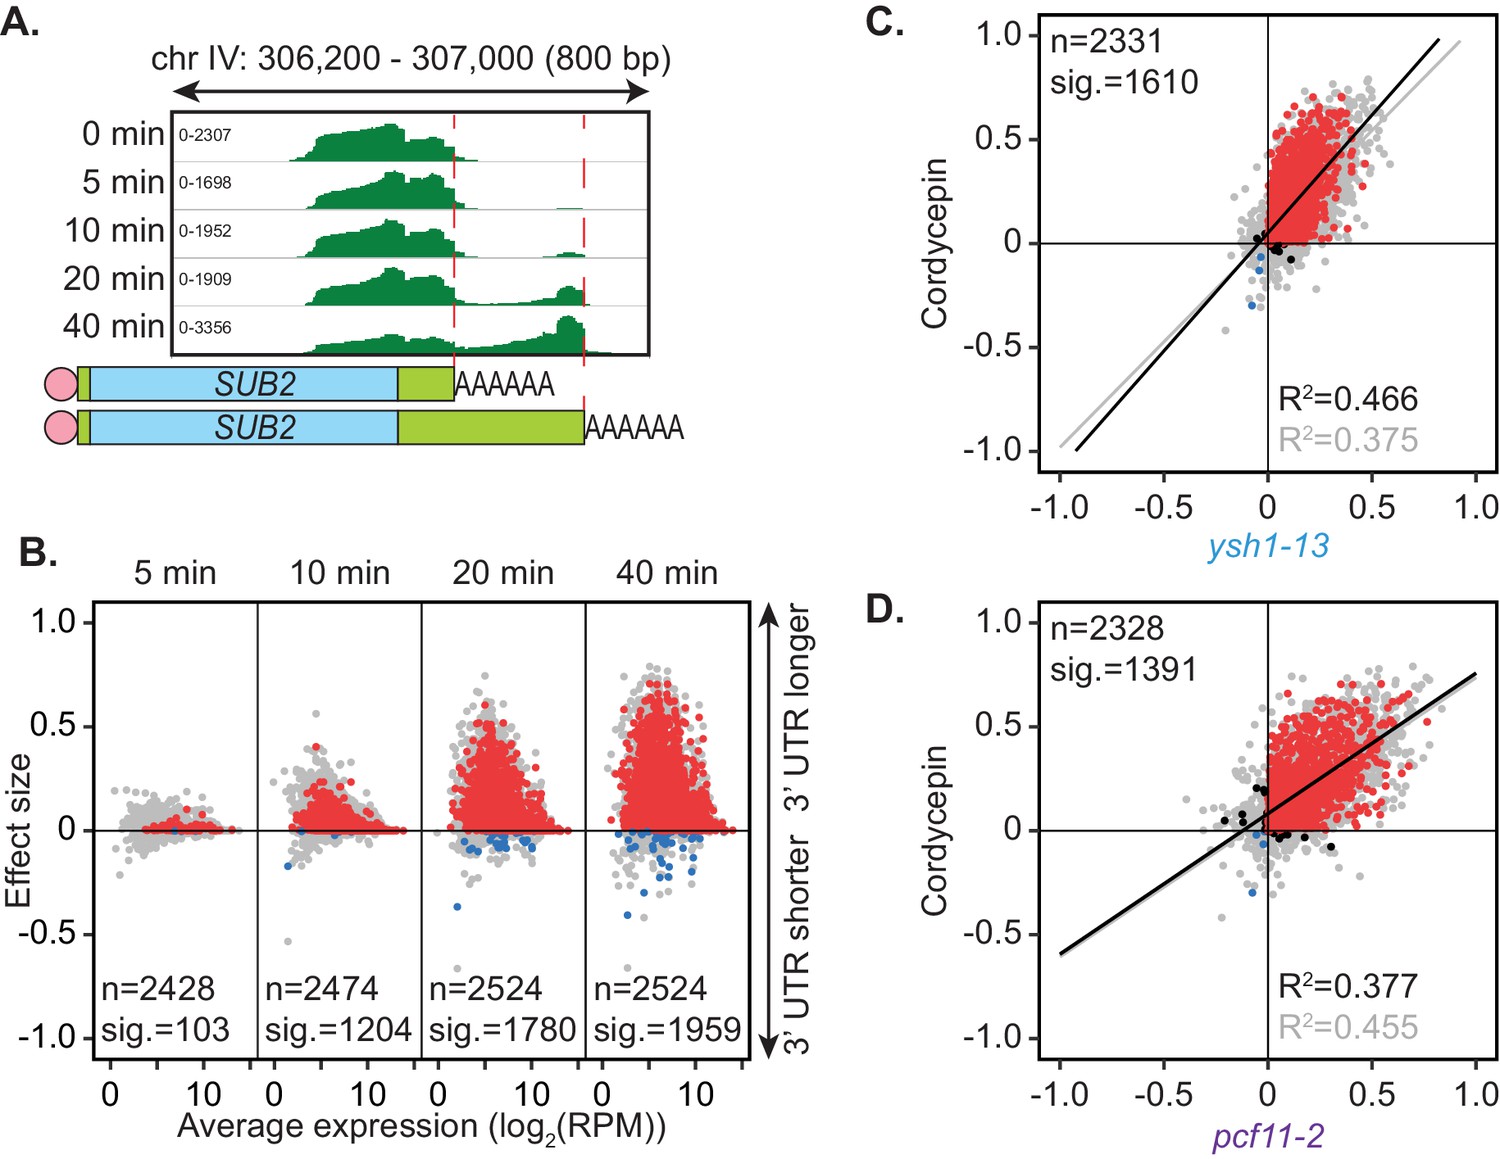
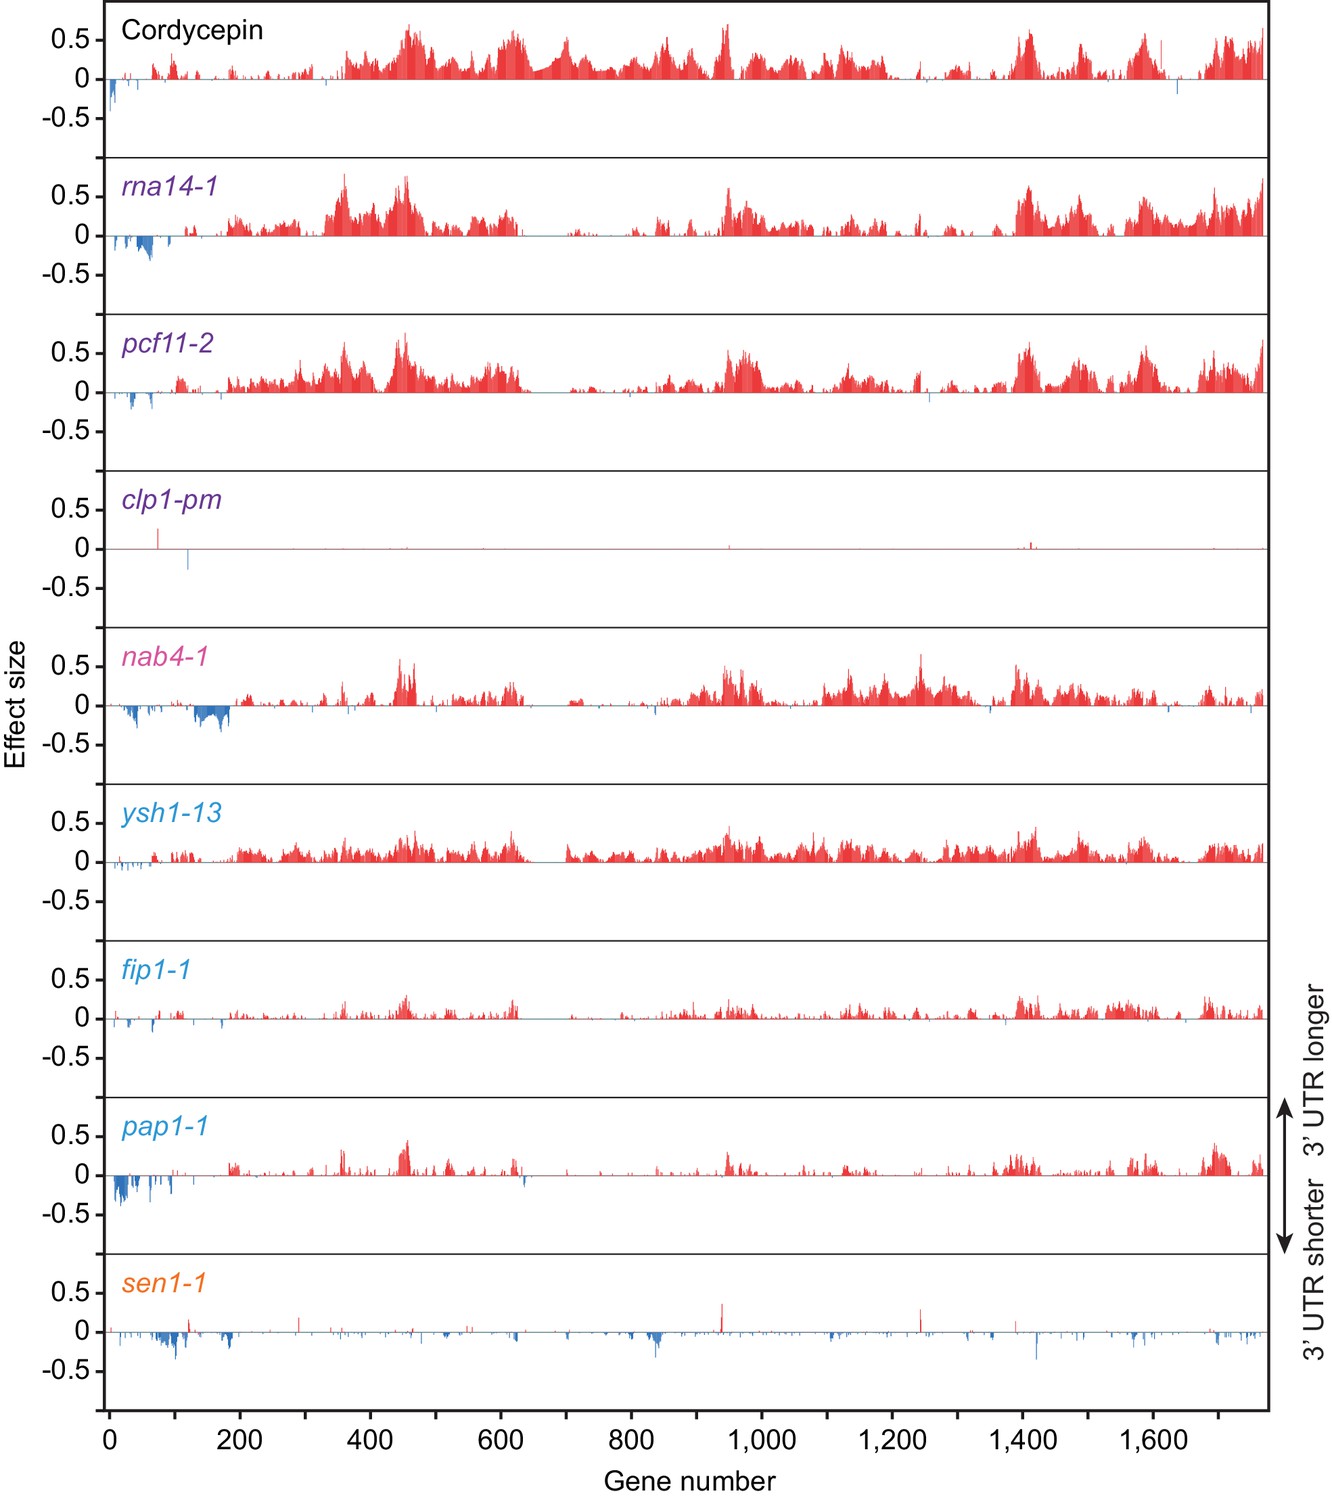
Cordycepin induces lengthening of 3’ UTRs in yeast cells.
BY4741 cells were treated with 20 µg/ml cordycepin for 0, 5, 10, 20, or 40 min and changes to 3’ UTR length were observed. (A) IGV representation of PAT-seq reads aligned to the 3’ end of the SUB2 gene. Peaks indicate nucleotide depth of coverage by sequencing reads and data ranges for each sample are shown on the left. Schematic of 3’ UTR length for each peak is shown below. (B) 3’ end shift effects of genes observed upon cordycepin treatment. Values are relative to untreated cells using PAT-seq data as for Figure 1D with positive values indicating lengthening following drug treatment. Data is representative of two biological replicates and is available in the Figure 4—source data 1. (C) Comparison of 3’ end shift effects of genes upon mutation of YSH1 (x-axis) and after cordycepin treatment (y-axis). ysh1-13 shifts were compared to W303 at 37°C and cordycepin treatment for 40 min was compared to untreated BY4741 cells at 30°C. Grey dots indicate the estimated shift effects for all analysed features in common (n = 2331), black, red, and blue dots indicate the significant shifts (n = 1610; FDR < 0.05). Red indicates significant lengthening, blue indicates significant shortening and black indicates APA in opposite directions for both the mutant and cordycepin treated cells. Lines show the linear regression for effect (grey) and confect (black) values, respectively. (D) Comparison of 3’ end shift effects of genes upon mutation of PCF11 (x-axis) and after cordycepin treatment (y-axis) as for C but with pcf11-2 shifts compared to W303 at 37°C. The total number of analysed features in common was 2328 and the number of significant shifts was 1391 (FDR < 0.05).
-
Figure 4—source data 1
Cordycepin treatment PAT-seq end shift values.
The full list of genes undergoing APA in the cordycepin treatment PAT-assay experiment and their effect size and confect values.
- https://cdn.elifesciences.org/articles/65331/elife-65331-fig4-data1-v1.xlsx
-
Figure 4—source data 2
Cordycepin proteomics data.
The full list of proteins found using DIA mass spectrometry on untreated cells and cells treated with cordycepin for 40 min. Proteins with fold changes that have significant q-values are indicated.
- https://cdn.elifesciences.org/articles/65331/elife-65331-fig4-data2-v1.xlsx
Figure 4—figure supplement 1
Cordycepin treatment and 3’ end processing factor mutant alleles promote alternative polyadenylation in subsets of genes.
Comparison of alternative polyadenylation in different genes following 20 µg/ml cordycepin treatment for 40 min or mutation of the cleavage and polyadenylation machinery. Bars correspond to 3’ end shift scores relative to untreated BY4741 cells for the cordycepin samples and relative to W303 cells at 37°C for the mutant strains. Genes with greater than absolute 0.1 end shift confect scores for at least one condition were included (1761 genes) and numbered in arbitrary order. Red lines indicate lengthening of the 3’ UTR following cordycepin treatment or in the mutants whereas blue lines indicate shortening. Data is representative of two biological replicates.
Figure 4—figure supplement 2
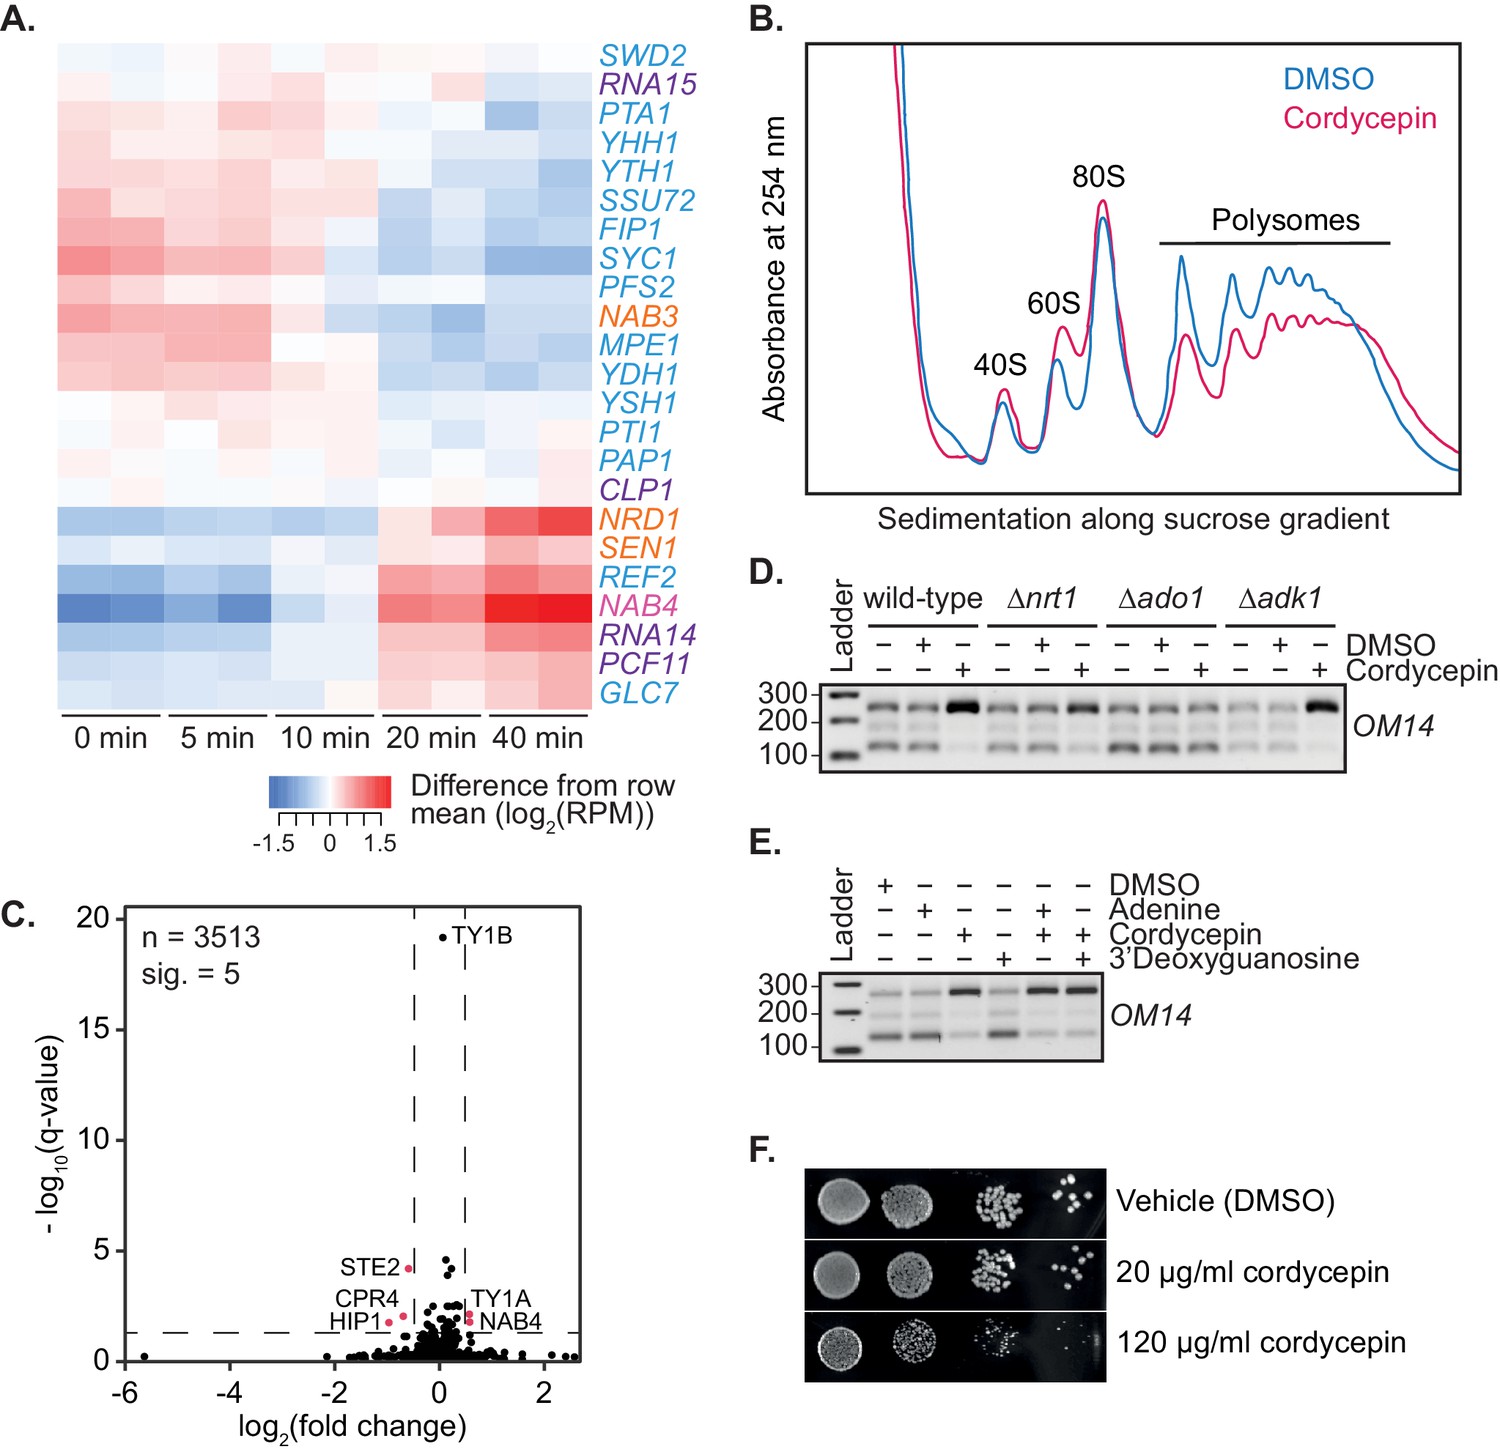
Cordycepin treatment alters cleavage factor RNA expression and cellular translation.
(A) Heatmap showing changes in RNA expression of the 3’ end processing machinery subunits following cordycepin treatment. BY4741 cells were treated with 20 µg/ml cordycepin for 0, 5, 10, 20, or 40 min. Red shows an increase in expression whereas blue indicates a decrease in expression at the indicated timepoints relative to the mean log2 reads per million expression for that gene. (B) Polysome profile of BY4741 cells treatment with DMSO (control) or 20 µg/ml cordycepin for 40 min. Cell lysate was added to a sucrose density gradient column and ultracentrifuged prior to fractionation at 254 nm. (C) Protein fold change volcano plot for cells treated with DMSO (control) or 20 µg/ml cordycepin for 40 min. Black dots indicate all proteins identified via proteomics analysis with values above the dashed horizontal line (indicating a q-value less than 0.05) considered significant. Pink dots indicate genes with a q-value less than 0.05 and a fold change greater than 40%. Data is representative of five biological replicates and is available in the Figure 4—source data 2. (D) TVN-PAT analysis of the gene OM14 for the indicated yeast strains treated with DMSO (control) or 20 µg/ml cordycepin for 40 min. Samples were run relative to a 100 bp ladder. Bands from top to bottom correspond to the distal, middle, and proximal OM14 APA forms. (E) TVN-PAT analysis of the gene OM14 for BY4741 cells treated with DMSO (control) or 20 µg/ml adenine, cordycepin and the guanosine equivalent 3’ deoxyguanosine for 40 min. Samples were run as for D. (F) BY4741 treated with DMSO or cordycepin as indicated were serially diluted 10-fold onto SC media plates and grown at 30°C for two days.
Figure 5 with 1 supplement
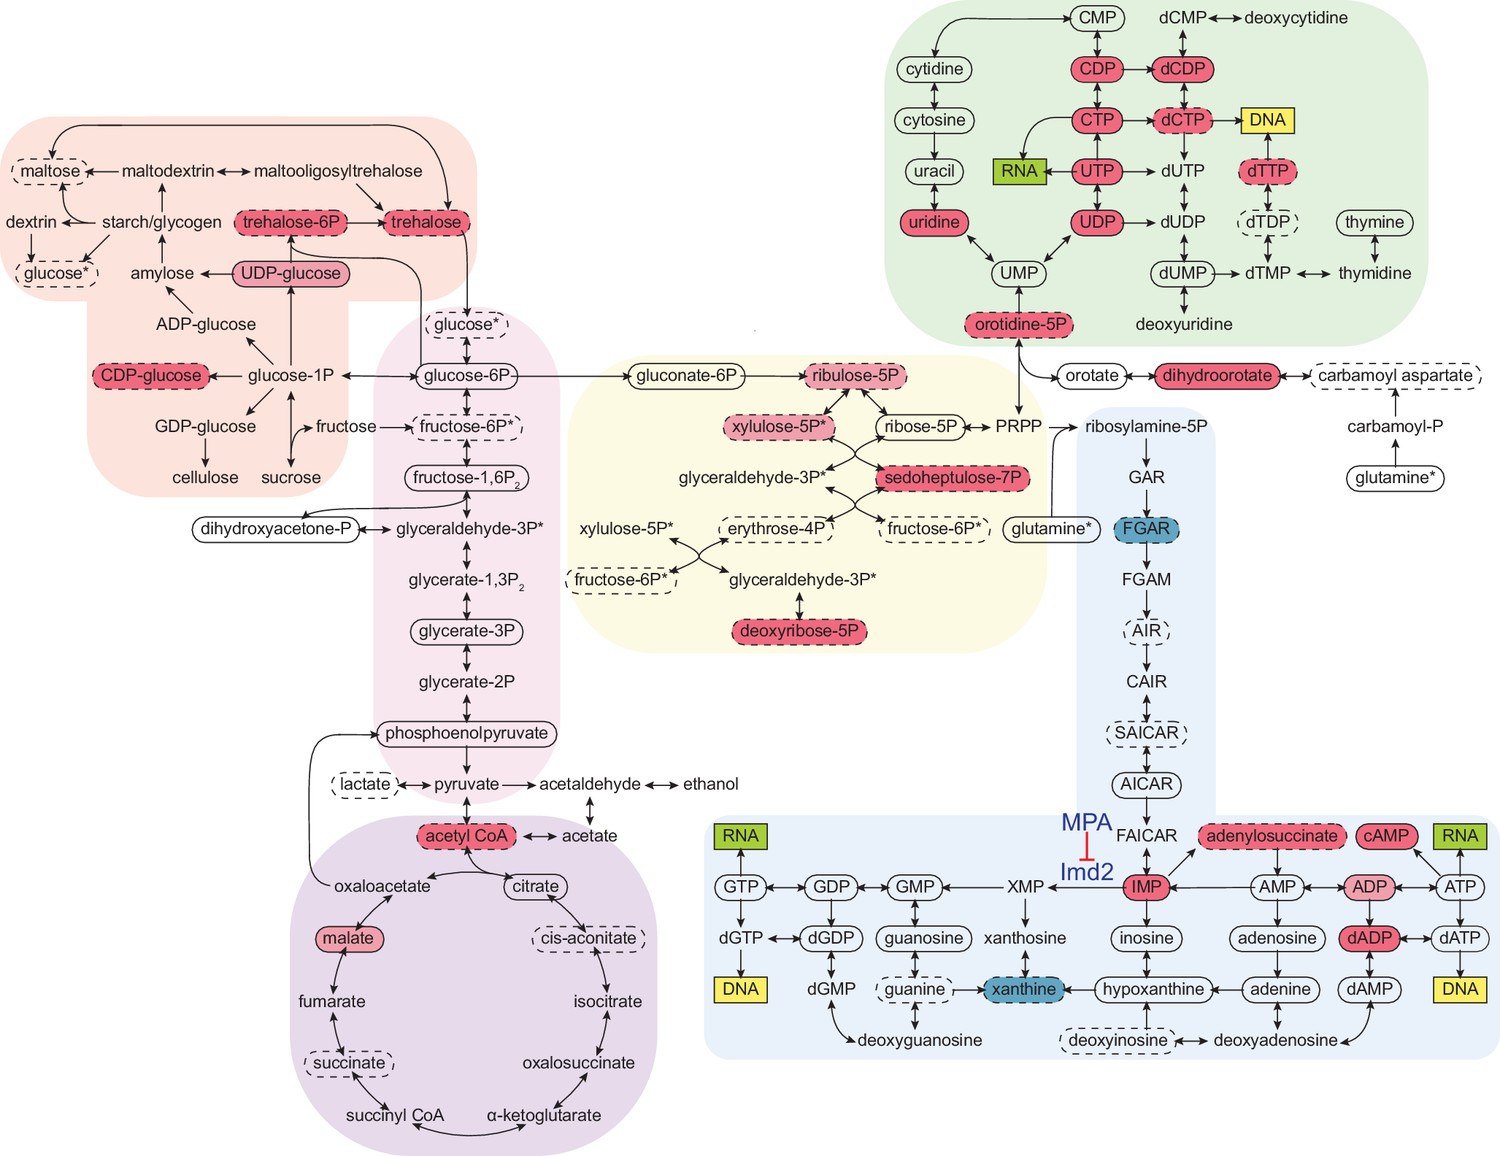
Cordycepin alters yeast core metabolism to promote nucleotide biosynthesis.
Yeast metabolomics pathway map showing metabolite fold changes following 40 min treatment with 20 µg/ml cordycepin. Solid circles indicate detected confirmed metabolites and dashed circles detected putative metabolites. Coloured circles show metabolites with significant fold change after cordycepin treatment with red indicating an increase in abundance and blue a decrease in abundance. Darker colour is used for metabolites with greater than 50% fold change. Pathways are based on the KEGG database and include starch and sucrose metabolism (orange), glycolysis/gluconeogenesis (pink), citrate cycle (TCA cycle) (purple), pentose phosphate pathway (yellow), pyrimidine metabolism (green), and purine metabolism (blue). Asterix (*) indicates metabolites that appear multiple times on the map. The pharmacological inhibition of Imd2 by mycophenolic acid (MPA) is indicated. Data is representative of six biological replicates and is available in the Figure 5—source data 1.
-
Figure 5—source data 1
Cordycepin metabolomics data.
IDEOM metabolite list and metadata from HILIC metabolomics study for untreated cells and cells treated with cordycepin for 40 min.
- https://cdn.elifesciences.org/articles/65331/elife-65331-fig5-data1-v1.xlsx
Figure 5—figure supplement 1
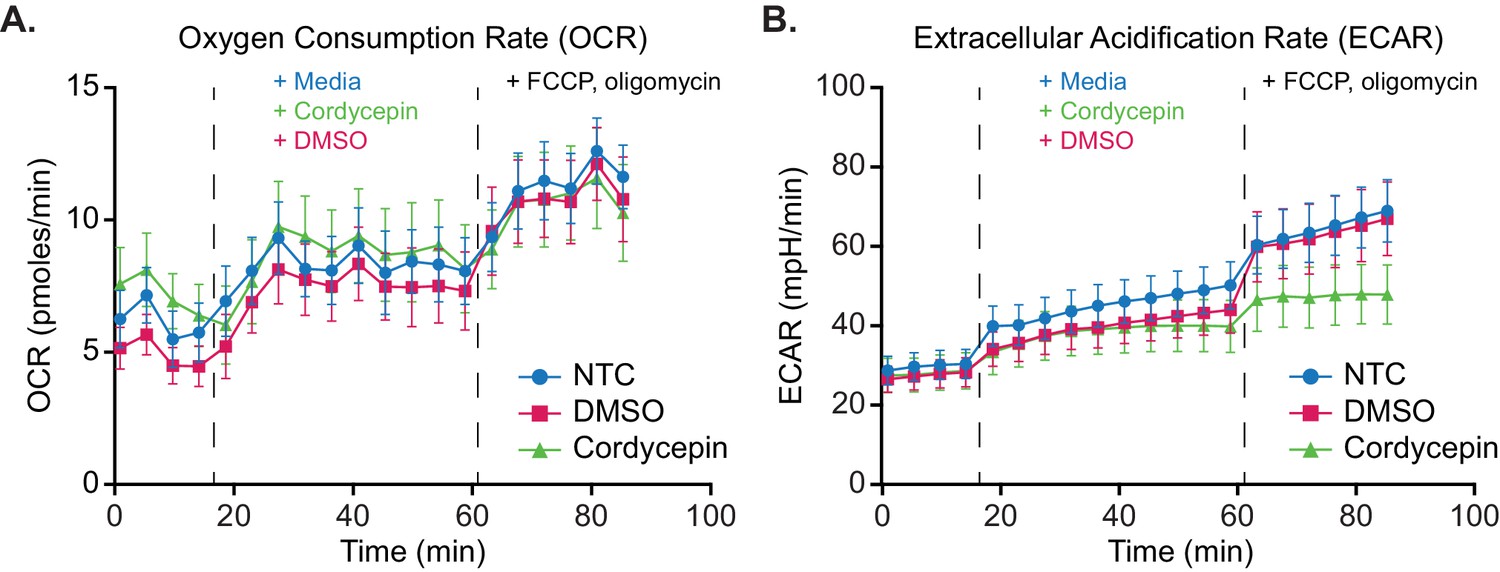
Glycolytic output increase following mitochondrial stress is suppressed upon cordycepin treatment.
Seahorse metabolic flux assay mitochondrial stress analysis of cordycepin treatment. (A) Oxygen Consumption Rate (OCR) and (B) Extracellular Acidification Rate (ECAR) were measured to assess the rate of mitochondrial respiration and glycolysis respectively. BY4741 cell basal activity was measured for four cycles, prior to treatment with 20 µg/ml cordycepin, DMSO (control) or media (control) for 10 cycles and uncoupling of mitochondrial function via FCCP and oligomycin addition for six cycles. Data is representative of three independent experimental repeats consisting of 12 wells per condition in each. Data is representative of three independent repeats.
Figure 6
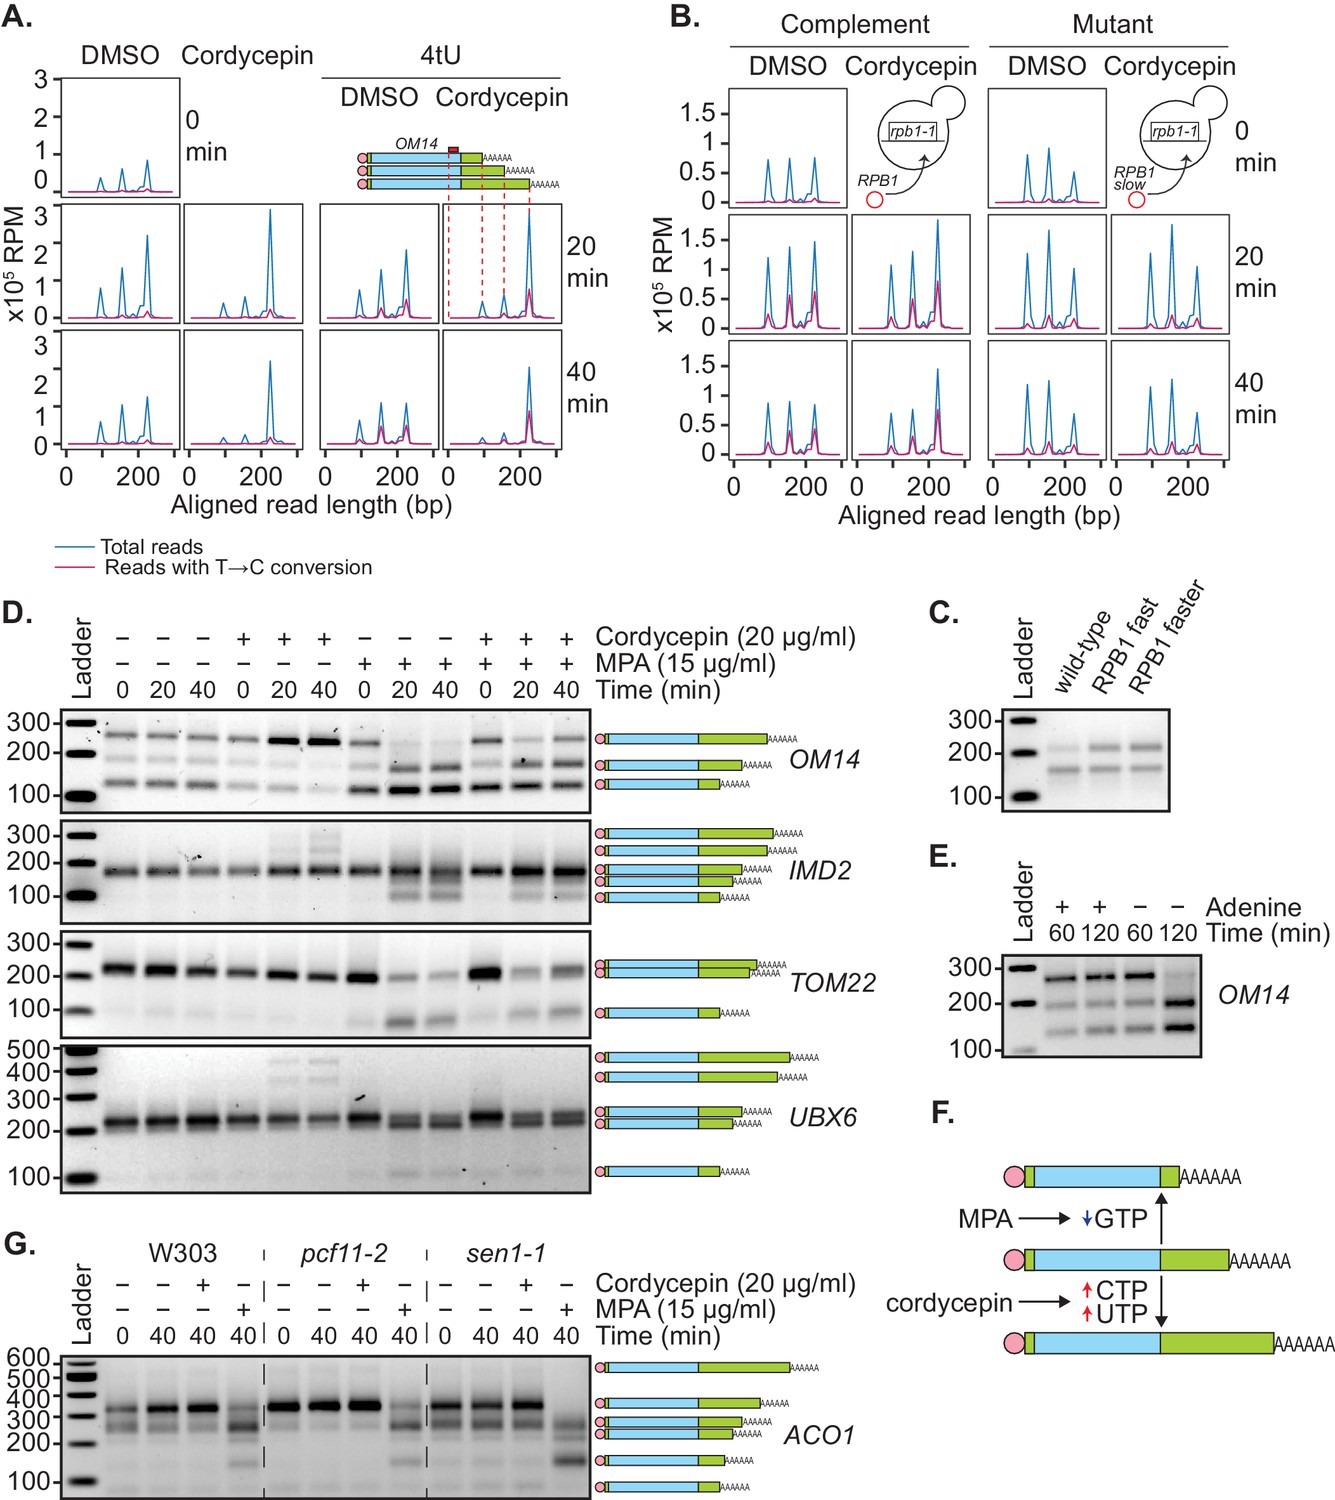
Genetic or pharmacological slowing of transcription attenuates cordycepin’s effect on alternative polyadenylation.
(A and B) Yeast cells treated with 20 µg/ml cordycepin or DMSO (control) and 4tU labelled for 20 or 40 min. mRNA was then analysed using the mPAT approach. Reads with T to C conversions represent transcripts synthesised during the 4tU labelling and thus newly produced mRNA. The 3’ ends of reads aligned to the gene OM14, with the forward primer at 0, are shown in x105 reads per million. This was done for A. Wild-type BY4741 cells and B. rpb1-1 mutant cells complemented with RPB1 or an rpb1 slow mutation. Data is representative of two biological replicates. (C) TVN-PAT analysis of the gene OPI3 for cells containing wild-type, L1101S ‘fast’ or E1103G ‘faster’ Rpb1. Samples were run relative to a 100 bp ladder. Bands correspond to the different APA isoforms of the gene with slower migrating bands indicating a more distal cleavage site and faster bands a more proximal cleavage. (D) TVN-PAT analysis of the genes OM14, IMD2, TOM22, and UBX6 for yeast cells treated with 20 µg/ml cordycepin and 15 µg/ml MPA for 20 or 40 min. (E) TVN-PAT analysis of the gene OM14 for wild-type W303 cells (adenine auxotroph) grown with or without adenine hemisulphate (100 µg/ml) for 60 or 120 min. (F) Schematic illustration of the pharmacological induction of APA. MPA treatment decreases GTP availability resulting in shorter 3’UTRs, whereas cordycepin treatment increases CTP and UTP concentrations and promotes 3’UTR lengthening. (G) TVN-PAT analysis of the gene ACO1 for wild-type W303 and temperature-sensitive mutants pcf11-2 and sen1-1. Cells were grown at 25°C then switched to the semi-restrictive temperature 30°C and treated with 20 µg/ml cordycepin or 15 µg/ml MPA for 40 min.
Figure 7
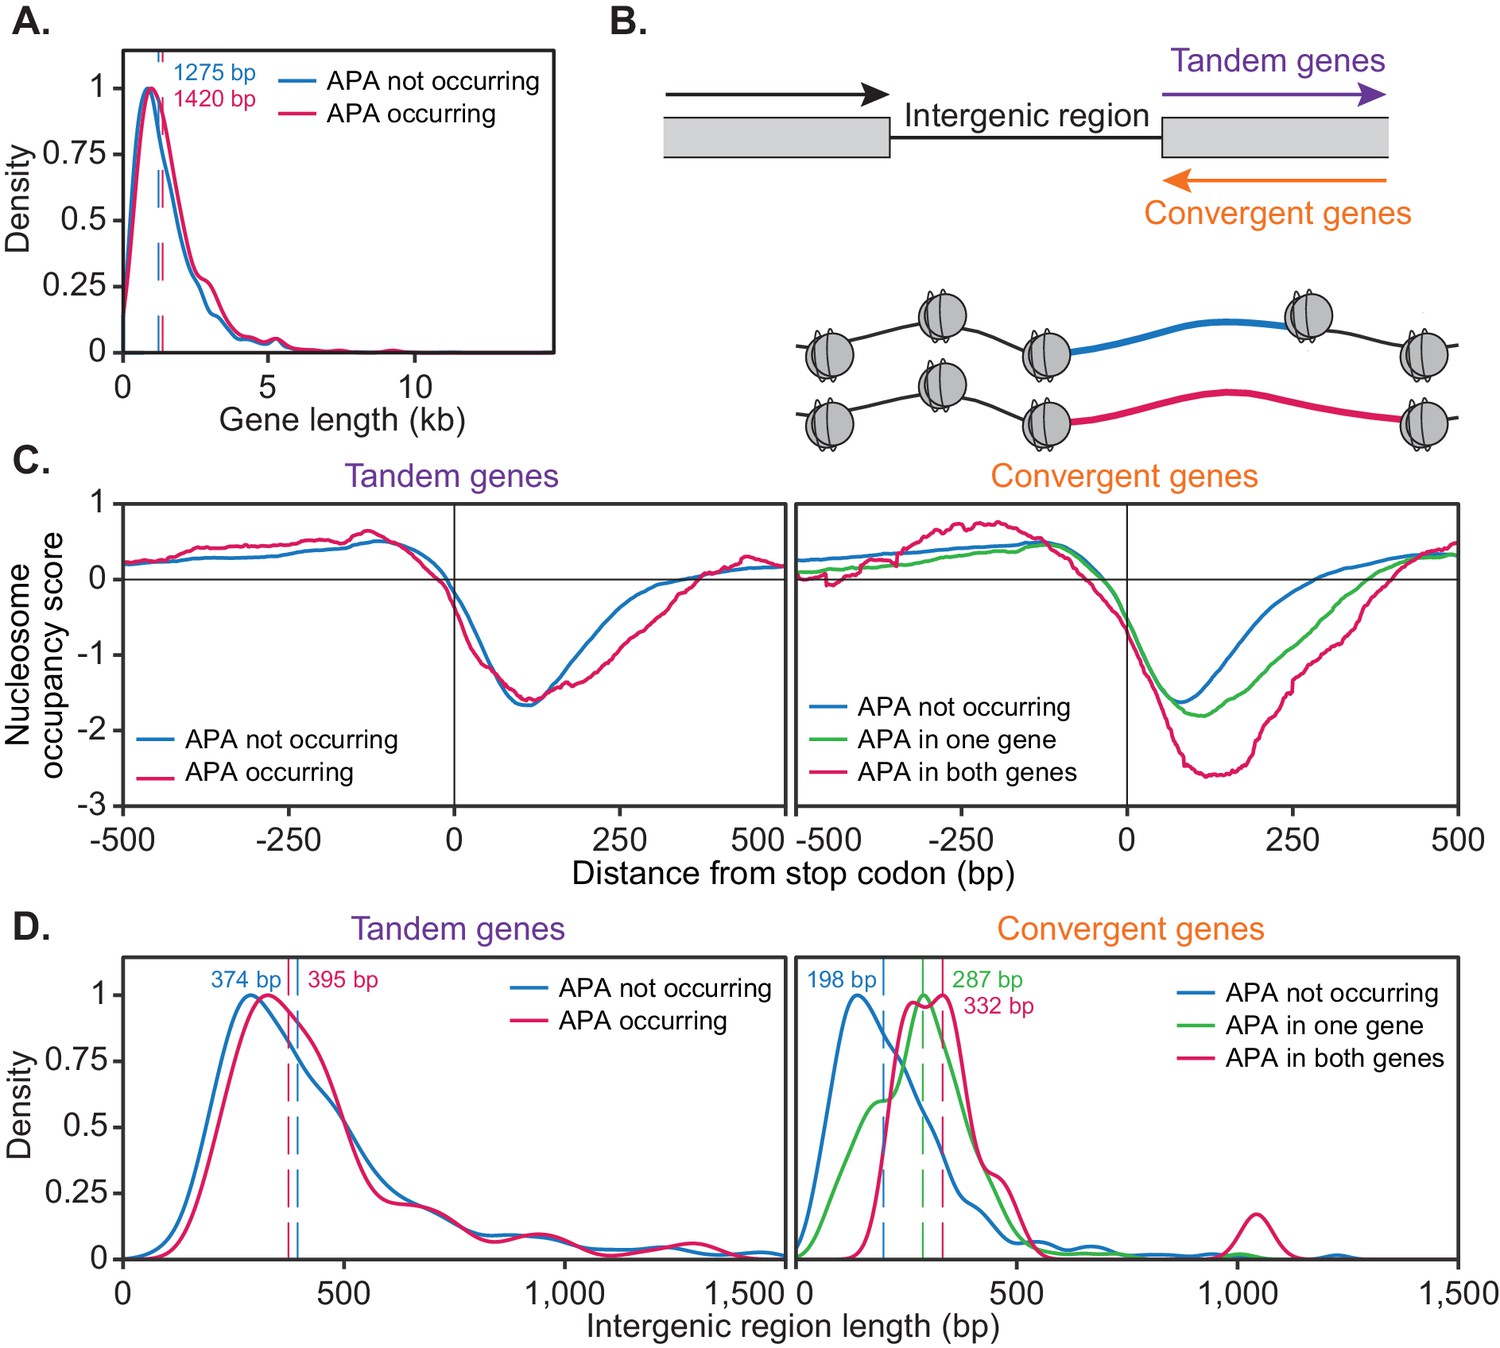
The ability of a gene to undergo alternative polyadenylation is dependent on the local nucleosome landscape.
Comparison of native genetic features in genes split based on APA following cordycepin treatment. APA was considered to occur if the major cleavage site (greater than 40% of reads) shifted to another site following 20 µg/ml cordycepin treatment for 40 min and to not occur if the major cleavage site remains the same. Genes used in each comparison are included in the Figure 7—source data 1. (A) Scaled density plot comparing gene length (in kilobase pairs) for genes in which APA occurs (pink, n = 378) and does not occur (blue, n = 4302). Dashed lines and coloured values indicate the median gene length. T-test p-value=0.031. (B) Schematic of the two types of 3’ end intergenic regions. The downstream gene can either be transcribed in the same direction as the upstream gene (tandem genes) or the opposite direction (convergent genes), in which case two genes will be assigned the same 3’ end intergenic region. (C) Normalised nucleosome occupancy per base pair around the translation end site, averaged across all yeast genes, derived from Kaplan et al., 2009. For tandem genes, APA occurred in 128 genes (pink) and did not occur in 1719 genes (blue). T-test p-value=0.055. For convergent genes, APA occurred in both genes for 15 gene pairs (pink), in one gene for 155 pairs (green) and in neither gene for 746 pairs (blue). ANOVA p-value<0.001. Nucleosome occupancy values above zero indicate nucleosome enrichment compared to the genome-wide average. (D) Scaled density plot comparing 3’ end intergenic region length (in base pairs) based on APA up to 1500 bp. Dashed lines and coloured values indicate the median intergenic region length. Tandem gene t-test p-value=0.646, convergent gene ANOVA p-value<0.001.
-
Figure 7—source data 1
Genes undergoing APA following cordycepin treatment.
Gene lists for cordycepin responsive and tandem/convergent genes used for gene length, intergenic region and nucleosome occupancy analyses. Methods. Yeast Strains and Primers.
- https://cdn.elifesciences.org/articles/65331/elife-65331-fig7-data1-v1.xlsx
Figure 8
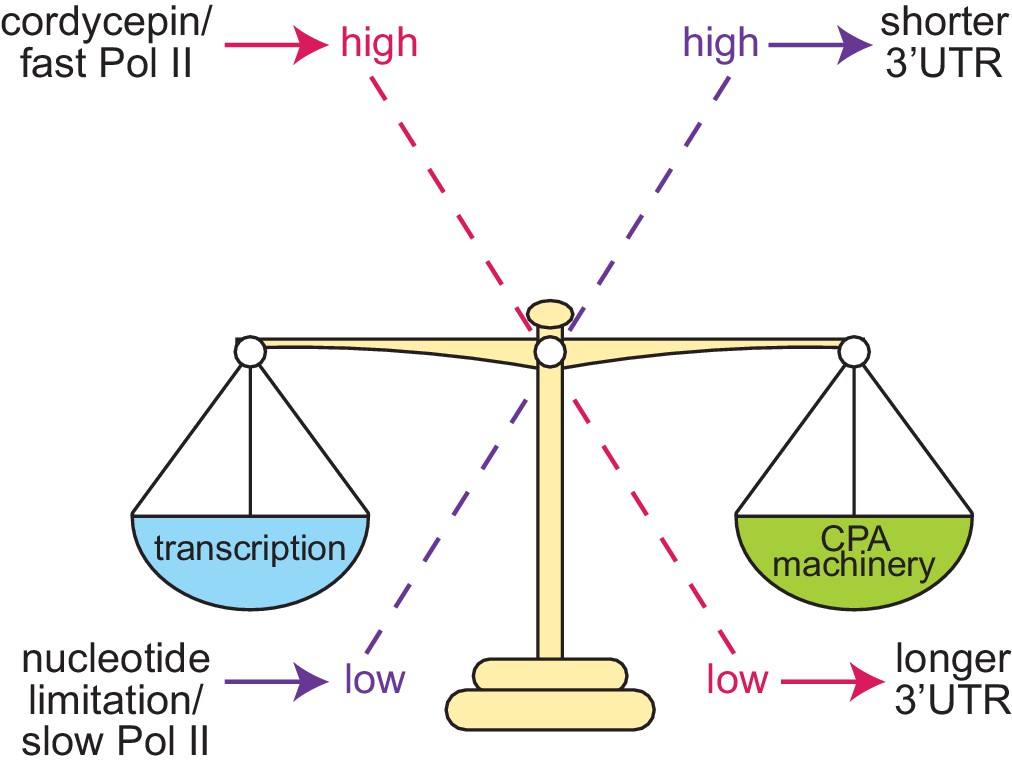
Proposed model of cleavage site selection in yeast.
Schematic of cleavage site selection in yeast. We propose a kinetic model where balance exists between nucleotide levels, transcriptional rate, and the concentration of the cleavage and polyadenylation machinery. Tipping this scale by alteration of nucleotide concentration or mutation of cleavage factors and RNA polymerase II causes changes to cleavage site choice.
Tables
Table 1
Yeast Strains.
| Strain | Genotype | Relevant mutation if known | Reference |
|---|---|---|---|
| W303 | MATa leu2-3,112 his3-11,15 trp1-1 can1-100 ade2-1 ura3-1 | Wild type | Thomas and Rothstein, 1989 |
| BY4741 | MATa leu2∆0 his3∆1 ura3∆0 met15∆0 | Wild type | Brachmann et al., 1998 |
| rna14-1 | MATa leu2-3,112 his3-11,15 trp1-1 ade2-1 ura3-1 rna14-1 | T nucleotide insertion at 1986 causing a premature stop codon (replacement of last 16 amino acids with FK) | Bloch et al., 1978 (named cor1-1); Minvielle-Sebastia et al., 1994, Rouillard et al., 2000 |
| rna15-1 | MATa leu2-3,112 his3-11,15 trp1-1 ade2-1 ura3-1 rna15-1 | L214P | Bloch et al., 1978 (named cor2-1); Minvielle-Sebastia et al., 1994, Qu et al., 2007 |
| pcf11-2 | MATa leu2-3,112 his3-11,15 trp1∆ can1-100 ade2-1 ura3-1 pcf11-2 | E232G, D280G, C424R, S538G, F562S, S579P | Amrani et al., 1997, Sadowski et al., 2003 |
| pcf11-13 | MATa leu2-3,112 his3-11,15 trp1∆ can1-100 ade2-1 ura3-1 pcf11-13 | D68A, S69A, I70A (CID region) | Sadowski et al., 2003 |
| clp1-pm | MATa leu2-3,112 his3-11,15 trp1-1 can1-100 ade2-1 ura3-1 clp1-pm | K136A, T137A (P-loop motif) | Ramirez et al., 2008 |
| nab4-1 | MATa ura3-52 nab4-1 | N167D, F179Y, P194H, Q265L | Minvielle-Sebastia et al., 1998 |
| nab4-7 | MATa ura3-52 nab4-7 | S64R, K92M, T125A, I163T | Minvielle-Sebastia et al., 1998 |
| yhh1-3 | MATa leu2-3,112 his3-11,15 trp1-1 can1-100 ade2-1 ura3-1 yhh1-3 | L302P, N716S, N762S, Y766C, K933R, D1070E, N1136D | Dichtl et al., 2002b |
| ysh1-13 | MATa leu2-3,112 his3-11,15 trp1∆ ade2-1 ura3-1 TRP1::ysh1 [ysh1-3-HIS3-CEN] | V235A, N685H, D695V, E723V, R763G | Garas et al., 2008 |
| yth1-1 | MATa leu2-3,112 his3-11,15 trp1∆ ade2-1 ura3-1 yth1::TRP1 [CEN4-ADE2-yth1-1] | frameshift at 154 in causing a premature stop codon (deletion of last 55 amino acids) | Barabino et al., 1997 |
| yth1-4 | MATa leu2-3,112 his3-11,15 trp1∆ ade2-1 ura3-1 yth1::TRP1 [CEN4-ADE2 -yth1-4] | W70A | Barabino et al., 2000 |
| fip1-1 | MATa leu2-3,112 his3-11,15 trp1-1 ura3-1 fip1-1 | L99F, Q216X (deletion of last 111 amino acids) | Preker et al., 1995, Preker et al., 1997 |
| pap1-1 | MATa ade1 ade2 lys2 gal1? ura3-52 pap1-1 | Patel and Butler, 1992 | |
| pta1-1 | MATa leu2-3,112 his3-11,15 trp1-1 ade2-1 ura3-1 pta1-1 | Premature stop codon | O'Connor and Peebles, 1992, Preker et al., 1997 |
| pfs2-1 | MATa leu2-3,112 his3-11,15 trp1∆ ade2-1 ura3-1 pfs2::TRP1 [pfs2-1-LEU2-CEN] | Ohnacker et al., 2000 | |
| mpe1-1 | MATα leu2-3,112 his3-11,15 trp1-1 ade2-1 ura3-1 mpe1-1 | F9S, Q268K, K337F, K354X (deletion of last 87 amino acids) | Vo et al., 2001 |
| ref2-2 | MATa leu2-3,112 his3-11,15 trp1-1 can1-100 ade2-1 ura3-1 ref2-2 | Dheur et al., 2003 | |
| pti1-2 | MATa leu2-3,112 his3-11,15 trp1-1 can1-100 ade2-1 ura3-1 pti1-2 | Dheur et al., 2003 | |
| ssu72-2 | MATa leu2-3,112 his3-11,15 trp1-1 ade2-1 ura3-1 ssu72-2 | R129A | Pappas and Hampsey, 2000, Dichtl et al., 2002a |
| glc7-5 | MATa leu2-3,112 his3-11,15 can1-100 ade2-1 ura3-1 glc7::LEU2 trp1:: glc7-5 | F226L | Peggie et al., 2002 |
| swd2-2 | MATa leu2∆0 his3∆1 ura3∆0 met15∆0 swd2-2 | F14P, C27G, F41I, K185E, S253L, C257R | Dichtl et al., 2004 |
| ∆syc1 | MATa leu2∆0 his3∆1 ura3∆0 met15∆0 syc1∆ | Whole gene deletion | Zhelkovsky et al., 2006 |
| nrd1-5 | MATa ura3-52 trp1-1 ade2-1 leu2-3,112 his3-11,15 lys2-∆2 can1-100 met2-∆1 nrd1-5 | G368V (RNA recognition motif) | Steinmetz and Brow, 1996 |
| nrd1-∆CID | MATa ura3-52 trp1-1 ade2-1 leu2-3,112 his3-11,15 lys2-∆2 can1-100 met2-∆1 nrd1-∆CID | deletion of amino acids 39–169 (CTD region) | Steinmetz and Brow, 1998 |
| nab3-11 | MATa leu2-3,112 his3-11,15 trp1-1 can1-100 ade2-1 ura3-1 nab3-11 | F371L, P374L (RNA recognition motif) | Conrad et al., 2000 |
| sen1-1 | MATa leu2-3,112 his3-11,15 trp1-1 ade2-1 ura3-1 sen1-1 | G1747D (helicase domain) | Winey and Culbertson, 1988, Mischo et al., 2011 |
| rbp1-1 | MATα ura3-52 leu2-3,112 rpb1-1 | Nonet et al., 1987 |
Table 2
Oligonucleotide Primers.
| Primer | Sequence (5’ – 3’) |
|---|---|
| PAT-seq biotin end-extend | Biotin-CAGACGTGTGCTCTTCCGATCTTTTTTTTTTTTTTTTTT |
| PAT-seq splint A (200 µM) | CCCTACACGACGCTCTTCCG(rA)(rT)(rC)(rT) |
| PAT-seq Splint B (200 µM) | NNNNAGATCGGAAGAGCGTCGTGTAGGG |
| Illumina universal Rd1 forward (50 µM for mPAT) | AATGATACGGCGACCACCGAGATCTACACTCTTTCCCTACACGACGCT CTTCCG |
| PAT anchor reverse | GCGAGCTCCGCGGCCGCGTTTTTTTTTTTT |
| TVN-PAT anchor reverse | GCGAGCTCCGCGGCCGCGTTTTTTTTTTTTVN |
| OM14 PAT forward | GGGTCTTTTGACGCTGGAC |
| mPAT reverse | CAGACGTGTGCTCTTCCGATCTTTTTTTTTTTT |
| mPAT-TVN reverse | CAGACGTGTGCTCTTCCGATCTTTTTTTTTTTTVN |
| AAD16 mPAT | CCTACACGACGCTCTTCCGATCTTGCGTTTGTGTAAGAAATATGC |
| ADE2 mPAT | CCTACACGACGCTCTTCCGATCTAGAAACTGTCGGTTACGAAGC |
| APQ12 mPAT | CCTACACGACGCTCTTCCGATCTGAAACGCCTCTGCTTACTCGG |
| ARG8 mPAT | CCTACACGACGCTCTTCCGATCTGGCTATTGAAGCGGTTTACG |
| ARP5 mPAT | CCTACACGACGCTCTTCCGATCTGAGACAGCAAACTGAAACGC |
| CHD1 mPAT | CCTACACGACGCTCTTCCGATCTGCTGATGGCAATGTACGAC |
| COX17 mPAT | CCTACACGACGCTCTTCCGATCTCTGACAGTCTGCCGACAACCA |
| CRN1 mPAT | CCTACACGACGCTCTTCCGATCTCGGCGGCGATAATAATGC |
| CST6 mPAT | CCTACACGACGCTCTTCCGATCTCTCGAGCTGCATCCTTTCTT |
| DBF2 mPAT | CCTACACGACGCTCTTCCGATCTTCAACTAGCACCTATGAACGC |
| ECM16 mPAT | CCTACACGACGCTCTTCCGATCTGCTTCCAGACCATCACAGG |
| ECM25 mPAT | CCTACACGACGCTCTTCCGATCTGCATATACGACAACAAAATACCC |
| END3 mPAT | CCTACACGACGCTCTTCCGATCTGCAGAAATCAATTGACACCGA |
| ENT1 mPAT | CCTACACGACGCTCTTCCGATCTGTGATTCTGTCATTCCAGTCCG |
| ERG8 mPAT | CCTACACGACGCTCTTCCGATCTGGTAGATAATAGTGGTCCATGTGA |
| GFD1 mPAT | CCTACACGACGCTCTTCCGATCTCACATGGACACTTTTAAGCACG |
| HSP26 mPAT | CCTACACGACGCTCTTCCGATCTGGTTTCTTCTCAAGAATCGTG |
| IMP2 mPAT | CCTACACGACGCTCTTCCGATCTGAGCCATTTTAGAATGAAAATCAGC |
| LOS1 mPAT | CCTACACGACGCTCTTCCGATCTGCAAGGTCAATAGCTTTCAGG |
| MRPL19 mPAT | CCTACACGACGCTCTTCCGATCTCGAGAAATTTTCAACAGACCTTCC |
| MRPL22 mPAT | CCTACACGACGCTCTTCCGATCTGCTGAGAAAGATGAACTGCTACTC |
| MSA1 mPAT | CCTACACGACGCTCTTCCGATCTGCATGTGAATGGAGTTGACCTTC |
| NOP16 mPAT | CCTACACGACGCTCTTCCGATCTGGCAACTACCAATTGATTACCA |
| NOT3 mPAT | CCTACACGACGCTCTTCCGATCTCAGTGCTAATGGCAGTATAATTTG |
| NUP159 mPAT | CCTACACGACGCTCTTCCGATCTGCTATATGTACGTTGTTAGTGCCG |
| OM14 mPAT | CCTACACGACGCTCTTCCGATCTGGTCTTTTGACGCTGGACGG |
| OM45 mPAT | CCTACACGACGCTCTTCCGATCTCTGGAGCTCGAAAAAGGAC |
| PDE2 mPAT | CCTACACGACGCTCTTCCGATCTTTCCTTTTGTGAAGTATTTGTGC |
| PNT1 mPAT | CCTACACGACGCTCTTCCGATCTCATGACATTATCTATGCTGTACATATTG |
| PRY2 mPAT | CCTACACGACGCTCTTCCGATCTGGATTCTTCTTTTCTAGGGTACGC |
| RCL1 mPAT | CCTACACGACGCTCTTCCGATCTGGTGTAACTTCACGGACAACT |
| RER2 mPAT | CCTACACGACGCTCTTCCGATCTGAGCAAGATAAATGAGTTCGC |
| RHO1 mPAT | CCTACACGACGCTCTTCCGATCTCAATCCCATTCCTTTTCTCA |
| RPF1 mPAT | CCTACACGACGCTCTTCCGATCTCCGTAAGAACCGTGGTCG |
| RSC4 mPAT | CCTACACGACGCTCTTCCGATCTGTCTTCCCATCATATGCATGT |
| SLF1 mPAT | CCTACACGACGCTCTTCCGATCTGGTGAAATTAGCAGGCAGTTTG |
| SNF2 mPAT | CCTACACGACGCTCTTCCGATCTGCATGACAGAAGCGAGTGTATAG |
| SRP68 mPAT | CCTACACGACGCTCTTCCGATCTGGTTTCTTGGGCCTATTTGG |
| TIM54 mPAT | CCTACACGACGCTCTTCCGATCTCCAAGGAAGAGCCAGAATCAG |
| TOM70 mPAT | CCTACACGACGCTCTTCCGATCTGCAGCAATGACATTGACATCTCAC |
| TRP2 mPAT | CCTACACGACGCTCTTCCGATCTAATGATGTATAGCAGGATCCTGA |
| UBC9 mPAT | CCTACACGACGCTCTTCCGATCTGAATCCATCTTTCCCATTCTTCC |
| VTS1 mPAT | CCTACACGACGCTCTTCCGATCTGCATATACCAACACAGGGAACA |
| YET3 mPAT | CCTACACGACGCTCTTCCGATCTGTCGATGTGCAAAAGCCTACA |
| YRA1 mPAT | CCTACACGACGCTCTTCCGATCTACCGCCACTAGGTGACGC |
| YSC84 mPAT | CCTACACGACGCTCTTCCGATCTGGATGGGTTCCTTATTCAGC |
| MID2 mPAT | CCTACACGACGCTCTTCCGATCTCAAGGTAACGAATTATCACCACG |
-
All primers have a concentration of 100 µM unless stated.
Additional files
Download links
A two-part list of links to download the article, or parts of the article, in various formats.
Downloads (link to download the article as PDF)
Open citations (links to open the citations from this article in various online reference manager services)
Cite this article (links to download the citations from this article in formats compatible with various reference manager tools)
Genetic and pharmacological evidence for kinetic competition between alternative poly(A) sites in yeast
eLife 10:e65331.
https://doi.org/10.7554/eLife.65331


