Uncovering an allosteric mode of action for a selective inhibitor of human Bloom syndrome protein
- Cancer Research UK DNA Repair Enzymes Group, Genome Damage and Stability Centre, School of Life Sciences, University of Sussex, United Kingdom
- Bioinformatics Lab, School of Life Sciences, University of Sussex, United Kingdom
- Sussex Drug Discovery Centre, School of Life Sciences, University of Sussex, United Kingdom
- School of Life Sciences, University of Sussex, United Kingdom
- Medicines Discovery Institute, Park Place, Cardiff University, United Kingdom
Figures
Figure 1 with 2 supplements
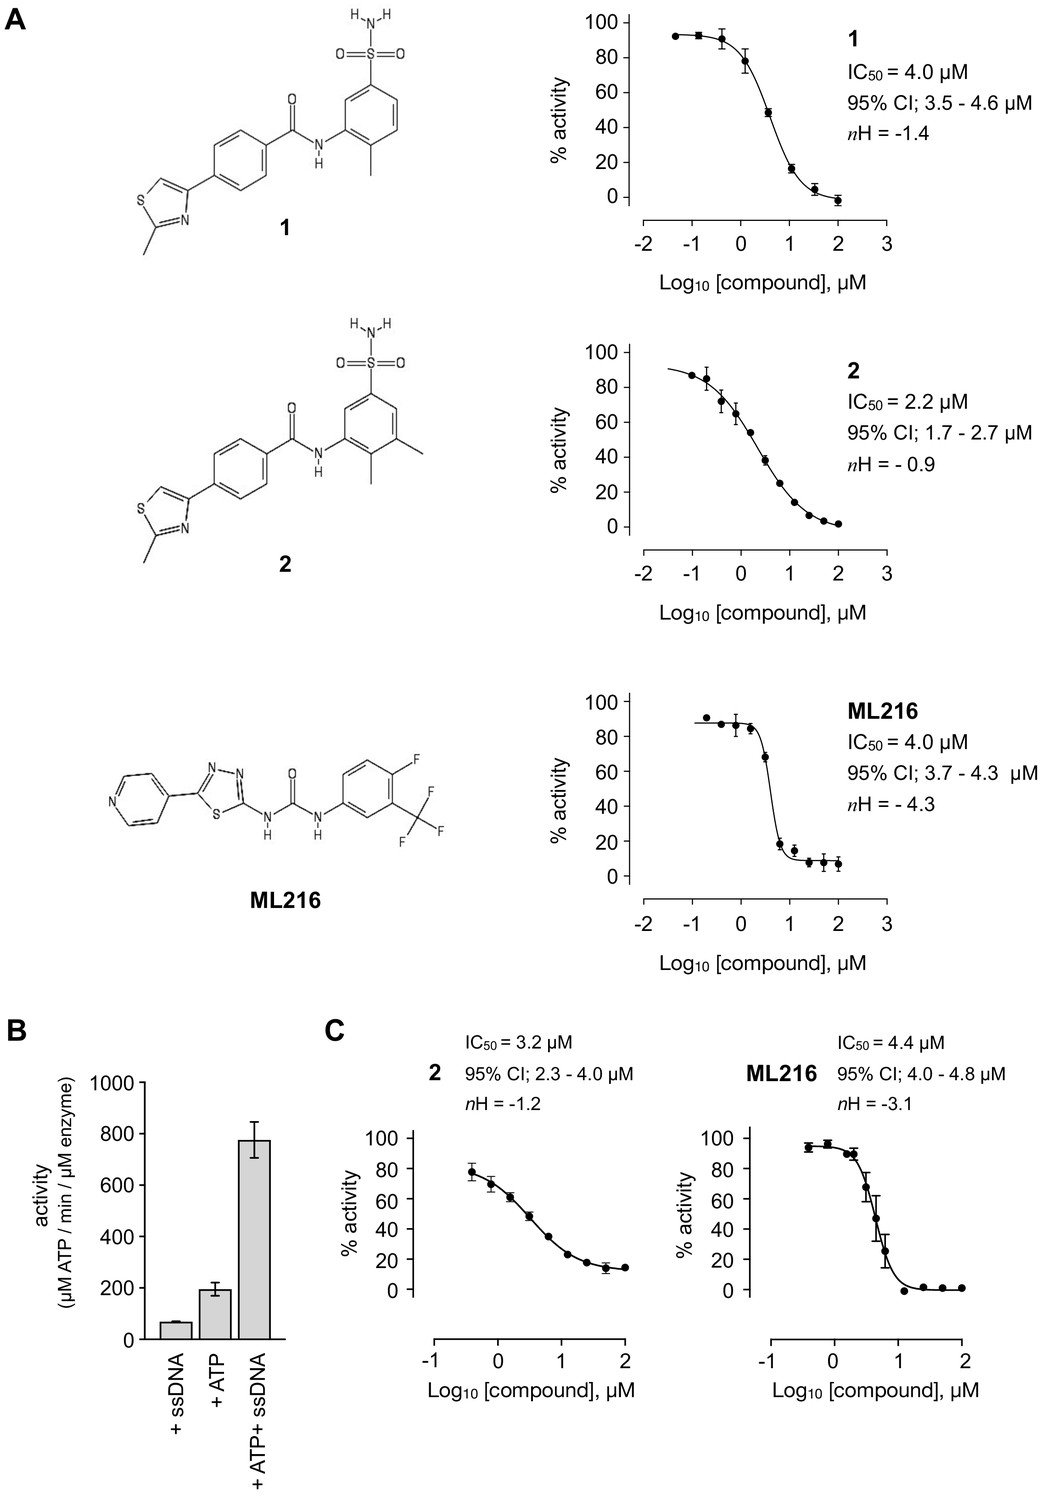
Inhibition of BLM helicase unwinding activity.
(A, left) Chemical drawings for compounds 1, 2, and ML216. (A, right) Dose response curves from fluorescence-based DNA unwinding assays with BLM-HD. Experimental data were fitted with a four parameter, log(inhibitor) vs. response model with variable slope. Calculated values for IC50, Hill slope (nH) and 95% confidence intervals (95% CI) are given in each case. (B) Turnover of ATP by BLM-HD, as measured by a malachite-green end-point assay, is strongly stimulated in the presence of a 20-base single-stranded oligonucleotide. (C) Dose response curves from ATP-turnover assays with BLM-HD. Data were fitted as for (A). In each case data points are the mean of three technical replicates, with error bars representing one standard deviation (1 SD).
Figure 1—figure supplement 1
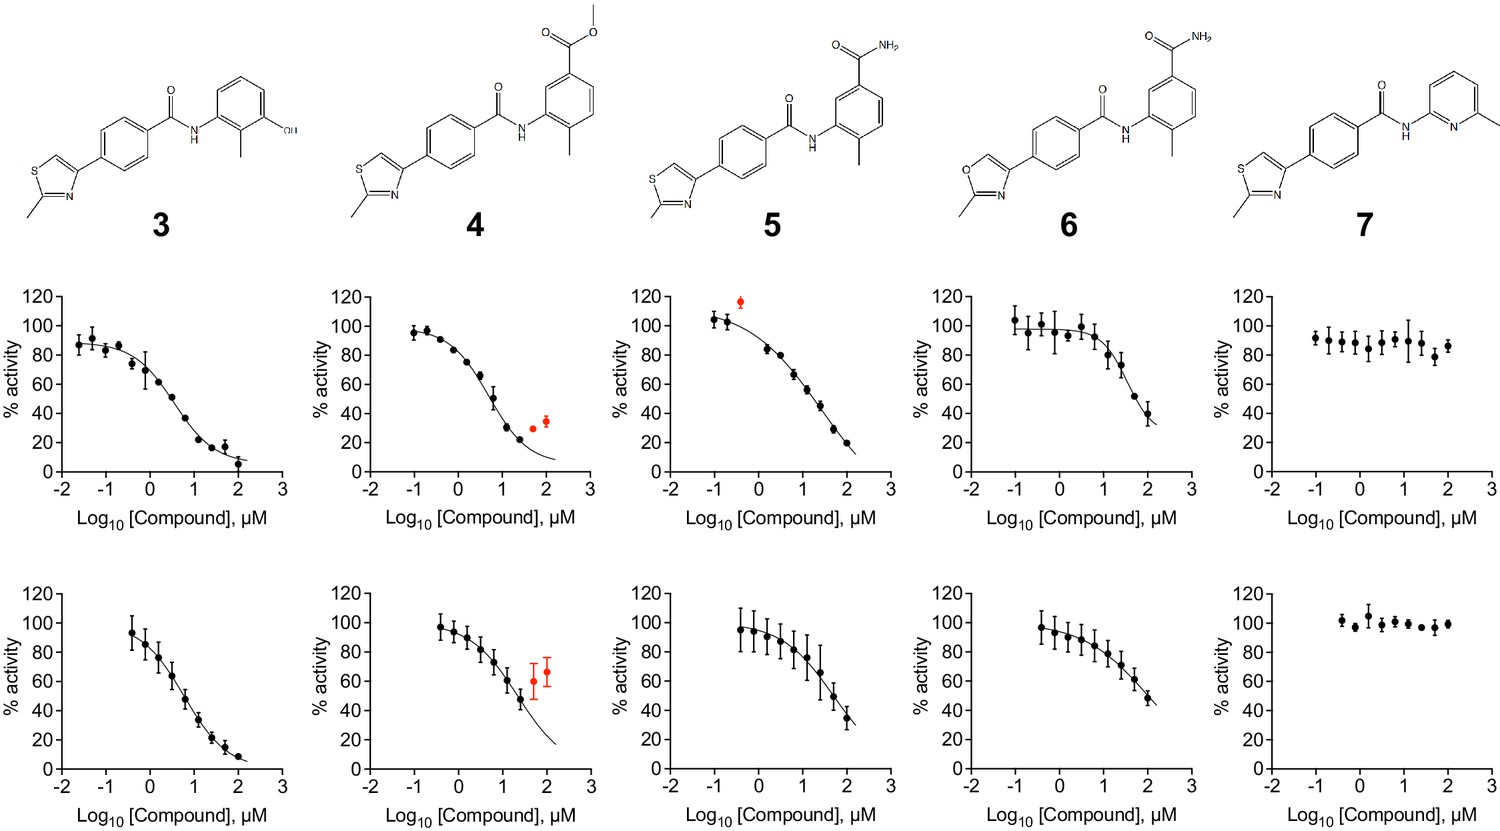
Assay data for compunds 3 to 7.
(Top) Chemical drawings for compounds 3 to 7. (Middle) Dose response curves from fluorescence-based DNA unwinding assays with BLM-HD. Data points are the mean of three technical replicates with error bars representing 1 SD. (Bottom) Dose response curves from ATP turnover assays with BLM-HD. Data points represent the mean from at least two individual experiments, each containing three technical replicates. Error bars represent the standard error of the mean (SEM). Experimental data were fitted with a four parameter, log(inhibitor) vs. response model with variable slope. Calculated values for IC50, Hill slope (nH) and 95% confidence intervals (95% CI) are reported in Table 1. Data points excluded from fitting are coloured red.
Figure 1—figure supplement 2
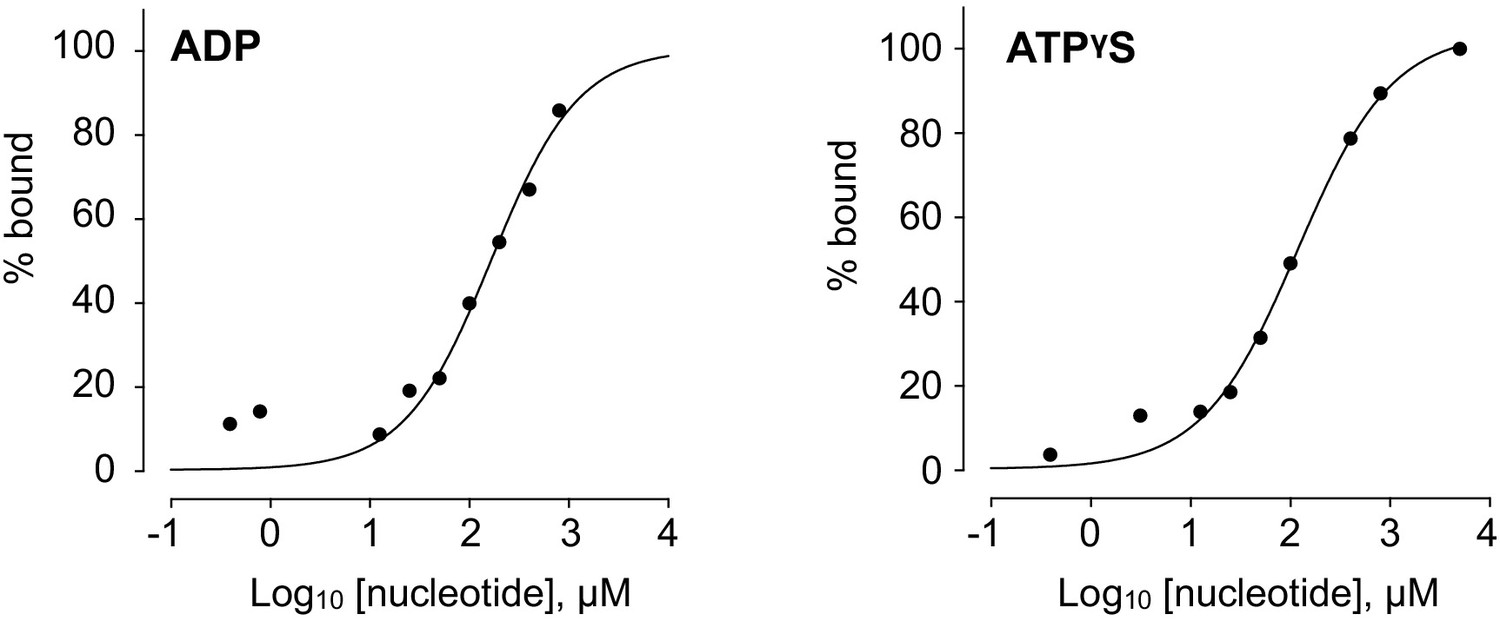
Indicative binding isotherms for titrations of Mg-ADP and Mg-ATPγS into BLM-HD as measured by MST.
Fitted lines are intended as visual aids only, as the data only represent values from a single preliminary experiment.
Figure 2 with 1 supplement

DNA interaction assays.
(A) Titration of BLM-HD with 2 prevents the unwinding of a forked-50mer dsDNA substrate into its component strands, as judged by native gel electrophoresis. (B) Quantification of inhibitory activity by 2 in the gel-based activity assay. Experimental data were fitted with a four parameter, log(inhibitor) vs. response model with variable slope. Calculated values for IC50, nH and 95% CI are given in each case. (C) Representative results from a Topoisomerase I (Topo I) DNA-unwinding assay. M = molecular mass maker; DMSO = buffer supplemented with dimethyl sulfoxide control; mAMSA = mAmsacrine; ML216, ML216-A, ML216-B = refer to the three independent sources of the compound as described in the main text of the manuscript (D) Dose response curves from SYBR-Green II dye displacement assays, using a forked-50mer DNA duplex incubated with ML216 for a period of 20 (open circles), 45 (filled circles), and 60 min (crossed circles). Fitted lines are intended as visual aids only. (E) Lineweaver-Burk plot for data generated at three compound concentrations (0, 5, and 10 µM) in a colourimetric ATP turnover assay. Linear regression produces an intercept of all data on the X-axis indicating that 2 is a non-competitive inhibitor (i.e. same Km, altered Vmax parameter). (F, G) Binding isotherms for binding of BLM-HD to ssDNA-15mer and −20mer, or to compound 2 in the presence of either oligonucleotide, as determined by microscale thermophoresis (MST). Experimental data were fitted with a one-site, specific binding model. Values for Kd and 95% CI are given in each case. For all plots, data represent the mean of three technical replicates with error bars representing 1 SD.
Figure 2—figure supplement 1
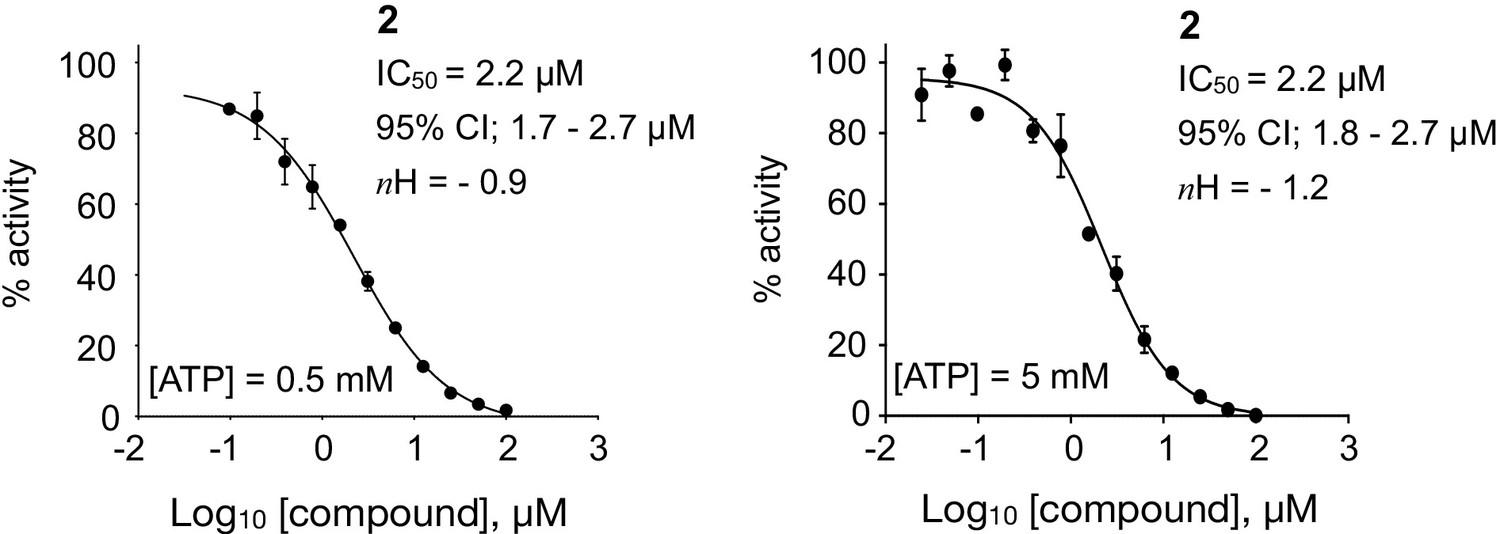
Dose response curves from fluorescence-based DNA unwinding assays with BLM-HD, carried out at two different ATP concentrations.
Experimental data were fitted with a four parameter, log(inhibitor) vs. response model with variable slope. Calculated values for IC50, Hill slope (nH) and 95% confidence intervals (95% CI) are given in each case. Data points represent the mean of three technical replicates, with error bars representing 1 SD.
Figure 3 with 3 supplements

Structural overview of BLM-HDΔWHD in complex with compound 2.
(A) Schematic representation of the domain composition and respective amino acid boundaries for full-length human BLM and the two expression constructs used in this study BLM-HD and BLM-HDΔWHD. D1 and D2 = domains 1 and 2 of the helicase core; Zn = zinc-binding domain; WH = winged-helix; HRDC = Helicase and RNaseD C-terminal domain; RQC = RecQ C-terminal domain. (B and B inset) Molecular secondary structure cartoon highlighting components of a ‘pseudo-symmetrical’ dimer found in the asymmetric unit of BLM-HDΔWHD/Mg-ADP/2/ssDNA crystals, driven by partial complementarity of the single-stranded 15mer oligonucleotide at its 5’ end (DNA1 and DNA2, coloured orange and cyan respectively). Compound 2 (yellow-coloured spheres) binds to a small pocket found on the opposite side to that which binds nucleotide (grey-coloured spheres). (C, left) Molecular cartoon representation highlighting interactions made between 2 and BLM-HDΔWHD. Key amino acid residues are labelled and shown in stick representation, with carbon atoms coloured according to the schematic shown in panel A. Compound 2 is shown in stick representation, with carbon atoms coloured yellow. Potential hydrogen bonds are indicated by black dotted lines. (C, right) Modified LIGPLOT+ (Laskowski and Swindells, 2011) diagram of protein-compound interactions. See associated key for additional detail.
Figure 3—figure supplement 1
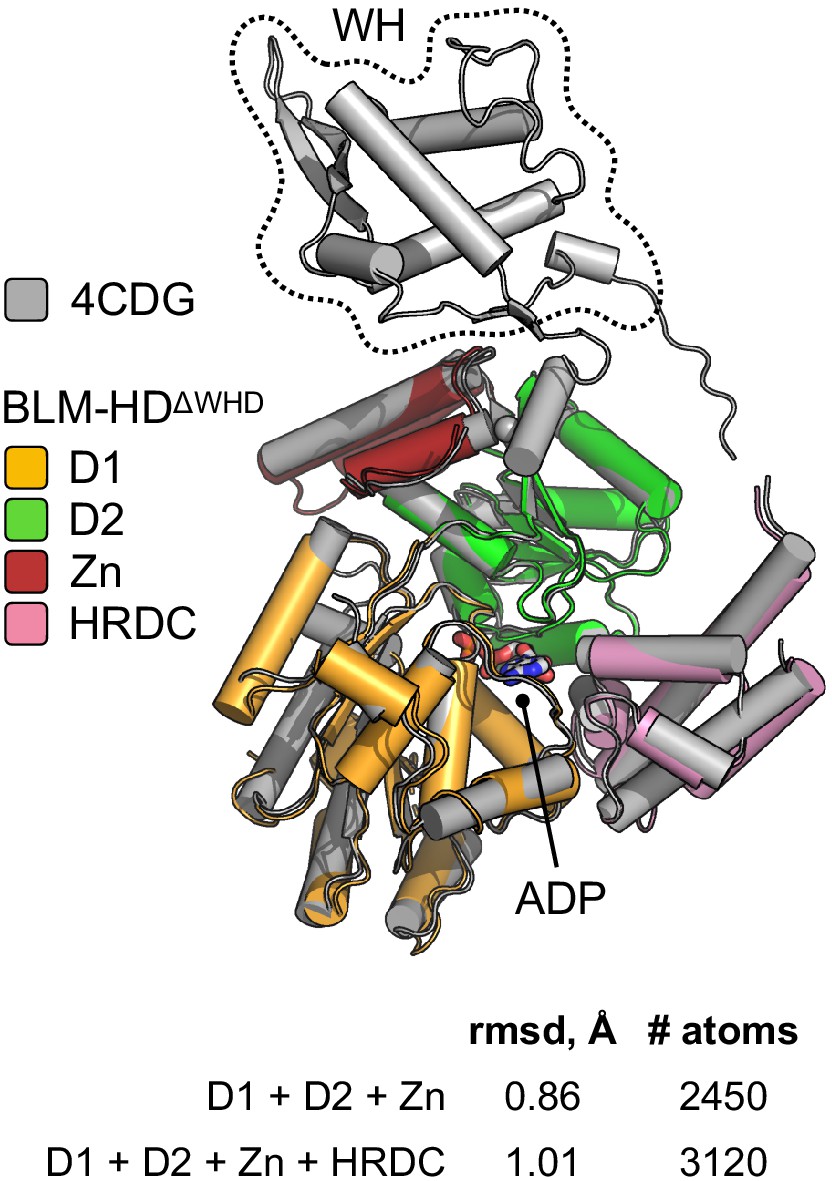
Superposition of the structures of BLM-HD (PDB: 4CDG) and BLM-HDΔWHD using PyMOL (Schrödinger, 2020).
Values for rmsd in Angstrom are shown, calculated over the indicated number of equivalent atoms. See associated key for details of colour scheme.
Figure 3—figure supplement 2
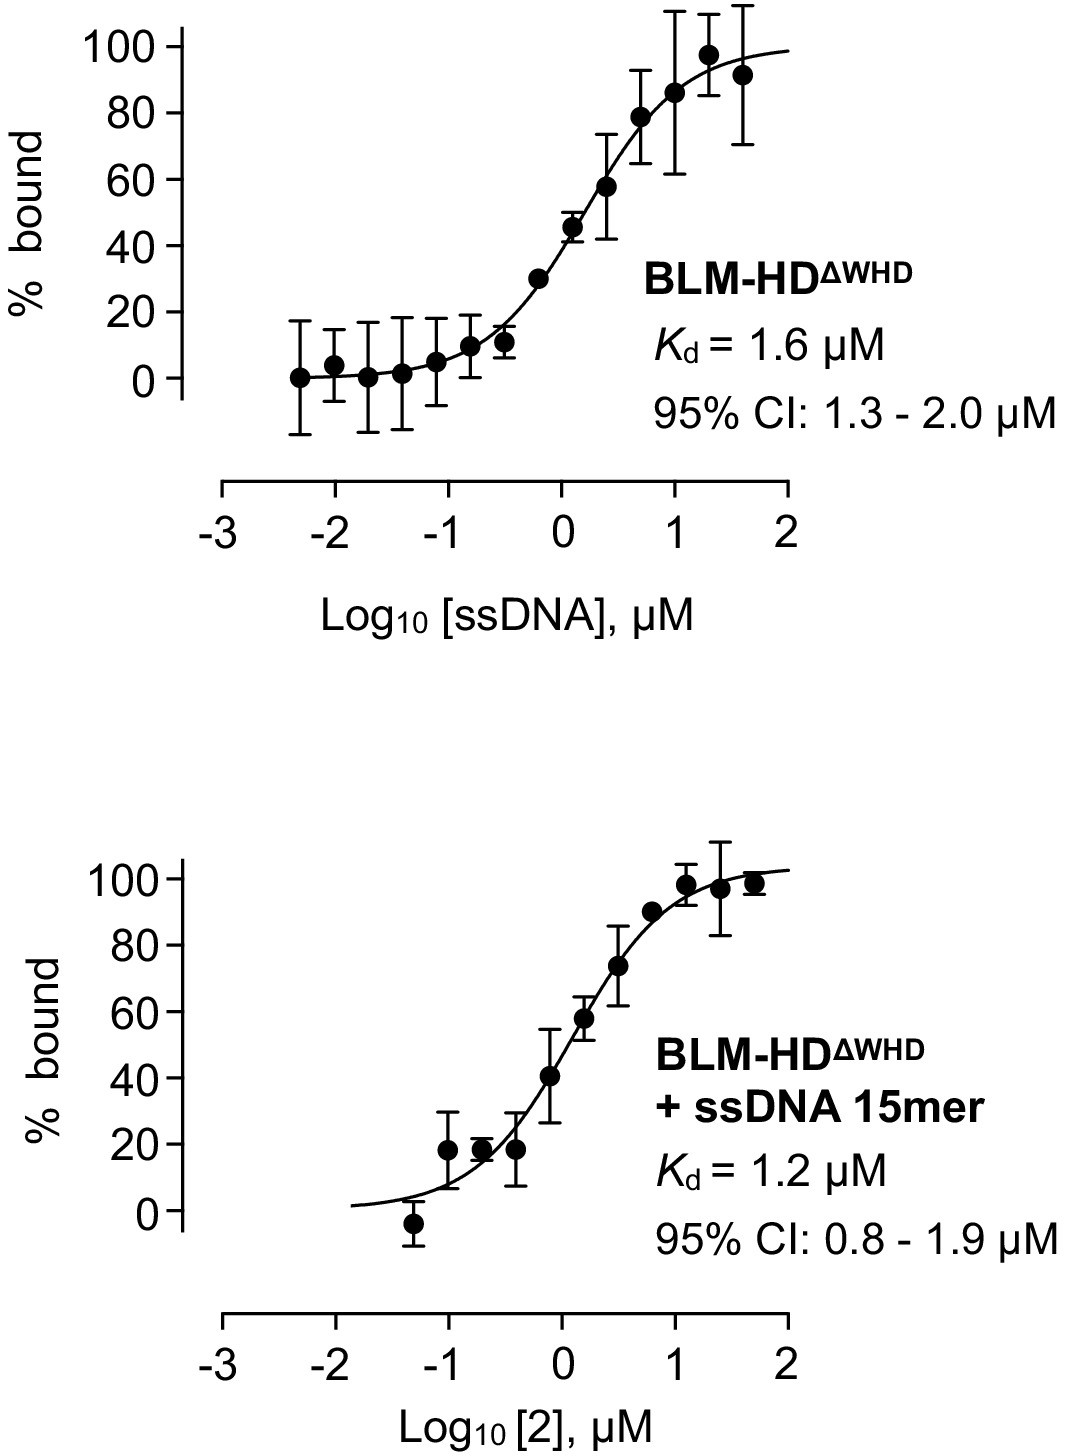
Isotherms for binding of BLM-HDΔWHD to (top) ssDNA-15mer and (bottom) compound 2 in the presence of ssDNA-15mer, as determined by MST.
Values for Kd and 95% CI are given in each case. For all plots, data represent the mean of three technical replicates with error bars representing 1 SD.
Figure 3—figure supplement 3
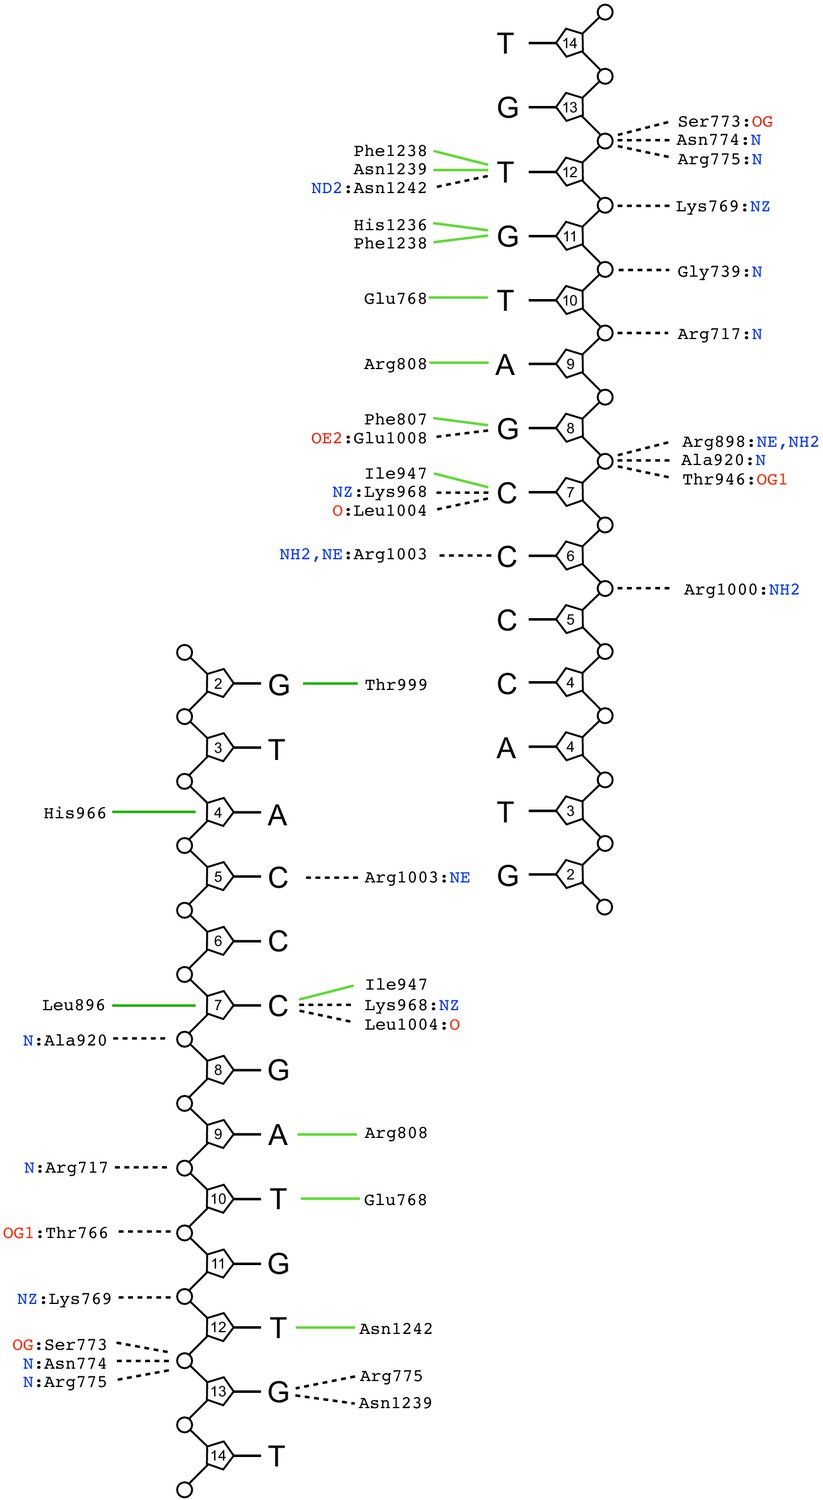
Schematic summary of DNA-interactions made within the crystal lattice of the liganded complex (BLM-HDΔWHD + Mg-ADP + ssDNA-15mer + compound 2).
Interaction network determined through by the PDBsum Generate webserver (PDBsum, 2021). Green solid lines represent hydrophobic / stacking interactions. Black dotted lines represent potential hydrogen bonds.
Figure 4 with 3 supplements
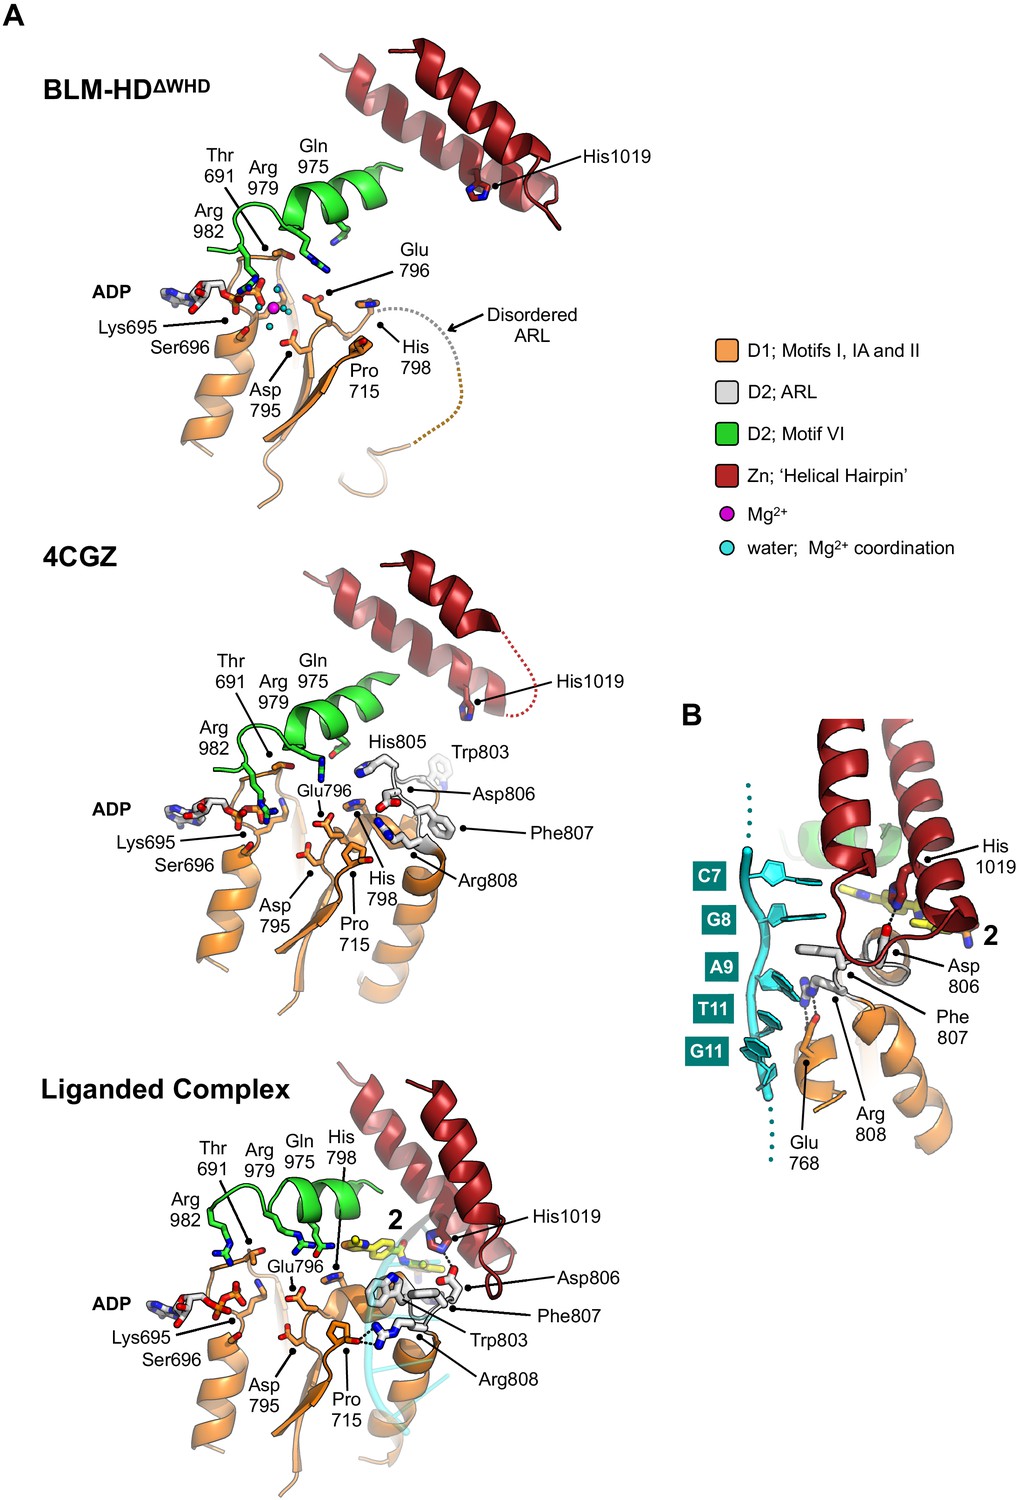
Structural transitions around the aromatic rich loop.
(A) Molecular secondary structure cartoons for the region surrounding the aromatic rich loop (ARL) of BLM-HDΔWHD (top), PDB entry 4CGZ; BLM-HD in complex with DNA (middle) and liganded complex; BLM-HDΔWHD in complex with ADP, ssDNA-15mer and 2 (bottom). The side chains for key amino acid residues are shown in stick representation, with carbon atoms coloured according to their respective domains (see associated key). Bound ADP and 2 are also shown in stick representation, with carbon atoms coloured grey and yellow, respectively. (B) Expanded and rotated view highlighting the interactions made between the ARL and ssDNA-15mer oligonucleotide (cartoon coloured cyan) in the liganded complex, also showing the relative position of compound 2. Potential hydrogens bonds are represented by black dotted lines.
Figure 4—figure supplement 1
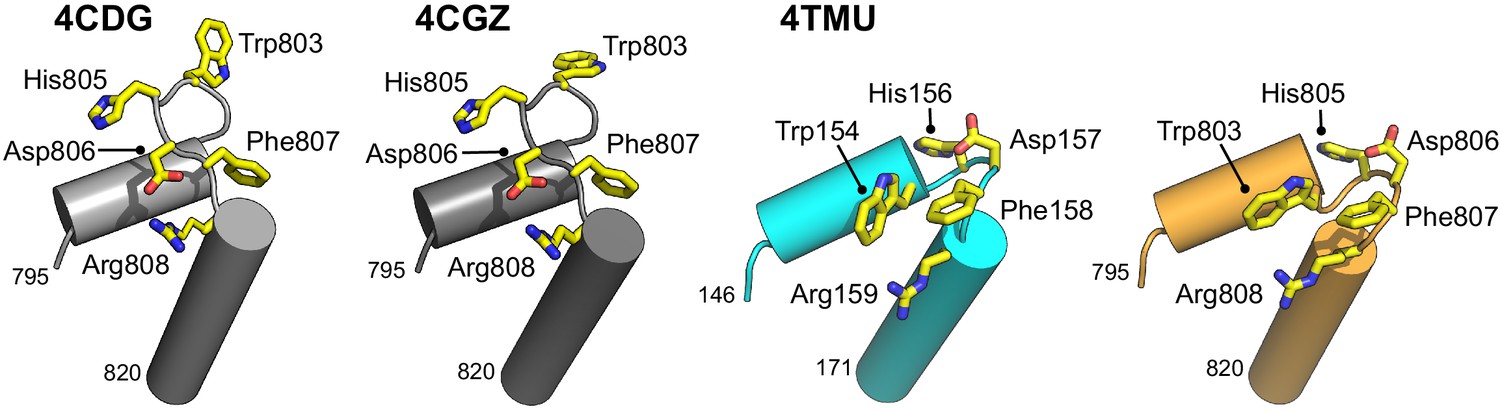
Molecular secondary structure cartoons showing selected amino acid side chains of the aromatic-rich loop (ARL) region in PDB entries 4CDG and 4CGZ (BLM-HD) and 4TMU (Cronobacter sakazakii RecQ) to that reported here for liganded-BLM-HDΔWHD.
Amino acid numbering is provided for the start and end of the region compared, with the identity of key residues also provided.
Figure 4—figure supplement 2
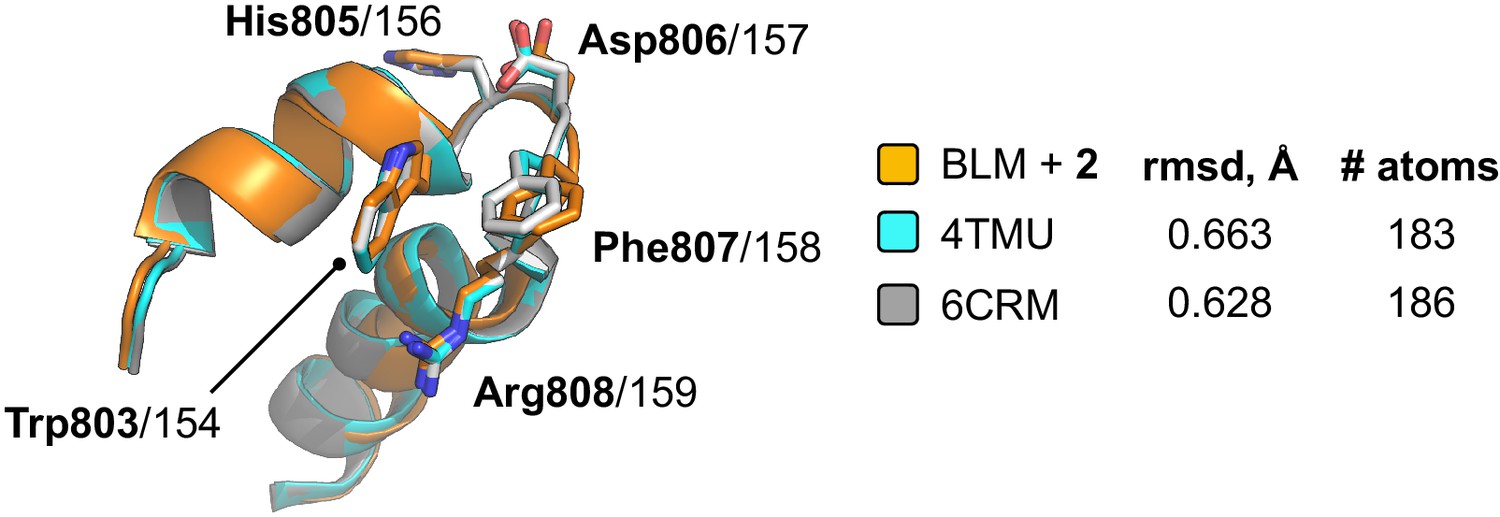
Superposition of the ARL in liganded-BLM-HDΔWHD (coloured orange) with those found in PDB entries 4TMU (cyan) and 6CRM (Voter et al., 2018) (grey); which both represent structures of the catalytic core of C. sakazakii RecQ in complex with different DNA substrates.
Figure 4—figure supplement 3
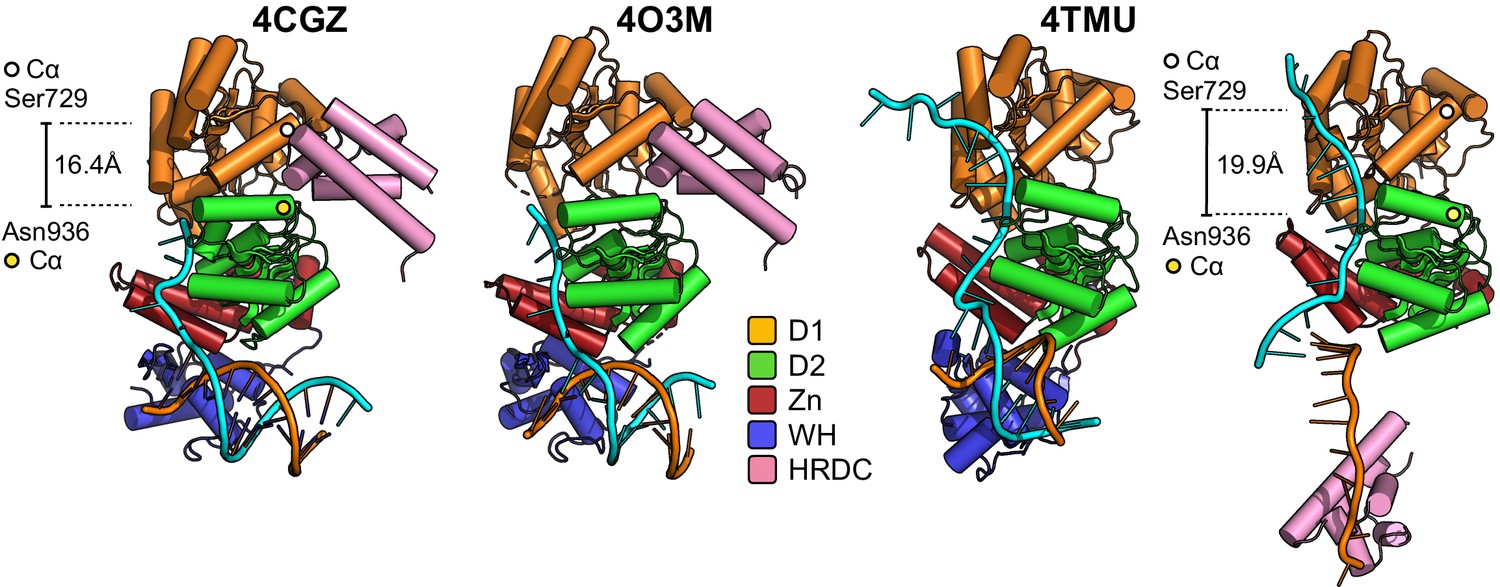
Molecular cartoon representations of the helicase catalytic cores reported in PDB entries 4CGZ, 4O3M, and 4TMU, highlighting their respective interactions with bound DNA substrates and comparing this to liganded BLM-HDΔWHD.
Additional details for the colour scheme can be found in the associated key. The distance between the C-alpha positions of Ser729 and Asn936 is also shown, highlighting a widening of the pocket in our liganded complex (and 4TMU) that would normally serve to accept the HRDC in its ‘parked’ position (4CGZ/4O3M).
Figure 5
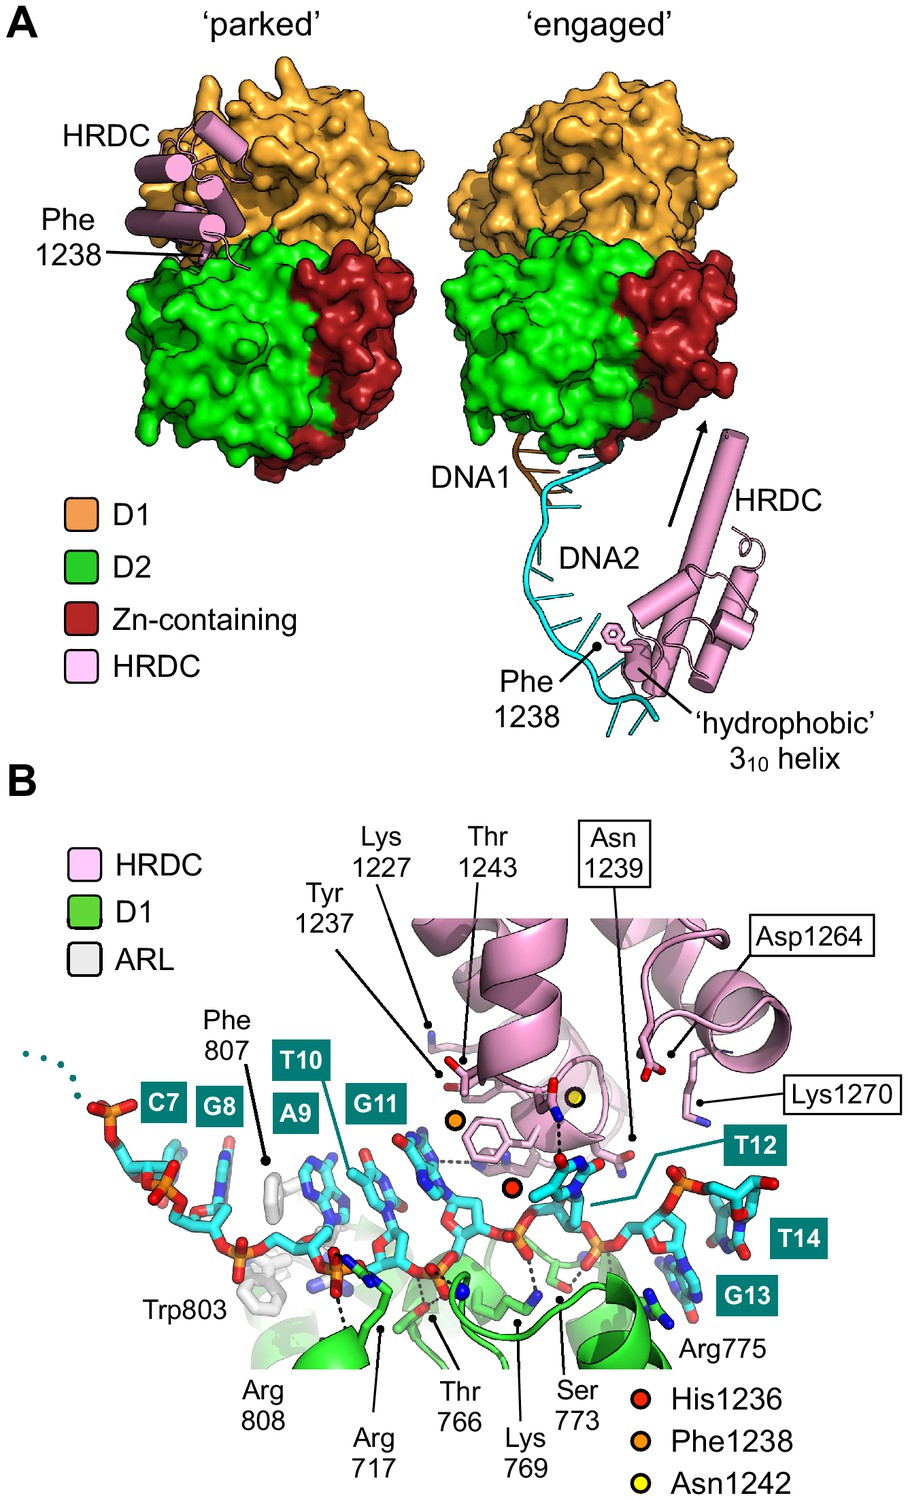
Repositioning of the HRDC domain.
(A) Molecular surface representation of BLM-HDΔWHD (left) and the liganded complex (right) highlighting the relative positions of the HRDC domain (cylindrical helices coloured in pink). The HRDC moves from a ‘parked’ position located on one side of the helicase core, to an ‘engaged’ position on the other side in order to interact with the bound ssDNA-15mer. The N-terminus of the first HRDC alpha-helix is extended at the by ~6 aa, relative to the ‘parked’ position (as indicated by an arrow). (B) Molecular secondary structure cartoon highlighting interactions made by the HRDC to the bound ssDNA-15mer oligonucleotide. Side chains for key amino acid residues are shown in stick representation, with carbon atoms coloured according to their respective domains (see associated key). The bound ssDNA-15mer oligonucleotide is involved in interactions with both the D1 domain (carbon atoms coloured green) and the HRDC (carbon atoms coloured pink). Bound oligonucleotide is shown in stick representation, with carbon atoms coloured cyan.
Figure 6 with 1 supplement

Selectivity profile of compound 2.
(A) Dose response curves from ATP-turnover assays for titration of compounds 2 and ML216 against purified recombinant BLM-HD, WRN-HD, RecQ1-HD, RecQ5-HD and UvrD respectively. Calculated values for IC50, nH and 95% CI are given in each case. (B) MST-derived binding isotherms for the interaction of BLM-HD with ssDNA-20mer in the presence of increasing concentrations of 2. Calculated values for Kd and 95% CI are given in each case. For all plots, data represent the mean of three technical replicates with error bars representing 1 SD.
Figure 6—figure supplement 1
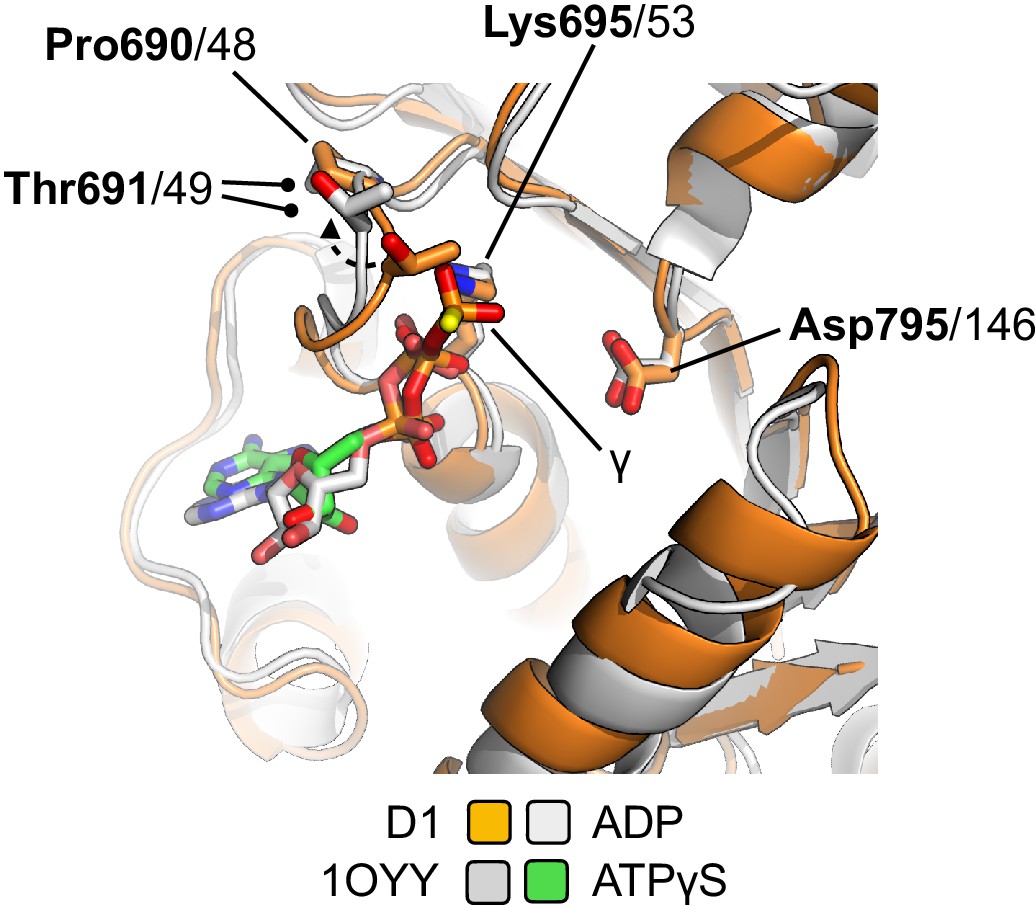
The active site of the liganded complex is compatible with binding of ATP, as judged by superposition of PDB entry 1OYY (E. coli RecQ in complex with ATP-γS Bernstein et al., 2003).
Only a small movement of Thr691 would be necessary to accommodate the gamma phosphate group (as indicated by the dotted line / arrowhead). Only the D1 domain of each protein is shown in order to improve clarity.
Figure 7
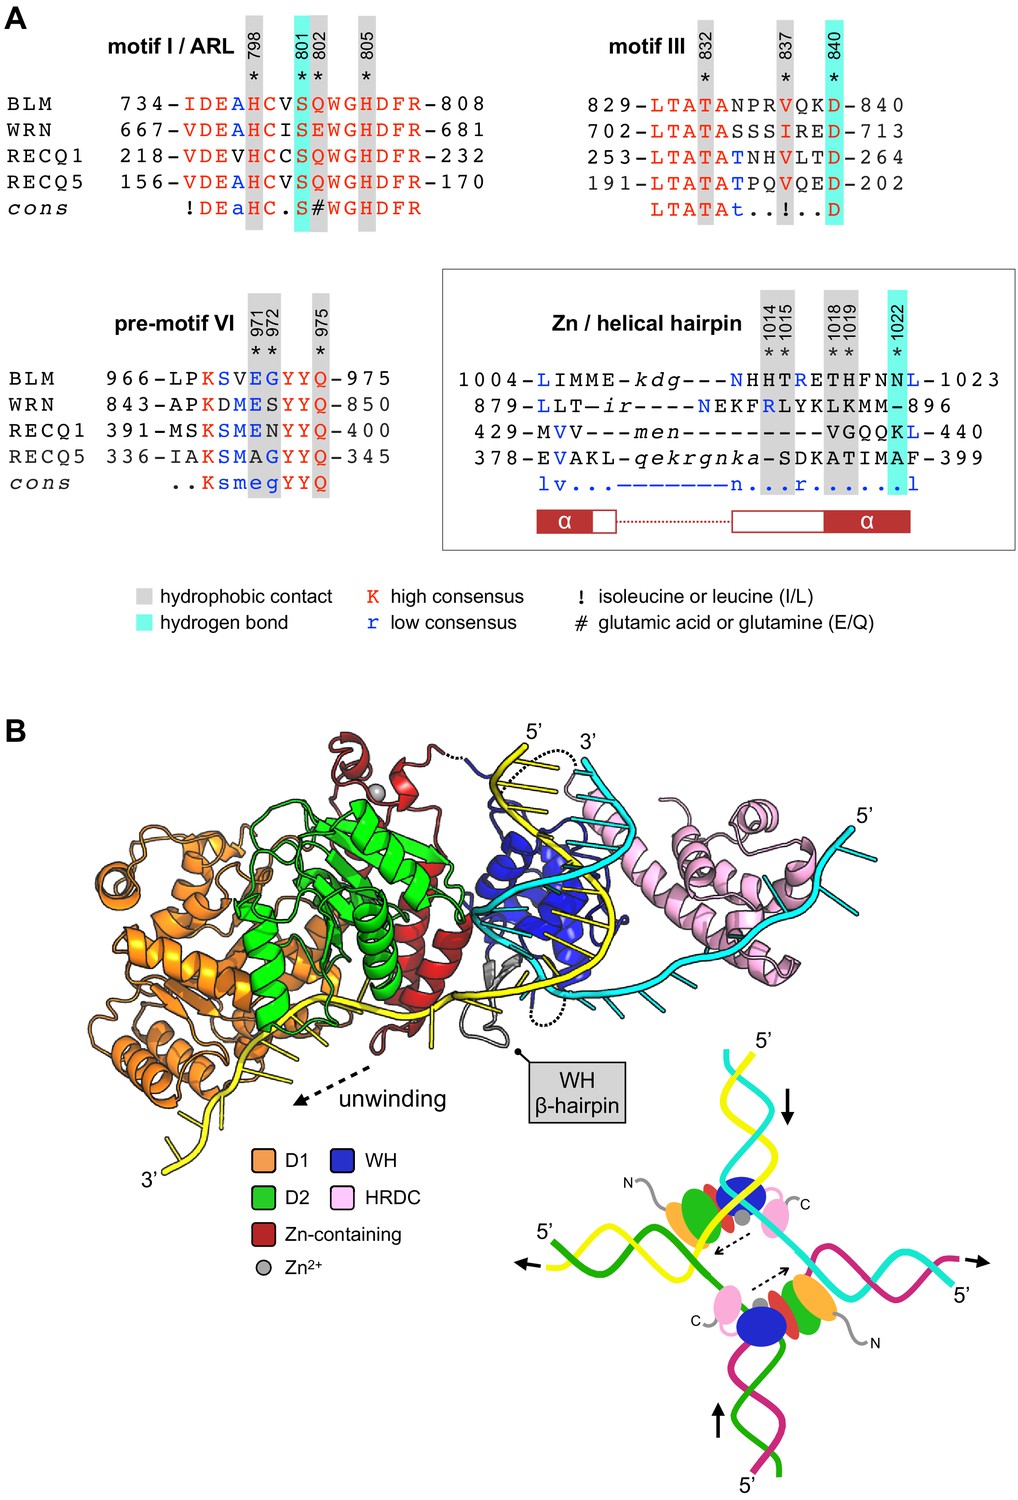
Compound selectivity/speculative model.
(A) The observed selectivity of compound 2 appears to arise from interactions made with amino acids of the Zn-binding domain ‘Helical Hairpin’ that are poorly conserved (or absent) from the other RecQ-family helicases. For each multiple amino acid sequence alignment shown, highly conserved amino acids are coloured in red. Those conserved in at least two RecQ family members (low consensus) are coloured blue. Amino acids residues of human BLM involved in interactions with 2 are additionally highlighted. Please see associated key for additional information. (B) A speculative model for how the HRDC domain may contribute to the unwinding of a DNA duplex or a Holliday junction (inset) via transient interactions with the passive or ‘inactive’ strand. See associated key for additional details.
Tables
Table 1
Summary of inhibition data for seven exemplars from the identified compound series.
IC50 values were determined by fitting of experimental data to log (inhibitor) vs response models provided in GraphPad Prism. Data for the unwinding assay correspond to three technical replicates from a single experiment. For the ATP-turnover assay data correspond to at least two independent experiments, each containing three technical replicates.
| unwinding | turnover | ||
|---|---|---|---|
| # | Chemical drawing | IC50 [95% CI]; µM | IC50 [95% CI]; µM |
| 2 | 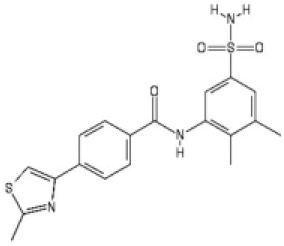 | 2.2 [1.7–2.7] | 3.2 [2.3–4.0] |
| 3 | 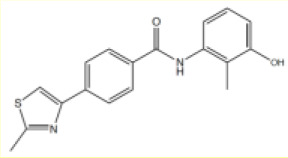 | 3.5 [2.4–5.2] | 5.3 [4.7–6.1] |
| 4 | 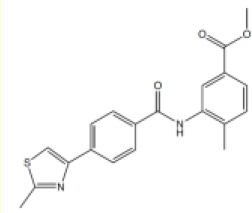 | 6.6 [3.4–12.7] | 11.2 [8.3–15.3] |
| 5 | 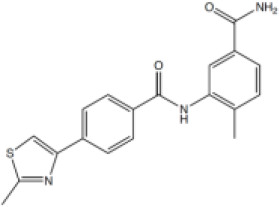 | 12.8 [4.5–36.8] | 47.86 [18.28–180.7] |
| 6 | 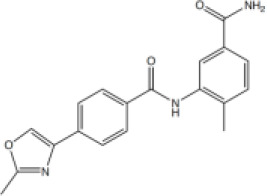 | 56.9 [25.4–171.3] | 40.94 [15.9–139.8] |
| 7 | 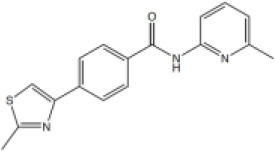 | No inhibition | No inhibition |
| ML216 | 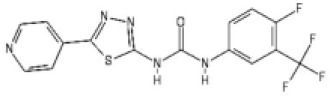 | 4.0 [3.7–4.3] | 4.4 [4.0–4.8] |
Key resources table
| Reagent type (species) or resource | Designation | Source or reference | Identifiers | Additional information |
|---|---|---|---|---|
| Gene (Homo sapiens) | BLM | UniProt | P54132 | BLM_HUMAN |
| Gene (Homo sapiens) | RECQL | UniProt | P46063 | RECQ1_HUMAN |
| Gene (Homo sapiens) | WRN | UniProt | Q14191 | WRN_HUMAN |
| Gene (Homo sapiens) | RECQL5 | UniProt | O94762 | RECQ5_HUMAN |
| Gene (Escherichia coli) | uvrD | UniProt | P03018 | UVRD_ECOLI |
| Strain (Escherichia coli) | BL21(DE3) | New England Biolabs | C2527I | Competent Cells |
| Sequence-based reagent | ssDNA-15mer | This paper | CGTACCCGATGTGTT | |
| Sequence-based reagent | ssDNA-20mer | This paper | CGTACCCGATGTGTTCGTTC | |
| Sequence-based reagent | Forked-50mer: FORK A | This paper | XGAACGAACACATCGGGTACG TTTTTTTTTTTTTTTTTTTTTTTTTTTTTT X = Black Hole Quencher 2 or none | |
| Sequence-based reagent | Forked-50mer: FORK B | This paper | TTTTTTTTTTTTTTTTTTTTTTTTTTTTTT CGTACCCGATGTGTTCGTTCY Y = Tetramethylrhodamine or none | |
| Recombinant DNA reagent | pET-17b | Novagen Merck Millipore | 69663 | |
| Recombinant DNA reagent | pNIC28-Bsa4 | Addgene | 26103 | |
| Chemical compound, drug | ML216 | Merck KGaA Caymen Chemical | SML0661 15186 | |
| Commercial assay or kit | PiColorLock Gold Phosphate Detection System | Novus Biologicals | 303–0030 | |
| Commercial assay or kit | DNA Unwinding Assay Kit | Inspiralis | DUKSR001 | |
| Software, algorithm | BUSTER | Global Phasing | RRID:SCR_015653 | |
| Software, algorithm | CCP4 | CCP4 | RRID:SCR_007255 | |
| Software, algorithm | Coot | Coot | RRID:SCR_014222 | |
| Software, algorithm | Fiji | Fiji | RRID:SCR_002285 | |
| Software, algorithm | Phaser | Phaser | RRID:SCR_014219 | |
| Software, algorithm | PHENIX | PHENIX | RRID:SCR_014224S | |
| Software, algorithm | Prism | GraphPad | RRID:SCR_002798 | |
| Software, algorithm | XDS | XDS | RRID:SCR_015652 |
Appendix 1—table 1
Statistics for data collection, phasing and refinement.
| BLM-HDΔWHD + ADP | Liganded-BLM-HDΔWHD | |
|---|---|---|
| Data collection | ||
| Space group | P21 | P1 |
| Cell dimensions | ||
| a, b, c (Å) | 54.28, 107.69, 55.20 | 84.69, 111.60, 132.38 |
| α, β, γ (°) | 90.00, 109.31, 90.00 | 72.70, 80.13, 79.24 |
| Wavelength | 0.9780 | 0.9762 |
| Resolution (Å) | 51.23–1.53 (1.56–1.53) | 125.37–2.97 (3.08–2.97) |
| Mn I / σI | 12.7 (1.2) | 7.8 (1.4) |
| Mn I, CC1/2 | 1.00 (0.61) | 0.99 (0.57) |
| Completeness (%) | 98.3 (90.3) | 98.0 (94.5) |
| Redundancy | 1.9 (1.7) | 2.6 (2.7) |
| Refinement | ||
| Resolution (Å) | 51.23–1.53 (1.56–1.53) | 47.28–2.97 (3.07–2.96) |
| No. unique reflections | 88464 (8096) | 91661 (8892) |
| Rwork / Rfree | 0.19/0.21 | 0.23/0.27 |
| No. atoms | ||
| Macromolecules | 3870 | 24954 |
| Ligands | 65 | 427 |
| Solvent | 438 | 91 |
| B-factors | ||
| Wilson | 32.58 | 77.77 |
| ADP (mean) | ||
| Macromolecules | 31.00 | 95.79 |
| Ligands | 40.89 | 98.56 |
| Solvent | 45.69 | 53.65 |
| R.m.s. deviations | ||
| Bond lengths (Å) | 0.014 | 0.006 |
| Bond angles (°) | 1.64 | 1.11 |
| Molprobity | ||
| All atom clashscore | 2.44 | 7.42 |
| Ramachandran | ||
| Outliers | 0.21% | 0.42% |
| Allowed | 1.65% | 3.72% |
| Favoured | 98.15% | 95.85% |
-
*Values in parentheses are for the highest resolution shell
Additional files
Download links
A two-part list of links to download the article, or parts of the article, in various formats.
Downloads (link to download the article as PDF)
Open citations (links to open the citations from this article in various online reference manager services)
Cite this article (links to download the citations from this article in formats compatible with various reference manager tools)
Uncovering an allosteric mode of action for a selective inhibitor of human Bloom syndrome protein
eLife 10:e65339.
https://doi.org/10.7554/eLife.65339


