Surprising phenotypic diversity of cancer-associated mutations of Gly 34 in the histone H3 tail
- Department of Pathology, St. Jude Children’s Research Hospital, United States
- Department of Cancer Biology, Fox Chase Cancer Center, United States
- Department of Bioinformatics, St. Jude Children’s Research Hospital, United States
- Advanced ICT Research Institute Kobe, National Institute of Information and Communications Technology, Japan
- Graduate School of Frontier Biosciences, Osaka University, Japan
Figures
Figure 1 with 1 supplement
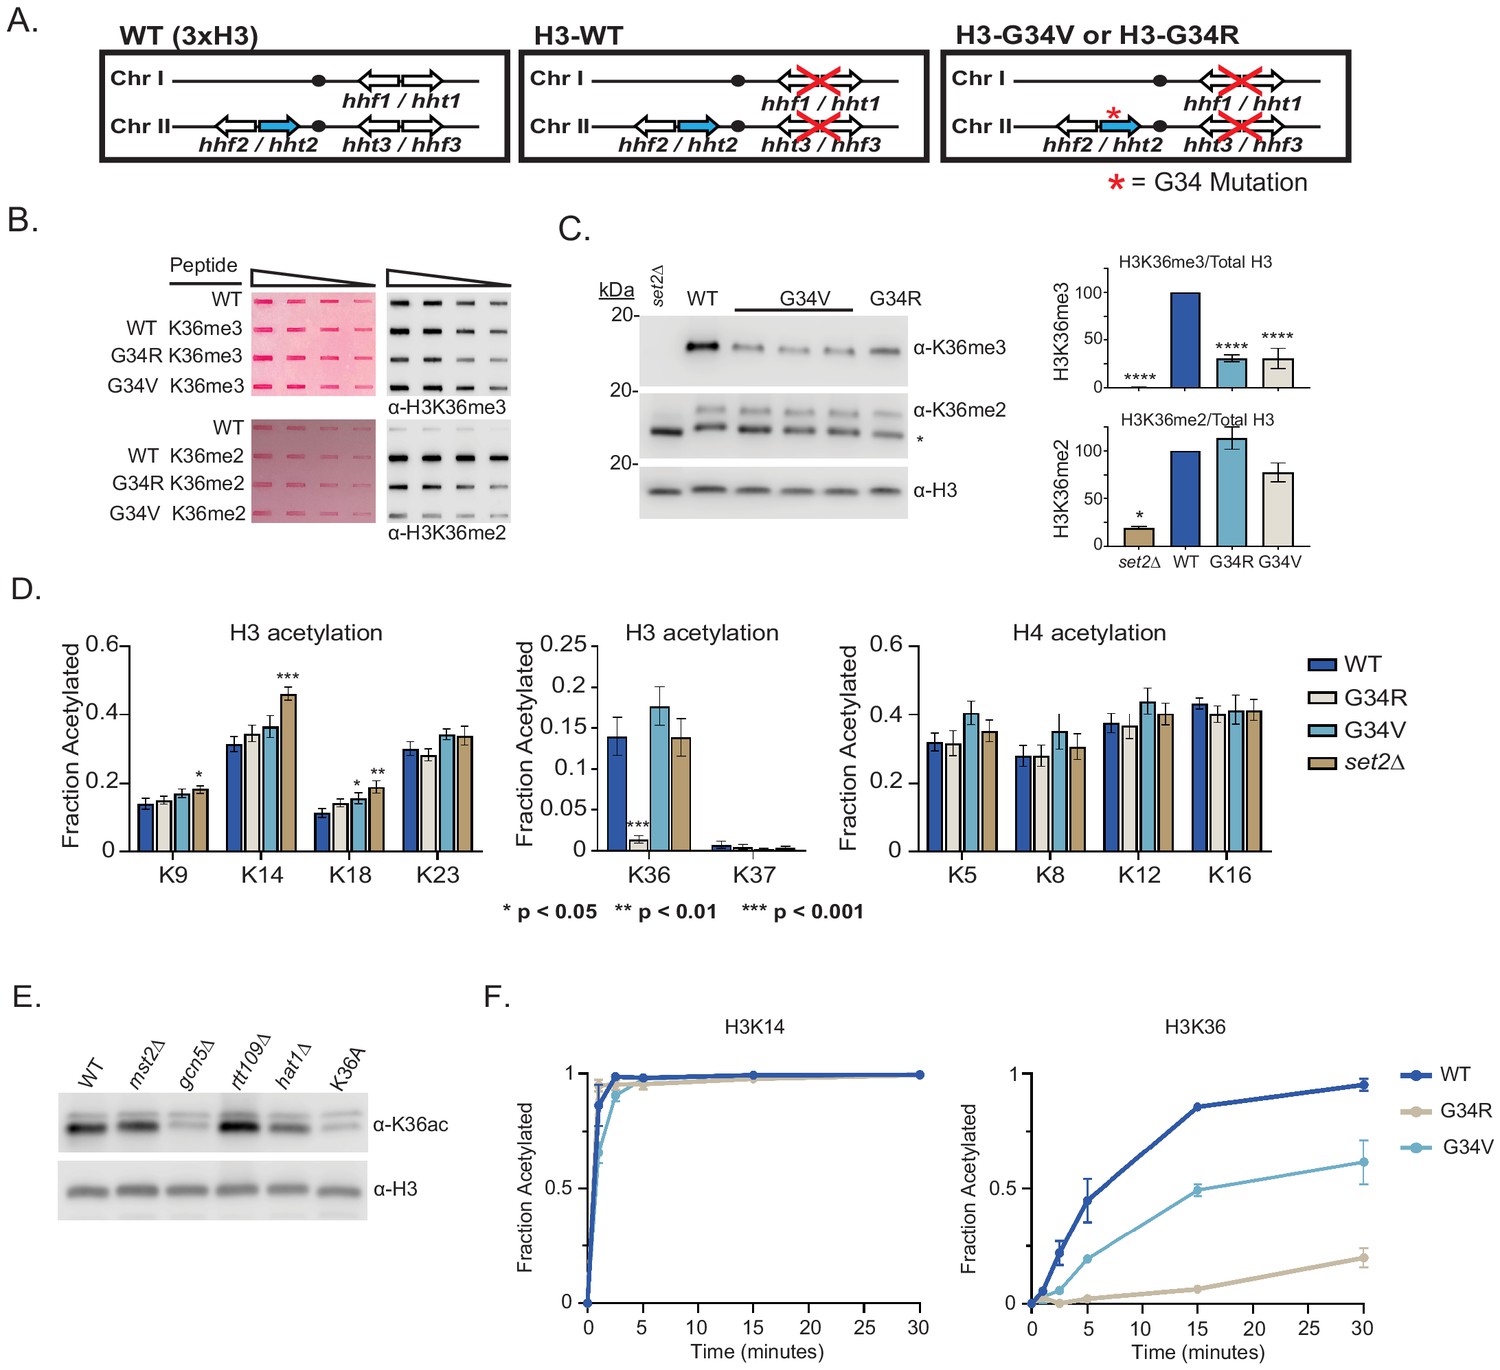
Differential modification of H3K36 in H3-G34R and H3-G34V mutants.
(A) Scheme of the histone H3 (hht) and histone H4 (hhf) genes in Schizosaccharomyces pombe (S. pombe) highlighting the H3 gene (hht2) in which mutations were engineered (blue). (B) Dot blot analysis to quantitatively assess recognition of WT, G34R, and G34V peptides bearing K36 di- or tri-methyl modifications by anti-K36 methyl antibodies. Ponceau-stained blots were used as the loading control (left). (C) Western blot analysis of K36me2, K36me3, and total H3 in H3-WT, H3-G34V, H3-G34R, and set2Δ chromatin extracts. Star marks non-specific band. (Right) quantification of K36 methylation relative to total H3 (K36me3: three replicates for H3-WT, set2Δ, and H3-G34R and eight replicates for H3-G34V; K36me2: two replicates for H3-WT, H3-G34R, and set2Δ and five replicates for H3-G34V). For K36me3 blot, **** represents significant difference p<0.0001 from H3-WT strain. (D) Mass spectrometry-based quantification of acetylation of specific lysines in histone H4 and H3 tails in histones purified from H3-WT, H3-G34R, H3-G34V, and set2Δ strains (nine biological replicates for H3-WT, H3-G34R, and set2Δ data and six biological replicates for H3-G34V). H3K27ac analysis was excluded as highly variable. (E) Western blot analysis of H3K36ac in lysates of (3xH3) WT, and acetyltransferase mutants mst2Δ, gcn5Δ, hat1Δ, and rtt109Δ with sole copy H3-K36A negative control (anti-H3K36ac Abnova PAB31320), and total H3 as loading control. (F) In vitro histone acetylation assay using recombinant Gcn5 and recombinant WT, G34R, or G34V H3 and monitoring H3K14ac and H3K36ac. Data from each time point represents the mean ± SEM from three biological replicates.
Figure 1—figure supplement 1

Differential modification of H3K36 in H3-G34R and H3-G34V mutants.
(A) ChIP analysis of Set2-3xFLAG expressed from its endogenous locus in H3-WT, H3-G34V, and H3-G34R cells. Set2-FLAG association with act1+ and clr4+ loci is represented as % of input DNA. Data represent mean ± SEM from six biological replicates. No significant difference was found between WT and mutant H3 strains. (B) Western blot analysis of H3K36me3, H3K36me2, and total H3 in WT and epe1Δ cells using chromatin extracts. (lower) Quantification of K36 methylation levels relative to total H3. (C) Western blot analysis of specificity of H3K36ac antibodies using WT and H3-K36A chromatin extracts (Abcam ab177179, Abnova PAB31320, Rockland Immunochemicals 600–401-I89, and Thermo Fischer MA5-24672). Total H4 and H3 were used as loading controls. (D) In vitro histone acetylation assay using recombinant Gcn5 and recombinant WT, G34R, or G34V H3, monitoring H3K9, H3K18, H3K23, and H3K37 acetylation. Data for each time point represents the mean ± SEM from three biological replicates. K27ac was highly variable and was dropped from analysis. (E) Sequence flanking fission yeast H3K36 aligned with known and structurally analyzed GCN5 substrates H3K14 and H4K8. The sites of Gcn5 acetylation are shown in red, while regions making protein contacts with GCN5 in previously characterized structures are denoted in purple. Aqua denotes residues conserved among known substrates. Alignment modified from Poux and Marmorstein, 2003.
Figure 2 with 1 supplement

DNA damage sensitivity and chromosomal stability differ between H3-G34R and H3-G34V mutants.
(A) Fivefold serial dilutions showing the effect of hydroxyurea (HU; a ribonucleotide reductase inhibitor that depletes dNTPs), methyl methanesulfonate (MMS; a DNA-alkylating agent), and camptothecin (CPT; blocks topoisomerase one ligase activity) on growth of the indicated strains. (B) Effect of γ−irradiation (IR) exposure on viability of H3-WT, H3-G34R, H3-G34V, set2Δ, and H3-G34V set2Δ cells. Data represent mean ± SEM from two independent experiments using four biological replicates. (C) Serial dilution assay showing the effect of bleomycin and zeocin, two IR mimetics, on the indicated strains. (D) Serial dilution assay assessing epistasis of mutants with HR pathway. Bleomycin sensitivity of H3-WT, H3-G34V, rad51Δ, and H3-G34V rad51Δ cells (top) and MMS sensitivity of H3-WT, H3-G34R, rad51Δ, and H3-G34R rad51Δ cells (bottom). (E) Frequency of cells that lose the non-essential minichromosome Ch16 in H3-WT, H3-G34V, H3-G34R, set2Δ, and swi6Δ cells. Mean ± SEM from four to eight biological replicates is shown. ** denotes a significant difference of p<0.01 and ****p<0.0001 compared with the H3-WT strain. (F) Example of a normal anaphase and one with a lagging chromosome (red arrow) (top). Frequency of late anaphase cells with a lagging chromosome in H3-WT, G34R, G34V, set2Δ, and clr4Δ (bottom). Mean ± SEM from four to eight biological replicates. * represents significant difference of p<0.05 with the H3-WT strain.
Figure 2—figure supplement 1
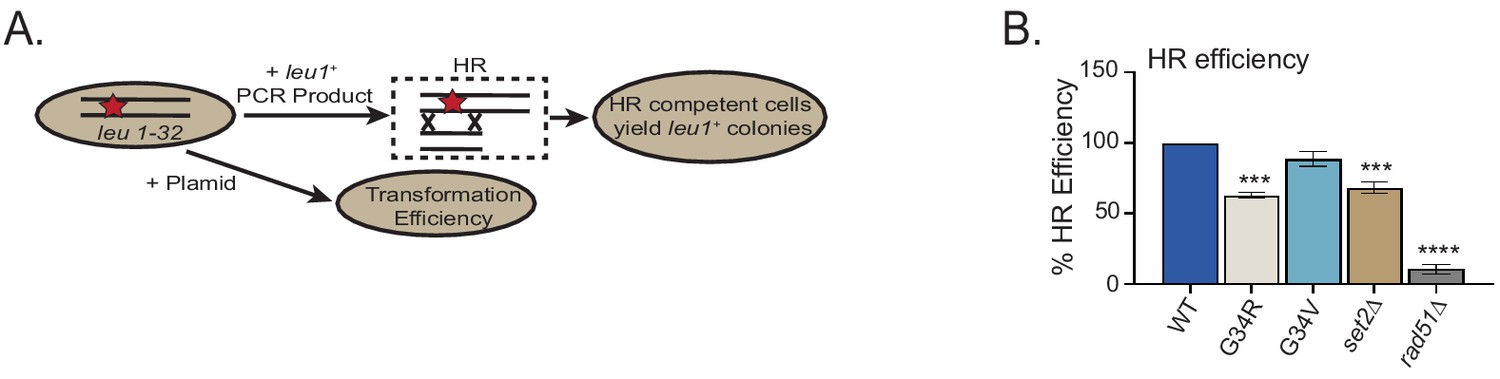
G34V exhibits no defect in HR.
(A) Diagram of the homologous recombination (HR) assay based on correction of leu1-32 mutation by HR (Yadav et al., 2017). Cells of indicated genotypes were transformed with a leu1 gene fragment to measure HR, or plasmid to measure transformation efficiency (top schematic). (B) Relative HR efficiency is shown as 100% for H3-WT, and results are averaged from three independent experiments with error bars representing ± SEM. ** reflects significant differences with H3-WT cells. ** p<0.05, *** p<0.001, and **** p<0.0001.
Figure 3
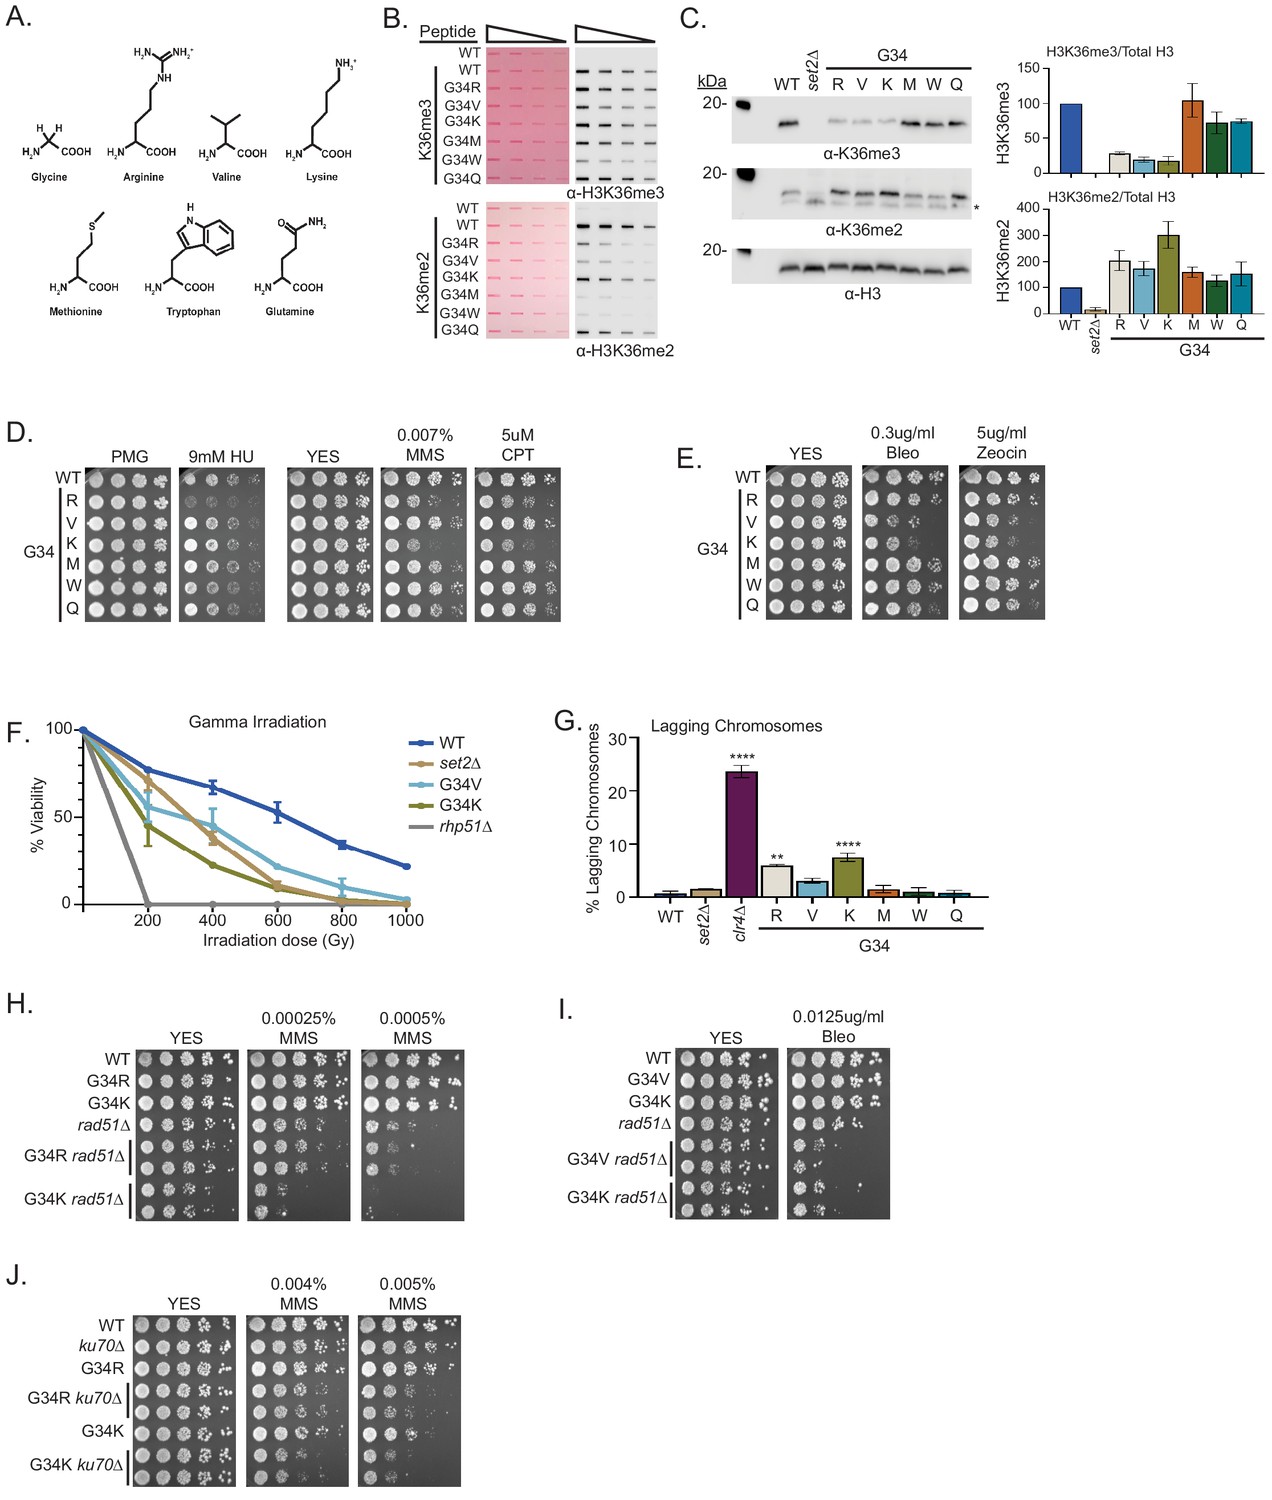
A panel of mutants at H3-G34 exhibit distinct effects on H3K36 methylation and different DNA-damage sensitivities.
(A) Structure of glycine and amino acid substitutions used in experiments. (B) Dot blot analysis to quantitatively assess recognition of WT, H3-G34R, V, K, M, W, or Q peptides bearing K36me2 or K36me3 modifications by anti-K36 methyl antibodies. Peptides were loaded in twofold serial dilutions and Ponceau staining was used as the loading control (left). (C) Western blot analysis of H3K36me3, K36me2, and total H3 in set2Δ, H3-WT, H3-G34R, V, K, M, W, and Q chromatin-fractionated cellular extracts (left). The * symbol represents a non-specific band in the H3K36me2 western. Quantification of K36 methylation levels relative to total H3 were calculated from two biological replicates (right). (D) Serial dilution yeast growth assay showing the effect of hydroxyurea (HU), methyl methanesulfonate (MMS), and camptothecin (CPT) on the indicated strains. (E) Serial dilution growth assay showing the effect of bleomycin and zeocin, two irradiation (IR) mimetics, on the indicated strains. (F) Effect of γ-IR exposure on viability of H3-WT, H3-G34R, H3-G34V, H3-G34K, set2Δ, and rad51Δ cells. Data represent mean ± SEM from eight biological replicates. (G) IF analysis of lagging chromosomes in the indicated strains from three independent experiments. % lagging chromosomes represents the percentage of lagging chromosomes in anaphase cells counted. Over 200 anaphase cells were counted for each strain. ** represents significant difference of p<0.001 and **** a significant difference of p<0.0001 with H3-WT strain. (H) Serial dilution growth assay testing epistasis of H3G34R and H3G34K with HR pathway mutant rad51Δ cells. (I) Serial dilution growth assay testing epistasis of H3-G34V with rad51Δ HR-deficient cells. (J) Serial dilution growth assay testing epistasis of H3-G34R and H3-G34K with ku70Δ NHEJ-deficient cells.
Figure 4
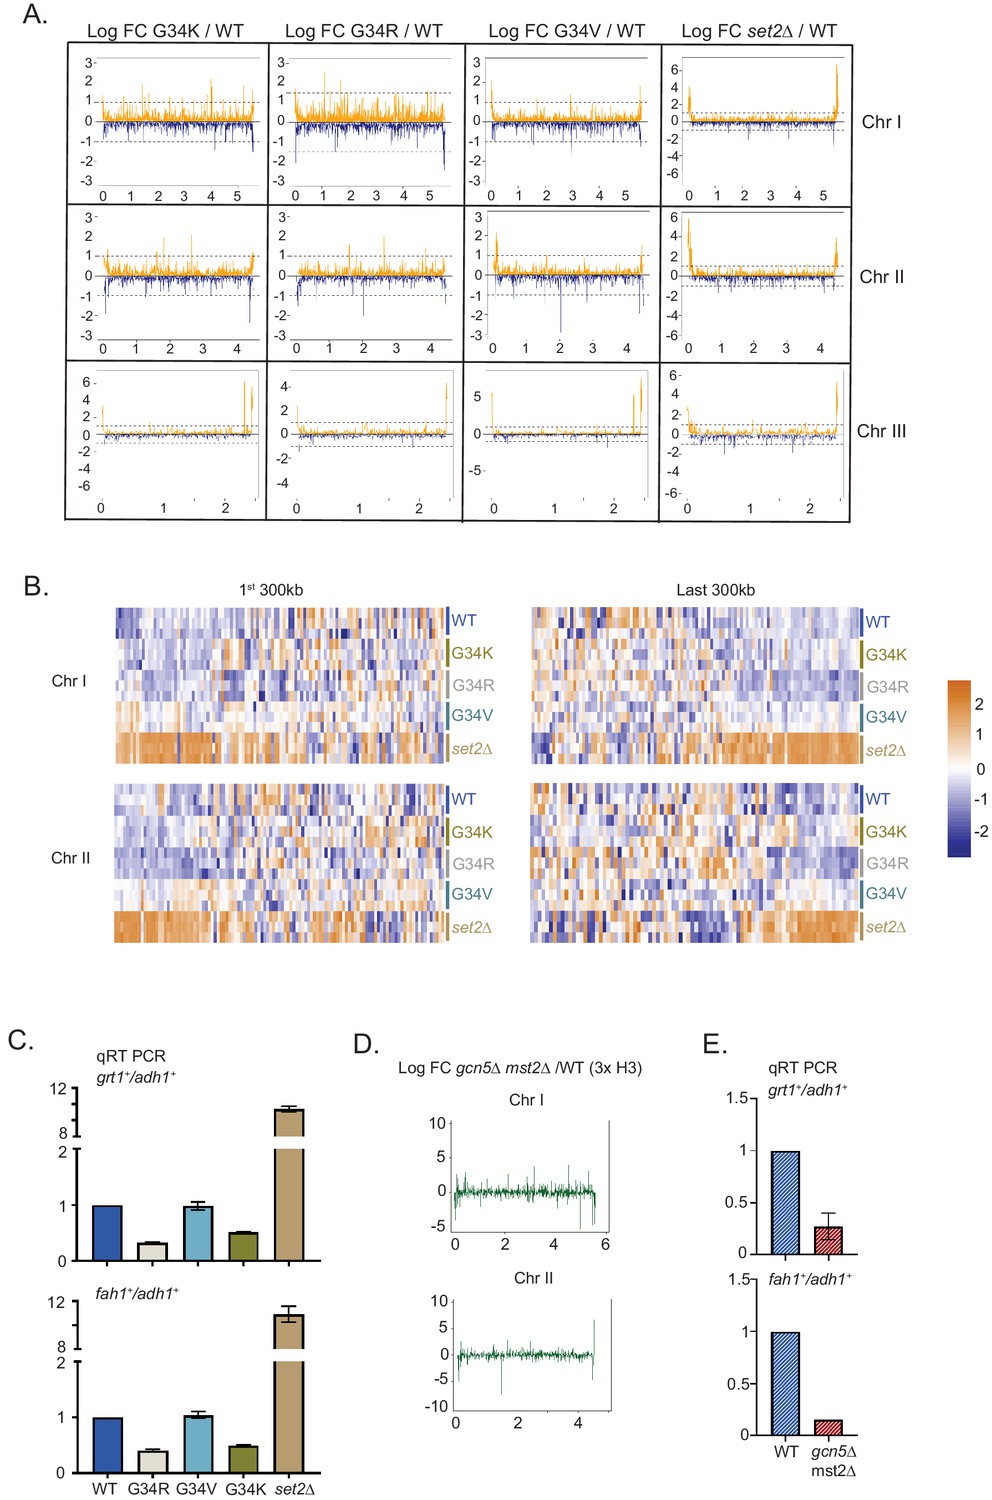
Distinct transcriptional outcomes for H3-G34 mutants: substitution with basic residues suppressing some subtelomeric transcripts, as seen in strains deficient in H3 K36 acetylation.
(A) RNA-seq profiles for chromosomes I, II, and III comparing Logfold change ratios for H3-G34K/H3-WT, H3-G34V/H3-WT, H3-G34R/H3-WT, or set2Δ/H3-WT plotted against chromosome coordinates. (B) Zoomed-in regions of Chr I (first 300 Kb and last 300 Kb, top) and Chr II (first 300 Kb and last 300 Kb, bottom) showing Z scores of log2 CPM for individual biological replicates. (C) qRT-PCR validation of ST genes fah1+ and grt1+ expression relative to adh1+ expression from two independent biological replicates. Samples were normalized to the WT-H3 strain. Subtelomeric transcripts in H3-G34R and H3-G34K are repressed compared with H3-WT and upregulated in set2Δ. (D) Chromosome-wide plots of transcriptional regulation in gcn5Δmst2Δ cells (3xH3) compared with wild type for Chr I and Chr II. Data reanalyzed from Nugent et al., 2010. (E) qRT-PCR validation of fah1+ and grt1+ expression relative to adh1+ expression from two independent biological replicates. Samples were normalized to the WT-H3 strain. Subtelomeric transcripts in gcn5Δmst2Δ cells (3xH3) are reduced compared with wild type.
Figure 5 with 1 supplement
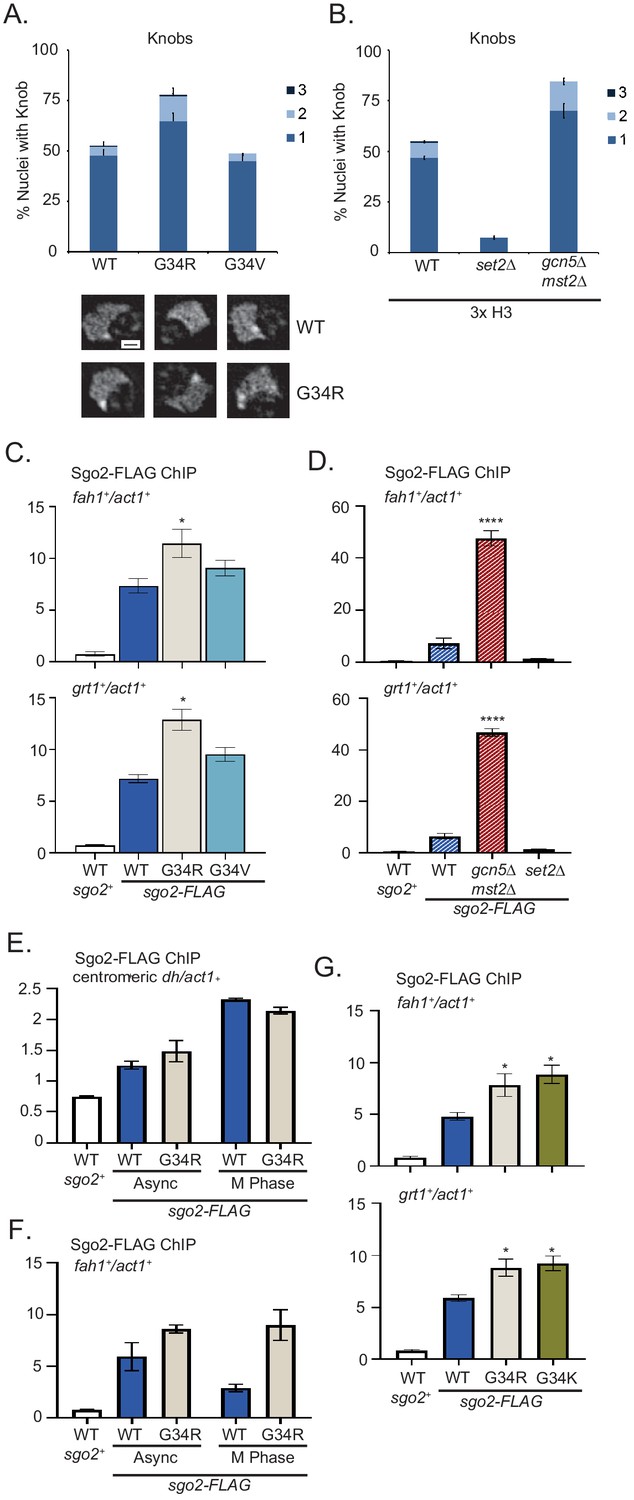
Formation of knobs of highly condensed chromatin is enhanced in G34R and K36 acetyltransferase mutants, correlating with enhanced recruitment of Shugoshin to repressed subtelomeric domains.
(A) Frequency of subtelomeric knob formation observed in H3-WT, H3-G34R, and H3-G34V cells. The number of knobs in a nucleus is shown. Data plots represent mean ± SEM from three independent biological replicates, counting ~200 total nuclei per strain (upper). Example of nuclear knobs observed in WT and H3-G34; scale bar indicates 0.5 µm (bottom). (B) Frequency of subtelomeric knob formation observed in WT, set2Δ, and gcn5Δmst2Δ cells (all 3xH3) with the number of knobs in a nucleus shown. Data plots represent mean ± SEM from three independent biological replicates, counting ~200 total nuclei per strain. (C–F) ChIP analysis of Sgo2-FLAG association with the subtelomeric fah1+ and grt1+ loci in (C) H3-WT, H3-G34R, and H3-G34V cells normalized to act1+. Data were collected and plotted as the mean of six biological replicates ± SEM. * represents a significance of p<0.05 compared with the H3-WT strain. (D) Sgo2-FLAG ChIP in (3xH3) WT, set2Δ, and gcn5Δmst2Δ cells normalized to act1+. Data are the mean of four biological replicates ± SEM. **** represents a significance of p<0.0001 compared with the WT strain. (E–F) Sgo2-FLAG ChIP at the centromeric dh sequences (E) or subtelomeric fah1+ gene (F) in asynchronous or mitotically arrested nda3 mutant cells with sole copy H3-WT or H3-G34R (six replicates), and (G) Sgo2-FLAG ChIP in H3-G34K cells normalized to act1+. Data represents the mean of six biological replicates ± SEM. * represents a significance of p<0.05 compared with the H3-WT strain.
Figure 5—figure supplement 1
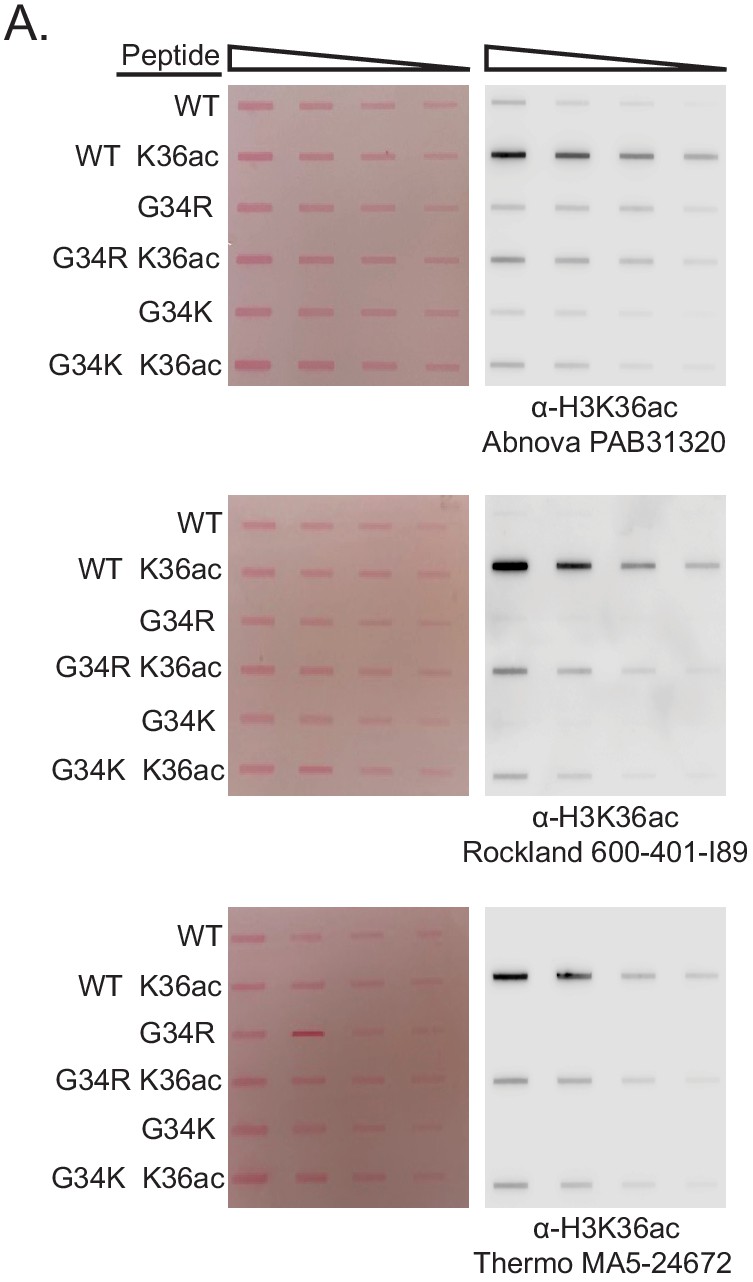
Determining the effect of G34 substitution on antibody recognition of K36ac.
(A) Slot blot analysis to quantitatively assess whether anti-K36 acetyl antibodies equivalently recognize WT, H3-G34R, or H3-G34K peptides bearing H3K36ac modification. Peptides were loaded in twofold serial dilution. Antibodies tested: Abnova PAB31320, Rockland Immunochemicals 600–401-I89, and Thermo Fischer MA5-24672. Ponceau-stained blots were used as the loading control (left).
Figure 6 with 1 supplement

Dominance of hydroxyurea (HU) sensitivity, homologous recombination (HR) defects and subtelomeric silencing in strains co-expressing H3-G34R and WT H3.
(A) Western blot quantification of H3K36me2 and H3K36me3 normalized to total H3 in H3-WT, H3-G34R, H3-G34V, and H3-G34K chromatin extracts in both mixed H3 backgrounds (H3.1/H3.3 WT and H3.2 mutant) and sole copy H3 backgrounds. H3K36me2 and H3K36me3 methylation levels relative to total H3 were calculated from two biological replicates. (B) Mass spectrometry-based quantification of acetylation of H3K36 on histones purified from H3-WT (3xH3) and H3-G34R (mixed 3xH3 background) from four biological replicates. (C) Fivefold serial dilution growth assays showing the effect of HU, methyl methanesulfonate, and camptothecin on the indicated 3xH3 strains. (D) Serial dilution growth assay showing the bleomycin and zeocin sensitivity of H3-WT, rad51Δ, H3-G34V, and H3G34K 3xH3 cells. (E) Frequency of late anaphase cells that show a lagging chromosome in 3xH3 strains: WT, clr4Δ, H3-G34R, and H3-G34K. Mean ± SEM from four to eight replicates. **** represents a significance of p<0.0001 with the H3-WT strain. (F) HR assay based on correction of leu1-32 mutation by HR as shown in Figure 2—figure supplement 1. Relative HR efficiency is shown as 100% for H3-WT (3xH3), and results are averaged from three independent experiments with error bars representing SEM. ** p<0.005 and **** p<0.0001 reflect significant differences with H3-WT cells. (G) RNA-seq profiles for chromosomes I, II, and III comparing Logfold change ratios for H3-G34R/H3-WT and H3-G34K/H3-WT plotted against chromosome coordinates. Three biological replicates used for each strain, and all strains contain three copies of H3. (H) qRT-PCR validation of fah1+ and grt1+ expression relative to adh1+ expression from two independent biological replicates. Samples were normalized to the WT-H3 strain and shown as the mean ± SEM. Subtelomeric transcripts in H3-G34R and H3G34K cells (3xH3) are reduced when compared with WT.
Figure 6—figure supplement 1

H3G34R exerts dominance over HU sensitivity, and both G34R and G34K dominantly suppress subtelomeric transcripts.
(A) Replicate serial dilution growth assays to demonstrate HU sensitivity of G34R (3xH3) mixed background strain. (B) Overlap in gene expression profiles between H3-G34R sole copy and H3-G34R (3xH3) mixed copy strains relative to appropriate WT strains (left) and H3-G34K sole copy and H3-G34K (3xH3) mixed copy strains relative to WT strains (right) with cutoffs of p<0.05 applied. The majority of gene expression changes seen in triple copy strains are in common with those in single copy strains. .
Tables
Key resources table
| Reagent type (species) or resource | Designation | Source or reference | Identifiers | Additional information |
|---|---|---|---|---|
| Gene (Schizosaccharomyces pombe) | hht2+; H3.2 | Pombase | Pombase: SPBC8D2.04 | |
| Strain, strain background (Escherichia coli) | BL21(DE3) | Sigma—Aldrich | CMC0016 | Electrocompetent cells |
| Antibody | Anti-histone H3 (rabbit polyclonal) | Active motif | 39163 | WB. (1:1000) |
| Antibody | Anti-histone H3 (rabbit polyclonal) | Abcam | Ab1791 | WB. (1:1000) |
| Antibody | Antihistone H4 (rabbit monoclonal) | Millipore | 05–858, lot 2020541 | WB. (1:1000) |
| Antibody | Anti-FLAG M2 (mouse monoclonal) | Sigma | F1804 | WB. (1:1000) |
| Antibody | Anti-tubulin (mouse monoclonal) | Gift from Keith Gull, Woods et al., 1989 | TAT1 | IF (1:100) |
| Antibody | Anti-H3K36me2 (rabbit polyclonal) | Abcam | Ab9049 | WB. (1:1000) |
| Antibody | Anti-H3K36me3 (rabbit polyclonal) | Abcam | Ab9050 | WB. (1:1000) |
| Antibody | Anti-H3K36me3 (rabbit monoclonal) | Cell Signalling Technology | 4909 | WB. (1:1000) |
| Antibody | Anti-H3K36ac (rabbit monoclonal) | Abcam | Ab177179 | WB. (1:1000) |
| Antibody | Anti-H3K36ac (rabbit polyclonal) | Abnova | PAB31320 | WB. (1:1000) |
| Antibody | Anti-H3K36ac (rabbit polyclonal) | Rockland | 600–401-I89 | WB. (1:1000) |
| Antibody | Anti-H3K36ac (rabbit monoclonal) | Thermo Fischer | MA5-24672 | WB. (1:400) |
| Recombinant DNA reagent | leu1+ plasmid | Yadav et al., 2017. | JP1050 | Integration plasmid for leu1+ |
| Recombinant DNA reagent | 6xHis-Gcn5-FLAG in pET28a | This paper. Synth by GenScript. | E. coli expression vector JP-2587. Codon optimized | For recombinant expression of fission yeast Gcn5. See plasmid DNA in Mat. and Meth. |
| Recombinant DNA reagent | 6xHIS-H3 in pCDF duet | This paper. Synth by GenScript | E. coli expression vector JP-2395 | For recombinant expression of fission yeast H3. See plasmid DNA in Mat. And Meth. |
| Recombinant DNA reagent | 6xHIS-H3-G34R in pCDF duet | This paper | E. coli expression vector JP-2489 | For recombinant expression of fission yeast H3-G34R. See Mat. and Meth. |
| Recombinant DNA reagent | 6xHIS-H3-G34V in pCDF duet | This paper | E. coli expression vector JP-2490 | For recombinant expression of fission yeast H3-G34V. See Mat. And Meth. |
| Recombinant DNA reagent | 6xHIS-H3-G34K in pCDF duet | This paper | E. coli expression vector JP-2902 | For recombinant expression of fission yeast H3-G34K. see Mat. And Meth. |
| Sequence-based reagent | JPO-183 | Yadav et al., 2017 | PCR primers for leu1 fragment | GATTTCTGGTCATTTACGTTACTGTA |
| Sequence-based reagent | JPO-3480 | Yadav et al., 2017 | PCR primers for leu1 fragment | ATCGACACCTTCAACGATTTC |
| Commercial assay or kit | TruSeq Stranded Total RNA library Prep kit | Illumina | 20020599 | |
| Commercial assay or kit | Ribo-zero Gold rRNA removal kit (yeast) | Illumina | MRZY1324 | Discontinued |
| Commercial assay or kit | RNeasy mini kit | Qiagen | 74104 | |
| Commercial assay or kit | ERCC RNA spike in control | Invitrogen | 4456740 | For normalization of RNAseq |
| Chemical compound, drug | Hydroxyurea | Sigma | H8627 | |
| Chemical compound, drug | Methyl methanesulfonate | Acros Organics | 66-27-3 | |
| Chemical compound, drug | Camptothecin | Sigma | C9911 | |
| Chemical compound, drug | Bleomycin sulfate | Research Products International | B40060 | |
| Chemical compound, drug | Zeocin | Invitrogen | R25001 | |
| Chemical compound, drug | Trypsin | Promega | V5111 | For trypsin digestion of histones |
| Chemical compound, drug | Propionic anhydride | Sigma | 8006080100 | For propionylation of histones |
| Software, algorithm | Xcalibur | Thermo | Version 2.1 | MS peak integration |
| Software, algorithm | GraphPad Prism | Prism | Version 7.03, version 8 | Used at St. Jude, Fox Chase respectively |
| Software, algorithm | 3D-SIM reconstruction software | Global Life Sciences Solutions Operations | softWoRx 7.0.0 | Using a homemade optical transfer function |
| Software, algorithm | STAR | Dobin et al., 2013 | Version 2.5.3a | RNAseq analysis |
| Software, algorithm | Subread R package | Liao et al., 2019 | RNAseq analysis | |
| Software, algorithm | Limma/ Voom | Law et al., 2014; Ritchie et al., 2015 | RNAseq analysis | |
| Other | Formaldehyde | Polysciences Inc | 18814–20 | For 3D-SIM |
| Other | Zymolyase 100T | Nacalai tesque, Japan | 07665–55 | For 3D-SIM |
| Other | Glycerol | Fuji Film Wako, Japan | 076–00641 | For 3D-SIM |
| Other | Cover glass | Matsunami, Japan | No. 1S | For 3D-SIM |
| Other | 3D-SIM microscope | Global Life Sciences Solutions Operations | DeltaVision|OMX Version 3 | With a custom 100x UPlanSApo NA1.35 silicone immersion objective lens and a tube lens with a focal length of 75 mm |
Additional files
-
Supplementary file 1
Strain list.
- https://cdn.elifesciences.org/articles/65369/elife-65369-supp1-v2.xlsx
-
Supplementary file 2
Peptides used for antibody characterization and for mass spectrometry calibration.
- https://cdn.elifesciences.org/articles/65369/elife-65369-supp2-v2.docx
-
Supplementary file 3
Detection parameters of unique tryptic peptides from S. pombe H3.
- https://cdn.elifesciences.org/articles/65369/elife-65369-supp3-v2.docx
-
Supplementary file 4
RNA-seq data.
- https://cdn.elifesciences.org/articles/65369/elife-65369-supp4-v2.xlsx
-
Transparent reporting form
- https://cdn.elifesciences.org/articles/65369/elife-65369-transrepform-v2.docx
Download links
A two-part list of links to download the article, or parts of the article, in various formats.
Downloads (link to download the article as PDF)
Open citations (links to open the citations from this article in various online reference manager services)
Cite this article (links to download the citations from this article in formats compatible with various reference manager tools)
Surprising phenotypic diversity of cancer-associated mutations of Gly 34 in the histone H3 tail
eLife 10:e65369.
https://doi.org/10.7554/eLife.65369


