Humans optimally anticipate and compensate for an uneven step during walking
- Faculty of Kinesiology, University of Calgary, Canada
Figures
Figure 1
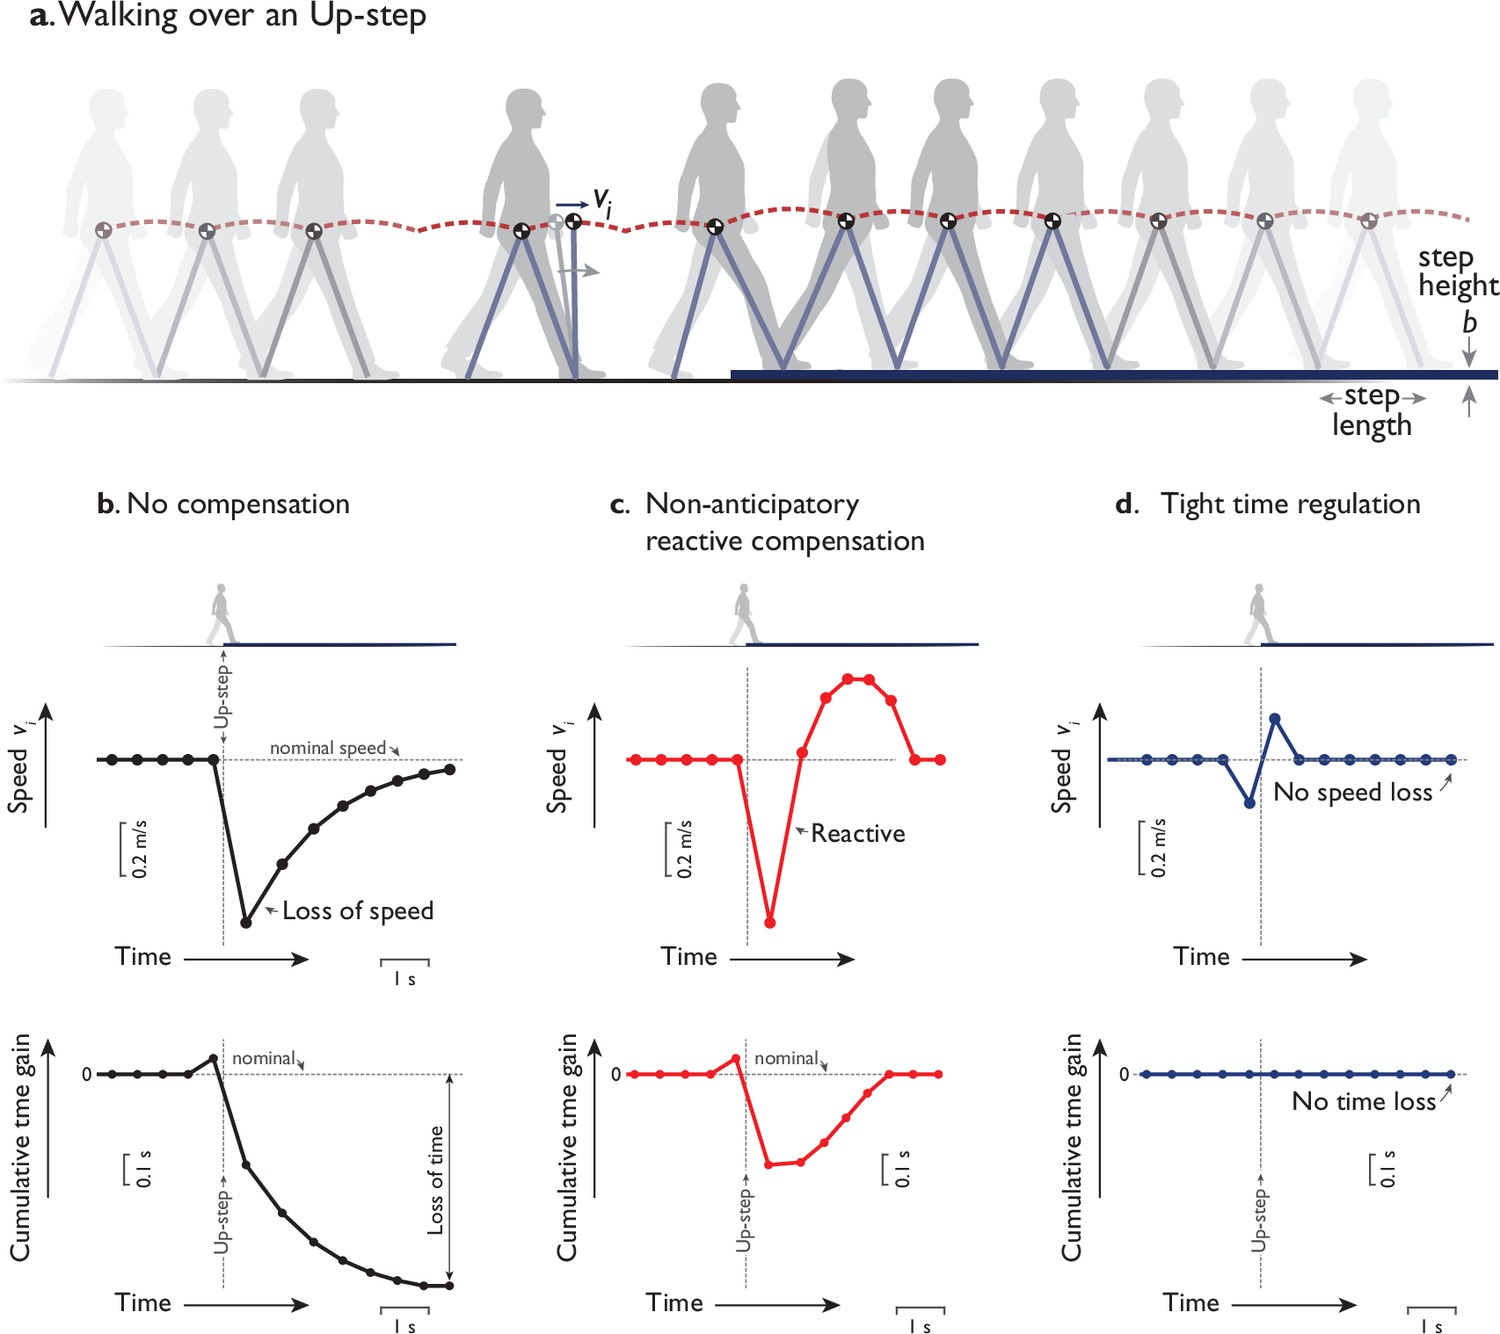
Hypothetical ways to walking over a single upward step (Up-step).
(a) Humans walk with the body center of mass (COM) moving up and down atop the stance leg behaving like an inverted pendulum. Momentum is disrupted by the Up-step if not for compensatory response, plotted as a time-varying trajectory of the COM’s forward speed , discretely sampled once per step . Hypothetical responses could include (b) no compensation, (c) a nonanticipatory reactive compensation, and (d) tight time regulation. (b) No compensation means the same push-off actuation is performed regardless of Up-step, resulting in a transient loss of speed (speed vs. time, top) and time (cumulative time gain vs. time, bottom) relative to nominal level gait. (c) Nonanticipatory compensation occurs reactively after the perturbation (vertical dotted line aligned to Up-step) to quickly regain speed, perhaps to avoid loss of time. (d) Tight time regulation means applying control to keep each step’s timing as constant as possible to reject the disturbance. These responses could be less economical than an optimal control including anticipatory speed adjustments before and after the perturbation. In plots, speed is sampled discretely at midstance instant (dot symbols) and plotted vs. time. Cumulative time gain is illustrated as time gained or lost compared to steady-level gait at nominal speed, as a function of elapsed time during a walking bout. The final value indicates the eventual time gain (or loss, if negative) over the entire distance. In the corresponding experiment, human subjects walked in a walkway (30 m long) with level ground ora single Up- or Down-step (height = 7.5 cm) at midpoint.
Figure 2
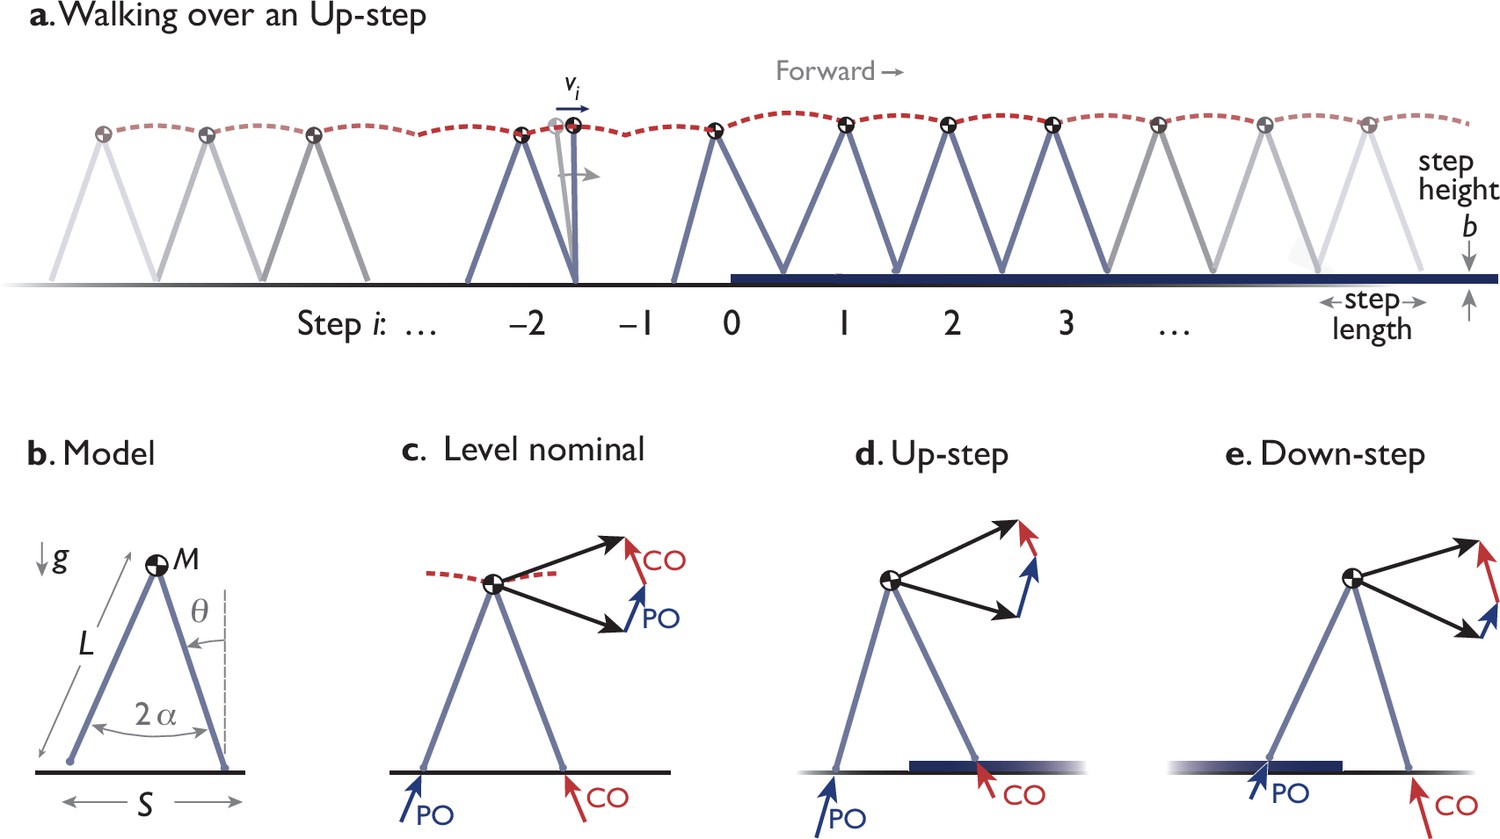
Model of dynamic walking over a single Up- (or Down-) step.
(a) Model behaves like an inverted pendulum. Momentum and speed fluctuate in each step (numbered ), and are particularly disrupted by an uneven step (at ). (b) Dynamic walking model has a point mass at pelvis, supported by an inverted pendulum stance leg (massless, length , gravitational acceleration , fixed or constrained step length and inter-leg angle ). (c) Level nominal walking has discrete step-to-step transition where COM velocity (dark arrow) is redirected from forward-and-downward to forward-and-upward by active, impulsive trailing leg push-off (PO), immediately followed by an inelastic, impulsive, leading leg collision (CO). Both PO and CO are directed along the corresponding leg. (d, e) The model walks Up or Down a step by modulating the sequence of discrete push-offs surrounding and including the uneven step. The model’s compensatory response is therefore summarized as a time-varying trajectory of speeds , discretely sampled once per step .
Figure 3
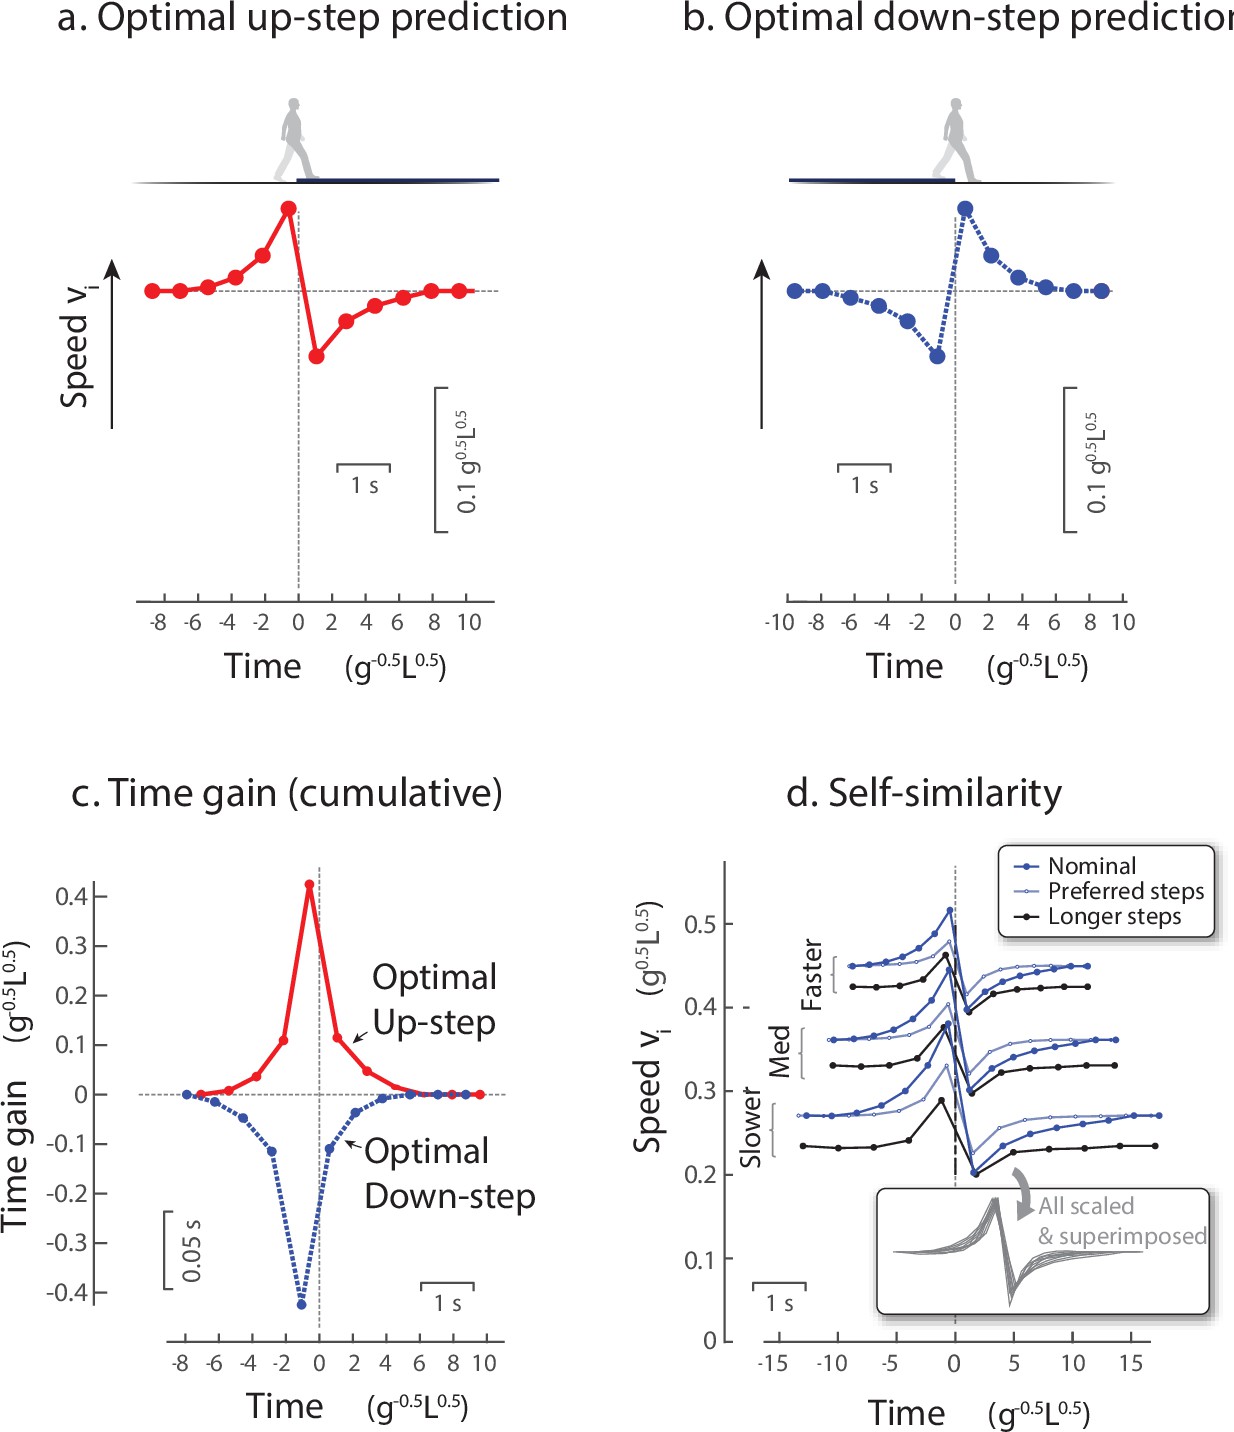
Model predictions for walking over an Up-step or Down-step with minimum work.
(a) Optimal walking speed fluctuations vs. time, for Up-step compensation that minimizes push-off work while avoiding loss of time. Model anticipates the perturbation with a tri-phasic adjustment: Speed up ahead of time, then lose momentum atop the perturbation, and then regain speed thereafter. (b) Optimal speed fluctuations for Down-step compensation (blue symbols) is also tri-phasic, and nearly opposite in sign to Up-step: Slow down in advance, gain momentum, then slow down again (c) Cumulative time gained for Up- and Down-step compensations, ending with zero cumulative time loss. (d) Self-similarity of Up-step compensations shows that a similarly-shaped discrete compensation pattern can apply to different walking conditions with appropriate scaling. Example trajectories are shown for three different nominal speeds (slower, medium, faster), a longer fixed step length at each nominal speed (longer steps), and step length increasing with instantaneous speed according to human preferred step length (preferred steps). The trajectories are also scaled and superimposed (see inset) to illustrate a single self-similar pattern for all parameter choices. For model predictions (a-c), nominal conditions are equivalent to a human walking at 1.5 m/s with a fixed step length, and a 7.5 cm Up-step. Plots show normalized units (nominal mid-stance velocity ) and human scale. Predictions are described in detail by (Darici et al., 2020).
Figure 4
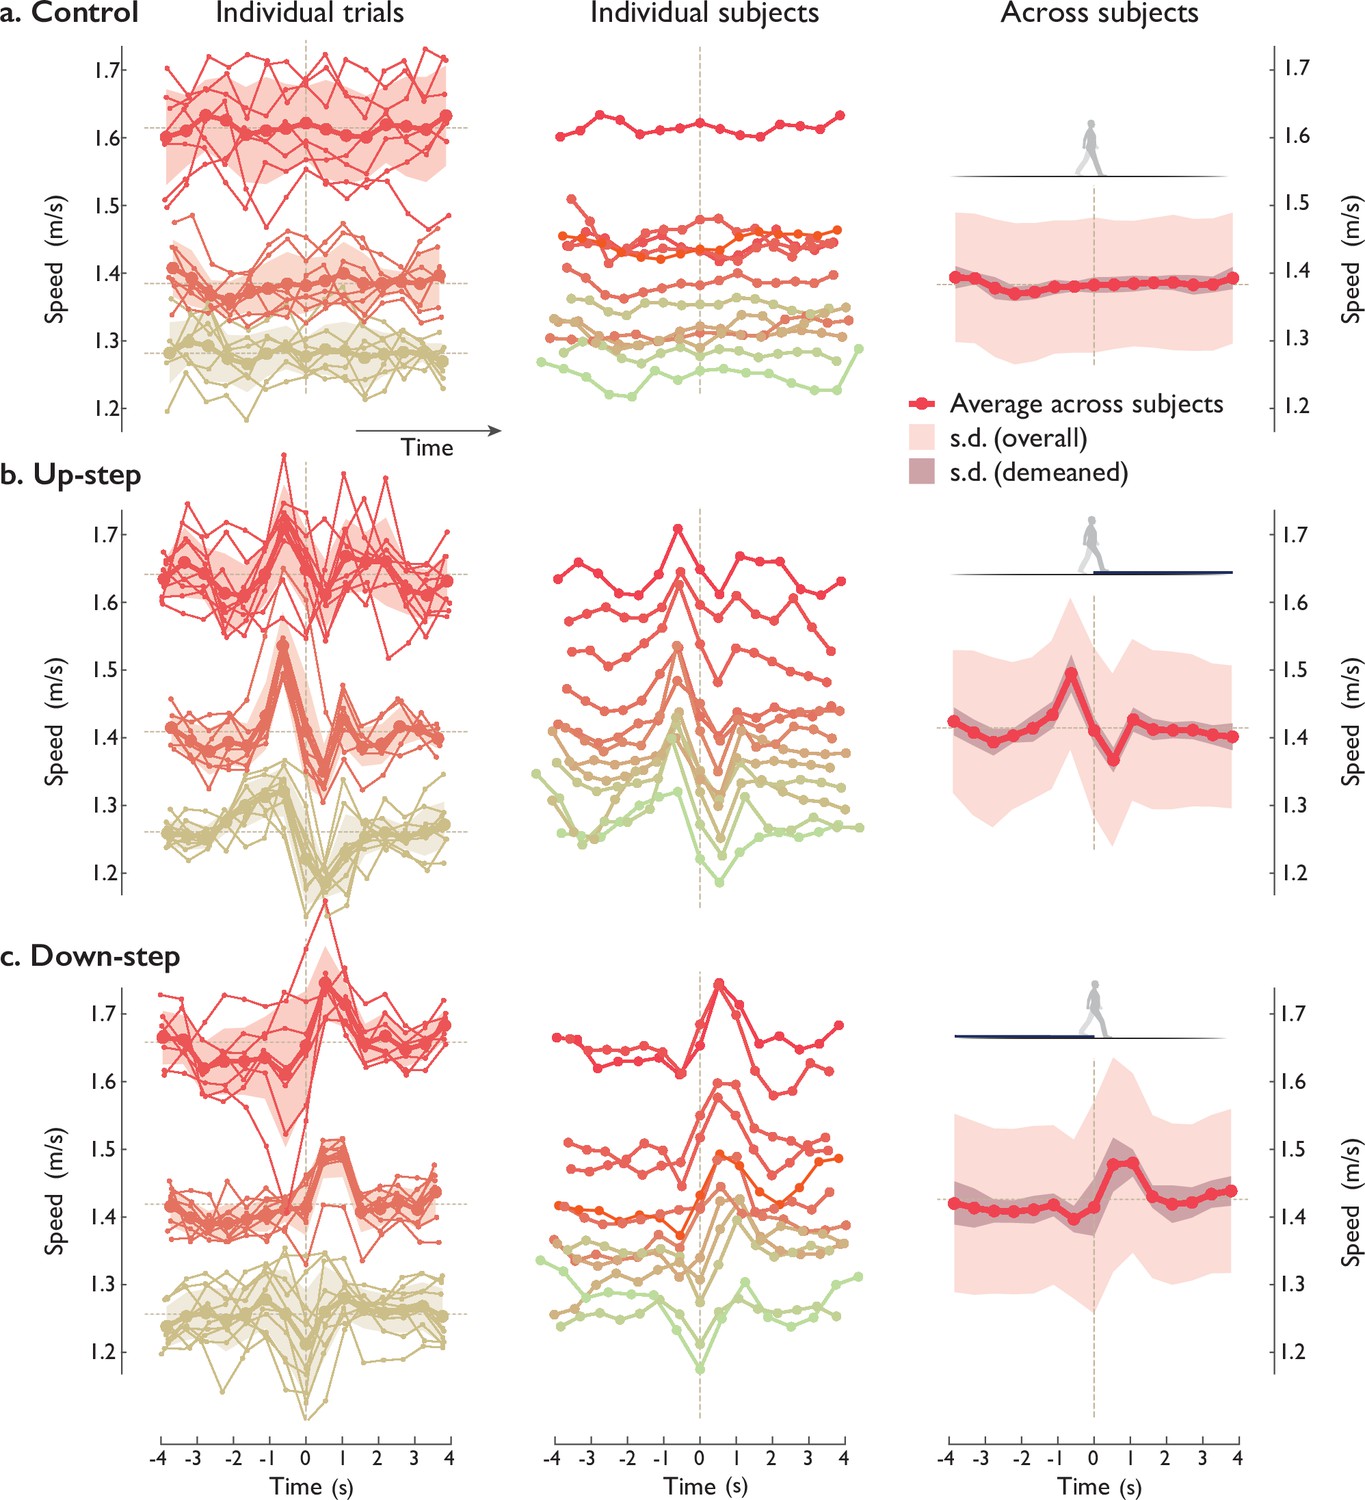
Human walking speed trajectories vs. time, for (a) Control and (b) Up- and (c) Down-step conditions.
Plots are arranged in columns: (left) all individual trials of three representative test subjects (thin lines connecting small dots), along with per-subject average trajectories (across trials, thick lines) and standard deviations (SDs, shaded regions ± 1 s.d.; dashed line indicates average speed). Averages were computed for speed fluctuations treated as sequences of discrete steps, and plotted in both discrete (dot symbols) and continuous time. (Middle:) Speed fluctuations of each test subject (n = 2, individual colors) walking over the step, averaging all trials within each subject. (Right:) Average speed trajectories across all test subjects (solid line), with standard deviation (SD) across all subjects (light shaded region), and SD ignoring subject-dependent speed (darker shaded region). Individual patterns (Middle) were significantly correlated with the average pattern across subjects (Right). Speed is defined as each step’s length divided by corresponding step time, assigned to the middle- stance instant of each step (indicated by discrete dot symbols). All trials are aligned to zero time, defined as middle -stance instant after landing on the Up- or Down-step (both 7.5 cm high).
-
Figure 4—source data 1
Individual and average test subject speeds plotted in Figure 4.
- https://cdn.elifesciences.org/articles/65402/elife-65402-fig4-data1-v2.rar
Figure 5

Comparison of model and human walking speed fluctuations vs. time, compensating for (left column:) Up- and (right column:) Down-steps.
(Top row:) Model speed fluctuations predicted to minimize push-off mechanical work. (Bottom row:) Experimentally measured compensation strategies for humans (n = 12), showing average speed pattern across subjects (shaded regions denote ±1 s.d. after eliminating variations in average speed). Human speed fluctuations were significantly correlated with model for both Up-step and Down-step , asterisk indicates statistical significance; correlations performed between discrete speed sequences. Each data point corresponds to the body’s forward walking speed, defined as each step’s length divided by step time, and assigned to the instance when the stance leg is upright. The first step onto the Up- or Down-step is indicated by vertical dashed line, also at middle stance instant. The average overall walking speed is denoted by horizontal solid line. Model trajectories (Figure 3) are converted from mid-stance speed in simulation (dashed lines) into the equivalent of experimental body speed (solid lines; see Figure 6). Model predicts shape of fluctuation pattern but not exact amplitude. Plots show dimensional equivalents to model with speed in units of and time in units (using gravitational acceleration and human leg length ).
Figure 6
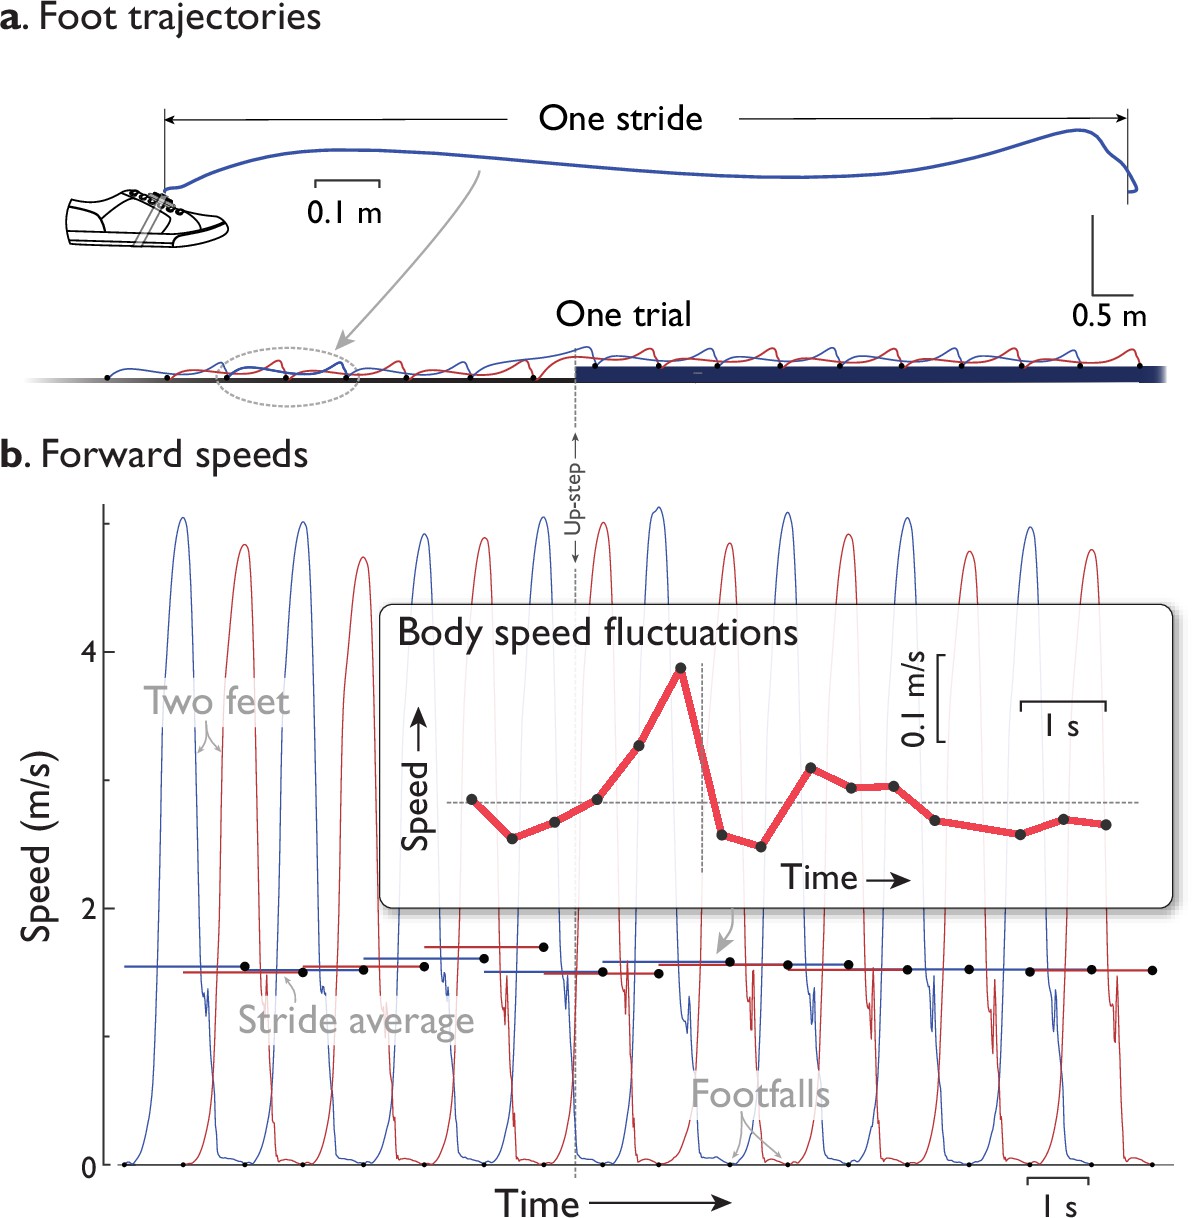
Experimental measurement of forward walking speed from inertial data (representative data).
(a) Foot trajectories in space are computed from inertial measurement unit (IMU) data. Shown are representative sagittal plane trajectory for one foot’s motion during a stride, and the individual strides for both feet during an Up-step trial (with 2× vertical scale for trial). Trajectories were integrated from an IMU atop each foot, where drift was reduced by detecting footfall instances (black dots) where the foot was stationary, and correcting the integrated velocity to zero at those instances (Rebula et al., 2013). (b) Forward speed vs. time for each foot and for the body. Each foot’s instantaneous forward speed was computed from the spatial trajectories. The average speed during each stride (‘stride average’, filled symbols) was determined, equal to the distance traveled divided by the stride duration. This was then treated as the body speed for each step (inset figure, filled symbols are same as stride averages), sampled discretely from each foot’s strides at the respective footfall instances. The fluctuations in body speed were compared with model predictions.
Appendix 2—figure 1
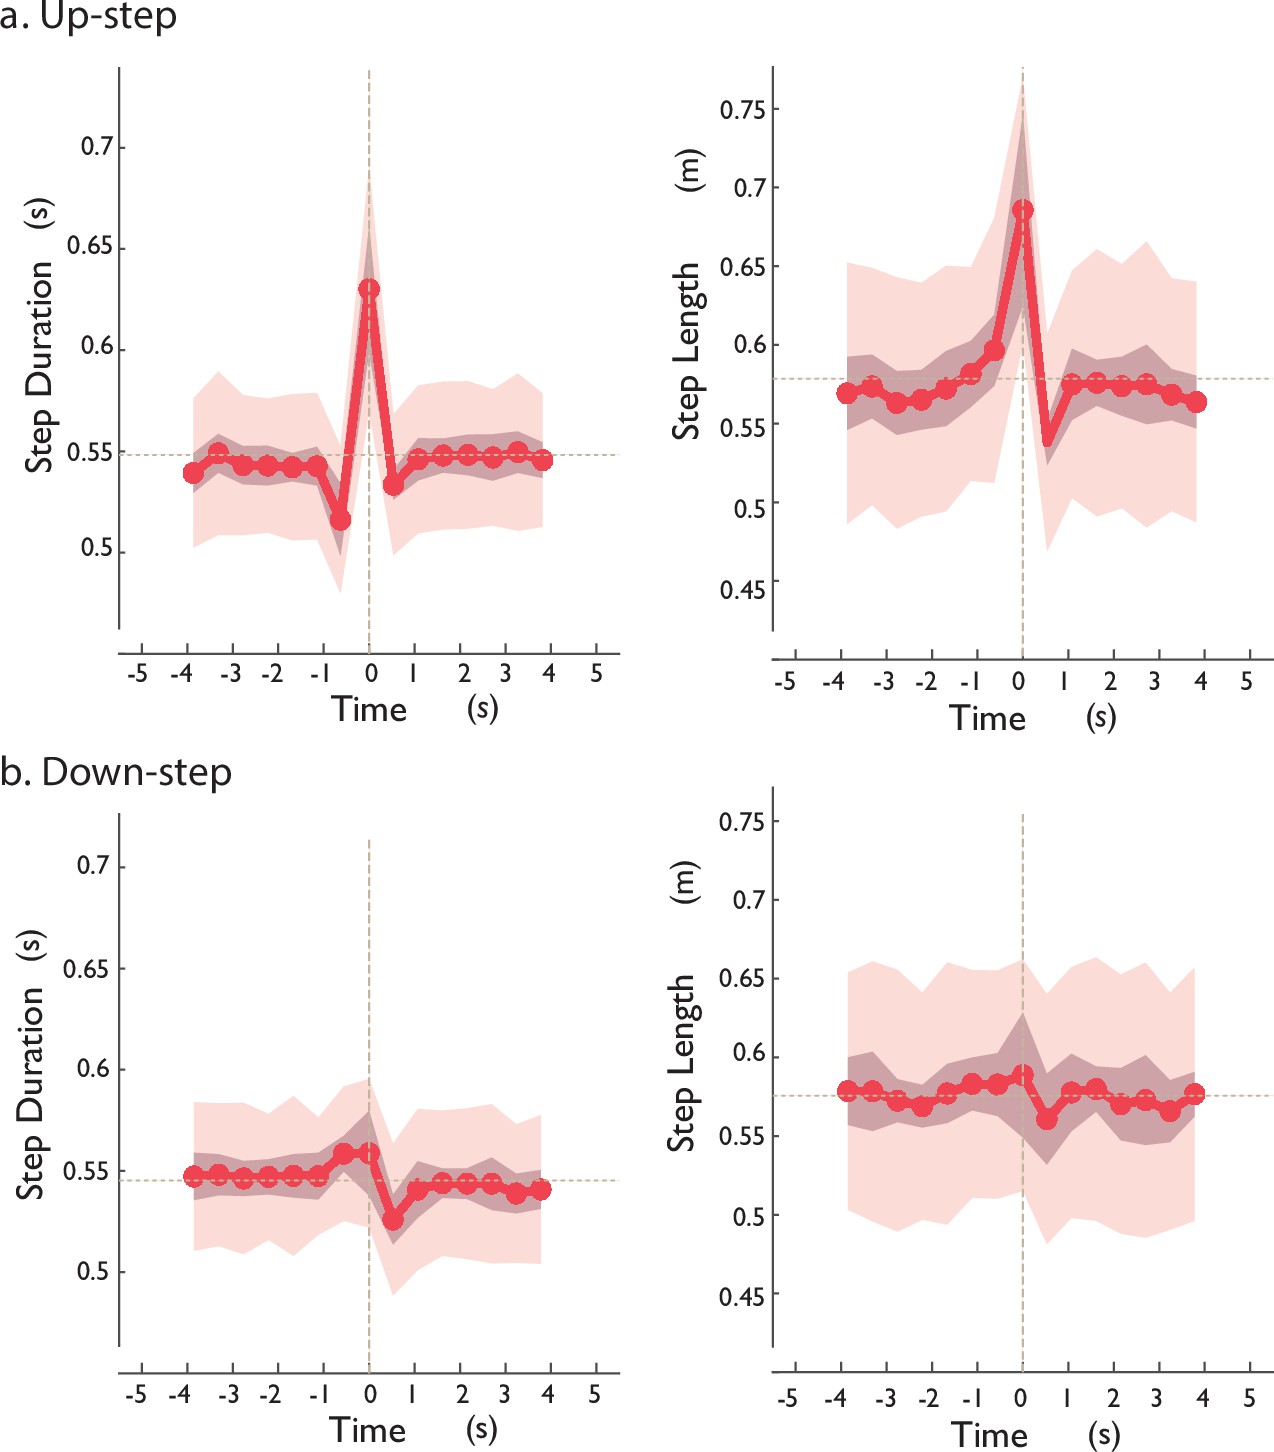
Human (left column) empirical step duration and (right column) step length fluctuations vs. time, for (a) Up-step and (b) Down-step.
Shown are step durations and step lengths for each step (line denotes mean across subjects, shaded area denotes ±1 SD; N = 12) vs. time, with vertical line denoting the step onto the perturbation. The human speed fluctuations (Figure 4) appeared to be achieved by transiently changing a combination of step durations and step lengths. Each discrete speed is defined as each step’s corresponding step length divided by duration.
Additional files
Download links
A two-part list of links to download the article, or parts of the article, in various formats.
Downloads (link to download the article as PDF)
Open citations (links to open the citations from this article in various online reference manager services)
Cite this article (links to download the citations from this article in formats compatible with various reference manager tools)
Humans optimally anticipate and compensate for an uneven step during walking
eLife 11:e65402.
https://doi.org/10.7554/eLife.65402


