Localization, proteomics, and metabolite profiling reveal a putative vesicular transporter for UDP-glucose
- School of Life Sciences, Tsinghua University, China
- State Key Laboratory of Membrane Biology, Peking University School of Life Sciences, China
- PKU-IDG/McGovern Institute for Brain Research, China
- Peking-Tsinghua Center for Life Sciences, China
- Chinese Institute for Brain Research, China
Figures
Figure 1 with 1 supplement
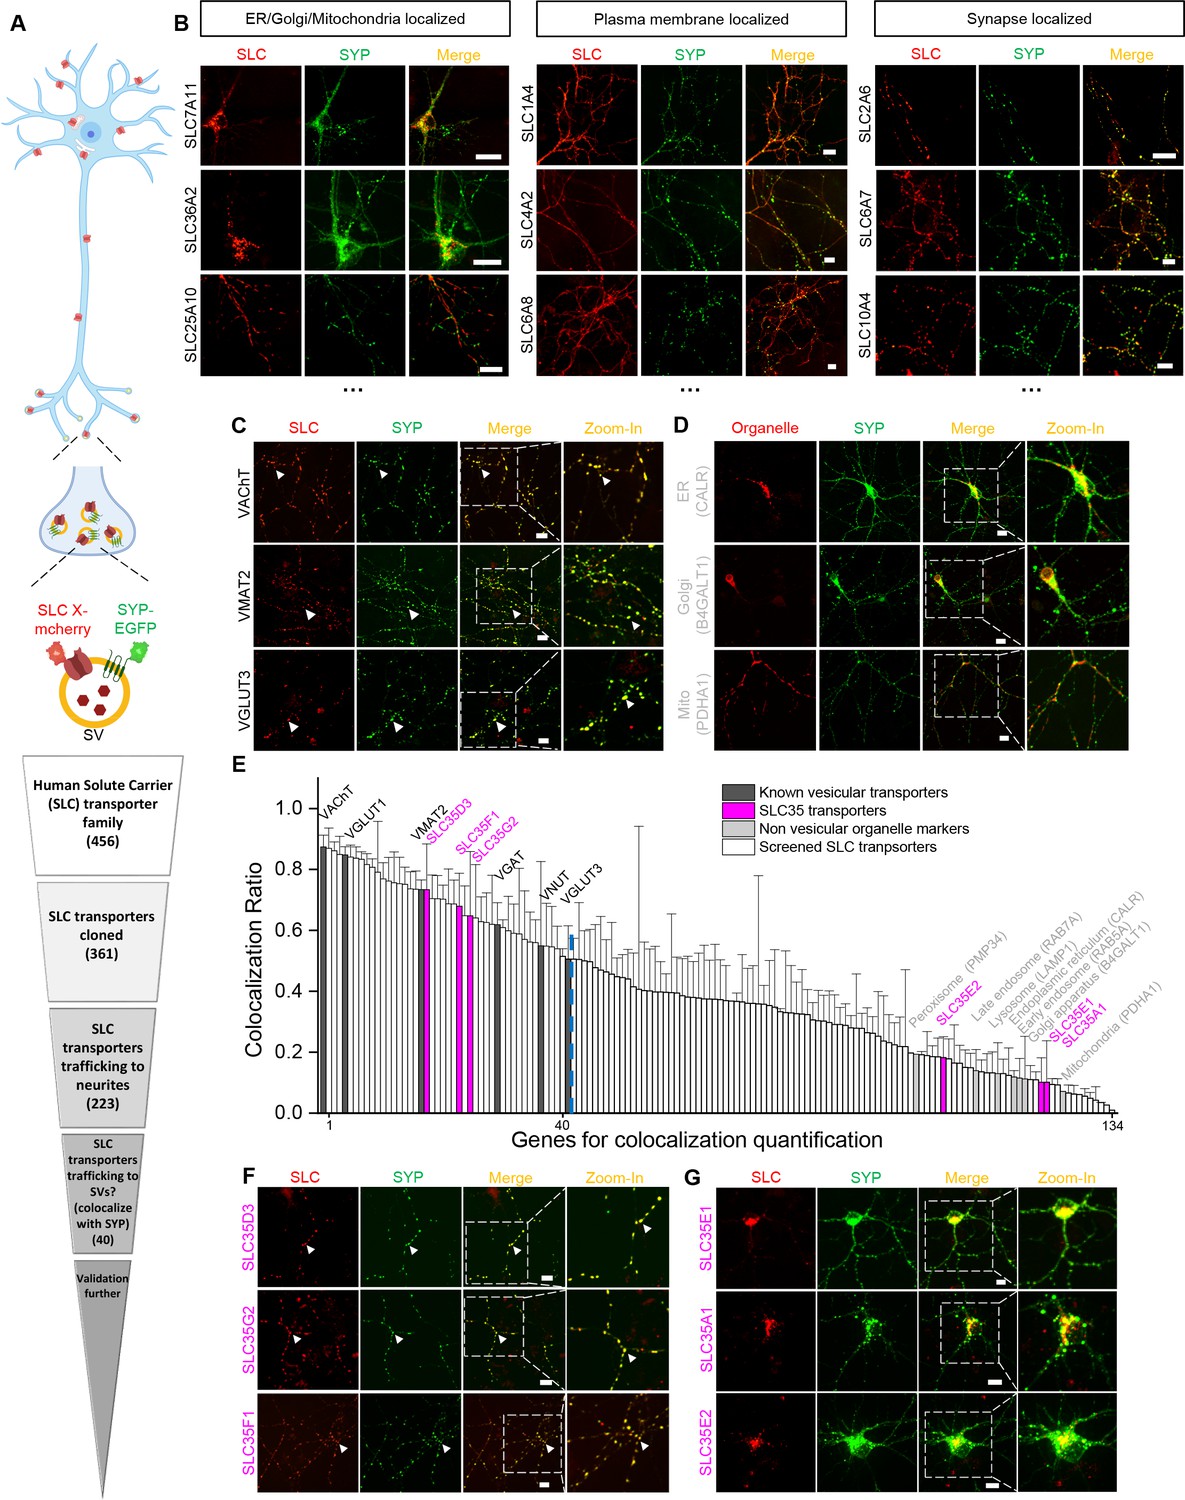
Localization profiling of SLC family members reveals candidate vesicular transporters.
(A) Top: Schematic diagram of the localization profiling strategy. Red and green fluorescent signals were collected using confocal microscopy imaging of cultured rat neurons co-expressing mCherry-tagged SLC proteins and EGFP-tagged synaptophysin (SYP-EGFP). Bottom: Sequential steps used for the localization profiling. Two rounds of screening revealed a total of 40 of 361 screened SLC transporters as candidate vesicular transporters. (B) Representative images of neurons expressing SLC X-mCherry transporters (red) and SYP-EGFP (green). Scale bars: 10 μm. (C) Representative images of neurons expressing three known vesicular SLC transporters (red) and SYP-EGFP (green), with magnified views. White arrowheads indicate co-localization. Scale bars: 10 μm. (D) Representative images of neurons expressing three non-vesicular organelle markers (red) and SYP-EGFP (green), with magnified views. Scale bars: 10 μm. (E) Summary of the co-localization ratio between 134 proteins and SYP-EGFP. Dark gray bars represent known vesicular transporters, magenta bars represent SLC35 transporters, light gray bars represent non-vesicular organelle markers, and white bars represent the SLC transporters screened in this study. The threshold indicated by the vertical dashed line was defined as the co-localization ratio between VGLUT3 and SYP-EGFP. n = at least three neurons each. Data are mean ± s.e.m. (F, G) Representative images of neurons expressing vesicular (F) and non-vesicular (G) SLC35 transporters (red) and SYP-EGFP (green), with magnified views. White arrowheads indicate co-localization. Scale bars: 10 μm.
-
Figure 1—source data 1
Genes for co-localization quantification.
- https://cdn.elifesciences.org/articles/65417/elife-65417-fig1-data1-v2.xlsx
Figure 1—figure supplement 1
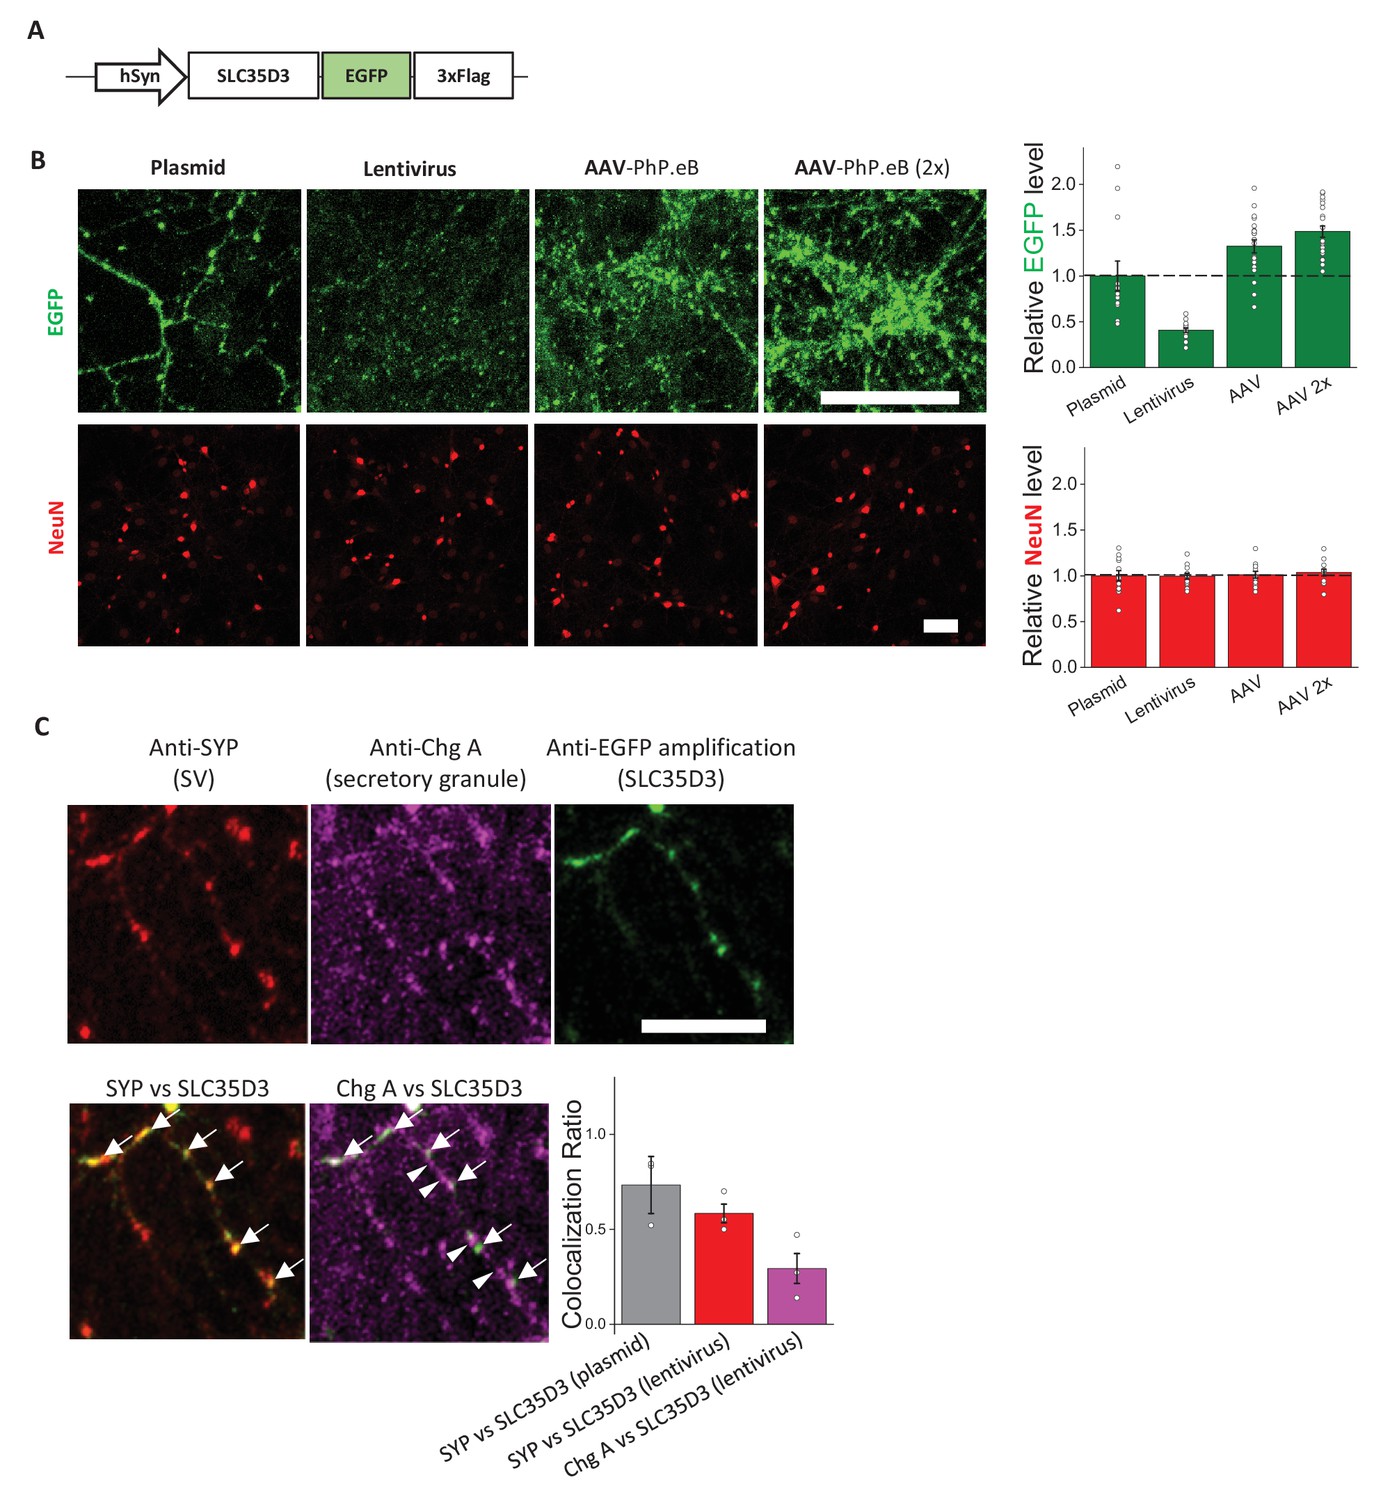
Subcellular localization of SLC35D3 at a reduced expression level.
(A) Schematic diagram of the epitope-tagged SLC35D3. (B) Left: Representative images of cultured neurons overexpressing SLC35D3-EGFP (green) by: plasmid transfection, lentivirus infection, and AAV-PhP.eB infection with two different tilters (7 × 10¹⁰ and 1.4 × 10¹¹ vg per coverslip containing ~8 × 10⁴ cells). NeuN (red) is immunostained as an internal control. Scale bars: 25 μm. Right: quantifications of the relative level of EGFP and NeuN. n = 12–20 neurons each. Data are mean ± s.e.m. (C) The localization of SLC35D3 in cultured neurons. Representative images showing cultured neurons expressing SLC35D3-EGFP by lentivirus infection immunostained with anti-SYP (red), anti-Chg A (magenta), and anti-EGFP (green) antibodies. Arrows: SLC35D3 positive puncta. Arrowheads: Chg A-only puncta. Scale bar: 25 μm. Inset: quantification of the co-localization ratio by N (puncta in colocalized channel)/N (puncta in organelle marker channel) among indicated groups. Dark gray: SYP vs SLC35D3 (plasmid transfection, replotted from Figure 1E); Red: SYP vs SLC35D3 (lentivirus); Magenta: Chg A vs SLC35D3 (lentivirus). n = at least three neurons each. Data are mean ± s.e.m.
Figure 2 with 2 supplements
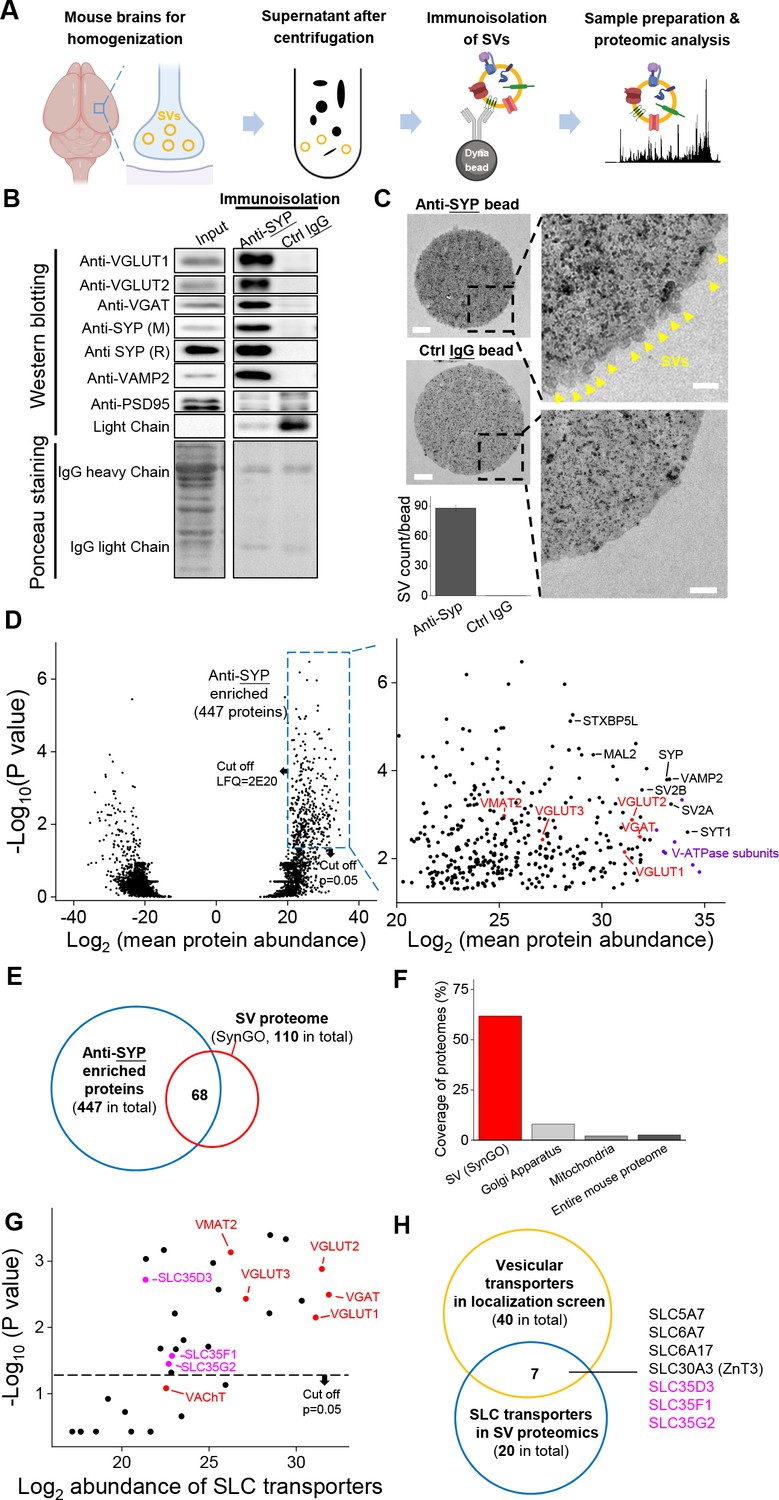
Proteomics profiling of SVs identifies novel putative vesicular SLC transporters.
(A) Schematic diagram depicting the strategy for proteomics profiling of SVs immunoisolated from fractionated mouse brain homogenates. (B) Top: western blot analysis of the indicated protein markers for SVs and the postsynaptic marker PSD-95 in the input fraction (supernatant after centrifugation of whole brain lysates), the anti-SYP immunoisolated sample, and the control IgG sample. Bottom: Ponceau staining of the membrane, showing the total proteins. (C) Electron microscopy images of anti-SYP beads (top) and control IgG beads (bottom), with magnified views. Arrowheads indicate immunoisolated SVs. Scale bars: 500 nm and 100 nm (magnified views). The bottom-left panel shows the quantification of the number of SVs attached to the indicated beads. (D) Left: volcano plot depicting the proteins detected using SV proteomics. The blue dashed box indicates anti-SYP-enriched proteins using thresholds set at p<0.05 and LFQ intensity > 220. n = 3 independently prepared protein samples. p-values by two-sided Student’s t-test. Right: magnified view of the anti-SYP‒enriched proteins. Representative SV markers are shown in black, V-ATPase subunits are shown in purple, and known vesicular transporters are shown in red. (E) Venn diagram showing the overlap between anti-SYP‒enriched proteins (blue) and the known SV proteome based on the SynGO database (red). (F) Summary of the percentage of overlap between anti-SYP‒enriched proteins and the SV proteome (from the SynGO database), Golgi apparatus proteins (from UniProt), mitochondrial proteins (from UniProt), and the entire mouse proteome (from UniProt). (G) Summary of the SLC transporters identified using SV proteomics. Classic VNTs are shown in red, and SLC35 transporters are shown in magenta. p-values by two-sided Student’s t-test. The horizontal dashed line indicates the threshold at p=0.05. (H) Venn diagram showing the overlap between the vesicular transporters identified using localization profiling (yellow) and the vesicular transporters identified using proteomics profiling of SVs (blue). The three candidate SLC35 transporters are shown in magenta.
-
Figure 2—source data 1
Proteomics profiling of SVs.
- https://cdn.elifesciences.org/articles/65417/elife-65417-fig2-data1-v2.xlsx
Figure 2—figure supplement 1
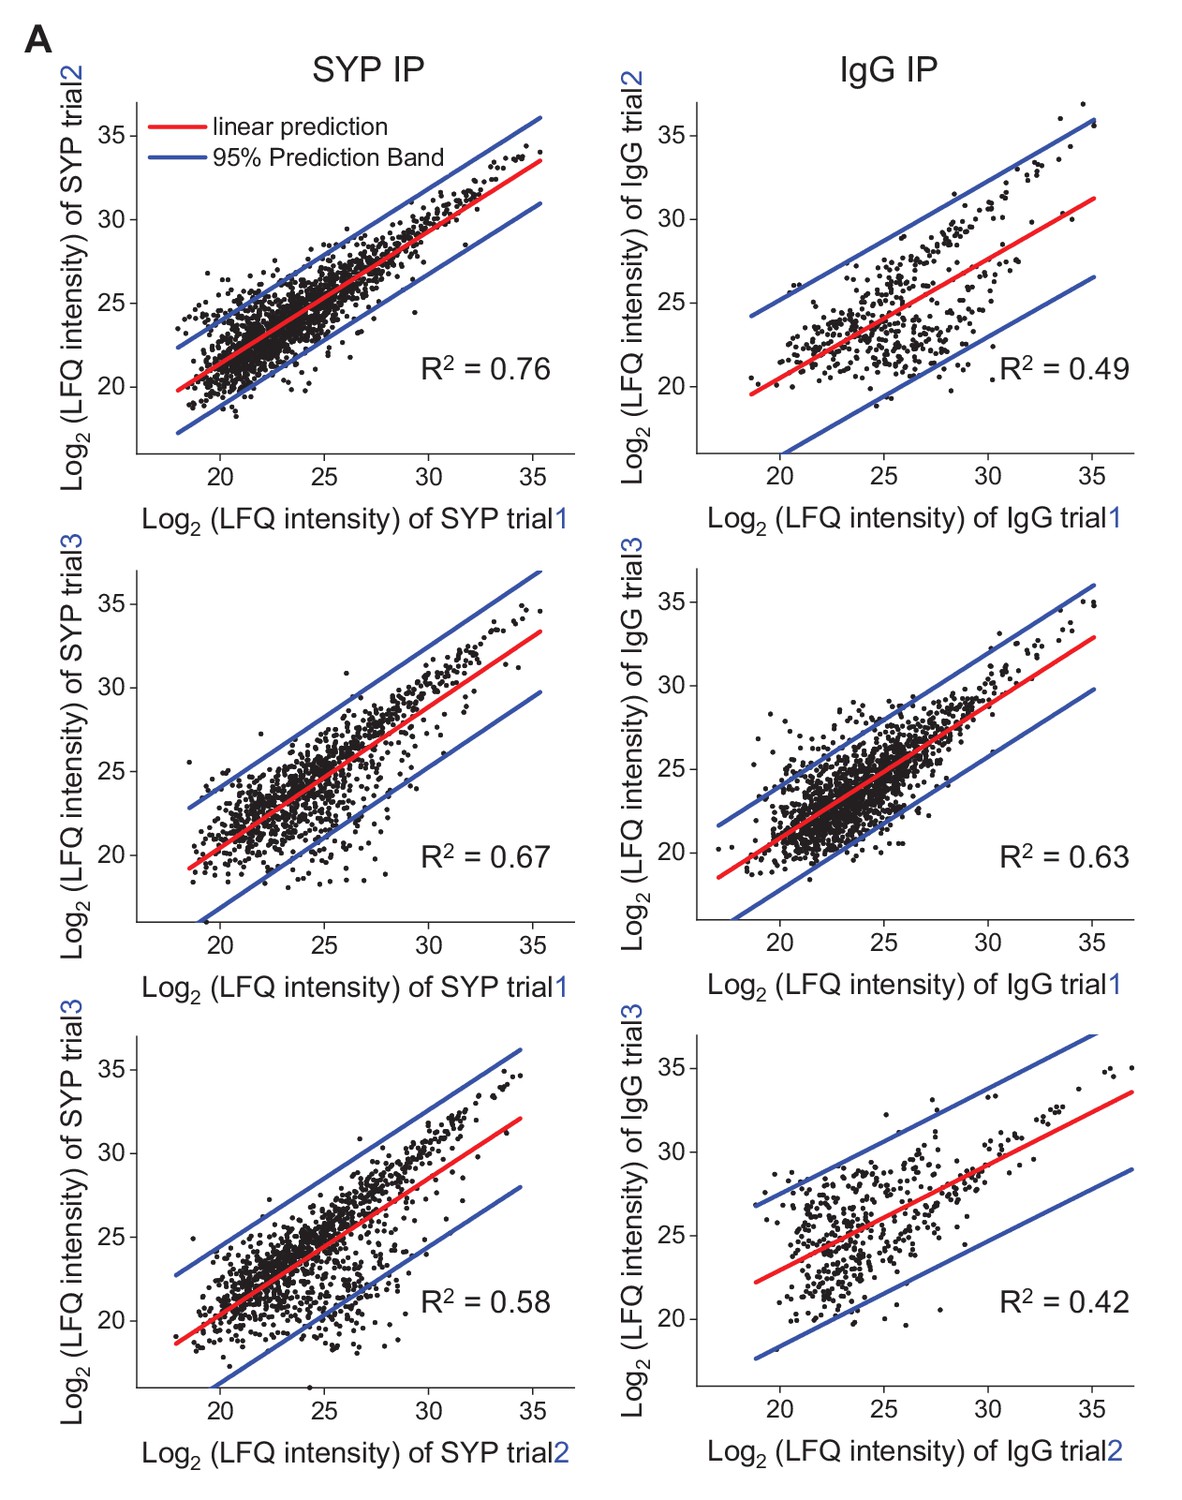
Repeatability of the proteomic data Scatterplots showing the correlation between independent biological trials.
Figure 2—figure supplement 2
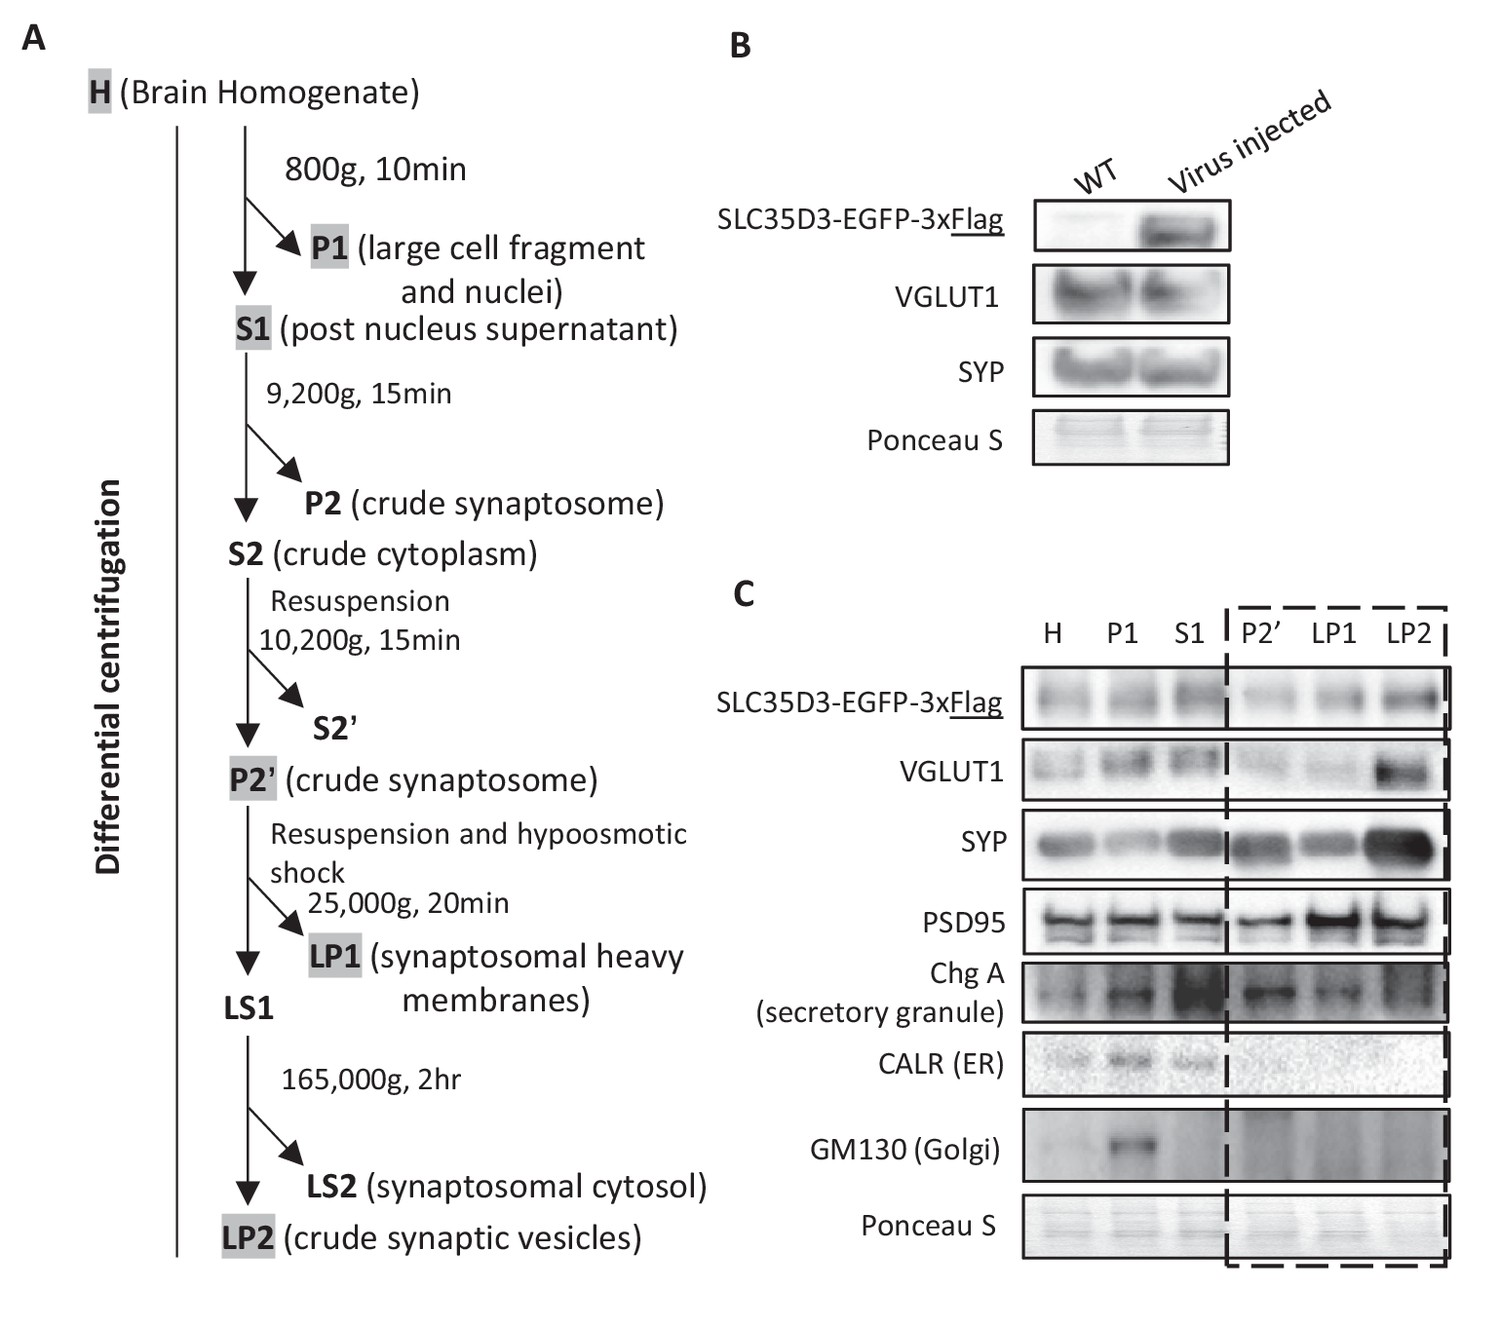
SLC35D3 in subcellular fractionation of SVs.
(A) Schematic diagram depicting the strategy for subcellular fractionation of SVs from mouse brain homogenates. (B) Top: western blot analysis of SLC35D3-EGFP-3xFlag and the indicated protein markers for SVs from mouse brain homogenates. Bottom: Ponceau staining showing the total proteins. AAV-PhP.eB was delivered by retro-orbital injection to 6 week mice at 5 × 10¹¹ genome copy (gc) and western blot analysis was conducted 3 weeks after injection. (C) Top: western blot analysis of SLC35D3-EGFP-3xFlag, the indicated protein markers for SVs, the postsynaptic marker PSD-95, and other organelle markers from differential centrifugation fractions. Bottom: Ponceau staining showing the total proteins. The dashed square indicates fractions from crude synaptosome to SVs.
Figure 3
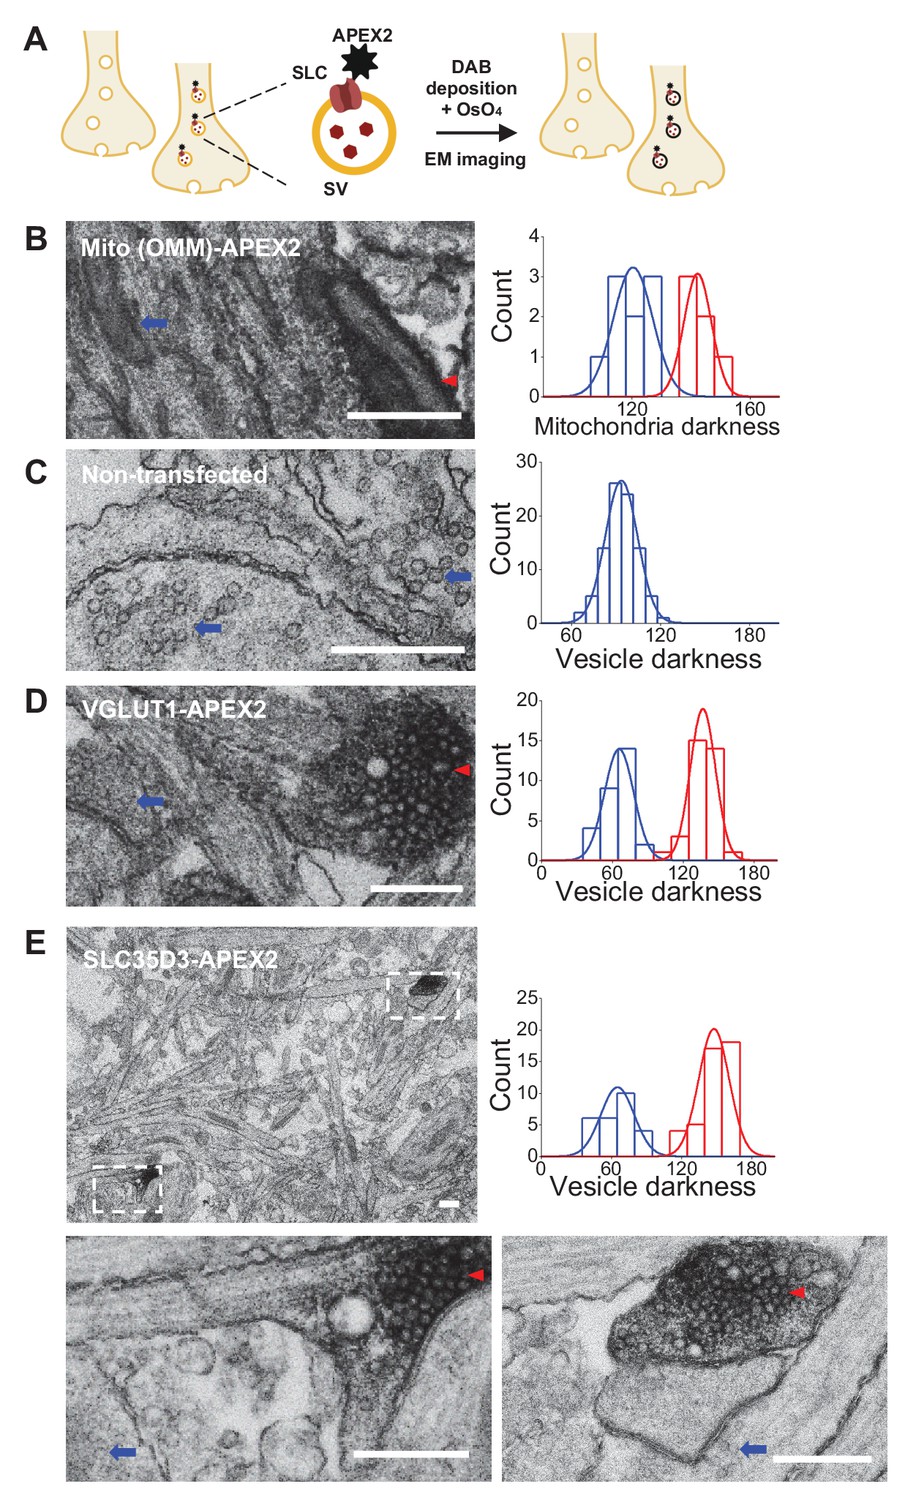
Validation of the vesicular localization of SLC35D3 using electron microscopy.
(A) Schematic diagram depicting the APEX2-based labeling strategy for studying ultrastructural localization. (B–E) Representative EM images (left) and distribution of organelle darkness (right) of mitochondria in cultured rat neurons transfected with Mito-APEX2 (B), SVs in non-transfected neurons (C), and SVs in neurons transfected with either VGLUT1-APEX2 (D) or SLC35D3-APEX2 (E), with magnified views of the dashed boxes from (E). The blue arrows and red arrowheads indicate organelles with low (light) and high (dark) electron density, respectively. Scale bars: 500 nm.
-
Figure 3—source data 1
Quantification of organelle darkness.
- https://cdn.elifesciences.org/articles/65417/elife-65417-fig3-data1-v2.xlsx
Figure 4 with 1 supplement

The targeted metabolite profiling reveals putative substrates of SLC35D3.
(A) Phylogenic tree of the SLC35 transporter family and known corresponding substrates. SLC35A2 and SLC35D3 are shown in blue and green, respectively. O: orphan transporters. (B) Left: representative HPLC-MS trace showing 5 μM of the indicated nucleotide sugars. The inset shows the linear correlation between the UDP-glc standard and MS ion intensity (R2 = 0.997, Pearson’s r). Right: molecular structures of the UDP-sugars UDP-glc, UDP-gal, UDP-glcNAc, and UDP-galNAc, with differences shown in the gray dashed boxes. (C) Schematic diagram depicting the strategy for detecting metabolites in organelles and in whole cells. (D) Representative traces of the indicated nucleotide sugars detected in control (SLC35A2KO) cells, with a magnified view at the right. (E) Summary of the relative abundance of the indicated nucleotide sugars measured in control cells and cells overexpressing SLC35D3. n = 5 and 3 independently prepared metabolite extracts, respectively. (F–G) Representative extracted ion chromatograms of specific nucleotide sugars (F) and summary of their relative abundance (G) in organelles isolated from control cells (gray) and cells overexpressing SLC35A2 (blue). n = 3 independently prepared metabolite extracts. p-values by two-sided Student’s t-test. p=0.0049 for UDP-gal and p=0.0099 for UDP-glc abundance, respectively. N.D.: not detectable. (H–I) Representative extracted ion chromatograms of specific nucleotide sugars (F) and summary of their relative abundance (G) in organelles isolated from control cells (gray) and cells overexpressing SLC35D3 (green). n = three independently prepared metabolite extracts. p-values by two-sided Student’s t-test. p=0.00196 for UDP-glc and p=0.01006 for CMP-SA abundance, respectively. N.D.: not detectable. Data are mean ± s.e.m.; two-sided Student’s t-test.
-
Figure 4—source data 1
Targeted metabolite profiling of nucleotide sugars.
- https://cdn.elifesciences.org/articles/65417/elife-65417-fig4-data1-v2.xlsx
Figure 4—figure supplement 1
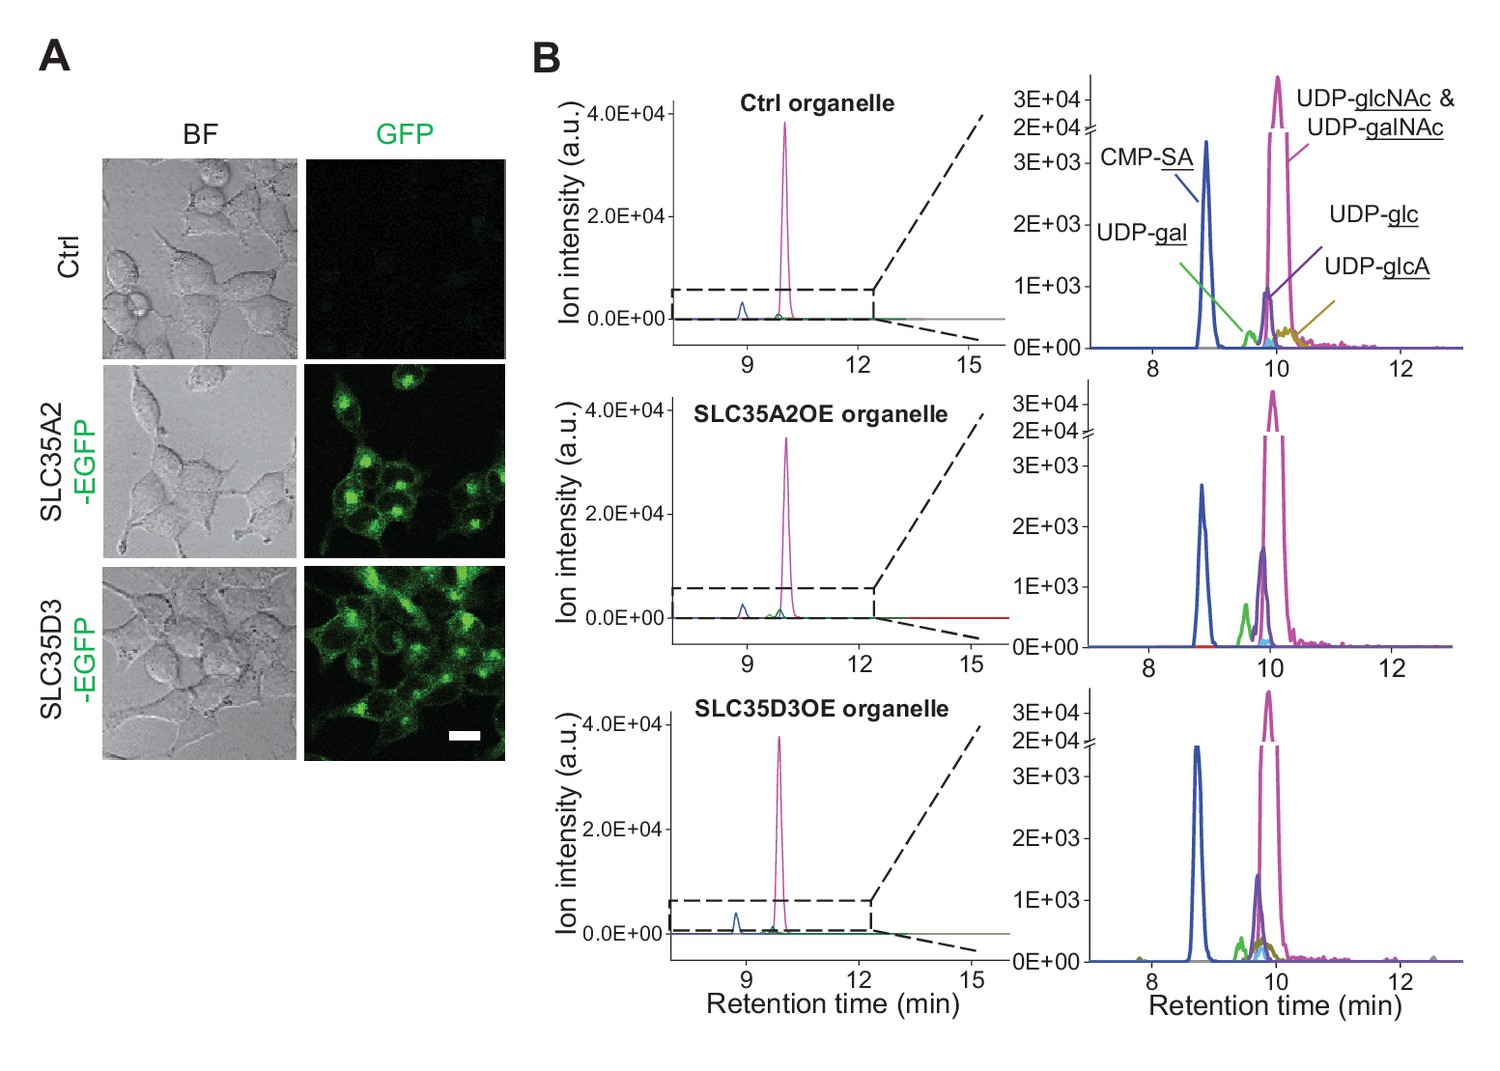
Additional analysis of metabolite profiling.
(A) Representative brightfield (BF) and fluorescence (GFP) images of control (SLC35A2KO) cells and cells overexpressing EGFP-tagged SLC35A2 (SLC35A2-EGFP) or SLC35D3 (SLC35D3-EGFP). Scale bar: 10 μm. (B) Representative full traces (left) and expanded views (right) of nucleotide sugars detected in organelles isolated from control cells (top) and from cells overexpressing SLC35A2-EGFP (SLC35A2OE) or SLC35D3-EGFP (SLC35D3OE).
Figure 5 with 1 supplement
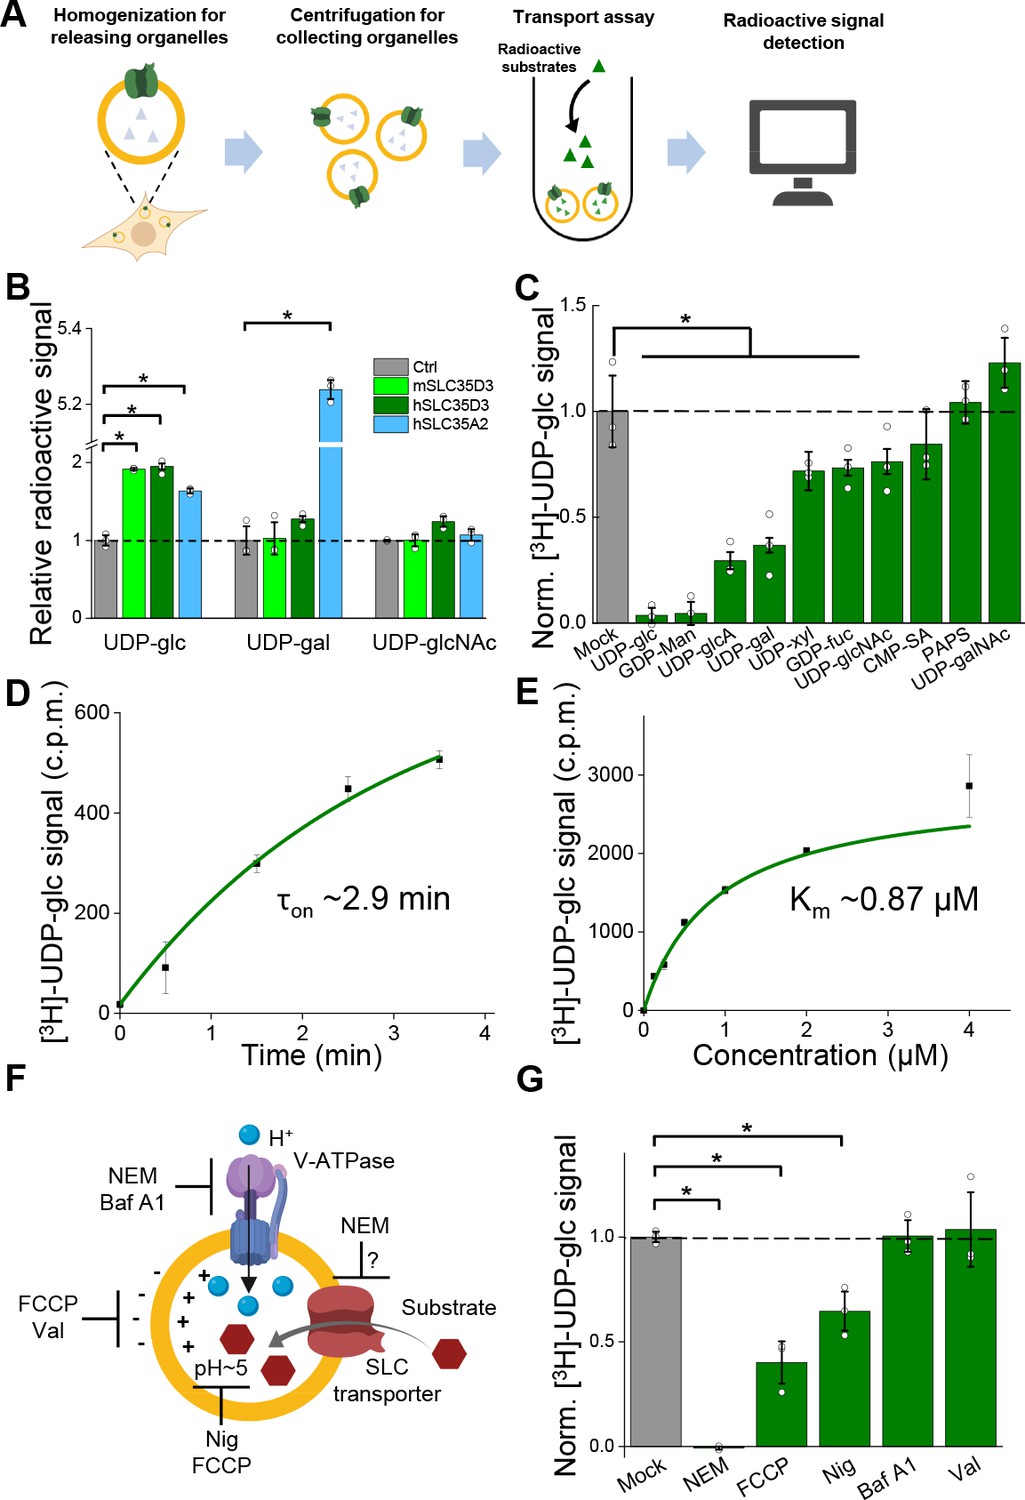
Validation and characterization of the UDP-glucose transport activity of SLC35D3.
(A) Schematic diagram depicting the transport assay using organelles isolated from HEK293T cells. (B) Summary of the transport of [3H]-UDP-glc, [3H]-UDP-gal, and [3H]-UDP-glcNAc (500 nM each) in control (SLC35A2KO) cells and in cells overexpressing mouse SLC35D3 (mSLC35D3), human SLC35D3 (hSLC35D3), or human SLC35A2 (hSLC35A2); n = 3 experiments each. p=0.04953 for mSLC35D3, hSLC35D3, and hSLC35A2 in UDP-glc transport; p=0.04953 for hSLC35A2 in UDP-gal transport. (C) Competition assay measuring [3H]-UDP-glc (500 nM) transport in the presence of the indicated non-labeled compounds (at 50 μM) in cells expressing SLC35D3; the data are expressed relative to mock cells, in which solvent was applied instead of a non-labeled compound; n = 3 experiments each. p=0.04953 for cold UDP-glc, GDP-Man, UDP-glcA, UDP-gal, UDP-xyl, and GDP-fuc competition. (D) Time course of [3H]-UDP-glc transport measured in cells expressing SLC35D3, relative to corresponding baseline values. The data were fitted to a single-exponential function. (E) Dose–response curve for [3H]-UDP-glc transport in cells expressing SLC35D3, relative to the corresponding baseline values. The data were fitted to Michaelis–Menten kinetics equation. (F) Schematic diagram depicting the proton gradient driving vesicular transporters, with specific inhibitors shown. (G) Summary of [3H]-UDP-glc transport measured in cells expressing SLC35D3, expressed relative to mock cells, in which solvent was applied; n = 3 experiments each. NEM, N-ethylmaleimide (0.2 mM); FCCP, carbonyl cyanide-4-(trifluoromethoxy) phenylhydrazone (50 μM); Nig, Nigericin (5 μM); Baf, bafilomycin A1 (100 nM); Val, valinomycin (20 μM). p=0.04953 for NEM, FCCP, and Nig inhibition. Data are mean ± s.e.m.; p-values by Kruskal–Wallis ANOVA test.
-
Figure 5—source data 1
UDP-glucose transport activity of SLC35D3.
- https://cdn.elifesciences.org/articles/65417/elife-65417-fig5-data1-v2.xlsx
Figure 5—figure supplement 1
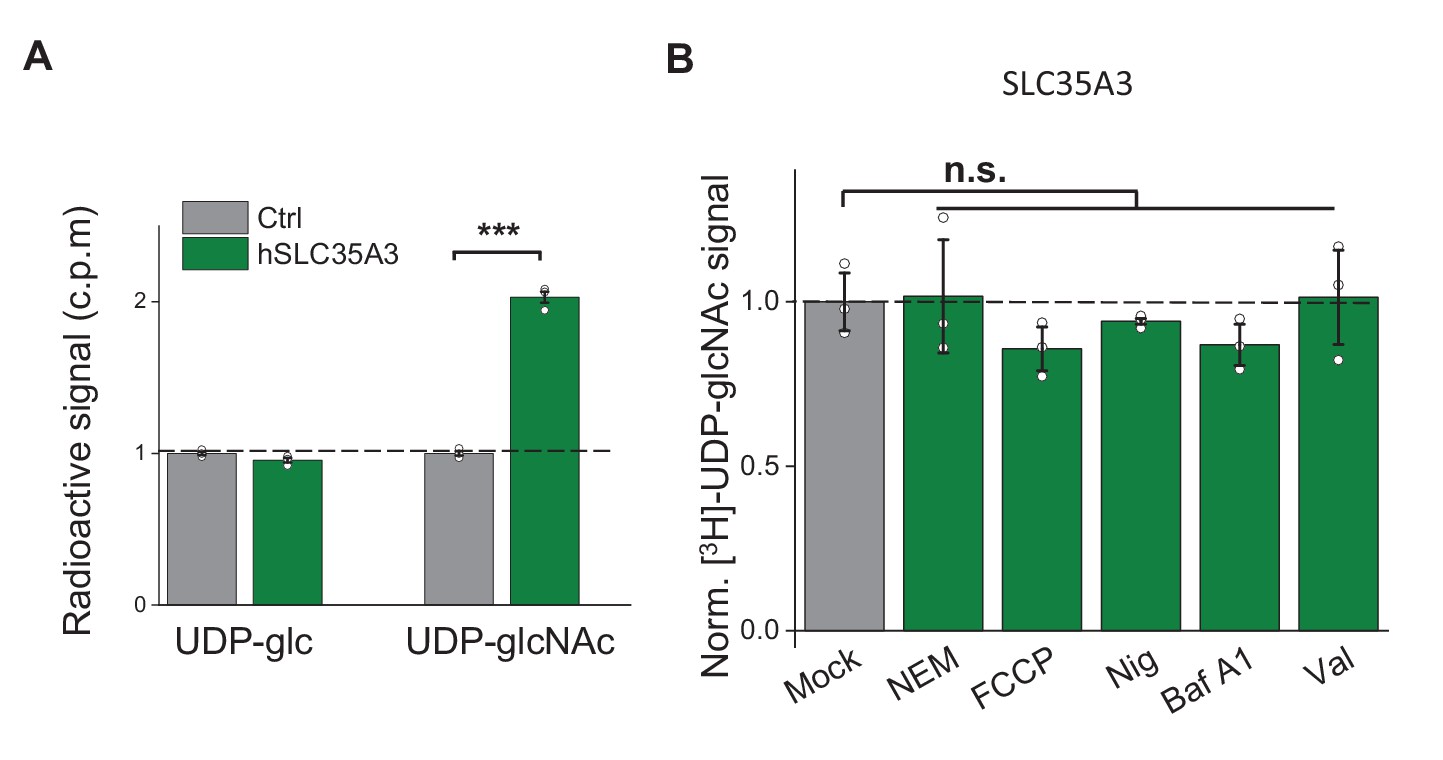
Pharmacology-insensitive transport activity by SLC35A3.
(A) Summary of the transport of [3H]-UDP-glc and [3H]-UDP-glcNAc (500 nM each) in control (HEK293T) cells and in cells overexpressing human SLC35A3 (hSLC35A3), n = 3 experiments each. p=2.62E-5 in UDP-glcNAc transport by two-sided Student’s t-test. (B) Summary of [3H]-UDP-glcNAc transport measured in cells expressing SLC35A3, expressed relative to mock cells, in which solvent was applied; NEM, N-ethylmaleimide (0.2 mM); FCCP, carbonyl cyanide-4-(trifluoromethoxy) phenylhydrazone (50 μM); Nig, Nigericin (5 μM); Baf A1, bafilomycin A1 (100 nM); Val, valinomycin (20 μM). n = 3 experiments each. n.s., not significant. p-values by Kruskal–Wallis ANOVA test. Data are mean ± s.e.m.
Figure 6

Working model depicting SLC35D3 as a putative UDP-glucose transporter on SVs.
SLC35D3 is a vesicular transporter which potentially mediate transport of UDP-glucose into SVs. UDP-glucose may function as a signaling molecule through a GPCR namely P2Y14.
Author response image 1
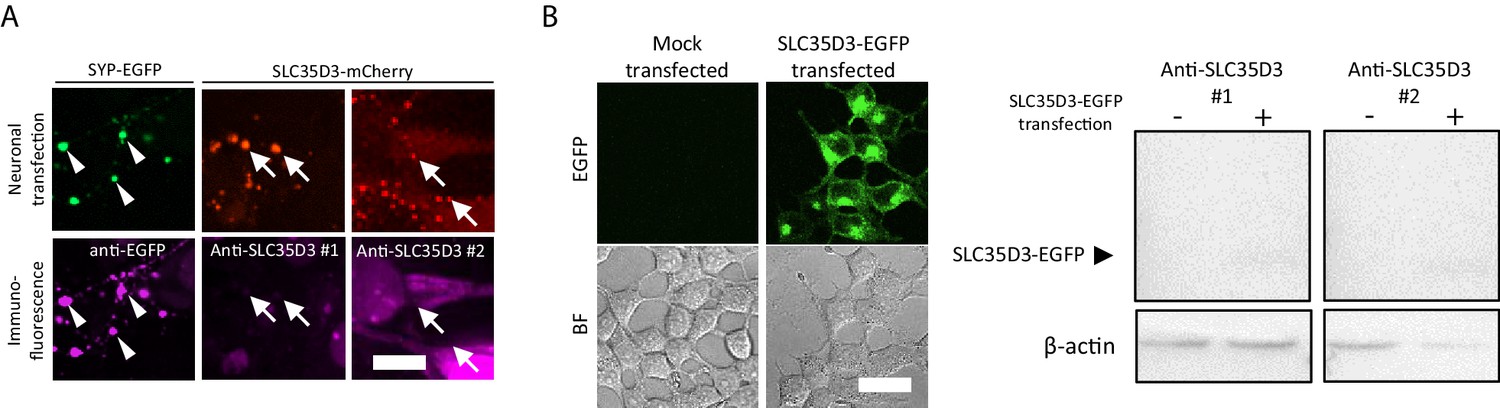
Test of anti-SLC35D3 antibodies (A) Representative images of cultured neurons expressing SYP-EGFP (green) or SLC35D3-mCherry (red) immunostained with anti-EGFP or anti-SLC35D3 antibodies (magenta), respectively.
Arrowheads indicate SYP-EGFP positive puncta and arrows indicate SLC35D3 positive puncta. Scale bars: 10 μm. (B) Left: Representative images of HEK293T cells with/without transfection of SLC35D3-EGFP. Scale bars: 25 μm. Right: Western blot analysis of overexpressed SLC35D3-EGFP from lysed HEK293T cells. β-actin serves as an internal control.
Tables
Key resources table
| Reagent type (species) or resource | Designation | Source or reference | Identifiers | Additional information |
|---|---|---|---|---|
| Gene (Mus musculus) | SYP | GenBank | NM_009305.2 | |
| Gene (Homo sapiens) | SLC35A2 | GenBank | NM_005660.3 | |
| Gene (Mus musculus) | SLC35D3 | GenBank | BC139194.1 | |
| Gene (Homo sapiens) | SLC35D3 | GenBank | KJ896073.1 | |
| Strain, strain background (Mus musculus) | Wild-type | Charles River | C57BL6/J, RRID:MGI:5650797 | |
| Strain, strain background (AAV) | AAV-PhP.eB hSyn-SLC35D3-EGFP-3xFlag | Vigene | Titer: 7.68 × 10¹³ gc/ml | |
| Cell line (Homo sapiens) | HEK293T | ATCC | RRID:CVCL_0063 | |
| Cell line (Homo sapiens) | SLC35A2KO cell line | This paper | Materials and methods section, ‘KO cell line establishment and validation’ | |
| Antibody | Polyclonal rabbit anti-VGLUT1 | Synaptic Systems | Cat. #: 135302 RRID:AB_887877 | WB dilution 1:1000 |
| Antibody | Polyclonal rabbit anti-VGLUT2 | Synaptic Systems | Cat. #: 135402 RRID:AB_2187539 | WB dilution 1:1000 |
| Antibody | Monoclonal mouse anti-SYP | Synaptic Systems | Cat. #: 101011 RRID:AB_887824 | WB and IF dilution 1:1000 |
| Antibody | Polyclonal rabbit anti-SYP | Cell Signaling Technology | Cat. #: 5461 RRID:AB_10698743 | WB dilution 1:1000 |
| Antibody | Monoclonal mouse anti-VAMP2 | Synaptic Systems | Cat. #: 104211 RRID:AB_887811 | WB dilution 1:1000 |
| Antibody | Monoclonal mouse anti-PSD95 | NeuroMab | Cat. #: 75–028 RRID:AB_2292909 | WB dilution 1:1000 |
| Antibody | Monoclonal mouse anti-Flag | Sigma-Aldrich | Cat. #: F9291 RRID:AB_439698 | WB dilution 1:1000 |
| Antibody | Polyclonal chicken anti-GFP | Abcam | Cat. #: Ab13970 RRID:AB_300798 | IF dilution 1:1000 |
| Antibody | Monoclonal rabbit anti-CALR | Cell Signaling Technology | Cat. #: 12238 RRID:AB_2688013 | WB dilution 1:1000 |
| Antibody | Polyclonal rabbit anti-GM130 | Cell Signaling Technology | Cat. #: 12480 RRID:AB_2797933 | WB dilution 1:500 |
| Antibody | Polyclonal rabbit anti-Chg A | Synaptic Systems | Cat. #: 259003 RRID:AB_2619972 | WB and IF dilution 1:500 |
| Recombinant DNA reagent | pN3-human SLC35D3-mCherry (Plasmid) | This paper | Materials and methods section, ‘Molecular biology’ | |
| Recombinant DNA reagent | pN3-mouse SYP-EGFP (Plasmid) | This paper | Materials and methods section, ‘Molecular biology’ | |
| Recombinant DNA reagent | pN3-rat VGLUT1-APEX2 (Plasmid) | This paper | Materials and methods section, ‘Molecular biology’ | |
| Recombinant DNA reagent | pN3-OMM-APEX2 (Plasmid) | This paper | Materials and methods section, ‘Molecular biology’ | |
| Recombinant DNA reagent | pN3-human SLC35D3-APEX2 (Plasmid) | This paper | Materials and methods section, ‘Molecular biology’ | |
| Recombinant DNA reagent | pPacific-mouse SLC35D3-EGFP (Plasmid) | This paper | Materials and methods section, ‘Molecular biology’ | |
| Recombinant DNA reagent | pPacific-human SLC35D3-EGFP (Plasmid) | This paper | Materials and methods section, ‘Molecular biology’ | |
| Recombinant DNA reagent | pPacific-human SLC35A2-EGFP (Plasmid) | This paper | Materials and methods section, ‘Molecular biology’ | |
| Recombinant DNA reagent | pAAV-hSyn-human SLC35D3-EGFP-3xFlag (AAV vector) | This paper | Materials and methods section, ‘Molecular biology’ | |
| Recombinant DNA reagent | pLenti hSyn-human SLC35D3-EGFP-3xFlag (lenti vector) | This paper | Materials and methods section, ‘Molecular biology’ | |
| Recombinant DNA reagent | Human ORFeome 8.1 | Center for Cancer Systems Biology | http://horfdb.dfci.harvard.edu/ | Full-length human cDNAs |
| Recombinant DNA reagent | DNASU | NIGMS-funded Protein Structure Initiative (PSI) | https://dnasu.org/DNASU/Home.do | Full-length human cDNAs |
| Recombinant DNA reagent | The PlasmID Repository | DF/HCC DNA Resource Core at Harvard Medical School | https://plasmid.med.harvard.edu/PLASMID/Home.xhtml | Full-length human cDNAs |
| Chemical compound, drug | UDP-glucose | Santa Cruz | Cat. #: sc-296687 | |
| Chemical compound, drug | UDP-galactose | Santa Cruz | Cat. #: sc-286849A | |
| Chemical compound, drug | UDP-N-acetylgalactosamine | Sigma-Aldrich | Cat. #: U5252 | |
| Chemical compound, drug | UDP-N-acetylglucosamine | Sigma-Aldrich | Cat. #: U4375 | |
| Chemical compound, drug | UDP-xylose | SugarsTech | Cat. #: SN02004 | |
| Chemical compound, drug | UDP-glucuronic acid | Santa Cruz | Cat. #: sc-216043 | |
| Chemical compound, drug | CMP-sialic acid | Sigma-Aldrich | Cat. #: C8271 | |
| Chemical compound, drug | GDP-fucose | Santa Cruz | Cat. #: sc-221696A | |
| Chemical compound, drug | GDP-mannose | Santa Cruz | Cat. #: sc-285856A | |
| Chemical compound, drug | Uridine diphosphate glucose [6–3H] | PerkinElmer | Cat. #: NET1163250UC | |
| Chemical compound, drug | Uridine diphosphate galactose [1–3H] | ARC | Cat. #: ART0737 | |
| Chemical compound, drug | Uridine diphosphate N-acetylglucosamine [6–3H] | ARC | Cat. #: ART0128 | |
| Chemical compound, drug | Valinomycin | Sigma-Aldrich | Cat. #: V0627 | |
| Chemical compound, drug | Nigericin | Sigma-Aldrich | Cat. #: N7143 | |
| Chemical compound, drug | FCCP | Sigma-Aldrich | Cat. #: C2920 | |
| Chemical compound, drug | N-Ethylmaleimide | Sigma-Aldrich | Cat. #: E3876 | |
| Chemical compound, drug | Bafilomycin A1 | abcam | Cat. #: ab120497 | |
| Other | Protein G dynabeads | Thermo | Cat. #: 10004D |
Additional files
-
Source code 1
in silica Puncta Analyzer tool.
- https://cdn.elifesciences.org/articles/65417/elife-65417-code1-v2.zip
-
Supplementary file 1
Vesicular transporters identified in SLC localization profiling.
- https://cdn.elifesciences.org/articles/65417/elife-65417-supp1-v2.docx
-
Supplementary file 2
SLC transporters enriched in immunoisolated synaptic vesicles.
- https://cdn.elifesciences.org/articles/65417/elife-65417-supp2-v2.docx
-
Transparent reporting form
- https://cdn.elifesciences.org/articles/65417/elife-65417-transrepform-v2.docx
Download links
A two-part list of links to download the article, or parts of the article, in various formats.
Downloads (link to download the article as PDF)
Open citations (links to open the citations from this article in various online reference manager services)
Cite this article (links to download the citations from this article in formats compatible with various reference manager tools)
Localization, proteomics, and metabolite profiling reveal a putative vesicular transporter for UDP-glucose
eLife 10:e65417.
https://doi.org/10.7554/eLife.65417


