Molecular characterization of projection neuron subtypes in the mouse olfactory bulb
- Department of Neuroscience, Division of Biology and Medicine, and the Robert J. and Nancy D. Carney Institute for Brain Science, Brown University, United States
- Center for Interdisciplinary Research in Biology (CIRB), Collège de France, and CNRS UMR 7241 and INSERM U1050, France
- The Francis Crick Institute, Sensory Circuits and Neurotechnology Laboratory, United Kingdom
- Department of Neuroscience, Physiology & Pharmacology, University College London, United Kingdom
- Janelia Research Campus, Howard Hughes Medical Institute, United States
- The Francis Crick Institute, Bioinformatics and Biostatistics, United Kingdom
- The Francis Crick Institute, Scientific Computing - Digital Development Team, United Kingdom
- Inria Antenne Lyon La Doua, France
- Université de Lyon, INSA-Lyon, LIRIS, UMR 5205, France
Figures
Figure 1 with 2 supplements
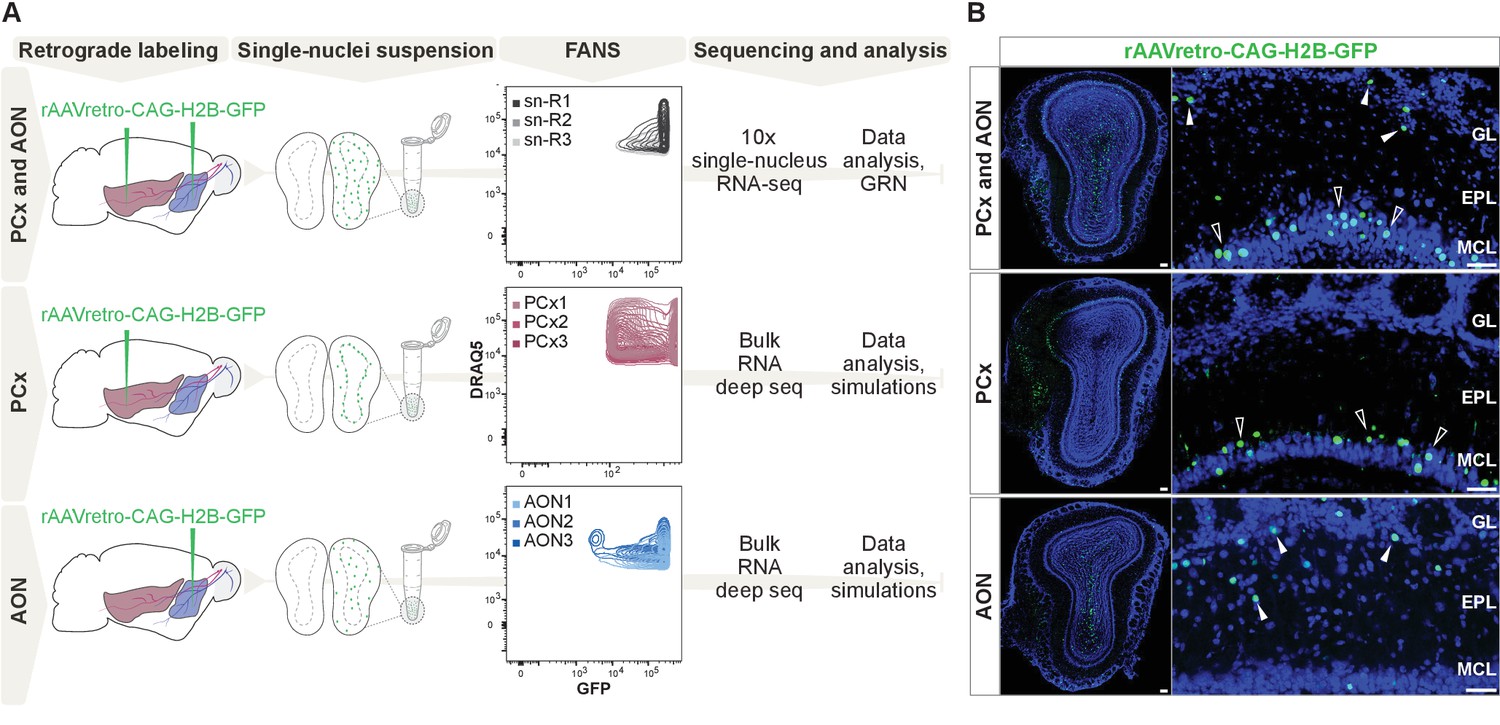
Comprehensive molecular profiling of olfactory bulb projection neurons.
(A) Schematic representation of experimental design. Top: after injection of rAAVretro-CAG-H2B-GFP into PCx and AON, single nuclei were dissociated from three mice (single nuclei (sn) R1,2,3: replicates 1,2,3) and sorted using fluorescence-activated nuclei sorting (FANS). The population of nuclei is selected based on GFP and DRAQ5 (far-red fluorescent DNA dye). See Figure 1—figure supplement 2 for detailed FANS plots. Sorted nuclei were sequenced using 10x single-nucleus RNA-seq. Middle and bottom: after injection of rAAVretro-CAG-H2B-GFP into PCx (middle) or AON (bottom), single nuclei were dissociated from three mice for each injection site and sorted using FANS (as described above and Figure 1—figure supplement 2). RNA extracted from sorted nuclei was prepared and sequenced using bulk RNA deep sequencing. PCx: Piriform Cortex; AON: Anterior Olfactory Nucleus; R: replicate; GRN: Gene Regulatory Network. (B) Representative coronal sections and high-magnification images showing GFP expression (in green) in the main olfactory bulb after injection of rAAVretro-CAG-H2B-GFP into PCx and AON (top), PCx only (middle), and AON only (bottom). Injection of the virus into PCx and AON resulted in GFP-expressing nuclei located in the mitral cell (empty arrowheads), external plexiform, glomerular (white arrowheads), and granule cell layers; injection into PCx resulted in GFP-expressing nuclei located in the mitral cell layer (empty arrowheads); injection into AON resulted in GFP-expressing nuclei located in the external plexiform and glomerular layers (white arrowheads) and granule cell layers. GL: glomerular layer; EPL: external plexiform layer; MCL: mitral cell layer; GCL: granule cell layer. Neurotrace counterstain in blue. Scale bars, 100 μm and 50 μm (high magnification).
Figure 1—figure supplement 1
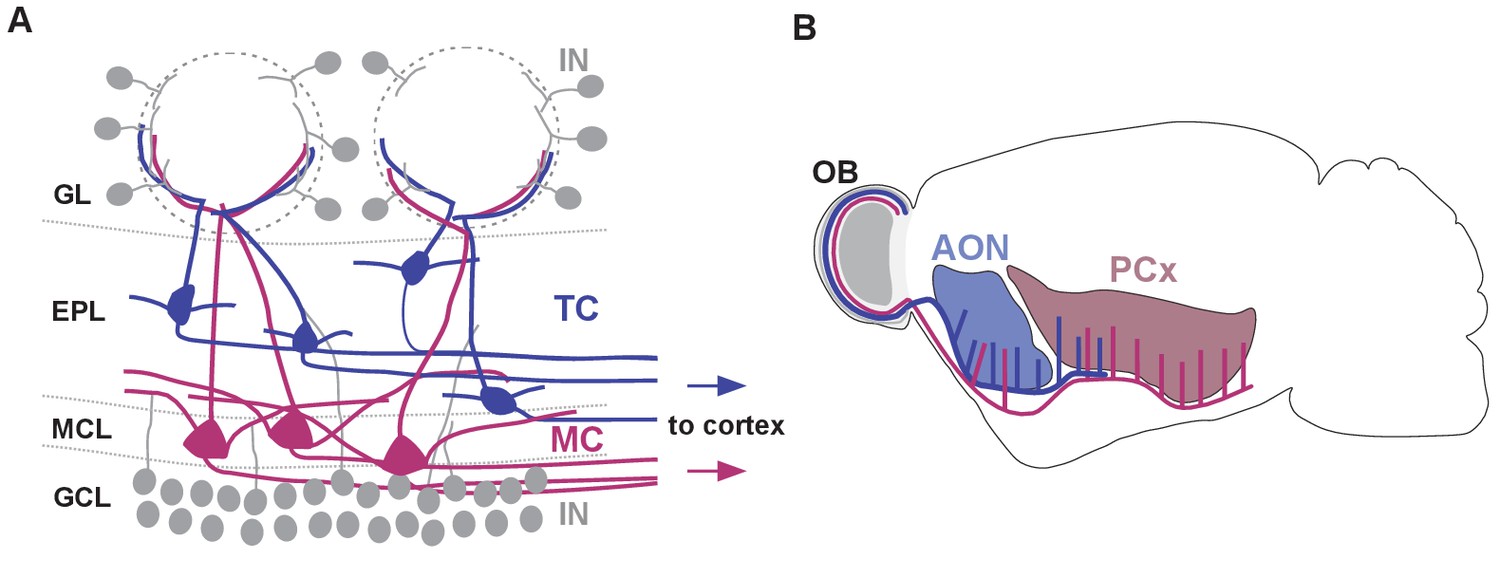
Schematic representation of olfactory bulb cell types and their cortical projection targets.
(A) Schematic representation of cell types and their distribution within the olfactory bulb (IN: interneuron, TC: tufted cell, MC: mitral cell, GL: glomerular layer, EPL: external plexiform layer, MCL: mitral cell layer, GCL: granule cell layer). Tufted and mitral cells project their axons to downstream cortical regions. (B) Schematic representation of the distinct axonal projection targets for mitral and tufted cells in the olfactory cortex (AON: anterior olfactory nucleus, PCx: piriform cortex). Tufted cells project primarily to AON and to the anterior part of PCx, whereas mitral cell axons target AON, the anterior and posterior portions of PCx.
Figure 1—figure supplement 2
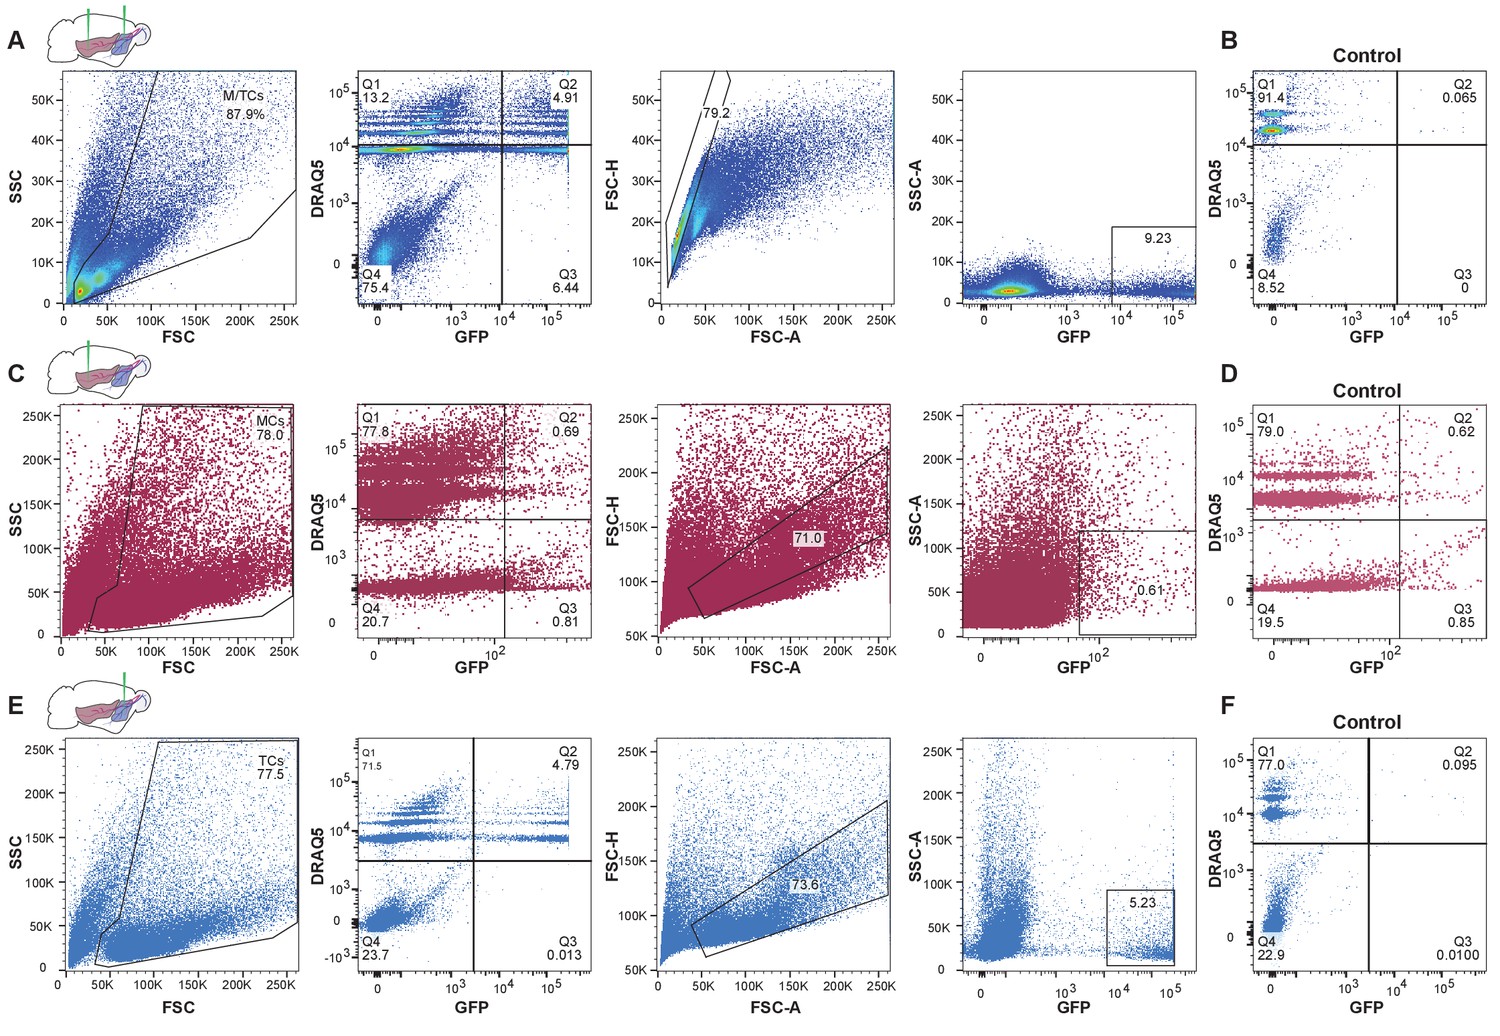
Enrichment of GFP-expressing nuclei using fluorescence-activated nuclei sorting (FANS).
(A) Representative FANS data of GFP-expressing nuclei after injection of rAAVretro-CAG-H2B-GFP into AON and PCx to label OB projection neurons. From left to right: gating strategy for enrichment of GFP-expressing nuclei. Nuclei are identified based on size and granularity in the FSC (forward scatter) versus SSC (side scatter) plot. Next, the population of nuclei restricted to Quadrant two is selected that is both GFP-expressing and DRAQ5-positive (far-red fluorescent DNA dye). To exclude doublets, the population of nuclei around the diagonal in the FSC-A (forward scatter area) versus FSC-H (forward scatter height) plot is selected. Lastly, GFP-expressing nuclei filtered through the preceding steps are plotted against the SSC-A (side scatter area). (B) FANS results for control specimen for AON and PCx (olfactory bulb contralateral to the injection hemisphere from the same animal) showing the absence of GFP-expressing nuclei (same gating strategy as shown in (A)). (C) Representative FANS data after injection of rAAVretro-CAG-H2B-GFP into PCx to enrich for mitral cell nuclei. (D) FANS results for control specimen for PCx injections showing the absence of GFP-expressing nuclei (same gating strategy as shown in (C)). (E) Same as in (C) but after injection of rAAVretro-CAG-H2B-GFP into AON to enrich for tufted cell nuclei. (F) FANS results for control specimen for AON (olfactory bulb contralateral to the injection hemisphere from the same animal) showing the absence of GFP-expressing nuclei (same gating strategy as shown in (E)).
Figure 2 with 1 supplement
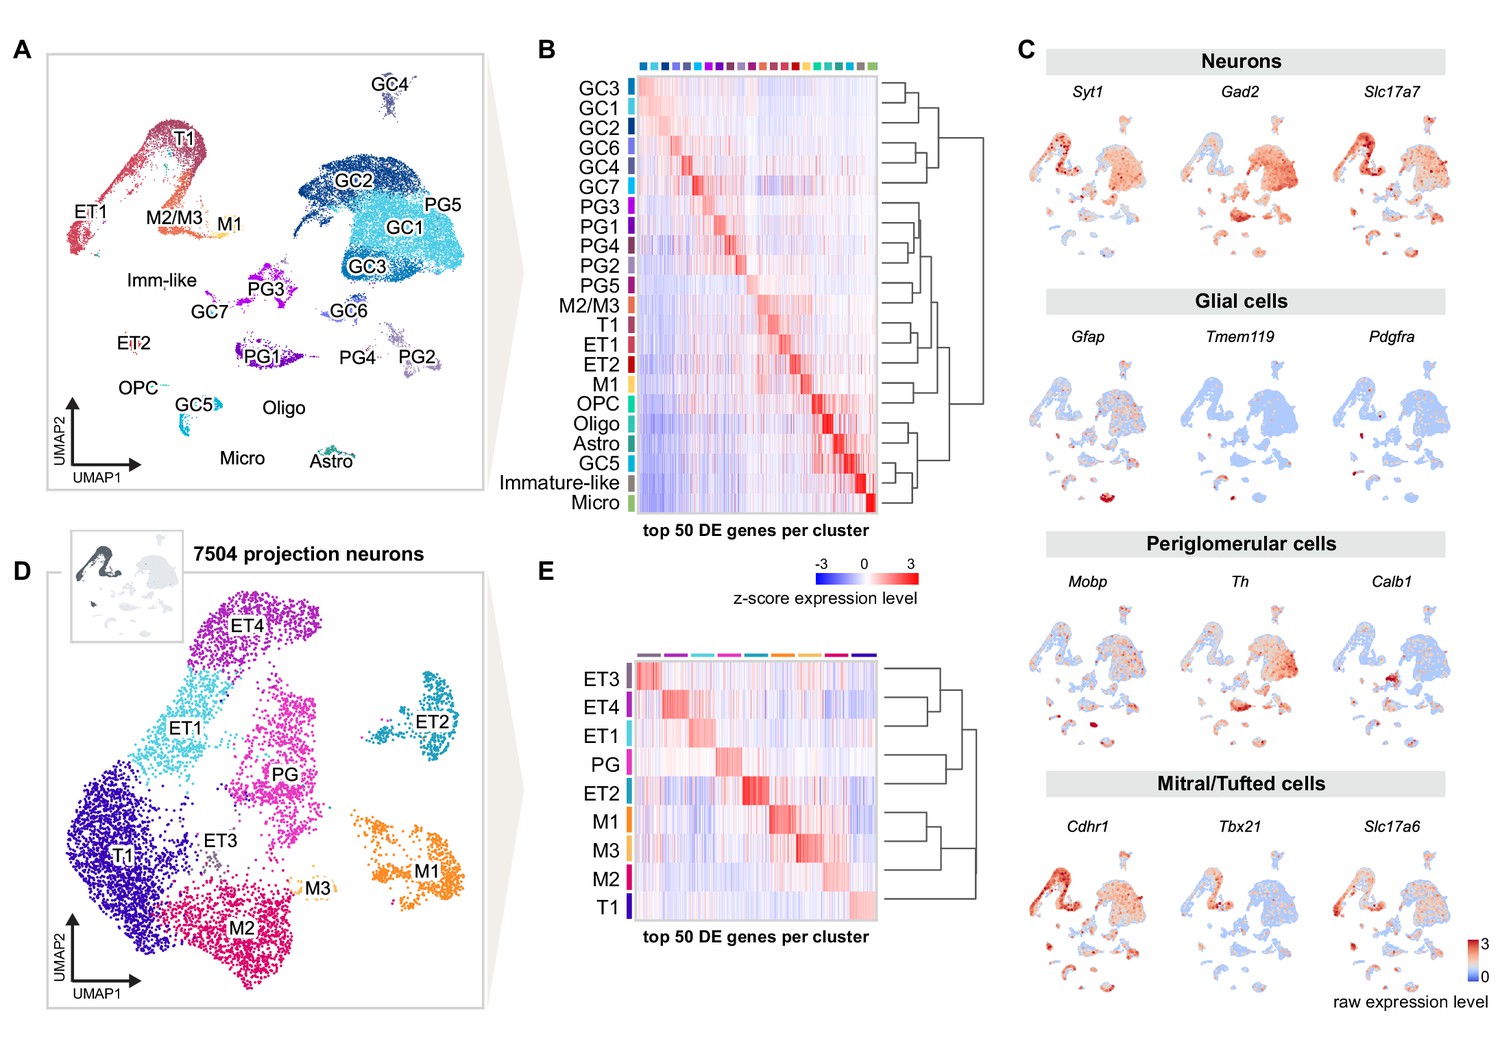
Single-nucleus RNA sequencing distinguishes distinct cell types and molecular signatures of OB projection neurons.
(A) UMAP representation of gene expression profiles of 31,703 single nuclei combined from all replicates (R1, R2, R3) of mice injected into both AON and PCx, grouped into 22 clusters color-coded by cell type membership (GC: granule cell, PG: periglomerular cell, OPC: oligodendrocyte precursor cell, Micro: microglia, Astro: astrocyte, Oligo: oligodendrocyte, ET: external tufted cell, M: mitral cell, T: tufted cell, Imm-like: Immature-like cell). See Figure 2—figure supplement 1 for detailed quality check of each replicate. (B) Matrix plot showing the z-scored expression levels of the top 50 differentially expressed (DE) genes for each cell population ordered by hierarchical relationships between distinct clusters. Each column represents the average expression level of a gene in a given cluster, color-coded by the UMAP cluster membership (from A). The dendrogram depicts the hierarchical relationships and is computed from the PCA representation of the data using Pearson correlation as distance measure and link by complete linkage. (C) UMAP representations of known marker genes for main cell populations (Syt1: neurons; Gad2: GABAergic neurons; Slc17a7: glutamatergic neurons; Gfap, Tmem119, Pdgfra, Mobp: glial cells; Th, Calb1: periglomerular neurons; Cdhr1, Tbx21, Slc17a6: mitral/tufted cells). Nuclei are color-coded by the raw expression level of each transcript. (D) UMAP representation of subclustering from the initial clusters M1, M2/M3, T1, ET1, and ET2 (cluster names from A), selected for the expression of known excitatory and mitral/tufted cell markers (shown in C), resulting in 7504 putative projection neurons grouped into nine distinct types. (E) Same matrix plot as described in (B) showing the z-scored expression levels of the top 50 DE genes for each projection neuron type ordered by hierarchical relationships and color-coded by the UMAP subcluster membership (from D).
Figure 2—figure supplement 1
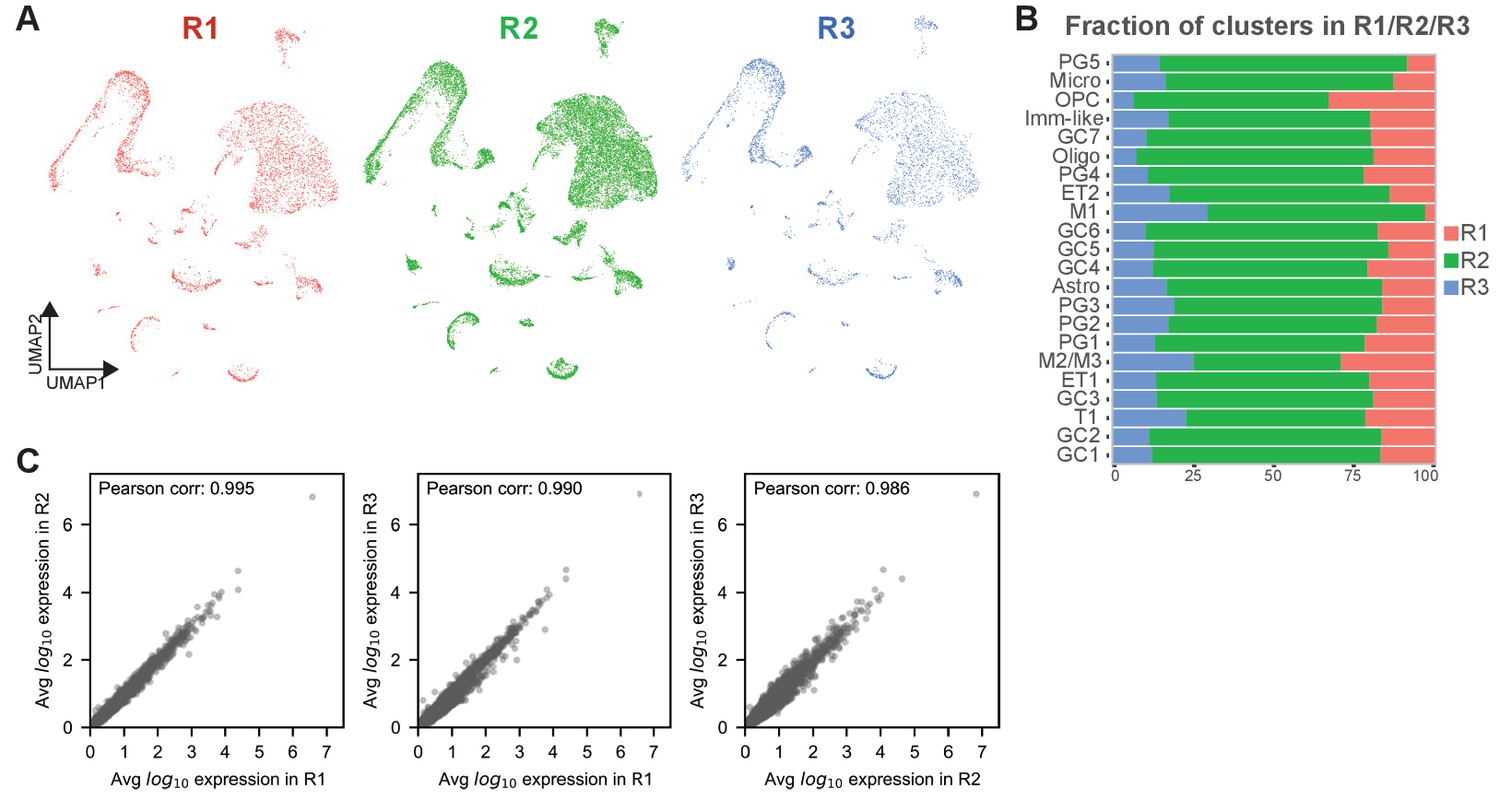
Quality check of individual replicates of sn-RNA seq (sn-R1/R2/R3 dataset) shows the reliability of the data and the replicability of each cell type.
(A) Depiction of nuclei for each replicate (in red R1, in green R2, in blue R3) embedded in the UMAP space showing that replicates are very similar to each other and can be combined for downstream analyses. Replicates were merged using Canonical Correlation Analysis (CCA). (B) Bar chart showing the fraction of each cluster when R1, 2 and 3 are combined, color-coded by the replicate membership, indicating that each cell type is consistently represented in each replicate. (C) Scatter plots of pairwise comparisons of log10 gene expression levels averaged over nuclei. In the three panels, replicates R1, R2, and R3 are compared. Pearson correlations are shown in the top left corner of each plot.
Figure 3 with 3 supplements
Histological validation of molecularly distinct mitral and tufted cell types.
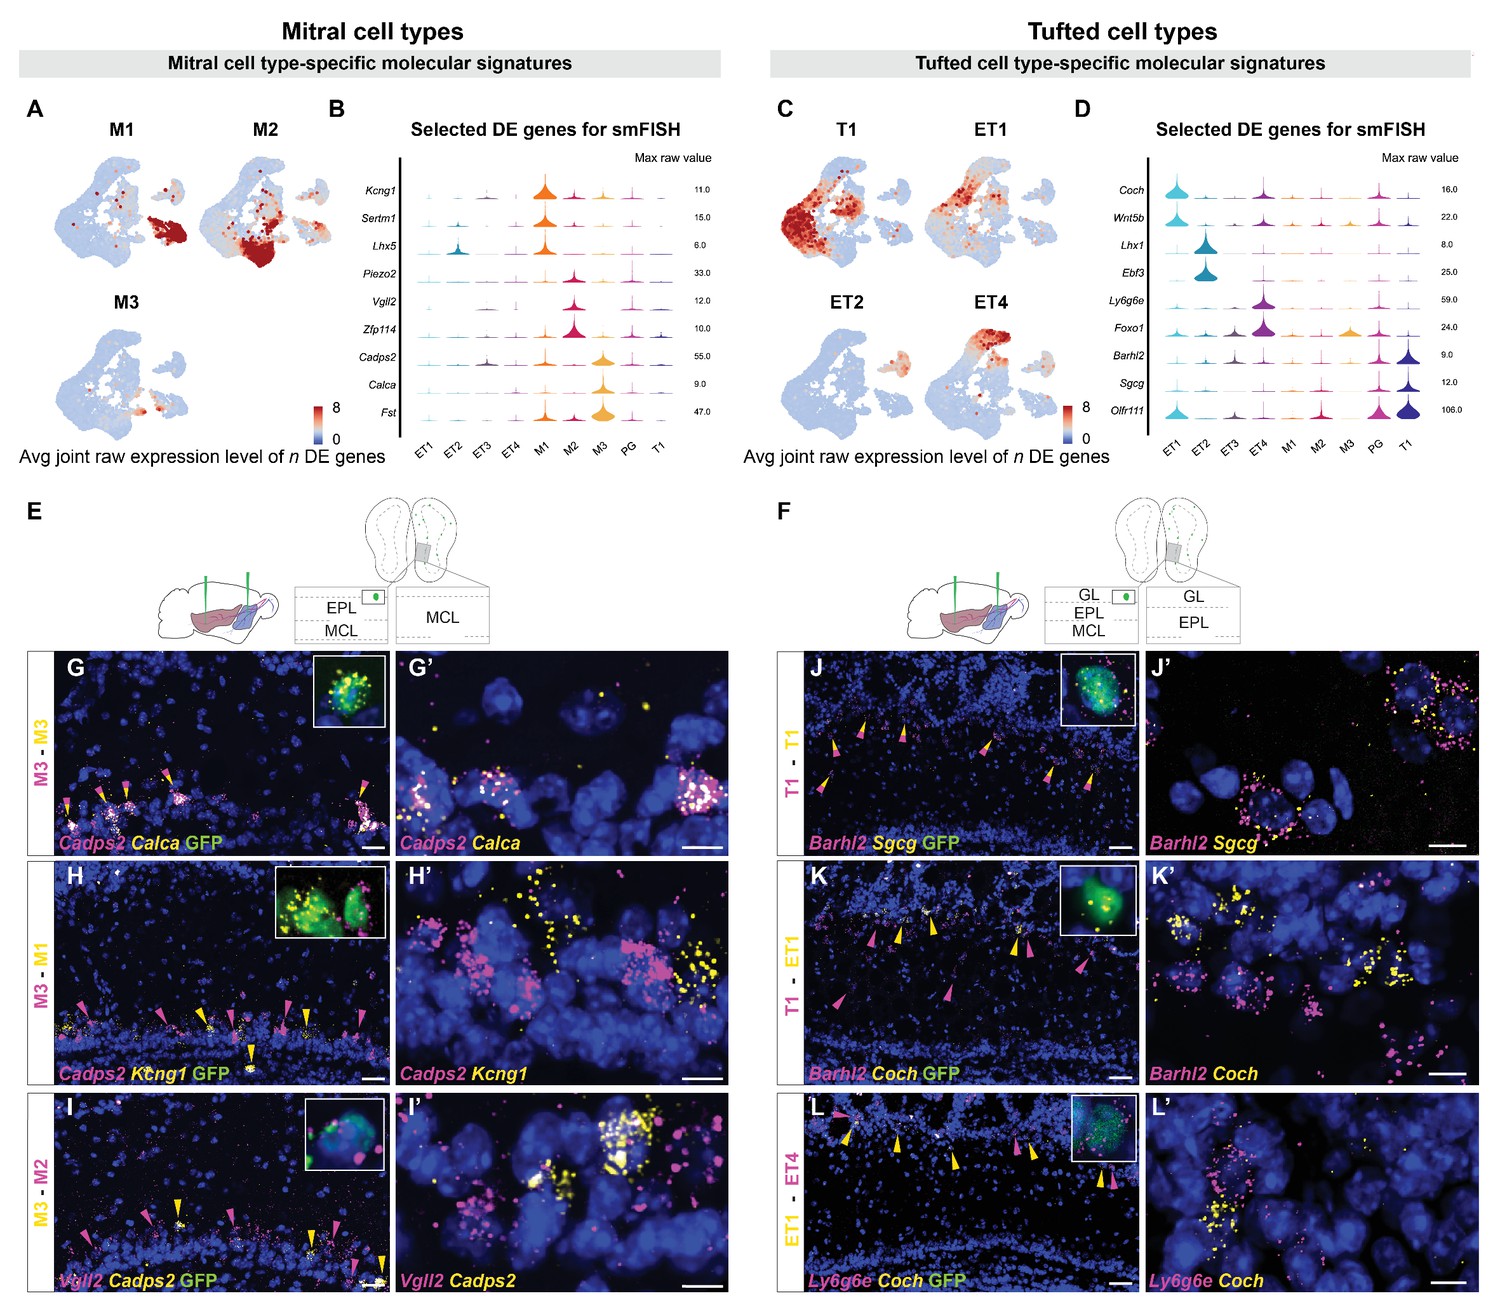
(A) Combined average (avg) raw expression level of the top n differentially expressed (DE) genes for each mitral cell type (M1 n=14, M2 n=11, M3 n=10), overlaid onto the subclustering UMAP space (shown in Figure 2D). DE genes were selected if their log fold change was greater than 4 (see Materials and methods for details). M1-specific genes: Kcng1, Lhx5, Sertm1, Gabra2, Doc2b, Cntn6, Olfr1259, Nrp2, C1ql1, Ebf1, Baiap3, Adgrl2, Dsc2, Chrna5; M2-specific genes: Piezo2, Vgll2, Zfp114, Nts, Ros1, Samsn1, Grid2, Smpx, Itga4, Itga9, Sema6d; M3-specific genes: Cadps2, Calca, Fst, Ets1, Ednra, Cdkn1c, Mustn1, Smoc2, Cnr1, Ccno. (B) Violin plots showing maximum raw expression value of selected mitral cell type-specific DE genes across mitral and tufted cell clusters for further validation with smFISH. (C) Combined average (avg) raw expression level of the top n DE genes for each tufted cell type (T1 n=9, ET1 n=7, ET2 n=9, ET4 n=6), overlaid onto the subclustering UMAP space (shown in Figure 2D). T1-specific genes: Barhl2, Sgcg, Vdr, Olfr111, Olfr110, Cacna1g, Fam84b, Kcna10, Tspan10; ET1-specific genes: Coch, Wnt5b, Rorb, Chst9, Tpbgl, Clcf1, Rxfp1; ET2-specific genes: Lhx1, Ebf3, Trp73, Edn1, Ebf2, Nr2f2, Uncx, Psrc1, Dsp; ET4-specific genes: Ly6g6e, Foxo1, Siah3, Galnt12, Itga8, Ets2, Grik4. (D) Violin plots showing maximum raw expression value of selected tufted cell type-specific DE genes across mitral and tufted cell clusters for further validation with smFISH. (E, F) Schematic representations of the smFISH images for validating projection neuron type-specific marker genes upon rAAVretro-CAG-H1B-GFP injection into PCx and AON. The schemes depict the laminar location visualized in the histological images from a coronal section of the ipsilateral hemisphere to the injection site. EPL: external plexiform layer; MCL: mitral cell layer; GL: glomerular layer. (G–I) smFISH showing combinatorial expression of mitral cell type-specific marker genes for M1, M2 and M3 cells in the mitral cell layer. High magnifications (top right) show co-labeling of viral GFP with the in situ mRNA probe. (G and G’). The M3 markers Cadps2 and Calca are co-expressed in subpopulations of cells in the mitral cell layer, indicated by the yellow/magenta arrowheads. (H and H’) The M3 marker Cadps2 and M1 marker Kcng1 are expressed in distinct subpopulations of cells in the mitral cell layer, indicated by the magenta and yellow arrowheads respectively. (I and I’) The M3 marker Cadps2 and M2 marker Vgll2 are mutually exclusive in subpopulations of cells in the mitral cell layer, indicated by the yellow and magenta arrowheads respectively. For additional histological analysis and quantification of co-expression see Figure 3—figure supplement 1. (J–L) smFISH images showing combinatorial expression patterns of tufted cell type-specific marker genes for validating T1, ET1, ET2 and ET4 clusters as distinct projection neuron types in the external plexiform and glomerular layers. High magnifications (top right) show co-labeling of viral GFP with the in situ mRNA probe. As described for the mitral cell types, yellow or magenta arrowheads show non-overlapping patterns (K, K’: T1–ET1 and L, L’: ET1–ET4), and yellow/magenta arrowheads show co-expression patterns (J, J’: T1–T1). For additional histological analysis and quantification of co-expression see Figure 3—figure supplement 1. DAPI counterstain in blue. Scale bars, 50 μm and 10 μm (high magnifications).
Figure 3—figure supplement 1
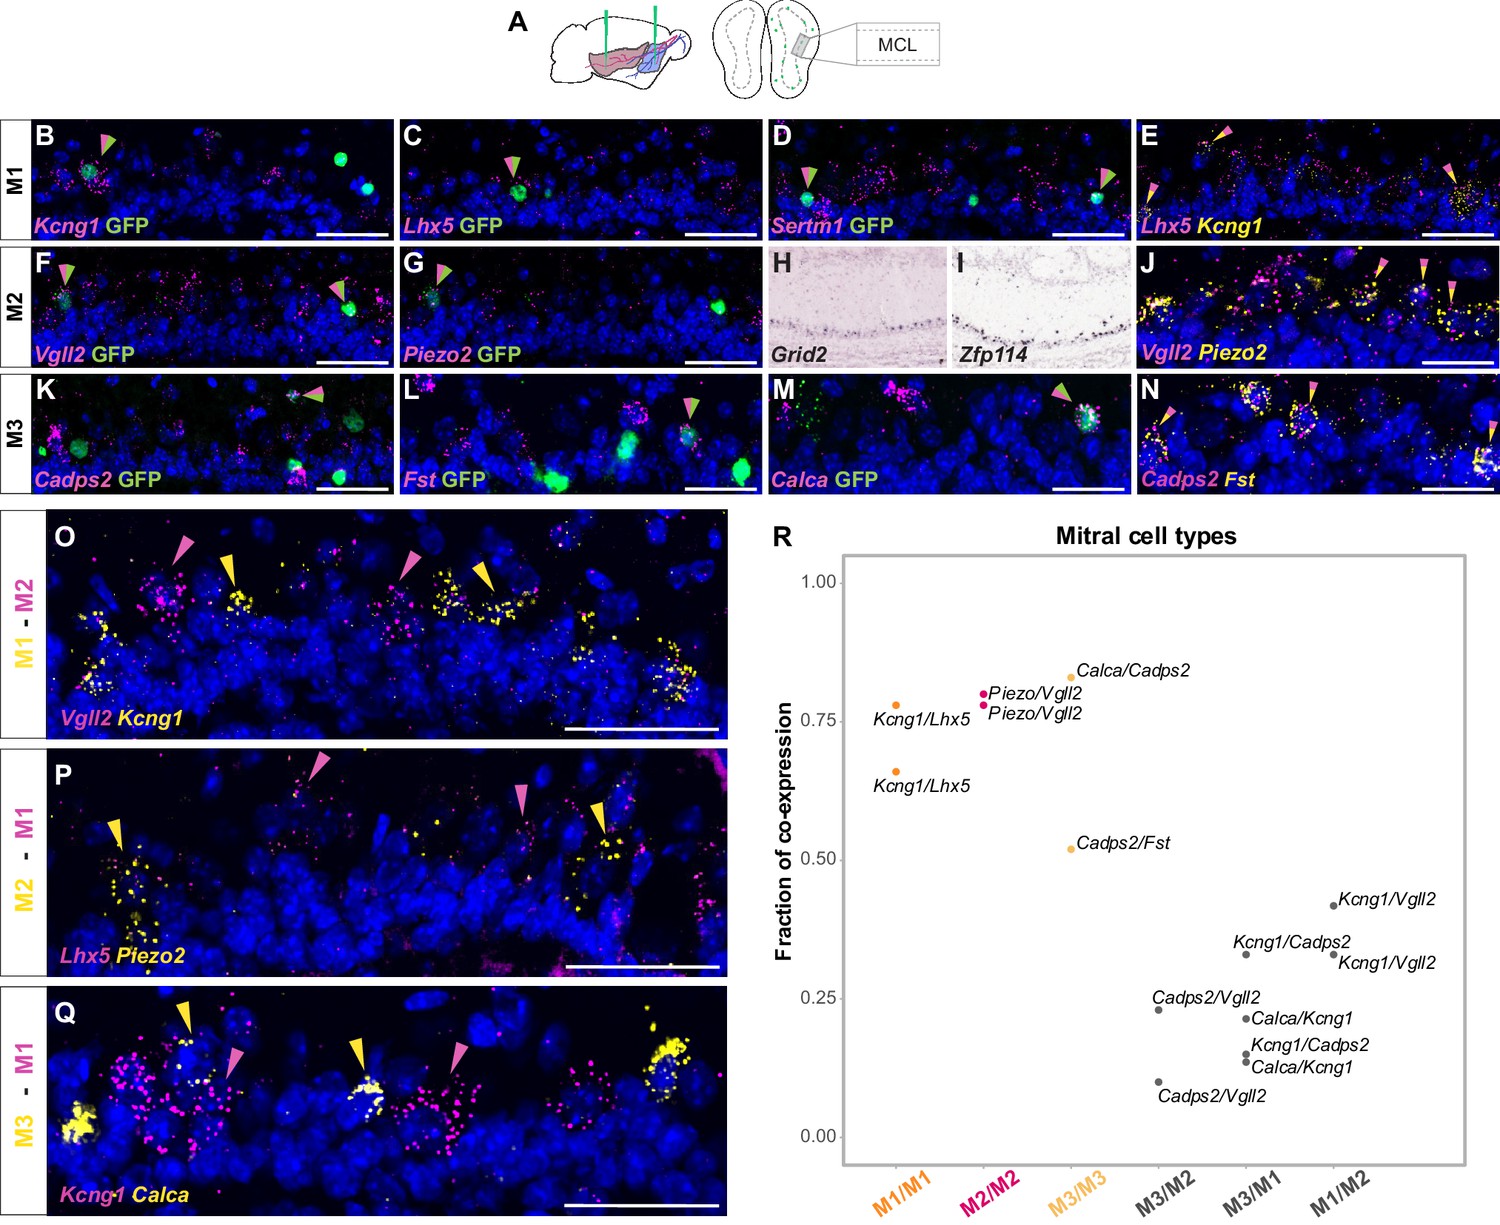
Histological analysis of DE genes for distinct mitral cell types.
(A) Schematic representation of the smFISH images for validating selected mitral cell type-specific marker genes upon rAAVretro-CAG-H2B-GFP injection into PCx and AON. The scheme depicts the laminar location visualized in the histological images from a coronal section of the ipsilateral hemisphere to the injection site. MCL: mitral cell layer. (B–D) smFISH showing co-expression of M1-specific marker genes with viral GFP. Labeled nuclei are indicated by the magenta/green arrowheads. (E) smFISH showing co-expression of two M1-specific marker genes. Labeled nuclei are indicated by the yellow/magenta arrowheads. (J) Same as (E) but for M2-specific marker gene. (N) Same as (E) but for M3-specific marker gene. (F, G) Same as (B–D) but for M2-specific marker gene. (H, I) In situ hybridization images from the Allen Brain Atlas showing additional M2-specific DE genes. (K - M) Same as (B–D) but for M3-specific marker gene. (O–Q) smFISH images showing mutually exclusive expression of mitral cell type-specific marker genes for M1, M2, and M3. Yellow and magenta arrowheads show mutually exclusive expression of M1 versus M2 (O–P), and M1 versus M3 (Q) marker genes. DAPI counterstain in blue. Scale bars, 50 μm. (R) Combinatorial quantification of mitral cell type-specific smFISH probes. Each dot is color-coded by the mitral cell type membership between cells of the same clusters or represented in grey for cells across different clusters. Each dot represents the fraction of co-expression between two cluster-specific probes.
Figure 3—figure supplement 2
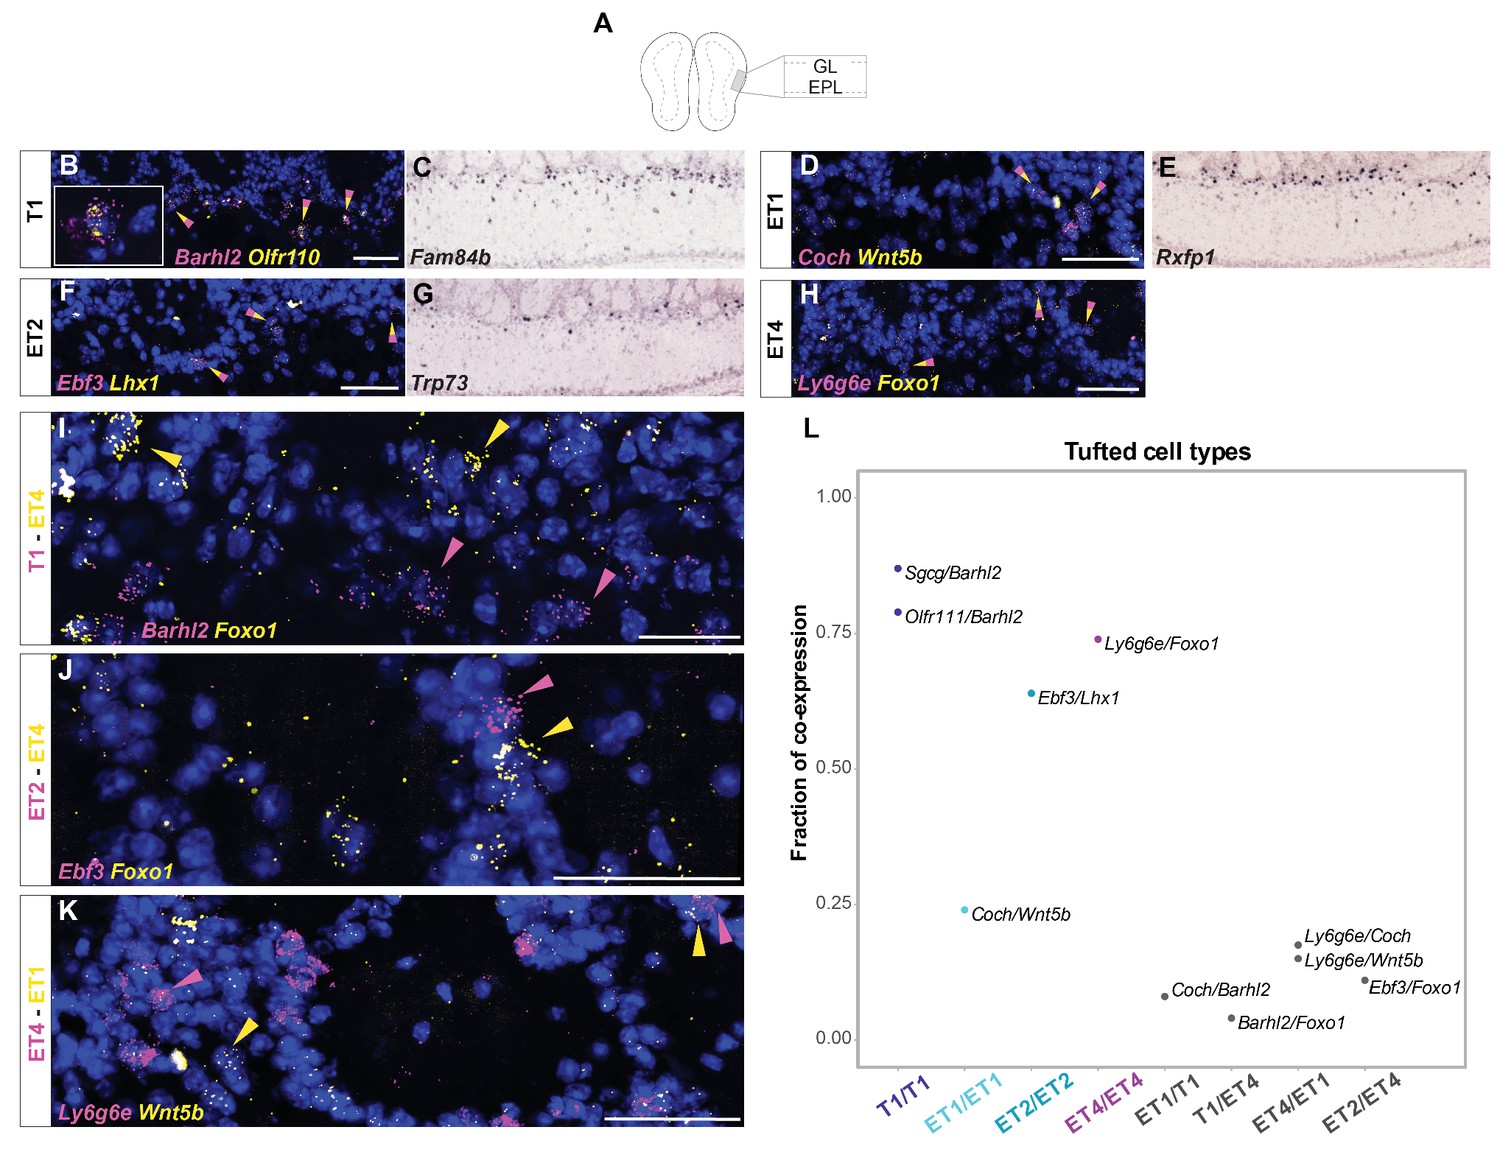
Histological analysis of DE genes for distinct tufted cell types.
(A) Schematic of the smFISH images for validating selected tufted cell type-specific marker genes upon rAAVretro-CAG-H2B-GFP injection into PCx and AON. The scheme depicts the laminar location visualized in the histological images from a coronal section of the ipsilateral hemisphere to the injection site. GL=glomerular layer; EPL=external plexiform layer. (B) smFISH showing co-expression of two T1-specific marker genes. Labeled nuclei are indicated by the yellow/magenta arrowheads. High magnification (left) shows clear co-labeling of the two mRNA probes Barhl2 and Olfr110. (C) In situ hybridization images from the Allen Brain Atlas showing one additional T1-specific DE gene. (D) Same as (B) but for ET1-specific marker gene. (E) In situ hybridization images from the Allen Brain Atlas showing additional ET1-specific DE genes. (F) Same as (B) but for ET2-specific marker gene. (G) In situ hybridization images from the Allen Brain Atlas showing additional ET2-specific DE genes. (H) Same as (B) but for ET4-specific marker gene. (I–J–K) smFISH images showing mutually exclusive expression of tufted cell type-specific marker genes for T1, ET1, ET2, and ET4. Yellow and magenta arrowheads show mutually exclusive expression of T1 versus ET4 (I), ET2 versusET4 (J), and ET1 versus ET4 (K) marker genes. DAPI counterstain in blue. Scale bars, 50 μm. (L) Combinatorial quantification of tufted cell type-specific smFISH probes. Each dot is color-coded by tufted cell type membership between cells of the same clusters or represented in grey for cells across different clusters. Each dot represents the fraction of the co-expression between the two cluster-specific probes visualized next to the dot.
Figure 3—figure supplement 3
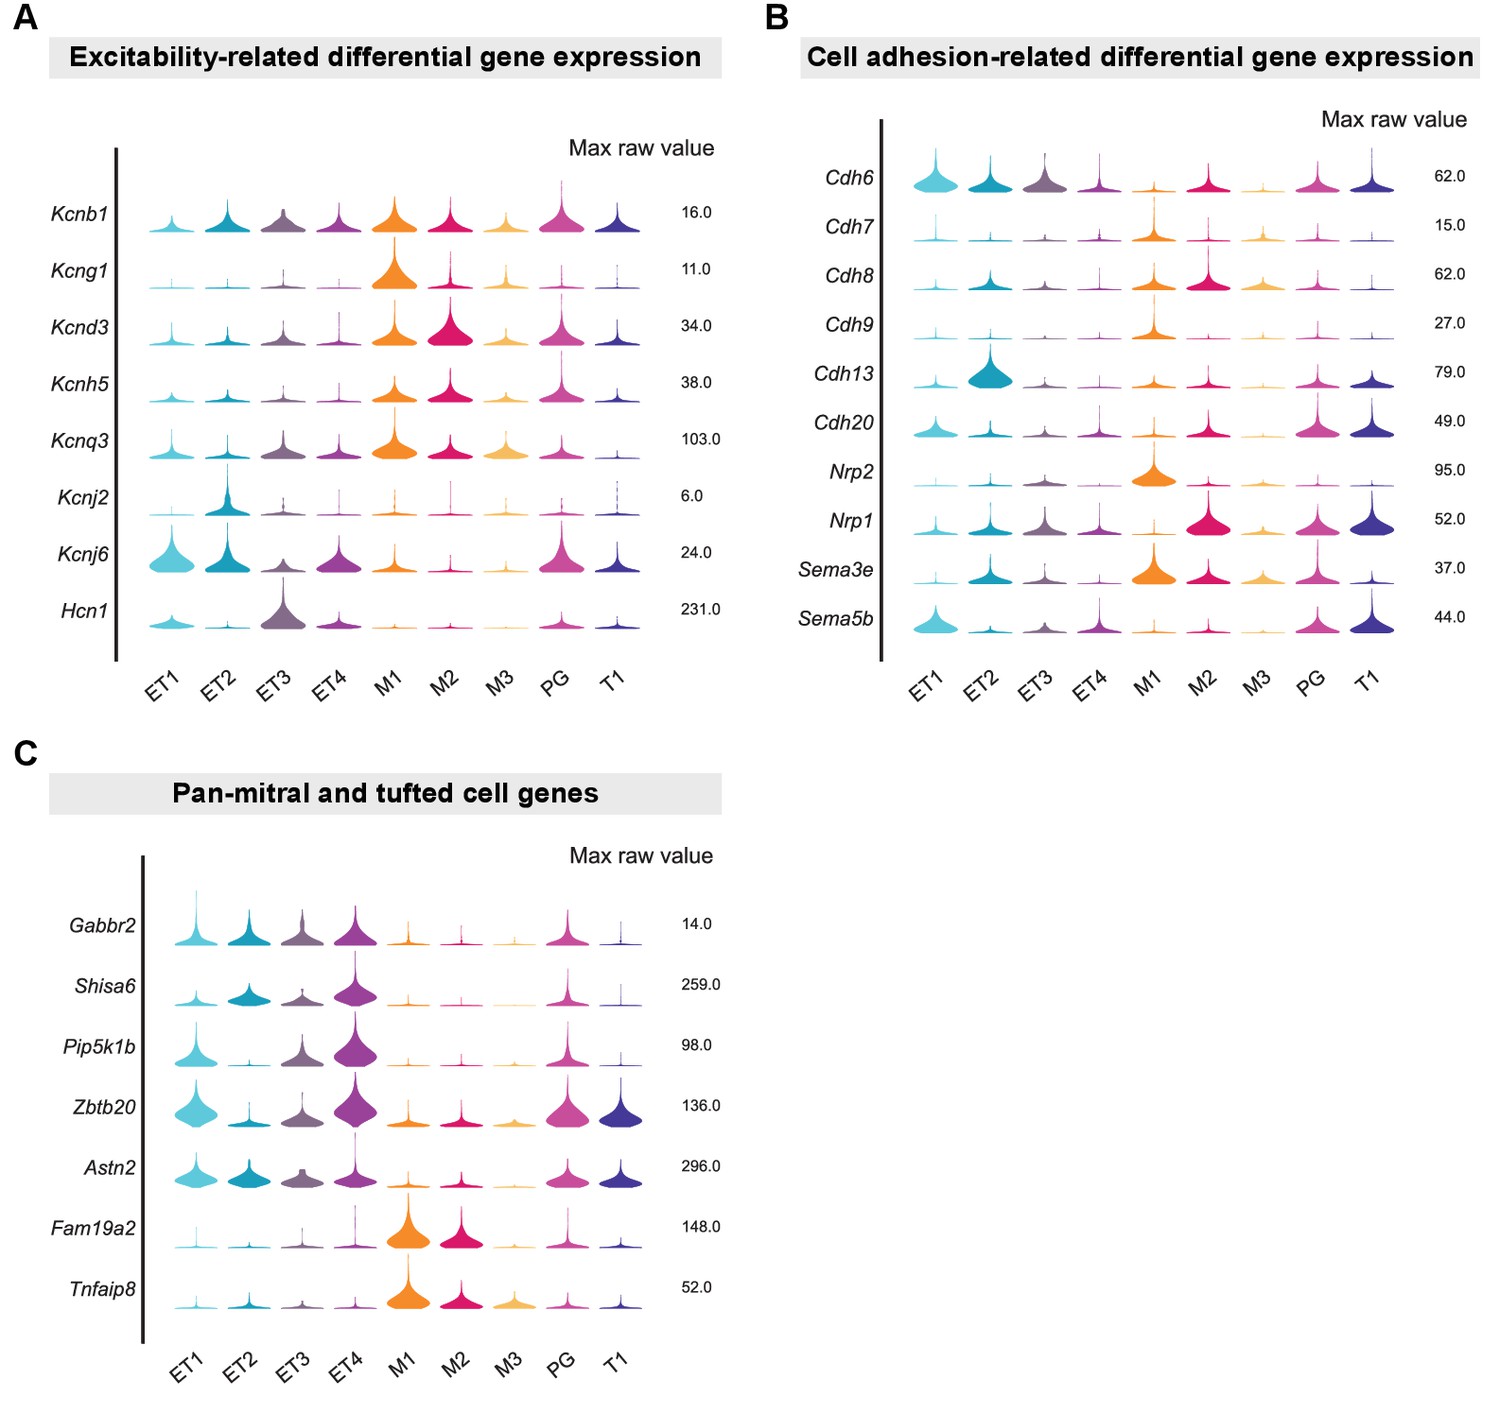
Excitability-related, cell adhesion-related, and pan-OB projection neuron DE genes.
(A) Violin plots showing maximum raw expression values of genes encoding for channels as key candidates for controlling the differential excitability of different MC and TC types. Kcng1 gene is known to encode for a voltage-gated potassium channel that forms heterotetrameric channels with the ubiquitously expressed delayed rectifying Kv2.1 potassium channel (Kcnb1). (B) Violin plots showing maximum raw expression values of genes encoding for cell adhesion and axon guidance molecules known to control the formation and maintenance of neuronal connectivity that were differentially expressed in MC and TC types. (C) Violin plots showing maximum raw expression values of pan-external tufted cell marker genes (Gabbr2, Shisa6, Pip5k1b), pan-tufted cell marker genes (Zbtb20, Astn2), and pan-mitral cell marker genes (Fam19a2, Tnfaip8).
Figure 4 with 3 supplements
Mitral and tufted cell-specific regulons combine into modules.
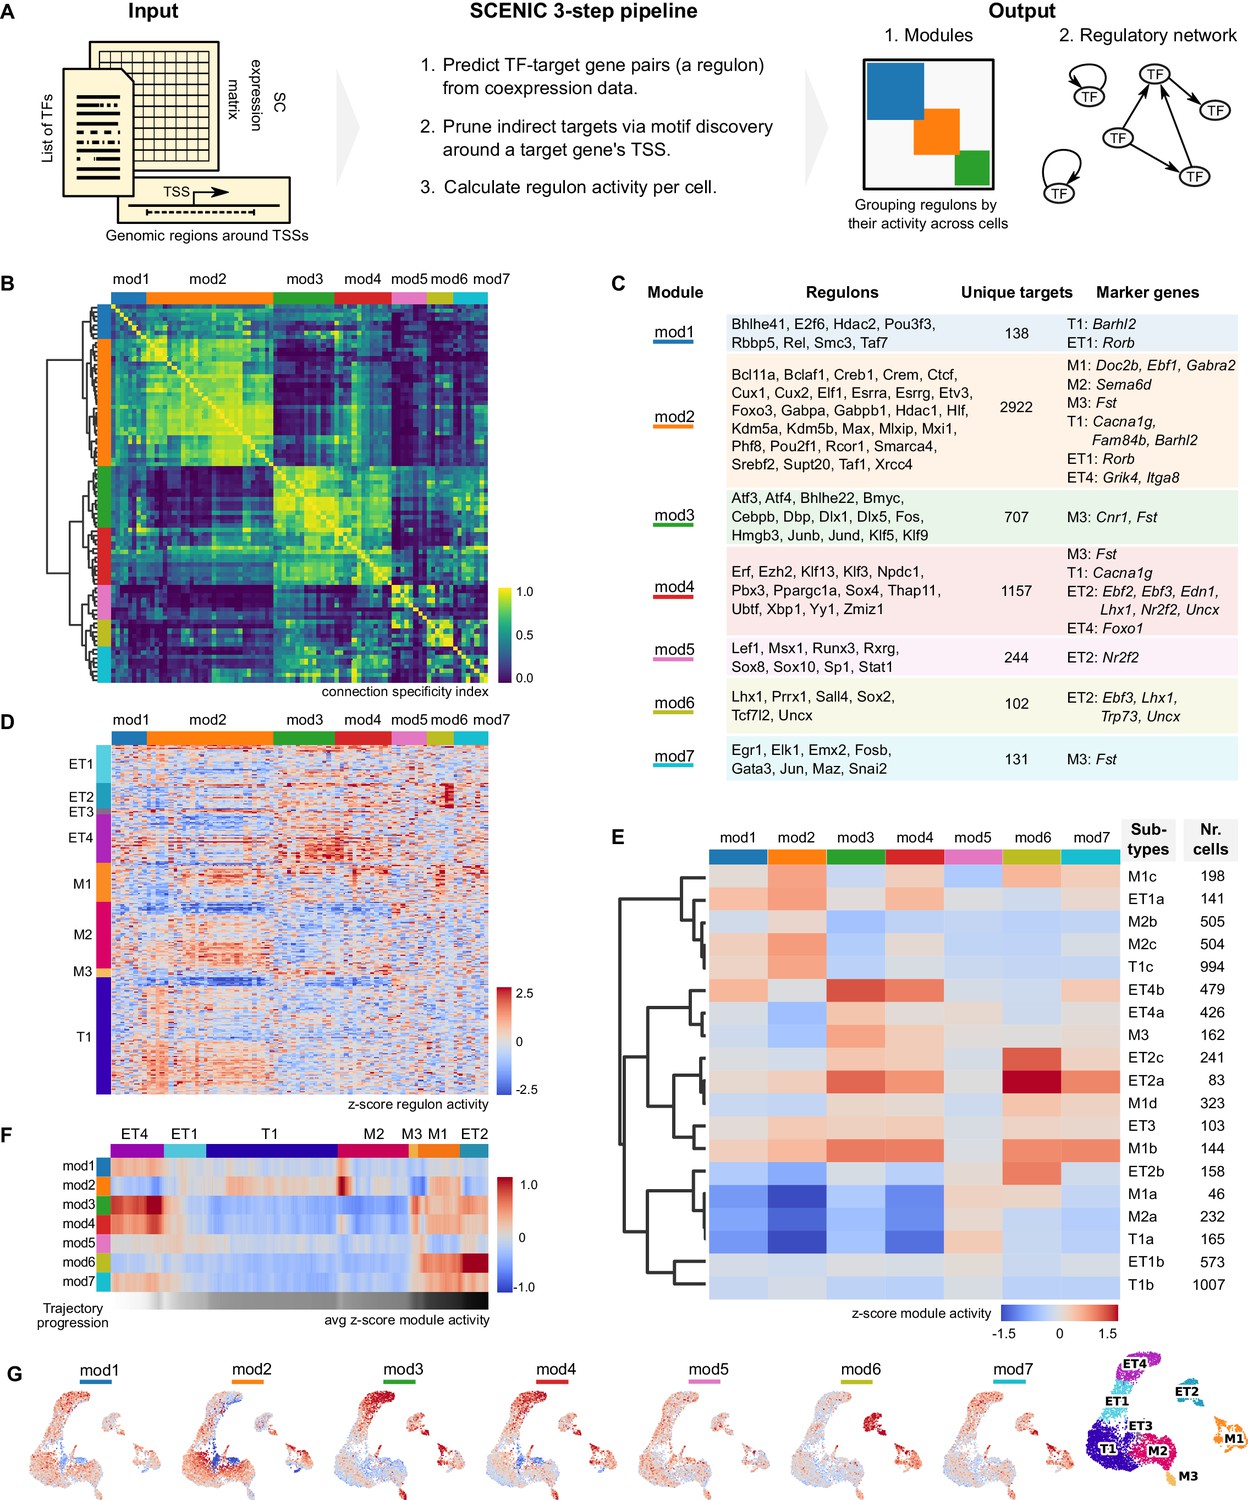
(A) Schematic representation of the network analysis pipeline, including the required input, the SCENIC protocol, and the output in the form of regulon modules and a regulatory network (in Figure 5). TSS: transcription start site; TF: transcription factor. (B) Hierarchical clustering of mitral and tufted cell-specific regulons using the Connection Specificity Index (CSI) as a distance measure results in seven modules (Ward linkage). The connection specificity index compares Pearson correlation coefficients (PCC) between regulons. If we take regulons A and B, their CSI is the number of PCC of A with other regulons and of B with other regulons that are lower than the PCC between A and B. This means that the CSI contextualizes a correlation between two regulons given how these regulons correlate to the rest. Prominent cross-module interactions are observed for mod1–2, mod3–4, and mod6–7. Module four showed interactions with all other modules. (C) Table listing the mitral and tufted cell-specific modules, their regulons, the number of unique target genes in each module, and cluster-specific marker genes found also as target genes in a given module. Marker genes were established by transcriptome analysis and shown in Figure 3B and D. (D) Regulon activity (columns) in mitral and tufted cell types (rows) defines subtypes within each cluster. Within each cell type, rows were ordered by hierarchical clustering (correlation distance, complete linkage). Columns clustered as in (B). (E) Module activity per cell subtype. Module activity is calculated as the average activity of its regulons for a given cell subtype. Rows were ordered by hierarchical clustering (correlation distance, complete linkage). Each cell subtype may be defined by a combination of active and inactive modules. For example, M2b and M2c are defined by relatively high activity in modules 1 and 2. (F) Quantification of changes in module activity through trajectory analysis. A single trajectory that traverses the cell types in the order ET4, ET1, T1, M2, M3, M1, ET2, is computed using PAGA (Wolf et al., 2019). Module activity along the trajectory is the average over a sliding window of 100 nuclei. Trajectory progression is depicted as a greyscale gradient from white to black. Along the same trajectory is also computed the regulon activity and expression levels of the corresponding TFs (Figure 4—figure supplement 3). (G) Module activity mapped on the projection neuron UMAP space (Figure 2D, rightmost UMAP for convenience). Color range as in (E).
Figure 4—figure supplement 1
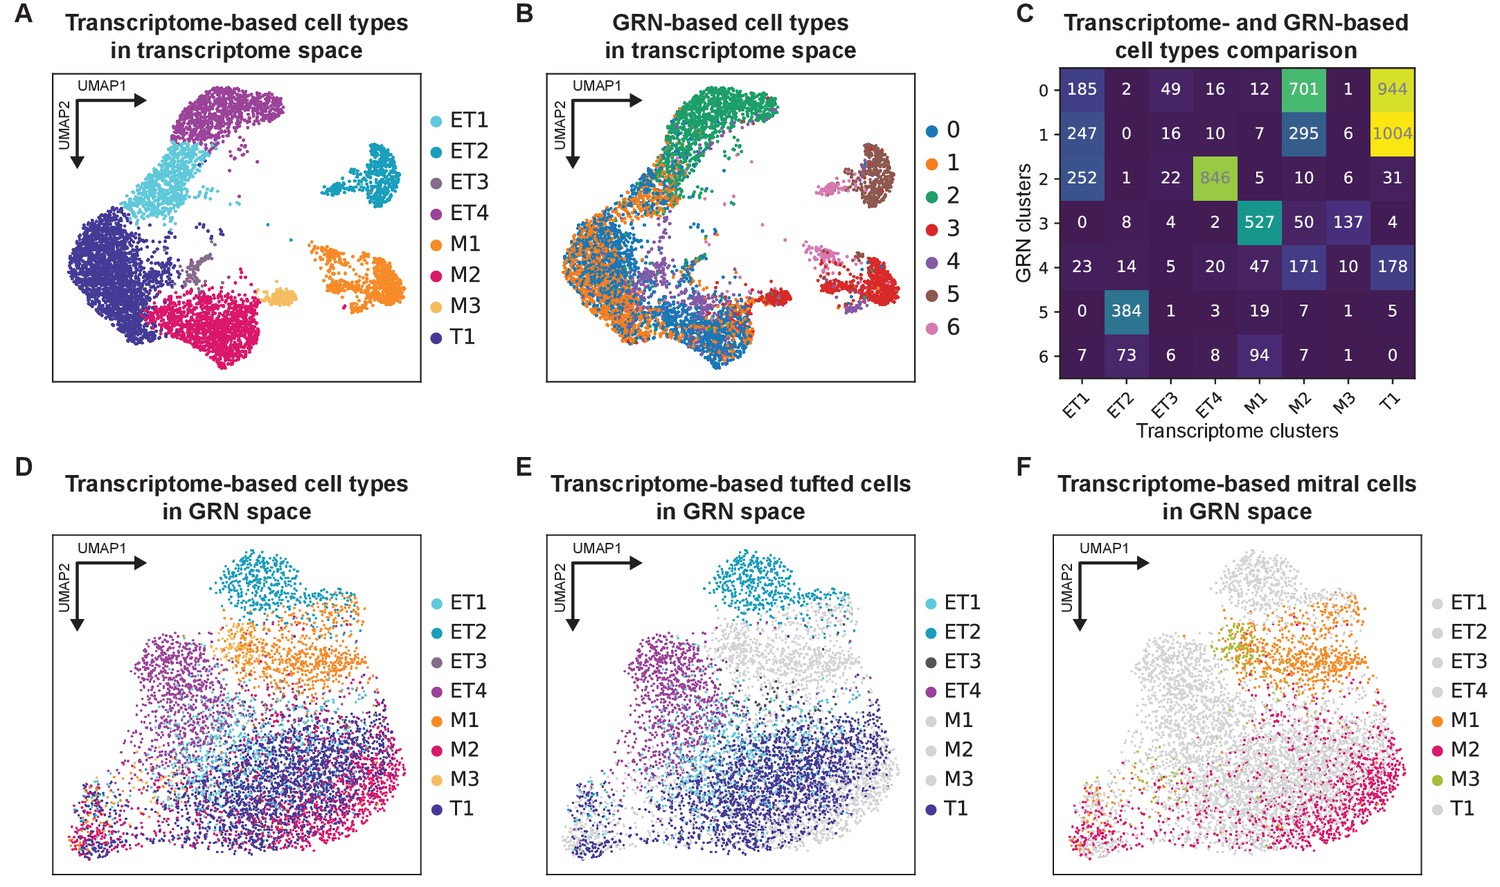
Comparing transcriptomic and gene regulatory network-defined mitral and tufted cell types.
(A) Transcriptome-defined mitral and tufted cell types in transcriptome-based UMAP space (Figure 2D) shown here for comparison with (B). PG cluster was not used in the pySCENIC gene regulatory network (GRN) analysis and therefore was removed from the plot. (B) GRN-based mitral and tufted cell types mapped onto the transcriptome-defined UMAP space. The numbers shown on the right (1–6) are the pySCENIC clusters. (C) Quantification of the comparison between transcriptomic and GRN-based mitral and tufted cell types. The Adjusted Rand Index (ARI) = 0.326 indicates differences between the two types of clustering analysis. (D) Transcriptome-defined mitral and tufted cell types in GRN-based UMAP space. Clusters are restricted to specific, yet overlapping, regions of the GRN-based UMAP. (E) Same as (D), but only tufted cell types are visualized. (F) Same as (D), but only mitral cell types are visualized.
Figure 4—figure supplement 2
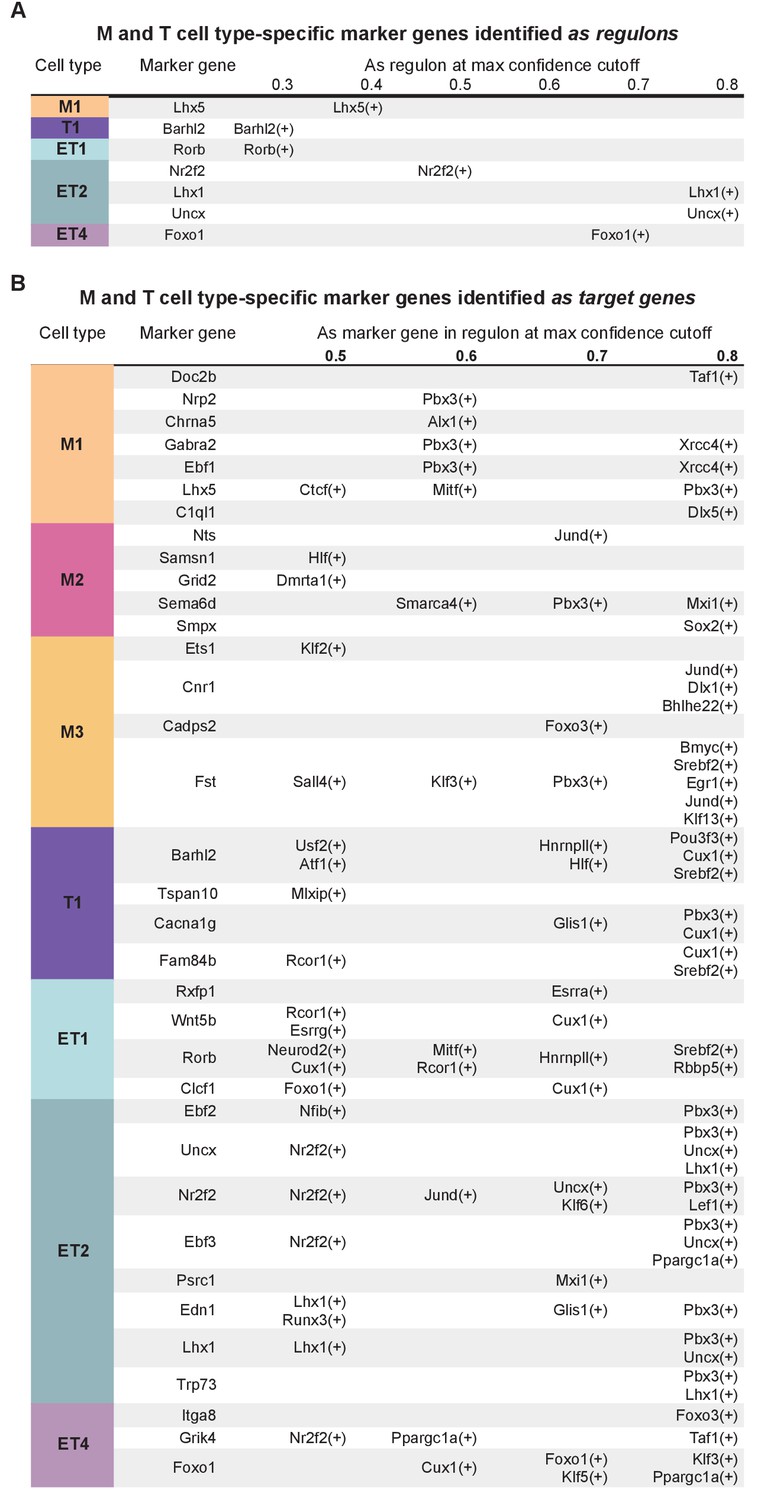
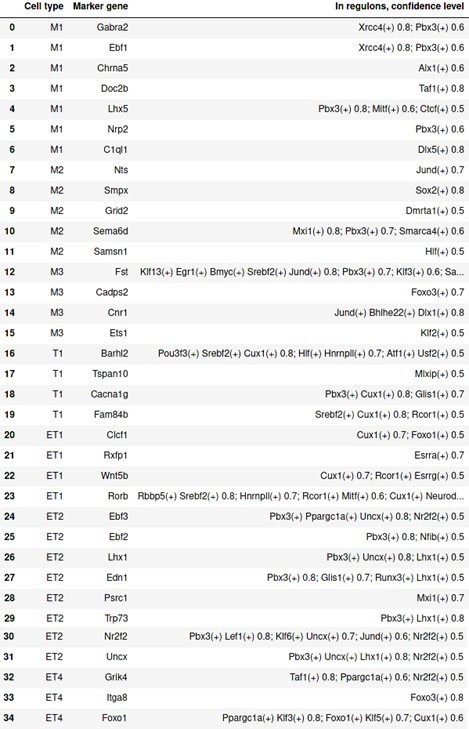
Mitral and tufted cell type-specific marker genes found in regulons.
(A) Mitral and tufted cell type-specific marker genes identified as regulons in pySCENIC analysis. Columns from left to right: cluster membership; marker gene; marker gene as regulon with its max confidence cut-off. Regulons with a confidence cut-off ≥0.3 are shown. (B) Presence of mitral and tufted cell type-specific marker genes as target genes in pySCENIC analysis. Columns from left to right: cluster membership; marker gene; presence in regulon(s) at the corresponding highest confidence cut-offs. Regulons with a confidence cut-off ≥ 0.5 are shown.
Figure 4—figure supplement 3
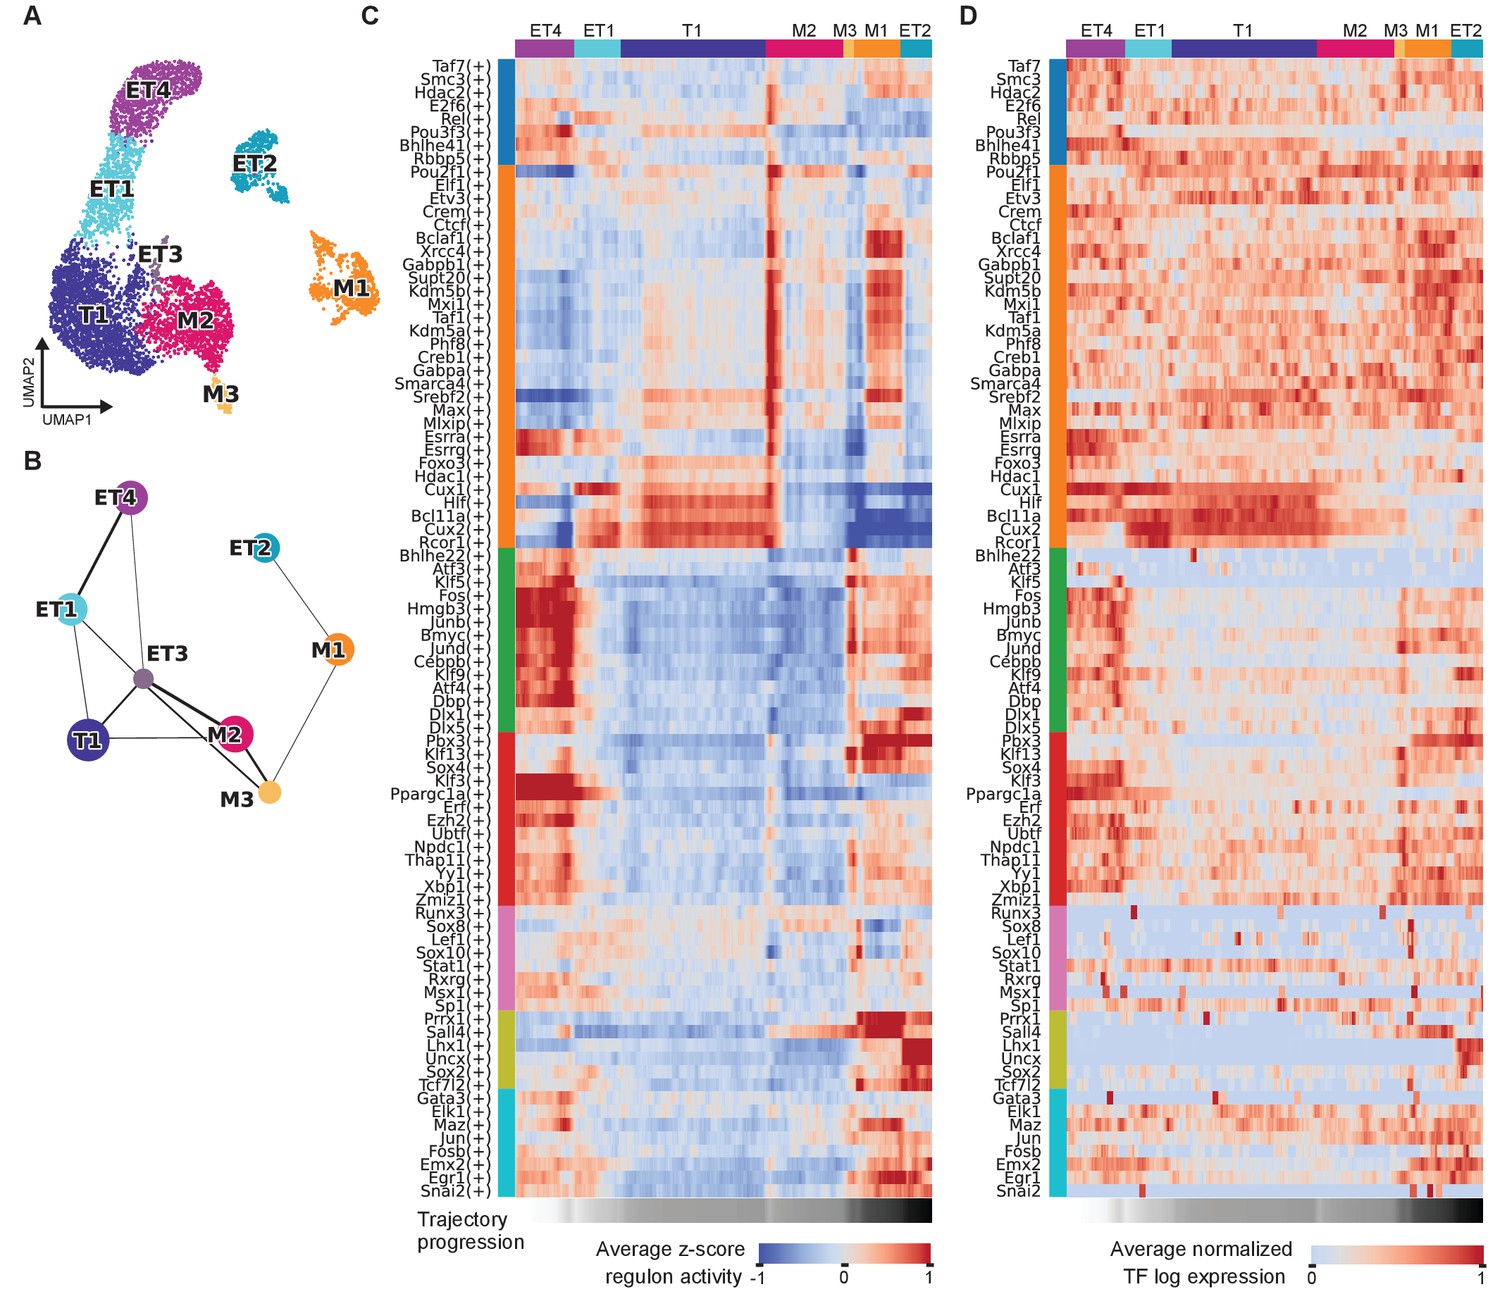
PAGA-based trajectory analysis of mitral and tufted cell types.
(A) Recomputed transcriptome-based UMAP with the PG cluster removed from the data. (B) The PAGA graph derived from the clustering in (A). (C) Average regulon activity along the trajectory ET4, ET1, T1, M2, M3, M1, ET2. Regulons are grouped by the module membership as indicated by the vertical color-coded bars. The trajectory is averaged with a sliding window of size 100 nuclei. (D) Average transcription factor expression levels along the trajectory ET4, ET1, T1, M2, M3, M1, ET2 as in (C). Each row corresponds to the TF of the regulon as shown in (C). Log expression levels are normalized to the interval [0, 1]. The trajectory is averaged with a sliding window of size 100 nuclei.
Figure 5 with 2 supplements
Mitral and tufted cell-specific transcription factor network derived from regulons.
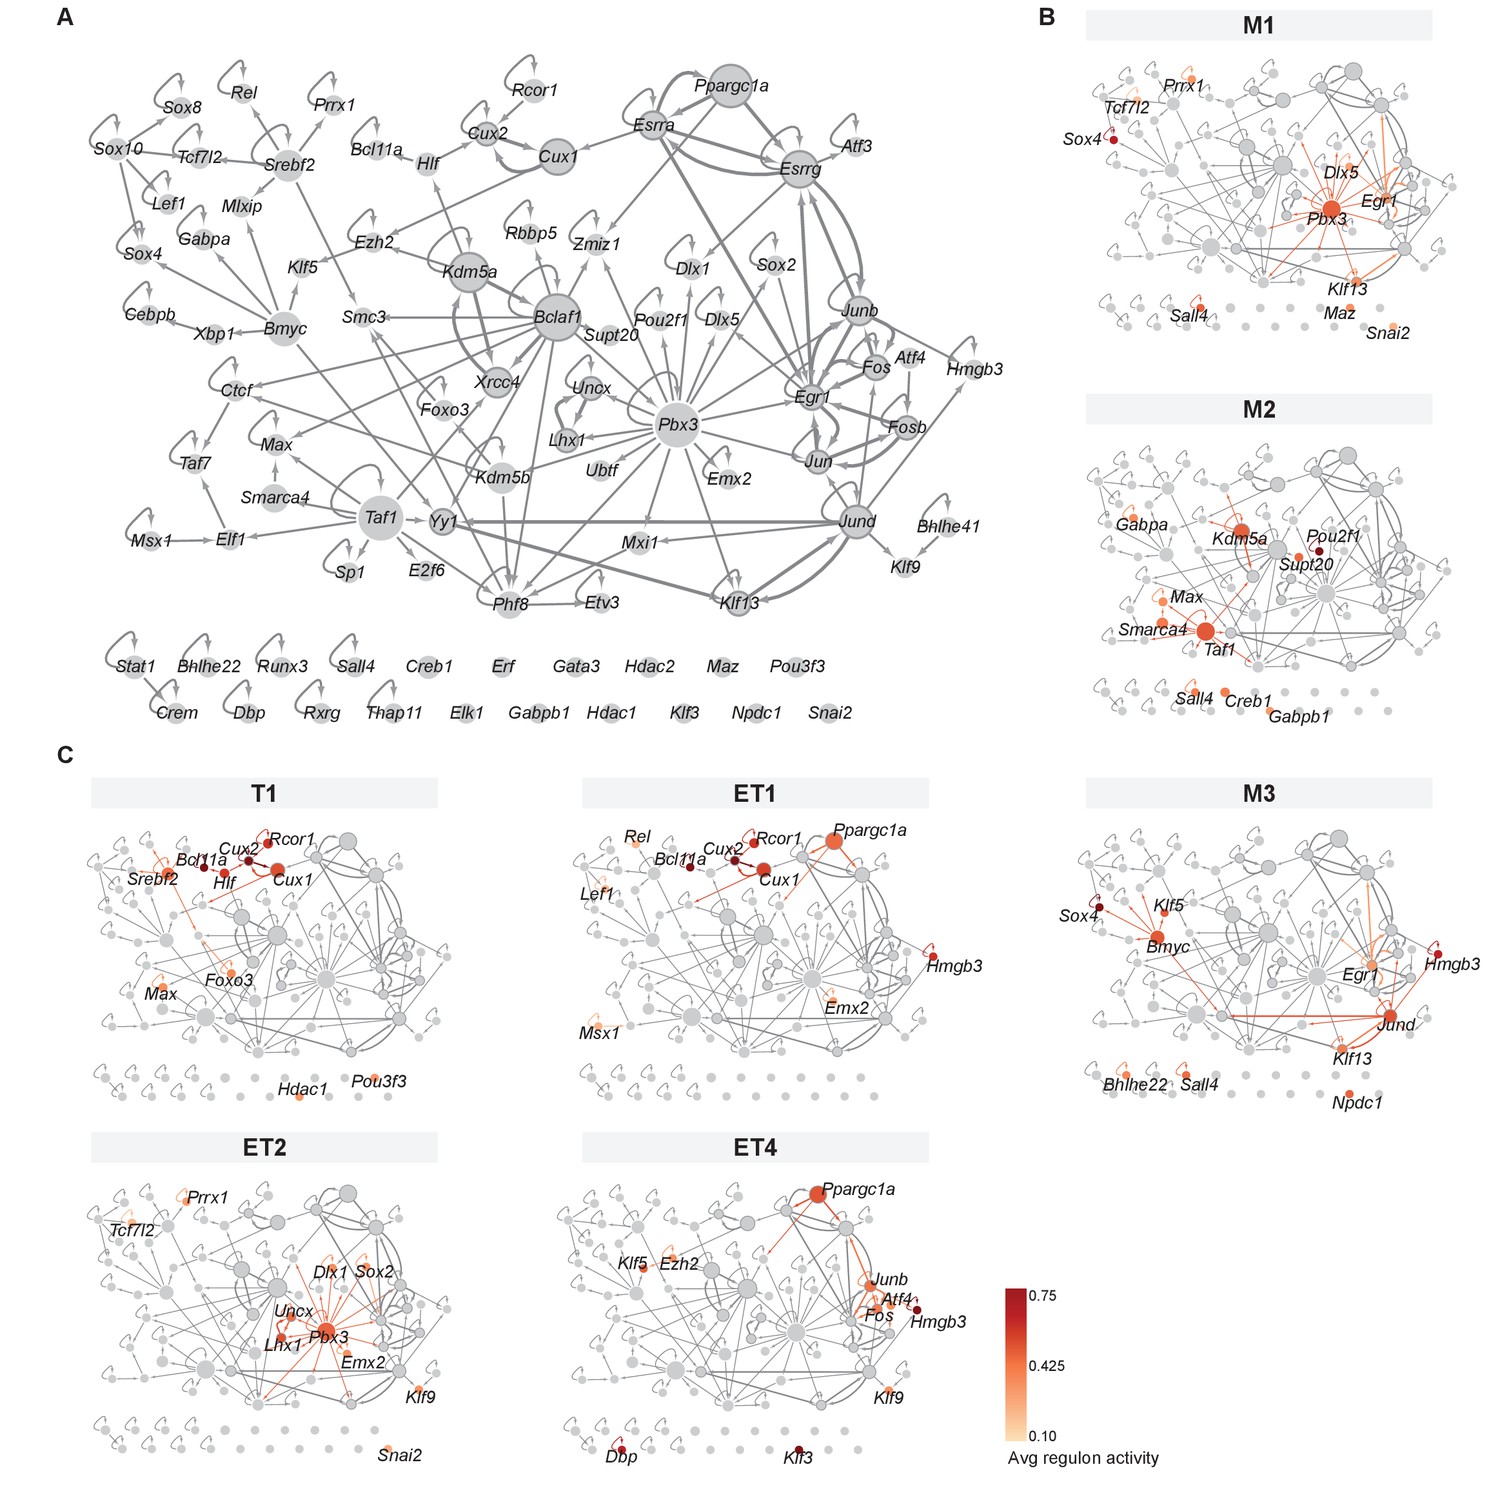
(A) Overview of mitral and tufted cell-specific transcription factor (TF) network, with node size scaled by the number of target genes and nodes colored with different shades of gray based on the outdegree (number of outgoing edges). Thick borders and edges denote cycles of 2 or three regulons. The three main hubs are: Pbx3 (outdegree 17, target genes 545), Bmyc (outdegree 11, target genes 523) and Taf1 (outdegree 9, target genes 551). (B) Same network as shown in A specific for mitral cell types (M1, M2, M3) with standardized regulon activity for the top 10 most specific regulons mapped onto the corresponding TF nodes (compare Figure 4D,E). Regulon specificity scores are shown in Figure 5—figure supplement 1A, with expression of the corresponding TFs visualized on UMAPs in Figure 5—figure supplement 1B. Mitral and tufted cell type-specific marker genes are visualized in the network in Figure 5—figure supplement 2. (C) Same network as shown in (A) specific for tufted cell types (T1, ET1, ET2, ET4) with standardized regulon activity for the top 10 most specific regulons. We omitted ET3 as it only has a few nuclei. As for mitral cell types, see also Figure 5—figure supplements 1 and 2.
Figure 5—figure supplement 1
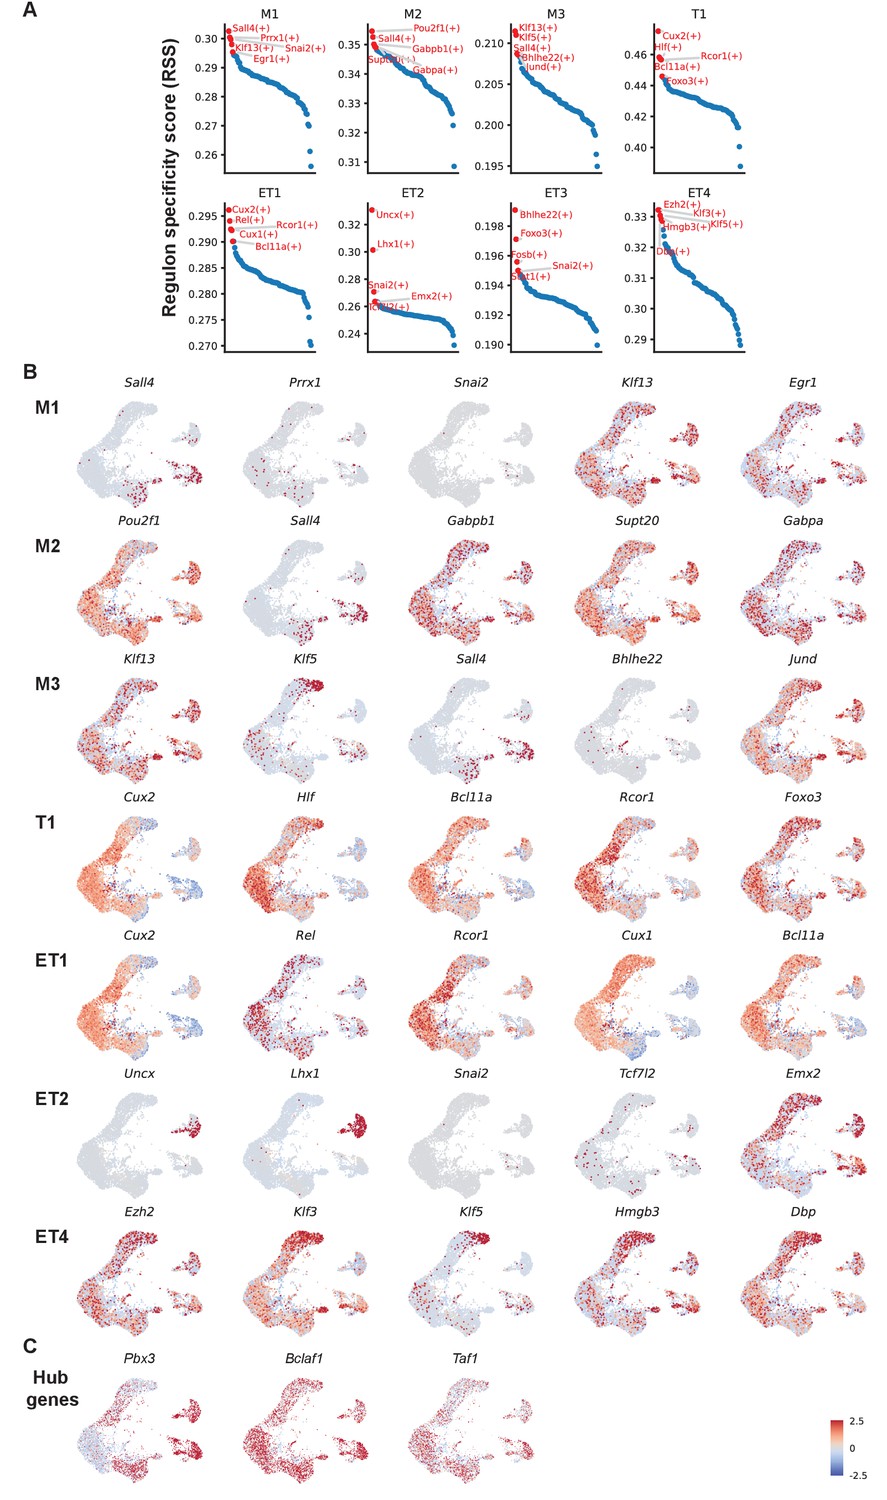
Top five mitral and tufted cell type-specific regulons.
(A) Regulon specificity score for each cell type, with the top five highest scoring regulons shown in red. Specificity scores are based on Jensen-Shannon Divergence, a metric for comparing probability distributions (Suo et al., 2018). pySCENIC provides standard functionality to compute the scores. (B) UMAP representations of the top five mitral and tufted cell type-specific regulons (transcription factors) organized in rows by the cluster membership. Z-scored expression levels are used to highlight relative differences between cell types. Four TFs, namely Prrx1, Snai2, Bhlhe22, and Tcf7l2, are only very sparsely expressed (confirmed by the raw expression levels, data not shown). Their cell-type specificity has to be interpreted with caution. (C) UMAP representations of the top three network hub genes (Pbx3, Bclaf1, and Taf1). Pbx3 is predominantly expressed in mitral cell type M1 and tufted cell type ET2. Bclaf1 and Taf1 are more broadly expressed across all M/T cell types. Nuclei are color-coded by the raw expression level of transcripts.
Figure 5—figure supplement 2
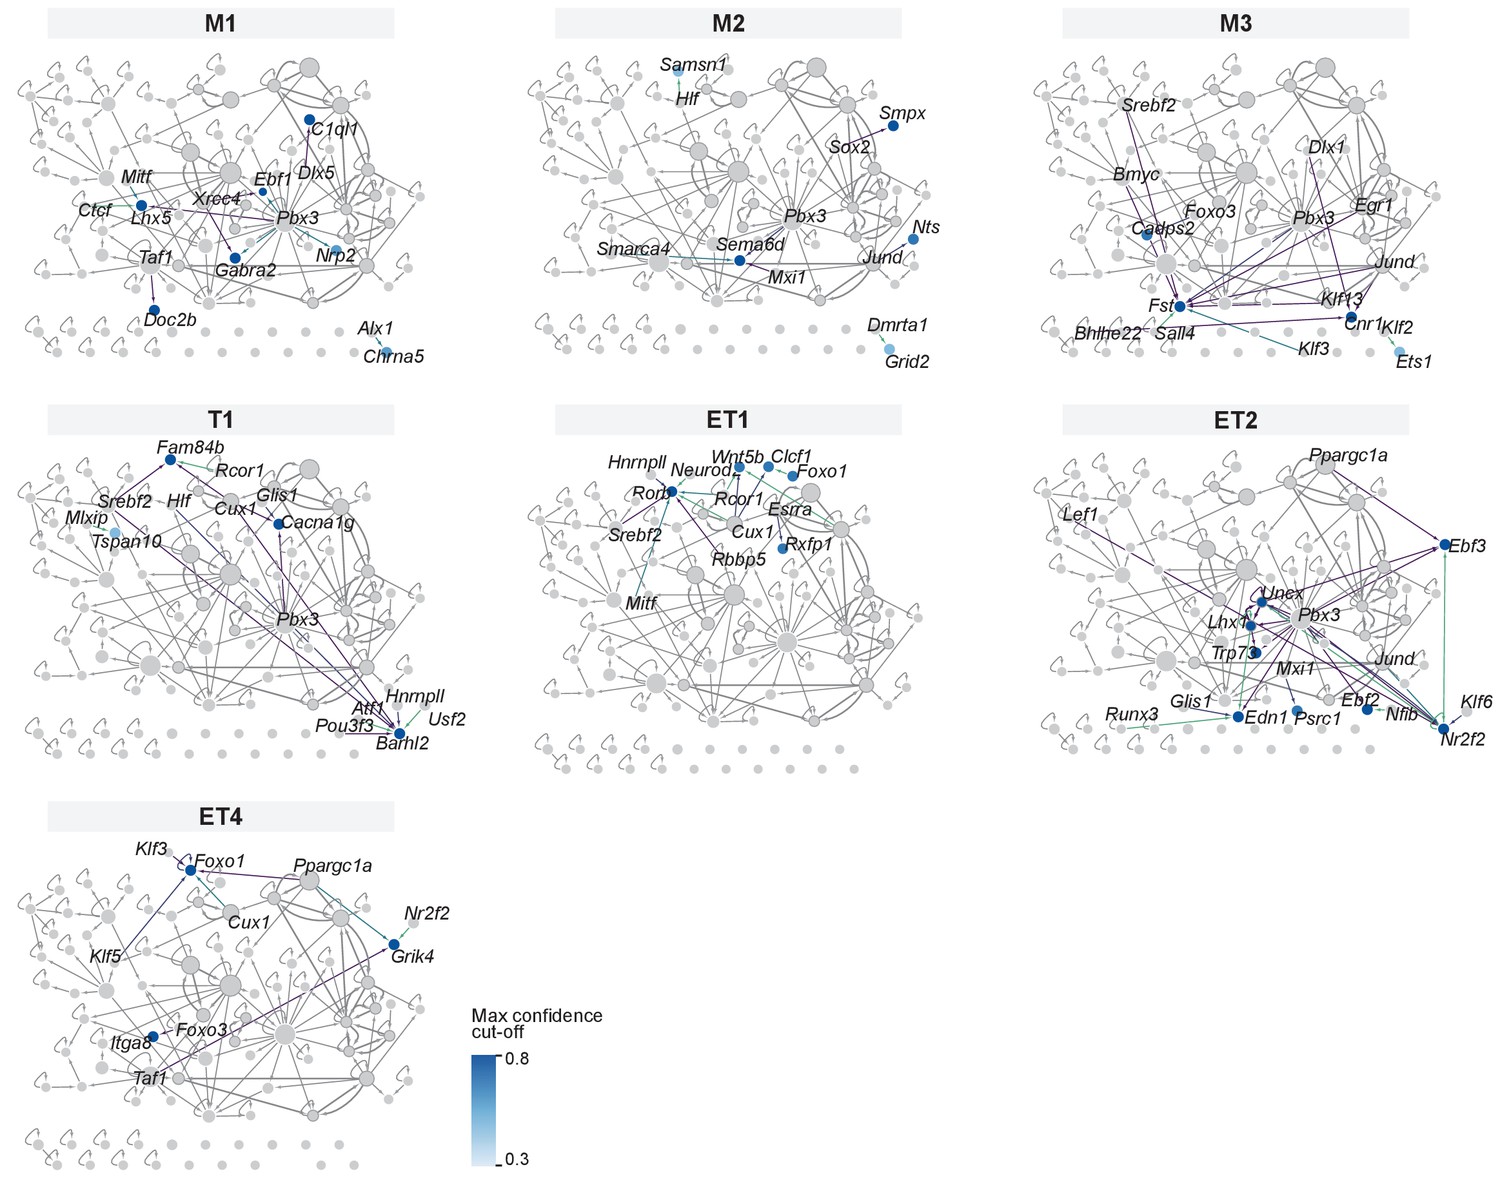
Mitral and tufted cell type-specific marker genes visualized as target genes in the gene regulatory network.
For each mitral and tufted cell type, marker genes are integrated in the gene regulatory network (network shown in Figure 5), with nodes and interactions colored by the highest confidence cut-off that would keep the marker gene in the regulon dataset. Results based on a confidence cut-off ≥0.3 are included, consistent with Figure 4—figure supplement 2.
Figure 6
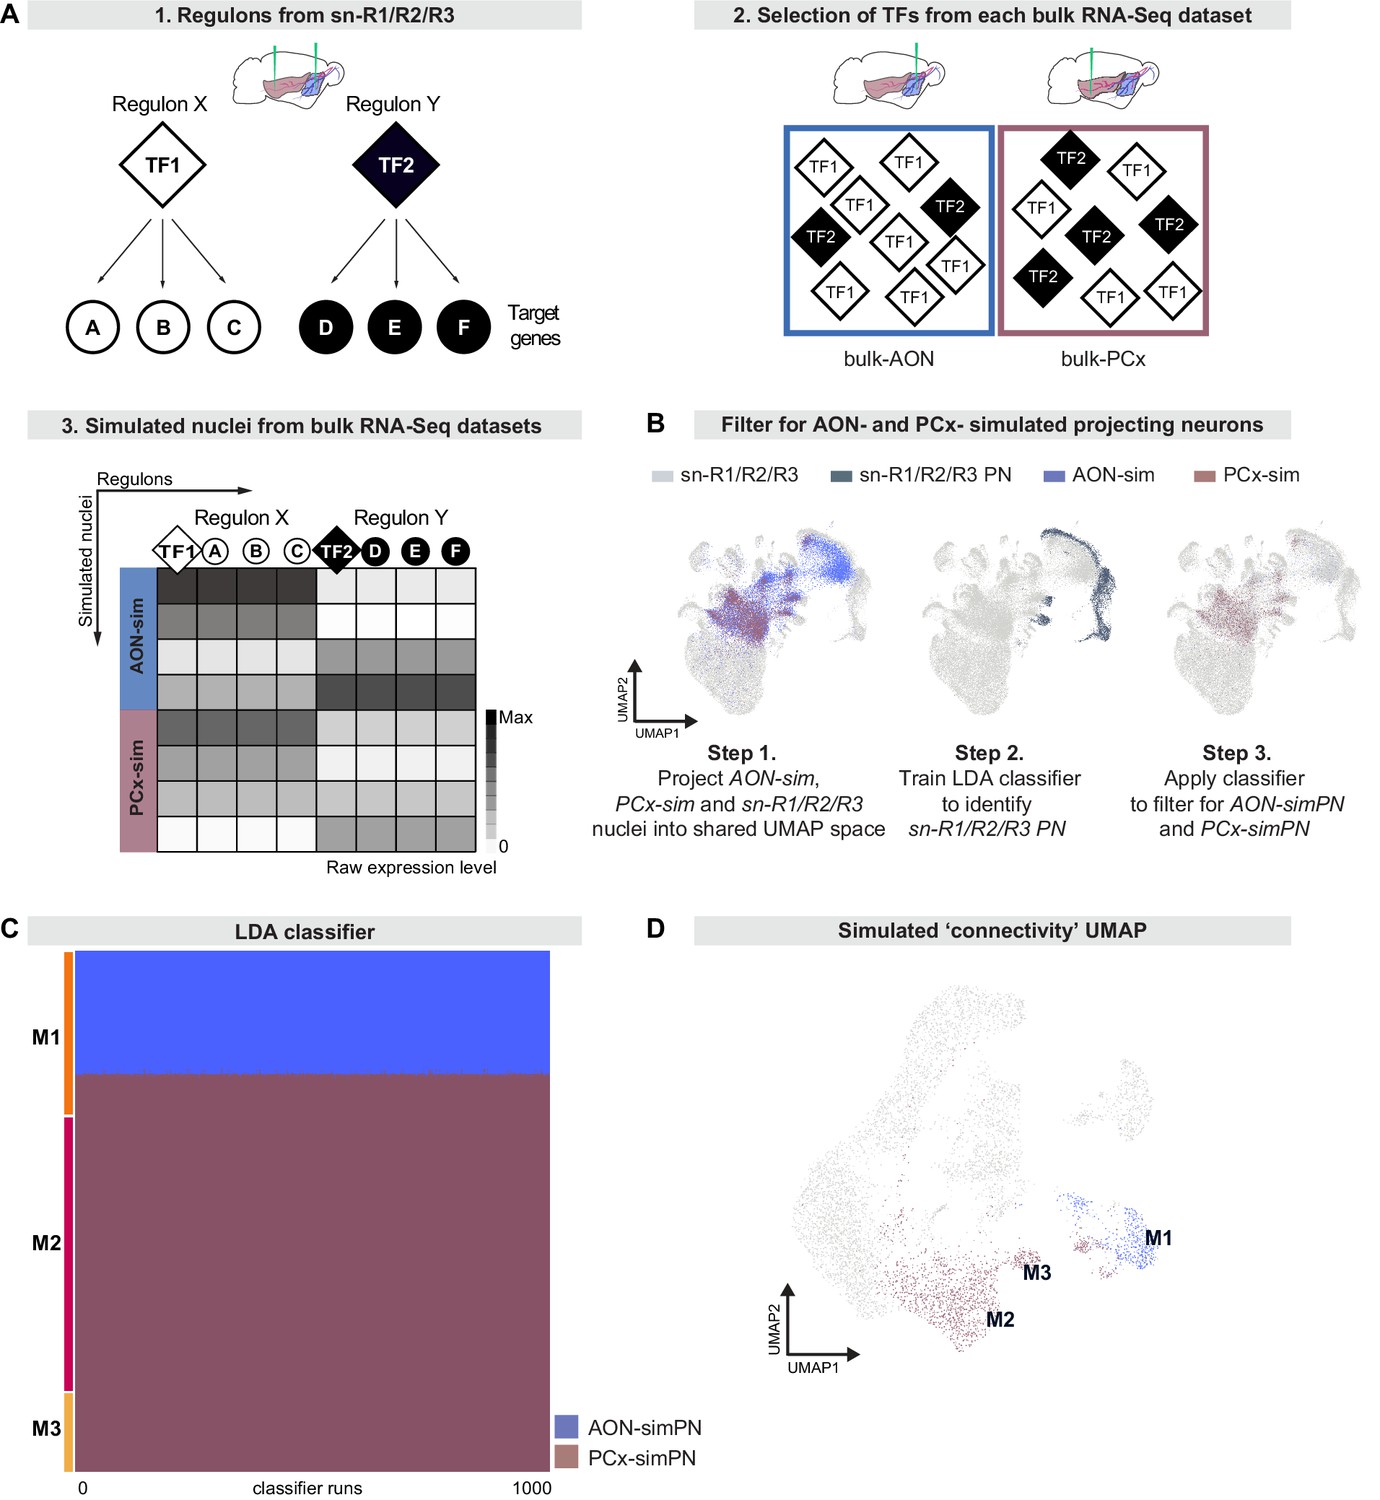
Regulon-based simulations from bulk RNA deep sequencing data suggest that mitral cell types have distinct projection targets.
(A) Schematic representation of strategy to integrate bulk RNA-seq and single nucleus RNA-seq data. (A1) Simulations use regulons inferred from sn-R1/R2/R3 data. A regulon consists of a transcription factor (TF) and all target genes (A, B, etc) that are activated by that transcription factor. (A2) When simulating nuclei from bulk RNA-seq data, the probability of selecting a given regulon is determined by the abundance of its transcription factor in the bulk RNA-seq dataset. (A3) Nuclei are simulated from each bulk dataset (AON-sim and PCx-sim) through random sampling of regulons with replacement. This method maintains broad differences between datasets while accounting for heterogeneity within each dataset. (B) AON-sim, PCx-sim and sn-R1/R2/R3 nuclei projected into a shared UMAP representation. Step 1: Blue indicates AON-sim nuclei and purple indicates PCx-sim nuclei. Step 2: Darker color indicates sn-R1/R2/R3 projection neurons. Step 3: Blue indicates AON-projecting simulated projection neurons (AON-simPN) and purple indicates pPCx-projecting simulated projection neurons (PCx-simPN). (C) Linear Discriminant Analysis (LDA) classifiers were trained on AON-simPN and PCx-simPN, then used to predict the projection target of sn-R1/R2/R3 mitral cells to investigate projection targets of sn-R1/R2/R3 derived types. Each row represents one mitral cell. Each column represents one of 1000 LDA classifiers. Blue indicates that the mitral cell was classified as AON-simPN, and purple indicates that the mitral cell was classified as PCx-simPN. Within each mitral cell type, cells are sorted vertically by their predicted projection target. (D) UMAP representation color-coded by predicted projection target. Cells in blue were predicted to be AON-simPN by all 1000 classifiers. Cells in purple were predicted to be PCx-simPN by all 1000 classifiers.
Figure 7
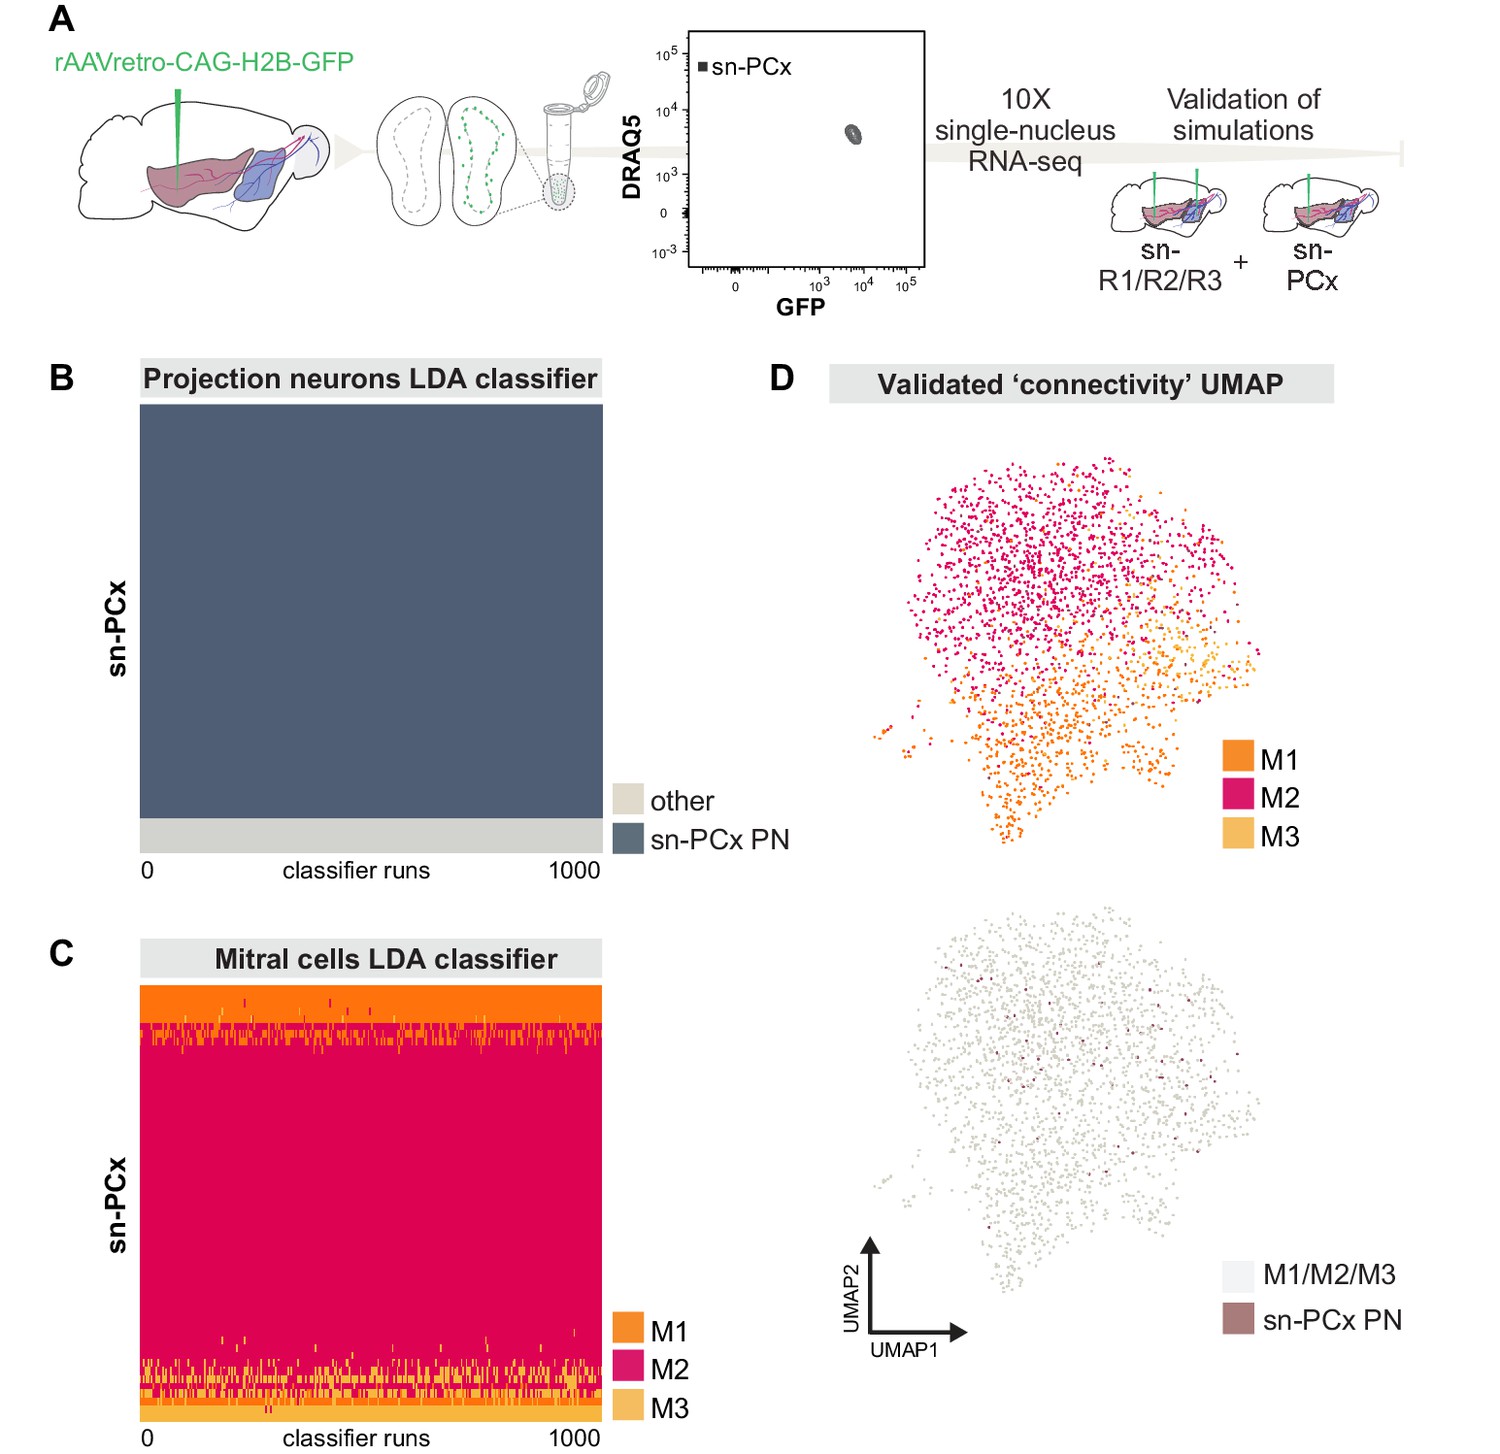
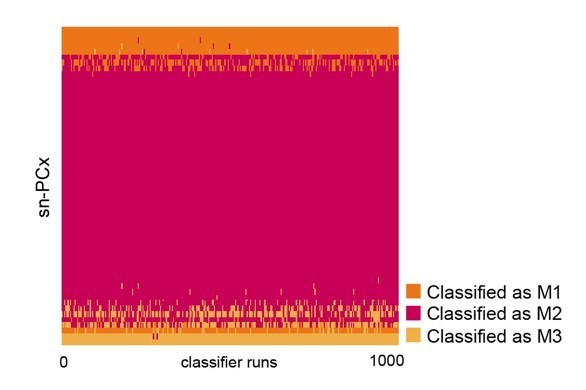
Targeted snRNA-seq experiment validates simulation-based predictions of molecularly defined-mitral cell types with distinct projection targets.
(A) Schematic representation of experimental design. Top: after injection of rAAVretro-CAG-H2B-GFP into PCx, single nuclei were dissociated from one mouse and sorted using Fluorescence-activated Nuclei Sorting (FANS). The population of nuclei is selected based on GFP and DRAQ5 (far-red fluorescent DNA dye). Sorted nuclei were sequenced using 10x single-nucleus RNA-seq and integrated with the main sn-R1/R2/R3 dataset. (B) Linear discriminant analysis (LDA) classifiers were trained on the main sn-R1/R2/R3 dataset, then used to predict the projection neuron identity of sn-PCx cells. Each row represents one cell in the new, targeted sn-PCx data. Each column represents one of 1000 LDA classifiers trained to discriminate projection neurons from other cell types. The color indicates the prediction made by each classifier (dark: projection neuron, light: other). (C) LDA classifiers were trained on the main dataset sn-R1/R2/R3, then used to predict the cell type identity of sn-PCx projection neurons. Each row represents one sn-PCx projection neuron. Each column represents one of 1000 LDA classifiers trained to predict cell type identity based on regulon expression. Color indicates the predicted cell type identity (orange: M1, red: M2, yellow: M3). (D) UMAP showing sn-R1/R2/R3 mitral cells and sn-PCx projection neurons integrated in the same low-dimensional space. UMAP was computed based on regulon expression. sn-PCx projection neurons are in purple, while sn-R1/R2/R3 mitral cells are in color according to their cell type identity (orange: M1, red: M2, yellow: M3) on the top UMAP, while in grey on the bottom (same) UMAP.
Author response image 1
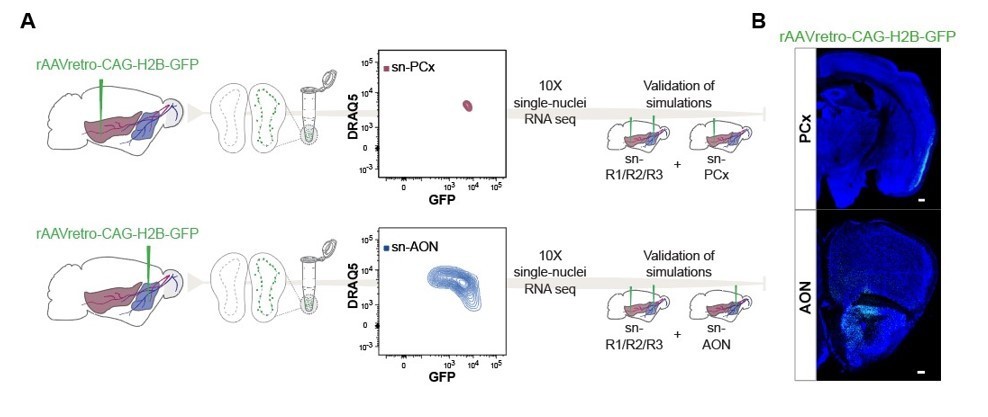
Schematic representation of experimental design and Coronal section.
(A) Schematic representation of experimental design. Top: after injection of rAAVretro-CAGH2B-GFP into PCx, single nuclei were dissociated from 1 mouse and sorted using Fluorescence-activated Nuclei Sorting (FANS). The population of nuclei is selected based on GFP and DRAQ5 (far-red fluorescent DNA dye). Sorted nuclei were sequenced using 10X single-nucleus RNA-seq and integrated with the main dataset sn-R1/R2/R3. Bottom: Same as the top figure but injection was performed into AON. (B) Coronal section showing GFP expression in the injection points for PCx (top) and AON (bottom) after injection of rAAVretro-CAG-H2B-GFP. Neurotrace counterstain in blue. Scale 50μm. PCx: Piriform Cortex; AON: Anterior Olfactory Nucleus.
Author response image 2
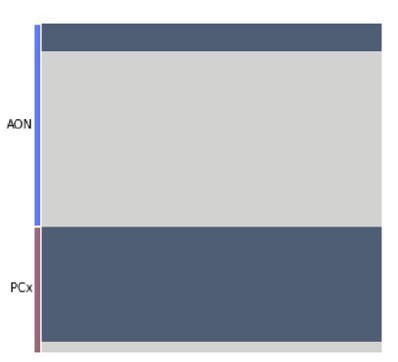
Each row represents one cell in the new, targeted snRNA-seq data.
Each column represents one of 1000 linear discriminant analysis (LDA) classifiers trained to discriminate projection neurons from other cell types (analogously to the analysis in the original manuscript Figure 7B). The color indicates the prediction made by each classifier (dark: projection neuron, light: rest).
Author response image 3
Linear discriminant analysis (LDA) classifiers were trained on the original, larger snRNA-seq dataset, then used to predict the cell type identity of projection neurons in a new, targeted snRNA-seq dataset.
Each row represents one projection neuron in the new, targeted sn-PCx data. Each column represents one of 1000 linear discriminant analysis (LDA) classifiers trained to predict cell type identity based on regulon expression. Color indicates the predicted cell type identity (orange: M1, red: M2, yellow: M3).
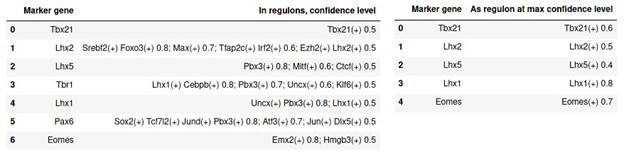
Author response image 4

Seurat marker genes identified as regulons in pySCENIC.
Columns are cell type, marker gene, and the marker gene as regulon with its max confidence cutoff. Any regulon with a confidence cutoff <0.3 is ignored.
Author response image 5
Presence of marker genes identified through Seurat as target genes in regulons of SCENIC.
Columns from left to right are: cell type; marker gene; presence in regulon(s) with corresponding confidence cutoffs. Any regulon with a confidence cutoff <0.4 is ignored.
Author response image 6
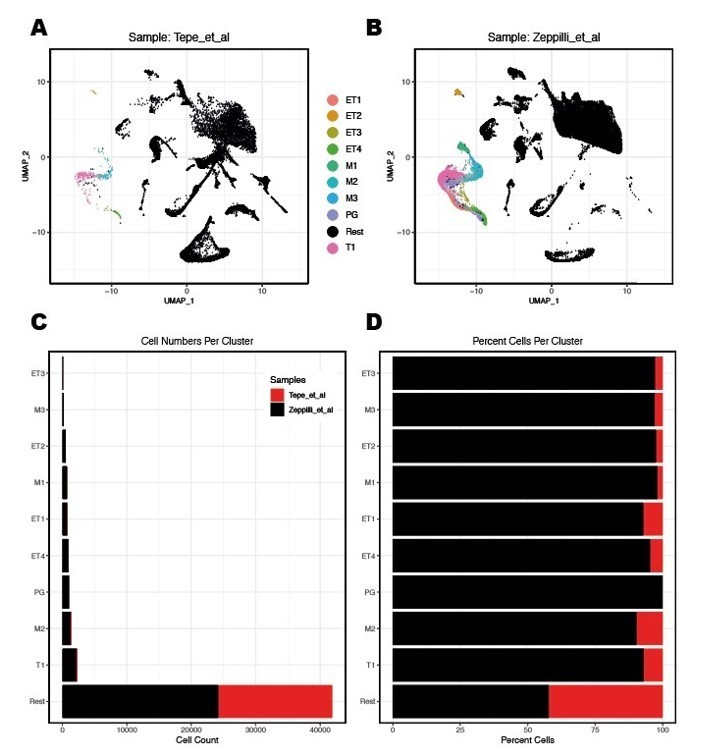
Integration of nuclei from R1/R2/R3 snRNA-seq with cells from Tepe et al.
2018 dataset.(A,B) Integration of WT replicates from the Tepe et al. study with the integrated R1/R2/R3 snRNAseq dataset of the present study. Count data for samples WT1 and WT2 were extracted from file GSE121891_OB_6_runs.raw.dge.csv.gz. All WT1 and WT2 cells listed in the GSE121891_OB_metaData_seurat.csv.gz metadata file were used for the integration with the QCfiltered nuclei from the R1/R2/R3 snRNAseq dataset. Data integration between the two full datasets and label transfer of only projection neuron clusters (Figure 2D in the manuscript) to both full datasets were performed using the Seurat 3 R-package. MC/TC clusters are color-coded as indicated.(C,D) Quantification of cells/nuclei labelled as MC/TC clusters in the two datasets.
Author response image 7
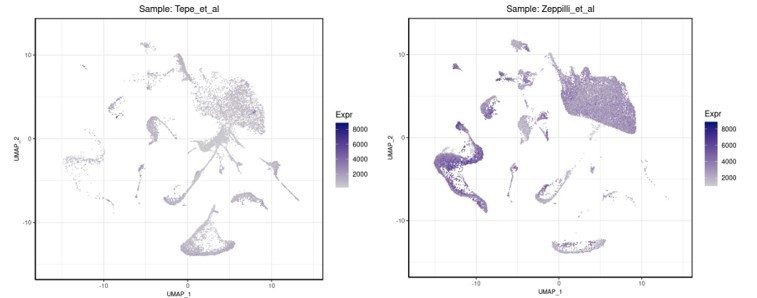
On the left is shown the number of genes per cell in the Tepe et al.
, 2018 dataset while on the right the equivalent QC parameter (gene/nucleus) in our R1/R2/R3 snRNAseq dataset.
Author response image 8
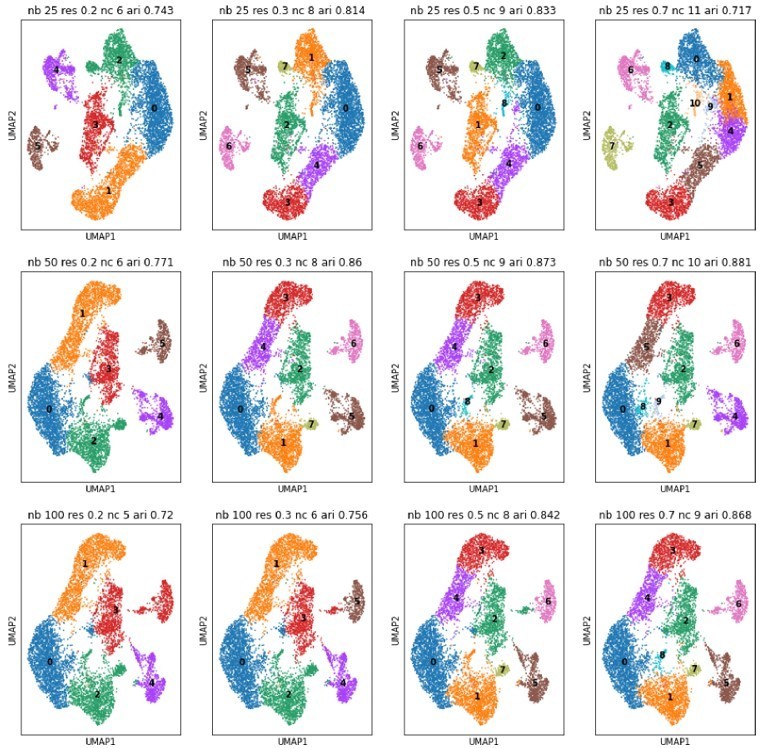
UMAPs for different numbers of neighbors (nb, rows) and different Louvain resolutions (res, columns).
Neighbors are taken at 25, 50 and 100; resolutions at 0.2, 0.3, 0.5, and 0.7. We recomputed the PCA space of the projection neuron subcluster and consequently the displayed clustering is slightly different from the one in the original manuscript (See also comment 38). ‘nc’ stands for number of detected clusters, ‘ari’ is the adjusted rand index in comparison to the clustering of the original manuscript.
Author response image 9
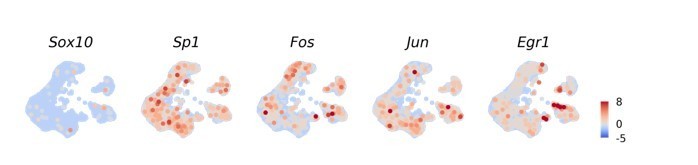
UMAPs of the reviewer’s requested TFs: Sox10, Sp1, Fos, Jun, Egr1.
All TFs, with the exception of Sox10, are expressed in the projection neurons. We note that Sox10 is sparsely expressed and was of minor importance in both the original manuscript and the current, revised one. Raw expression levels, clipped at 8, are shown.
Author response image 10
Presence of genes known for their role during OB development in regulons of SCENIC.
In the left panel, columns are: developmental gene; presence as target gene in given regulon with max confidence cutoffs. Any regulon with a confidence cutoff <0.5 is ignored. In the right panel: developmental gene; found as regulon at max confidence cutoff. Any regulon found with a cutoff <0.4 is ignored.
Tables
Key resources table
| Reagent type (species) or resource | Designation | Source or reference | Identifiers | Additional information |
|---|---|---|---|---|
| Strain, strain background (M. musculus) | C57Bl/6 | Jackson Laboratory | Stock #: 000664 RRID:IMSR_JAX:000664 | |
| Genetic reagent (Adeno-associated virus) | rAAVretro-CAG-H2B-GFP | Tervo et al., 2016 | PMID:27720486 | |
| Commercial assay or kit | Nuclei PURE Prep | Sigma | cat#: NUC201-1KT | |
| Commercial assay or kit | Arcturus PicoPure RNA Isolation Kit | ThermoFisher | cat#: KIT0204 | |
| Other | DRAQ5 | ThermoFisher | cat#: 65-0880-92 | |
| Software, algorithm | Cell Ranger version 3.0 | 10x Genomics | RRID:SCR_017344 | |
| Software, algorithm | Seurat v3.6 | Butler et al., 2018 | RRID:SCR_007322 | |
| Software, algorithm | Scanpy v1.7.1 | Wolf et al., 2018 | RRID:SCR_018139 | |
| Software, algorithm | glmGamPoi R-package | Ahlmann-Eltze and Huber, 2021 | PMID:33295604 | |
| Software, algorithm | SCENIC | Aibar et al., 2017 | RRID:SCR_017247 | |
| Software, algorithm | Cytoscape | Shannon et al., 2003 | RRID:SCR_003032 | |
| Software, algorithm | ImageJ version 2.1.0. | Schindelin et al., 2012 | RRID:SCR_003070 |
Additional files
Download links
A two-part list of links to download the article, or parts of the article, in various formats.
Downloads (link to download the article as PDF)
Open citations (links to open the citations from this article in various online reference manager services)
Cite this article (links to download the citations from this article in formats compatible with various reference manager tools)
Molecular characterization of projection neuron subtypes in the mouse olfactory bulb
eLife 10:e65445.
https://doi.org/10.7554/eLife.65445


