Genomic and healthcare dynamics of nosocomial SARS-CoV-2 transmission
- Manchester Centre for Genomic Medicine, St Mary's Hospital, Manchester University NHS Foundation Trust, United Kingdom
- Division of Evolution and Genomic Sciences, School of Biological Sciences, University of Manchester, United Kingdom
- Department of Infection Prevention & Control, Manchester University NHS Foundation Trust, United Kingdom
- Department of Virology, Manchester Medical Microbiology Partnership, Manchester University NHS Foundation Trust, Manchester Academic Health Sciences Centre, United Kingdom
- Division of Diabetes, Endocrinology & Gastroenterology, School of Medical Sciences, University of Manchester, United Kingdom
- Department of Clinical Endocrinology, Manchester University NHS Foundation Trust, Manchester Academic Health Sciences Centre, United Kingdom
- Manchester Medical Microbiology Partnership, Public Health England and Manchester University NHS Foundation Trust, United Kingdom
Figures
Figure 1 with 4 supplements
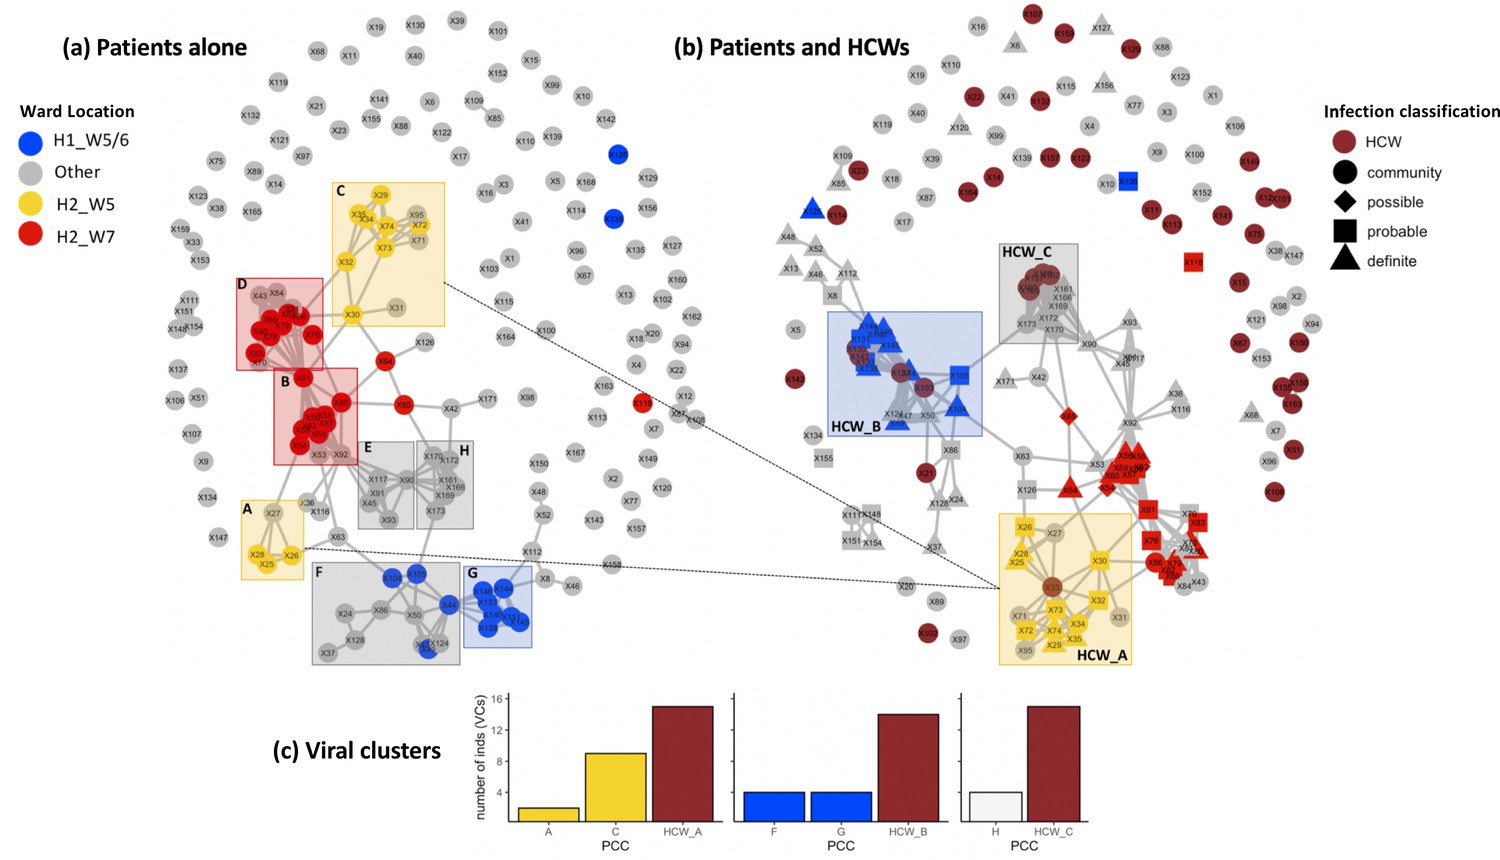
Incorporating healthcare worker (HCW) and patient admissions data into the analysis of viral genetic relatedness improves certainty of nosocomial outbreaks.
(a) Network of direct and indirect potential patient–patient contacts within the window of likely infection (3–7 days prior to positive SARS-CoV-2 test) defines eight significant patient contact clusters (PCCs, overlaid boxes); (b) network including HCW interactions one week prior to positive SARS-CoV-2 test and patient infection classification. Nodes represent individual patients or HCWs, with ordinal numbers representing their position in the constructed local phylogenetic tree. Edges indicate presence on the same hospital ward on the same calendar day. Inclusion of HCWs brings together originally disparate PCCs (b) and (c) increases the number of individuals within viral clusters (VCs) – defined as clusters of identical viral samples or derived viral samples which differ by a single genomic variant. We identified 44 individuals within VCs in the newly defined HCW contact clusters (HCW_A, HCW_B, HCW_C), 21 of whom were not identified within VCs using PCCs alone. The shape of symbols within the enlarged boxes displays the classification of SARS-CoV-2 infection in patients: community, community-acquired infection (positive test within 2 days of hospital admission); possible, possible hospital-acquired infection (positive test 3–7 days after hospital admission); probable, probable hospital-acquired infection (positive test 8–14 days after hospital admission); definite, definite hospital-acquired infection (positive test >14 days after hospital admission). The presence of several patients with definite and probable hospital-acquired infections within the PCC and HCW interaction clusters further reinforces the risk of SARS-CoV-2 transmission events between patients and HCWs on the same hospital wards.
Figure 1—figure supplement 1
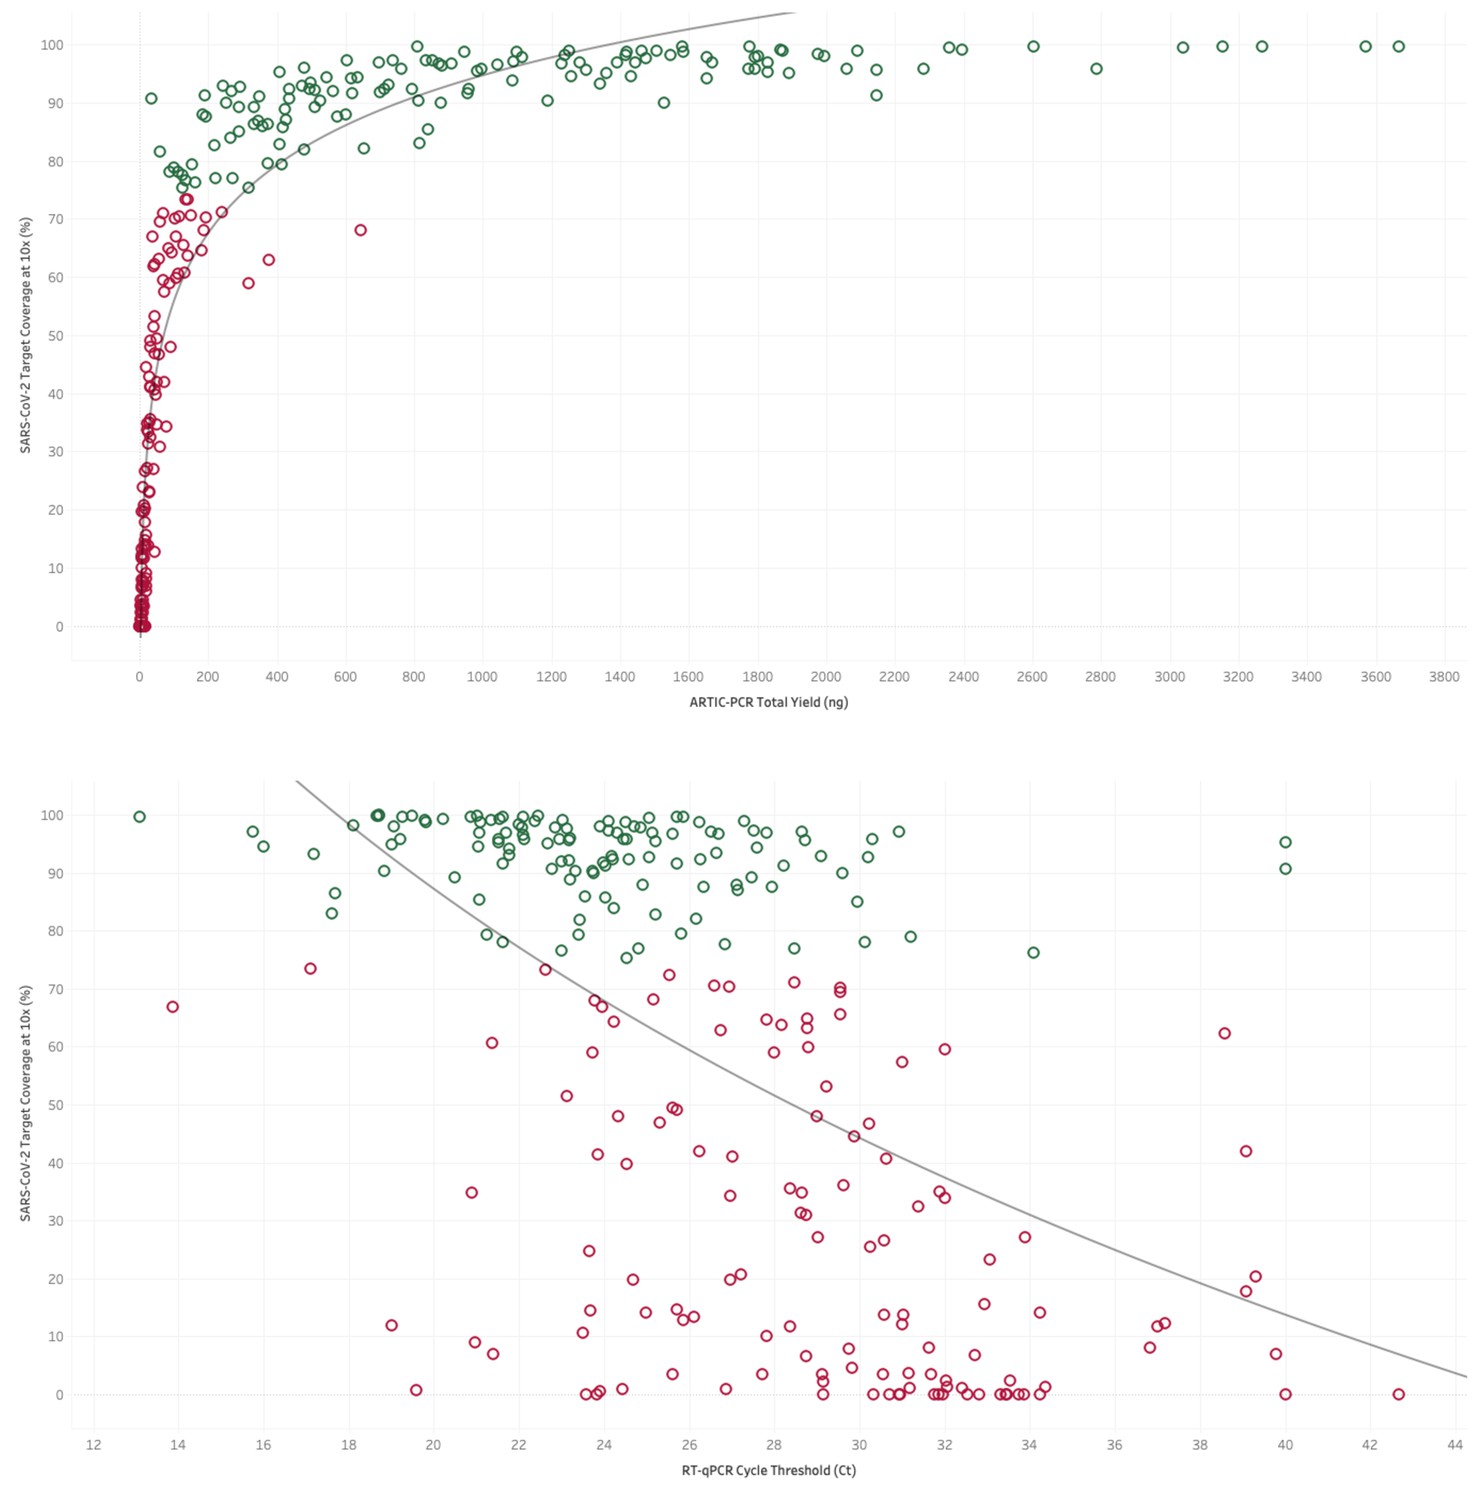
Top. The yield of DNA (ng) from tiled PCR enrichment is a good indicator of the amount of the SARS-CoV-2 genome covered by at least 10 sequencing reads.
Green dots represent samples above the 75% threshold set for high-quality sequencing datasets in this study. Bottom. Where available the cycle threshold (CT) value from RT-PCR tests for viral presence is a good indicator of the amount of the SARS-CoV-2 genome covered by at least 10 sequencing reads. Green dots represent samples above the 75% threshold set for high-quality sequencing datasets in this study, demonstrating that most samples which passed this criteria have a CT value less than 31.
Figure 1—figure supplement 2

Global lineage assignment of 173 SARS-CoV-2 genomes sequenced across Manchester University Hospital Foundation Trust.
All lineage assignments were determined through Pangolin. Eight-one percent of the samples were confidently assigned to an existing lineage (SH-alrt > 80%, UFbootstrap > 90%). We observed that 71% of samples are assigned to lineage B.1.1 and these are present in patients across 29 different hospital locations, and present in healthcare workers.
Figure 1—figure supplement 3
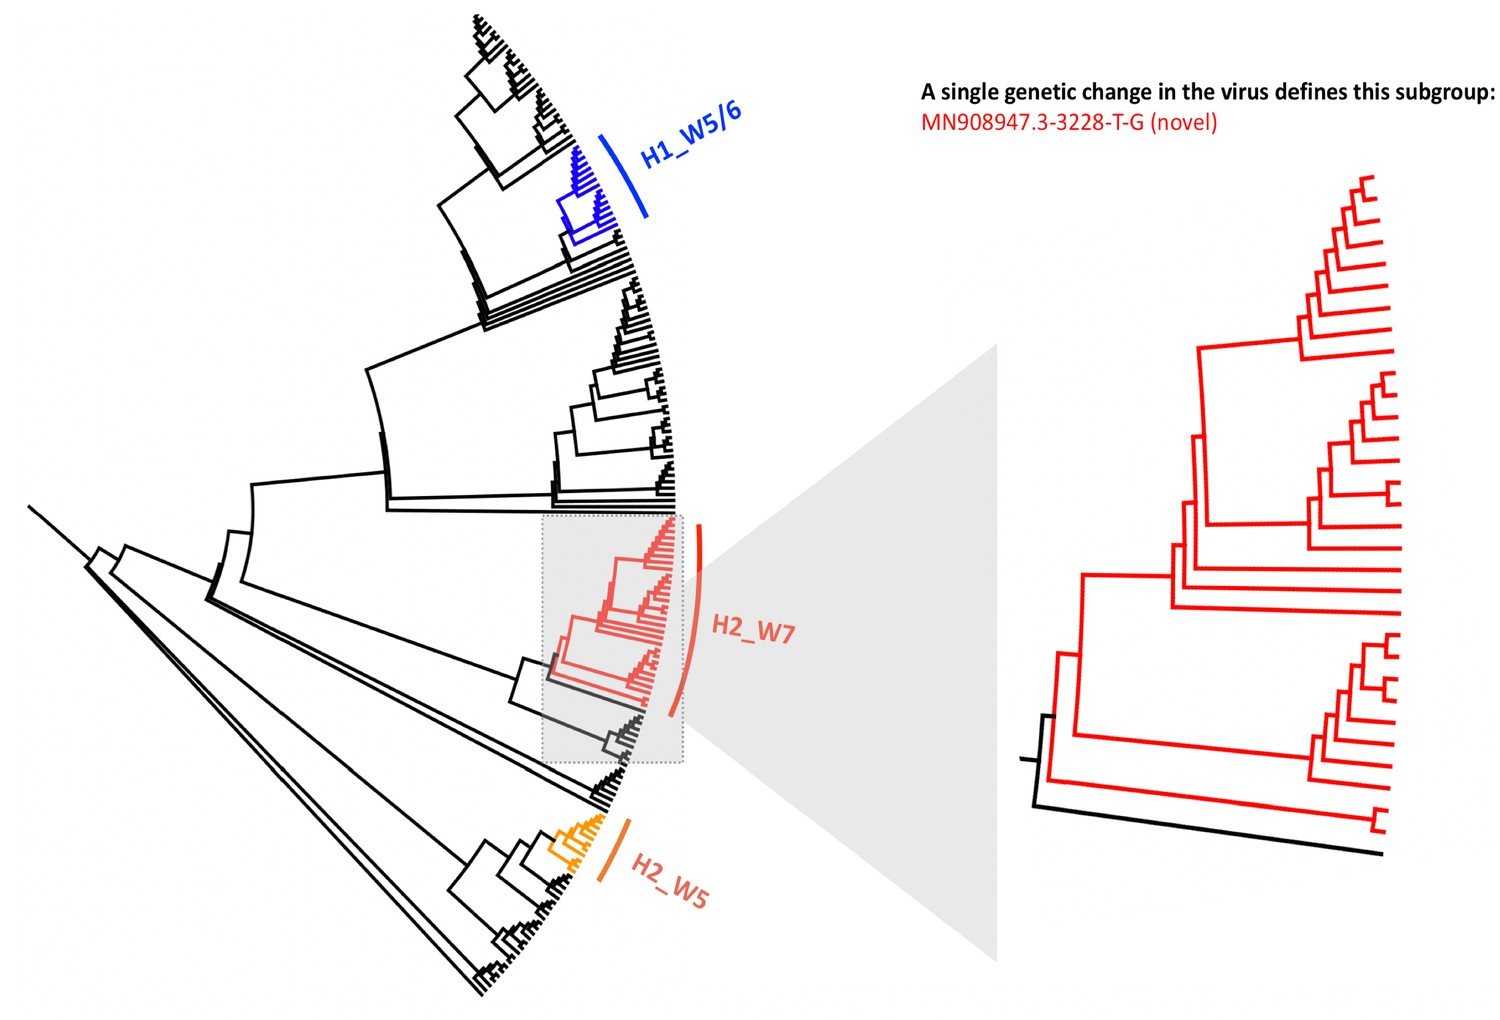
Local phylogenetic tree created for 173 SARS-CoV-2 genomes sequenced across Manchester University Hospital Foundation Trust.
The tree is rooted to the MN908947.3 SARS-CoV-2 genome and shows three clusters of genome sequences that are predominantly composed of viral samples taken from the same hospital wards. A zoomed in version of the tree is shown for the cluster predominantly composed of samples from a single ward (Hospital_2, Ward_7), showing 20 samples from this ward that all contain the same novel genomic variant MN908947.3–3228 T-G, and share significant genetic similarity to one another. The numbers indicated on nodes in Figure 1 refer to the order of sample placements in the presented phylogenetic tree, with samples ordered incrementally from MN908947.3.
Figure 1—figure supplement 4

Incorporating patient admission data into the analysis of phylogenetic relationship identifies hotspots of contacts between patients and healthcare workers (HCWs).
Left. Potential patient–patient contacts within the window of likely infection (3–7 days) are mapped onto the constructed local phylogenetic tree. Each solid dot indicates a potential direct or indirect contact between a patient of interest (y-axis) and all other patients in the high-quality sequenced cohort (x-axis). Overlaid boxes highlight areas of significant viral genetic similarity where there is a 20-fold increase in potential patient–patient contacts than expected by chance, and reflect the patient contact clusters (PCCs) highlighted in Figure 1. Right. Potential patient–HCW contacts (in the 1 week prior to patient positive SARS-CoV-2 test) are incorporated into the contacts mapped onto the constructed local phylogenetic tree, increasing density of contacts within several hotspots.
Figure 2
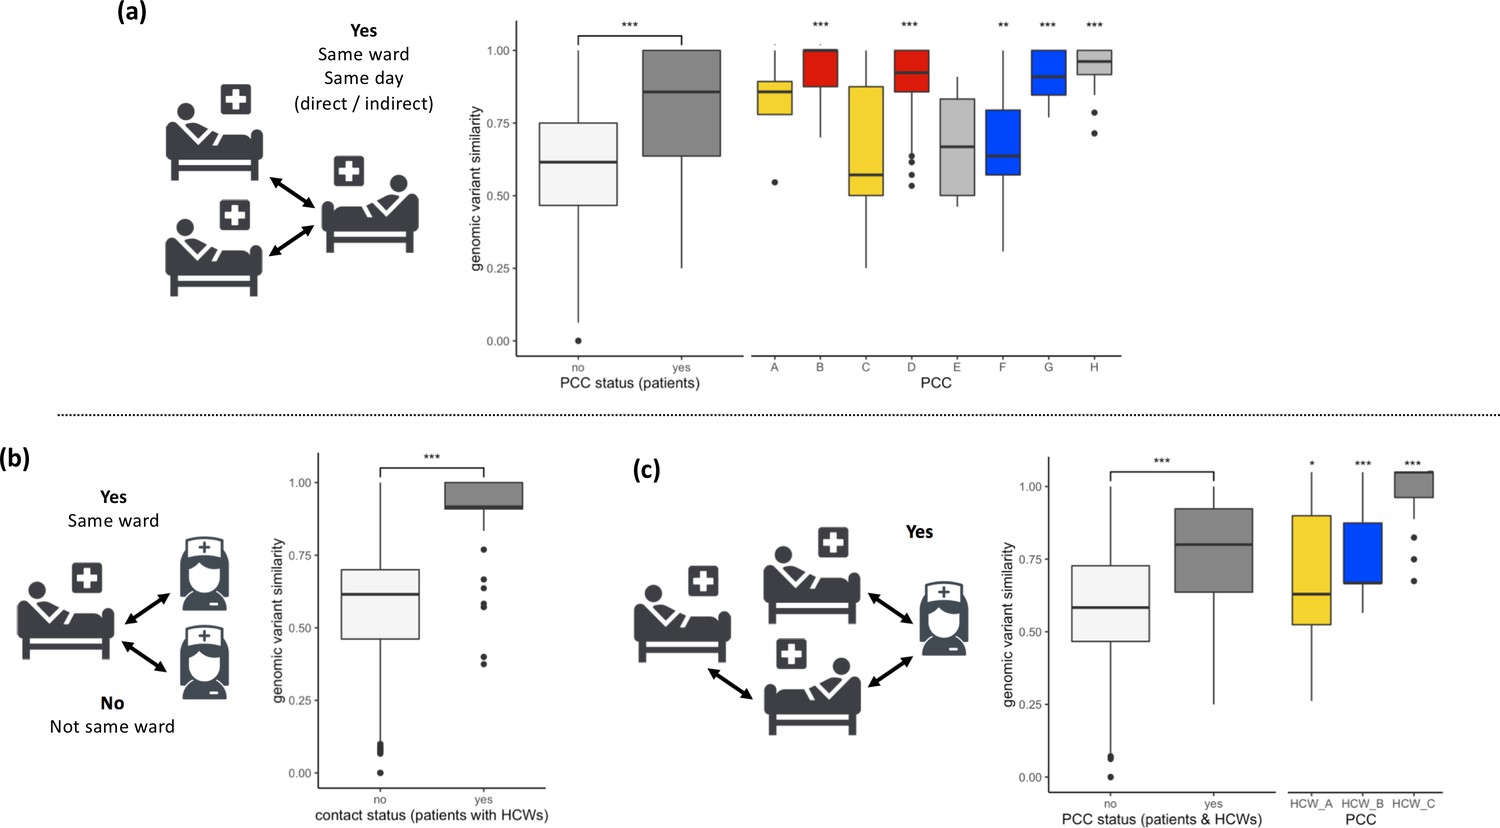
SARS-CoV-2 viral genomes are more similar in groups of patients and healthcare workers (HCWs) who have been in contact prior to a positive SARS-CoV-2 test.
(a) Pairwise genomic variant similarity comparisons of SARS-CoV-2 genomes by the status within patient contact clusters (PCCs) demonstrates increased genetic similarity when patients have been in direct or indirect contact with one another 3–7 days prior to positive SARS-CoV-2 test. Pairwise comparisons within PCCs (n = 544) were tested against all pairwise comparisons that were not defined within the PCCs (n = 29,212). (b) Pairwise genomic variant similarity comparisons of SARS-CoV-2 genomes by patient–HCW interactions in the week prior to positive SARS-CoV-2 test (n, yes = 98, no = 11,836). (c) Pairwise genomic variant similarity comparisons of SARS-CoV-2 genomes by presence within PCCs including interactions with HCWs. Pairwise comparisons within HCW clusters (n = 846) were tested against pairwise comparisons that were not defined within the PCCs including HCW interactions (n = 28,168). Colours of boxplots reflect the PCCs identified in Figure 1, and asterisks indicate significance level determined through a two-sided Wilcoxon rank-sum test (*<0.05; **<0.01; ***<0.001 after Bonferroni correction for multiple testing).
Figure 3

Temporal patterns in SARS-CoV-2 genomic similarity identify potential viral transmission pathways within patient contact clusters (PCCs) including healthcare worker (HCW) interactions.
For each of the highlighted contact clusters, a median joining network is presented with size of nodes representing number of samples and numbers indicating day of nasal or throat swab collection. The presented network suggests a possible path of viral transmission within each contact cluster, hatches represent single genomic variants that differ between viral clusters. The top scatterplot shows that the number of genomic variants identified against the MN908947.3 reference genome increases over time. The bottom scatterplot shows the number of other samples within the contact cluster that are identical or expected to be derived from samples collected at specific calendar days – these are defined as other samples that are identical but with the presence of additional genomic variants. The observed trends show that samples collected early during the suspected outbreaks have a greater number of derived or identical samples than those collected at a later day. These data support that the samples collected early during the highlighted contact clusters are early founder events during a nosocomial outbreak.
Additional files
Download links
A two-part list of links to download the article, or parts of the article, in various formats.
Downloads (link to download the article as PDF)
Open citations (links to open the citations from this article in various online reference manager services)
Cite this article (links to download the citations from this article in formats compatible with various reference manager tools)
Genomic and healthcare dynamics of nosocomial SARS-CoV-2 transmission
eLife 10:e65453.
https://doi.org/10.7554/eLife.65453


