Learning differentially shapes prefrontal and hippocampal activity during classical conditioning
- Donders Institute for Brain, Cognition and Behaviour, Radboud University, Netherlands
Figures
Figure 1 with 1 supplement
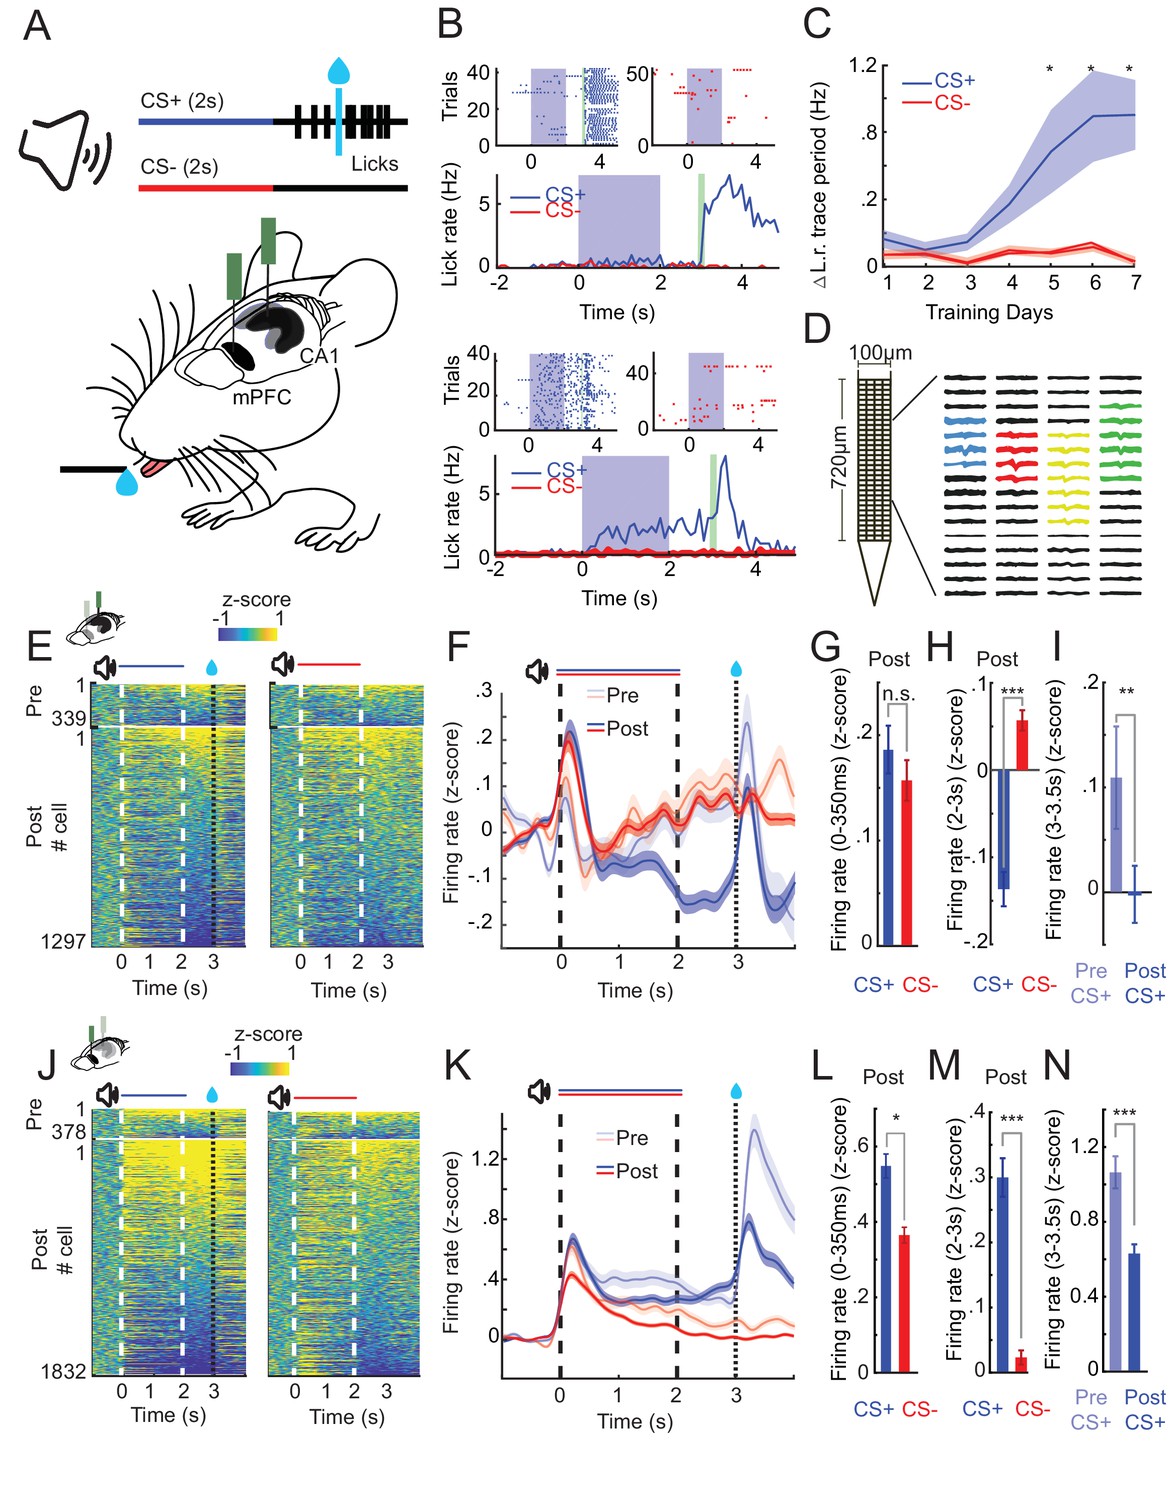
CA1 and prefrontal cortex (PFC) single-cell activity shows distinct learning-dependent changes during appetitive auditory trace conditioning (AATC).
(A) Schematic of AATC task and electrophysiological recordings. (B) Example postlearning training sessions of one mouse during the AATC task (dots in raster plots represent licks, solid lines indicate average responses from respective sessions). (C) Average change in lick rate during the trace period trial during learning for all animals (n = 17) (* indicates sessions with significantly higher group average licks during the trace period after CS+ sounds, Shade area represents standard error of the mean [SEM]). (D) ‘Neuroseeker’ silicon probe layout and combined spatial spike waveform patterns of four simultaneously recorded example neurons from CA1. (E) Z-scored firing rates of all CA1 neurons recorded pre- (top) and post (bottom) learning during CS+ and CS− trials ordered according to average trace period firing rates. (F) Z-scored Peri-Stimulus-Time-Histograms (PSTHs) of all recorded cells in CA1. (G) Z-scored sound evoked change in firing rate (0–350 ms post CS+/CS− onset) in CA1. (H) Z-scored trace period change in firing rate (2–3 s post CS+/CS− onset) in CA1. (I) Z-scored reward period change in firing rate (0–.5 s postreward presentation for CS+ trials pre- and postlearning) in CA1. (J) Z-scored firing rates of all PFC neurons recorded pre- (top) and post (bottom) learning during CS+ and CS− trials ordered according to average trace period firing rates. (K) Z-scored PSTHs of all recorded cells in PFC. (L) Z-scored sound evoked change in firing rate in PFC. (M) Z-scored trace period change in firing rate in PFC. (N) Z-scored reward period change in firing rate in PFC (*, **, and *** represent Wilcoxon rank sum, p < 0.05, p < 0.01, and p < 0.001) (error bars and shaded areas represent SEM).
-
Figure 1—source data 1
The number of recorded neurons per animal and session in CA1, prefrontal cortex (PFC), and simultaneous CA1–PFC recordings.
- https://cdn.elifesciences.org/articles/65456/elife-65456-fig1-data1-v2.docx
Figure 1—figure supplement 1

Positioning of silicon probes in CA1 and prefrontal cortex (PFC).
(A) Histological image of silicon probe implantation track in PFC (left). Arrows show estimated extend of 128 channel ‘Neuroseeker’ silicon probe. Schematic of verified recording position from six animals (right) (adapted from Franklin and Paxinos, 2019). (B) Histological image of silicon probe implantation track in CA1 (left). Arrows show estimated extend of 128 channel ‘Neuroseeker’ silicon probe. Schematic of verified recording position from four animals (right).
Figure 2 with 1 supplement
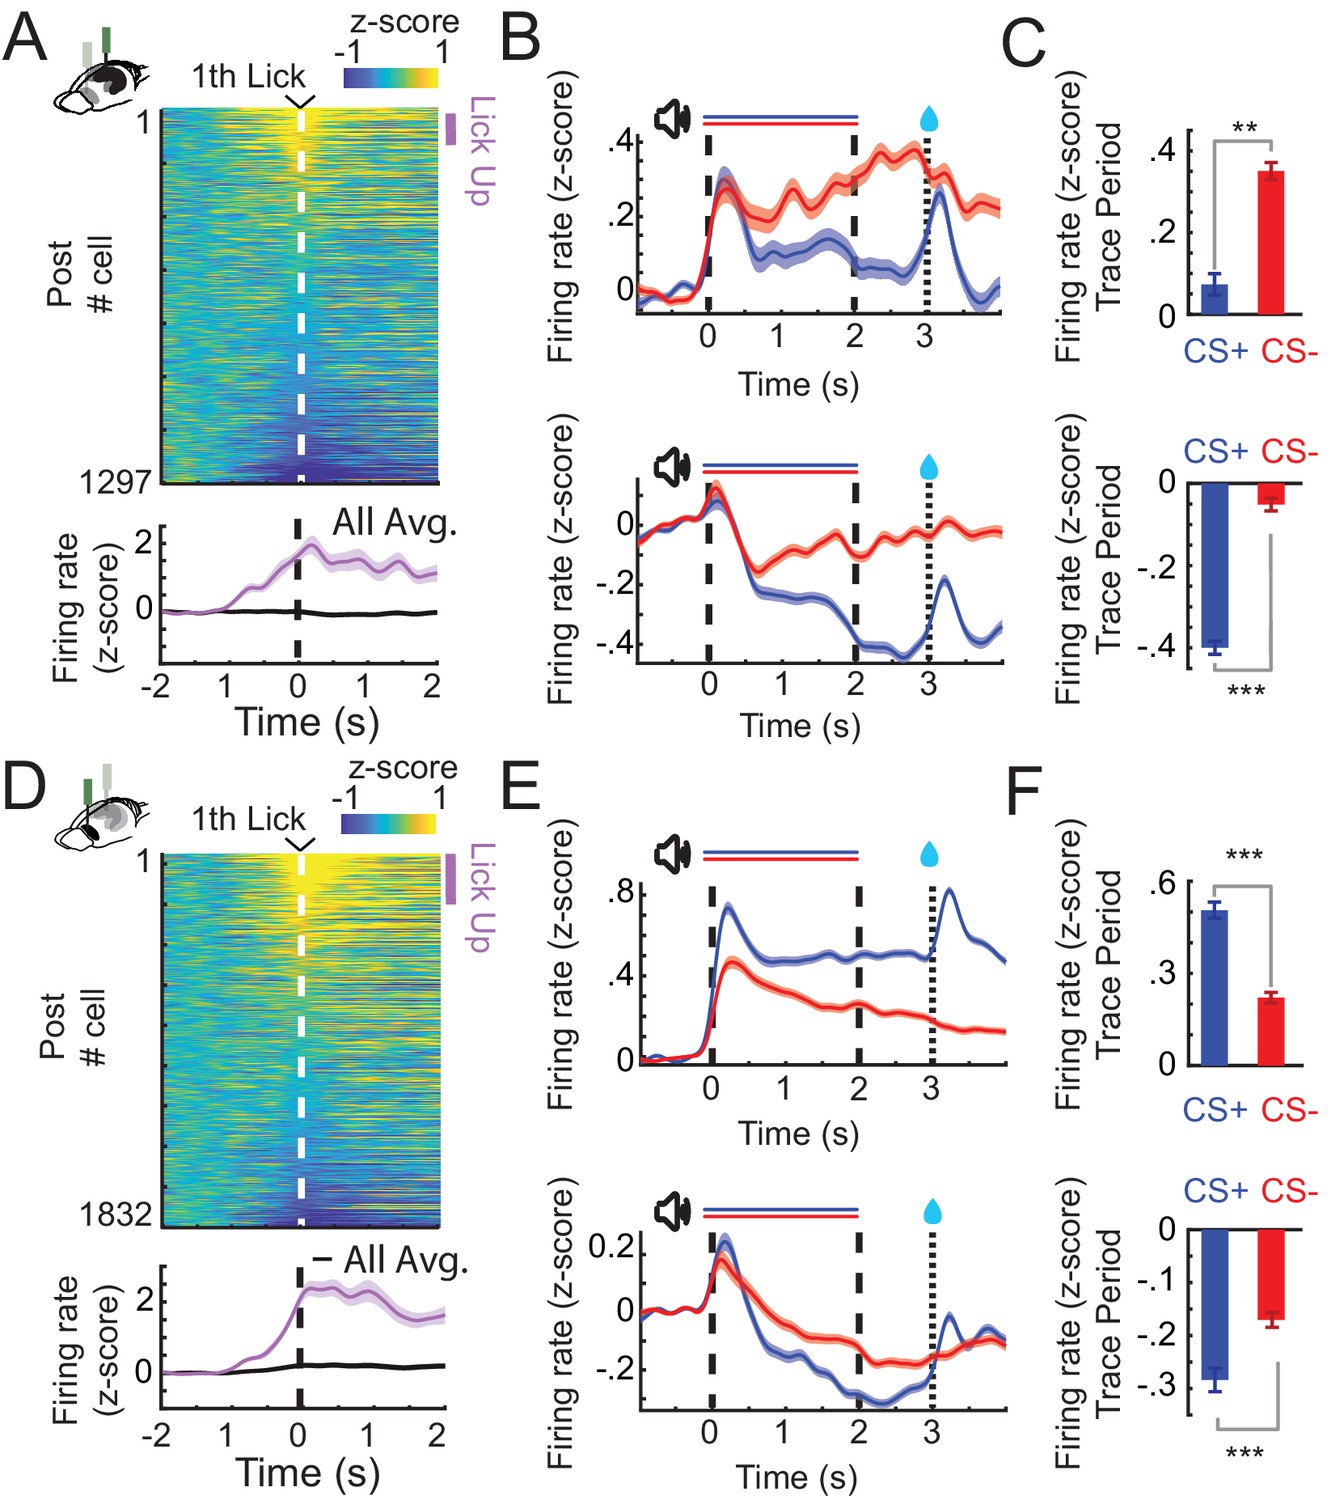
CA1 and prefrontal cortex (PFC) single cells exhibit lick evoked responses and distinct patterns of sustained activity.
(A) Z-scored firing rates of all CA1 neurons (top) aligned to the first lick of a lick bout (at least three licks/s) during CS+ trials (before reward delivery). Z-scored change in activity of all and for positively lick modulated cells (bottom). Purple bar indicates Lick-Up cells. (B) Z-scored Peri-Stimulus-Time-Histograms (PSTHs) of all Trace-Up (top) and Trace-Down (bottom) postlearning for CA1 (in CS+ or CS− trials: Trace-Up, n = 444; Trace-Down, n = 675). (C) Z-scored change in firing rate during the trace period of the same Trace-Up neurons (top) and Trace-Down neurons (bottom) for CA1. (D) Lick cells in PFC (same as in A). (E) Trace-Up (top) and Trace-Down (bottom) nonlick neurons postlearning for PFC (CS+ or CS− trials: Trace-Up, n = 736; Trace-Down, n = 734). (F) Z-scored change in firing rate during the trace period of the same Trace-Up neurons (top) and Trace-Down neurons (bottom) for PFC (**, and *** represent Wilcoxon rank sum, p < 0.01, and p < 0.001; error bars and shaded areas represent standard error of the mean [SEM]).
Figure 2—figure supplement 1
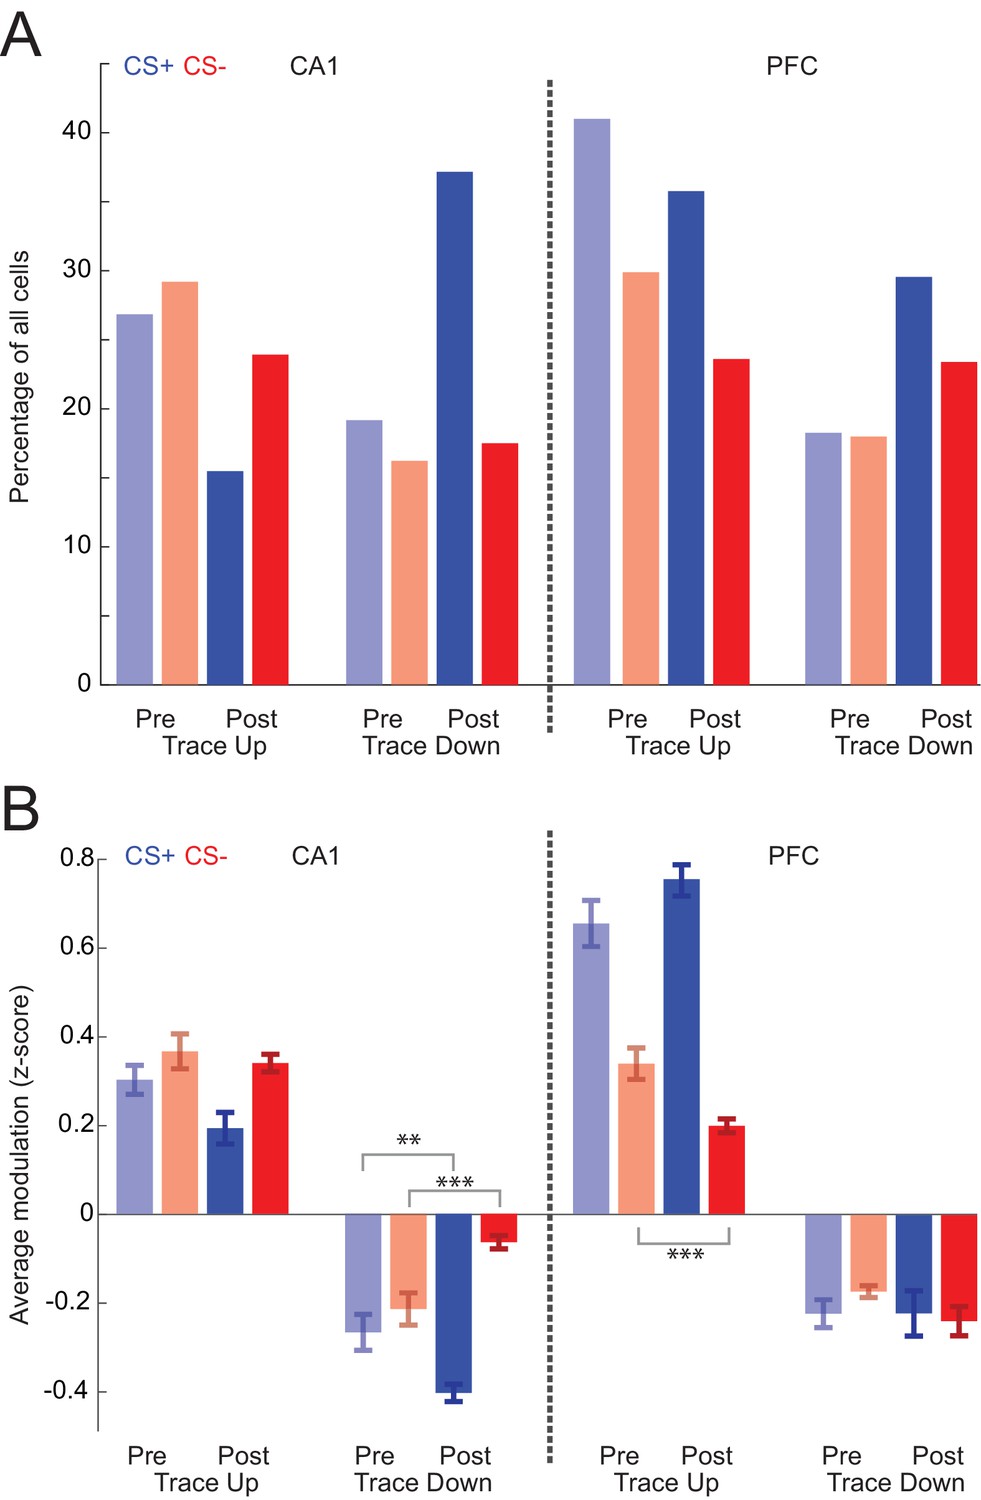
Distribution and activation of Trace-Up and Trace-Down cells in CA1 and prefrontal cortex (PFC) changes over the course of learning.
(A) Percentage of Trace-Up and Trace-Down cells in CA1 and PFC in pre- and postlearning sessions separately for CS+ and CS− trials. (B) Average z-scored modulation of all combined Trace-Up and Trace-Down cells in CA1 and PFC in pre- and postlearning sessions (**,*** represents Wilcoxon rank sum, p<0.01, p<0.001 ; Error bars and shaded areas represent SEM).
Figure 3 with 2 supplements
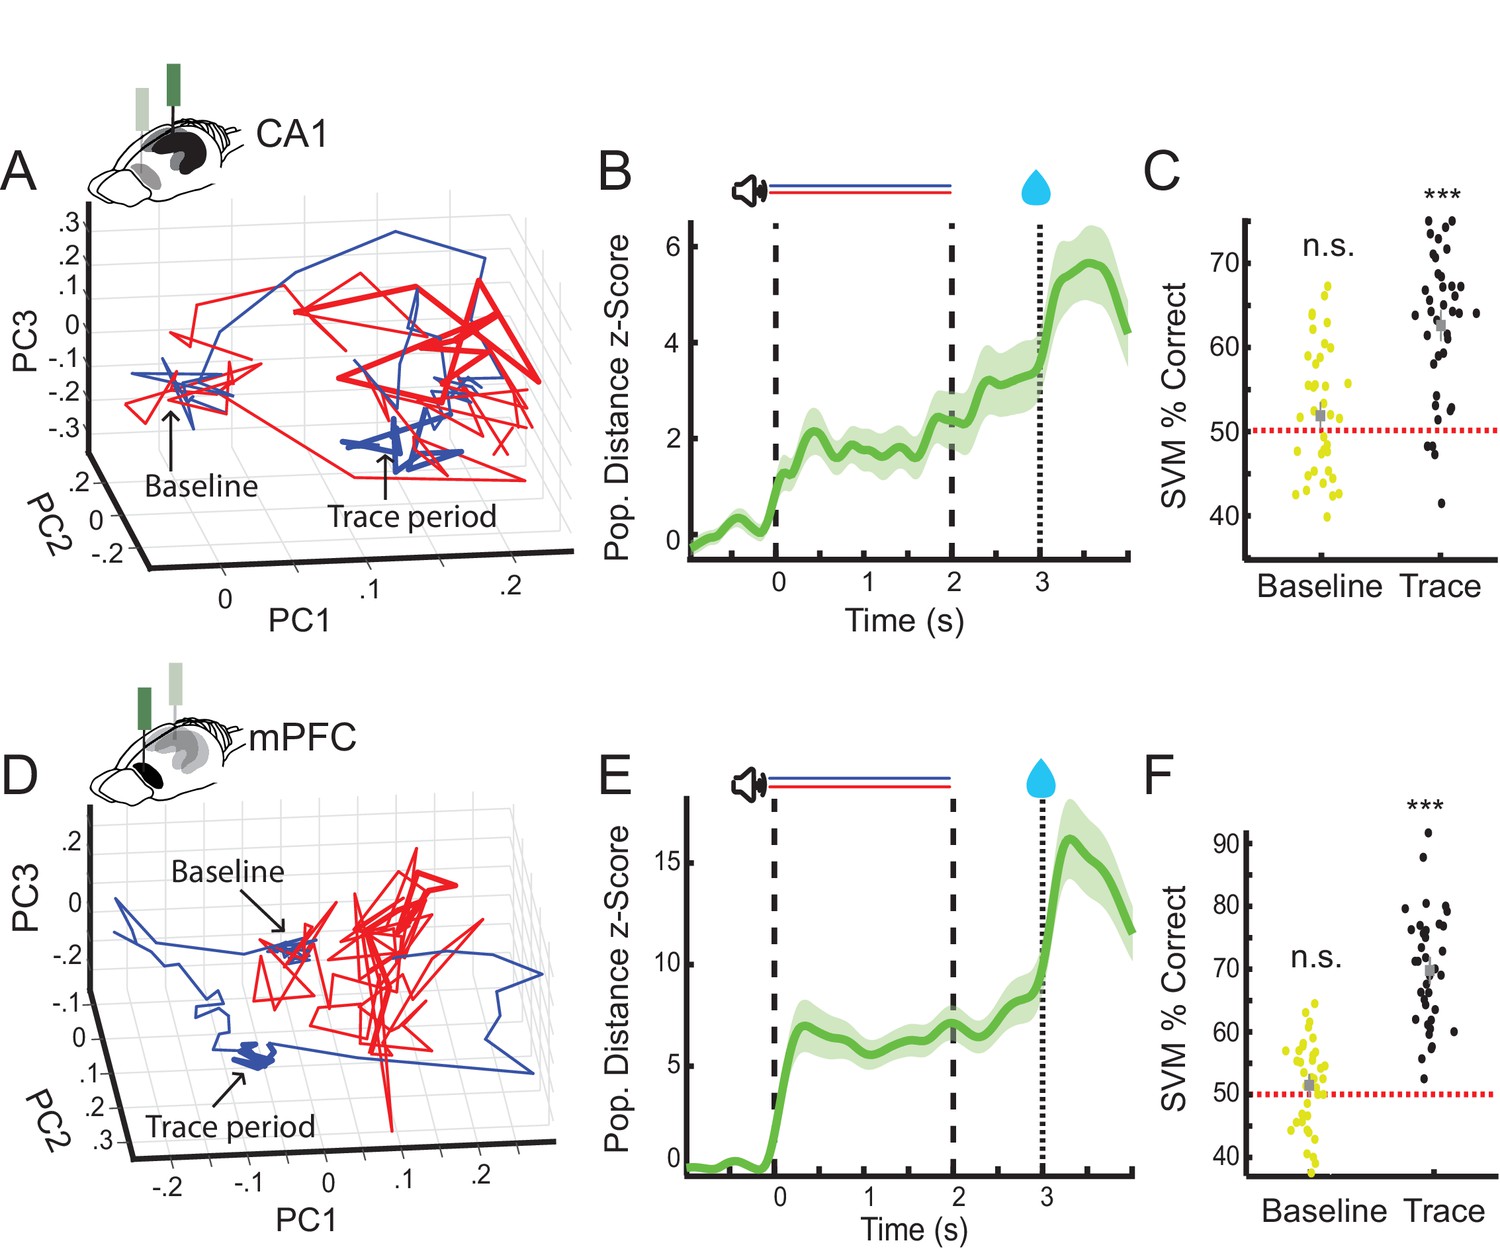
CA1 and prefrontal cortex (PFC) nonlick cell population activity encode trial identity during the trace period.
(A) Example of average nonlick cell population rate vector trajectories for one session in CA1 (CS+ [blue] and CS− [red]). Averages plotted along first three principal components (baseline period: blob on the left, trace period thicker lines on the right). (B) Average z-scored Euclidean distance between CS+ and CS− nonlick cell population rate vector trajectories during appetitive auditory trace conditioning (AATC) task for CA1 (n = 36) (shaded areas represent standard error of the mean [SEM]). (C) Support vector machine classification of trial identity by average baseline (−1 s-0 s) and trace period (2–3 s) activity of nonlick cells in CA1 (n = 36) (*** indicates Wilcoxon sign rank p < 0.001). (D) Example of average nonlick cell population rate vector trajectory for one session in PFC. (E) Average z-scored Euclidean distance between CS+ and CS− nonlick cell population rate vector trajectories for PFC (n = 38) (shaded areas represent SEM). (F) Support vector machine classification of trial identity by average baseline (−1 s-0) and trace period (2–3 s) activity of nonlick cells in PFC (n = 38).
Figure 3—figure supplement 1
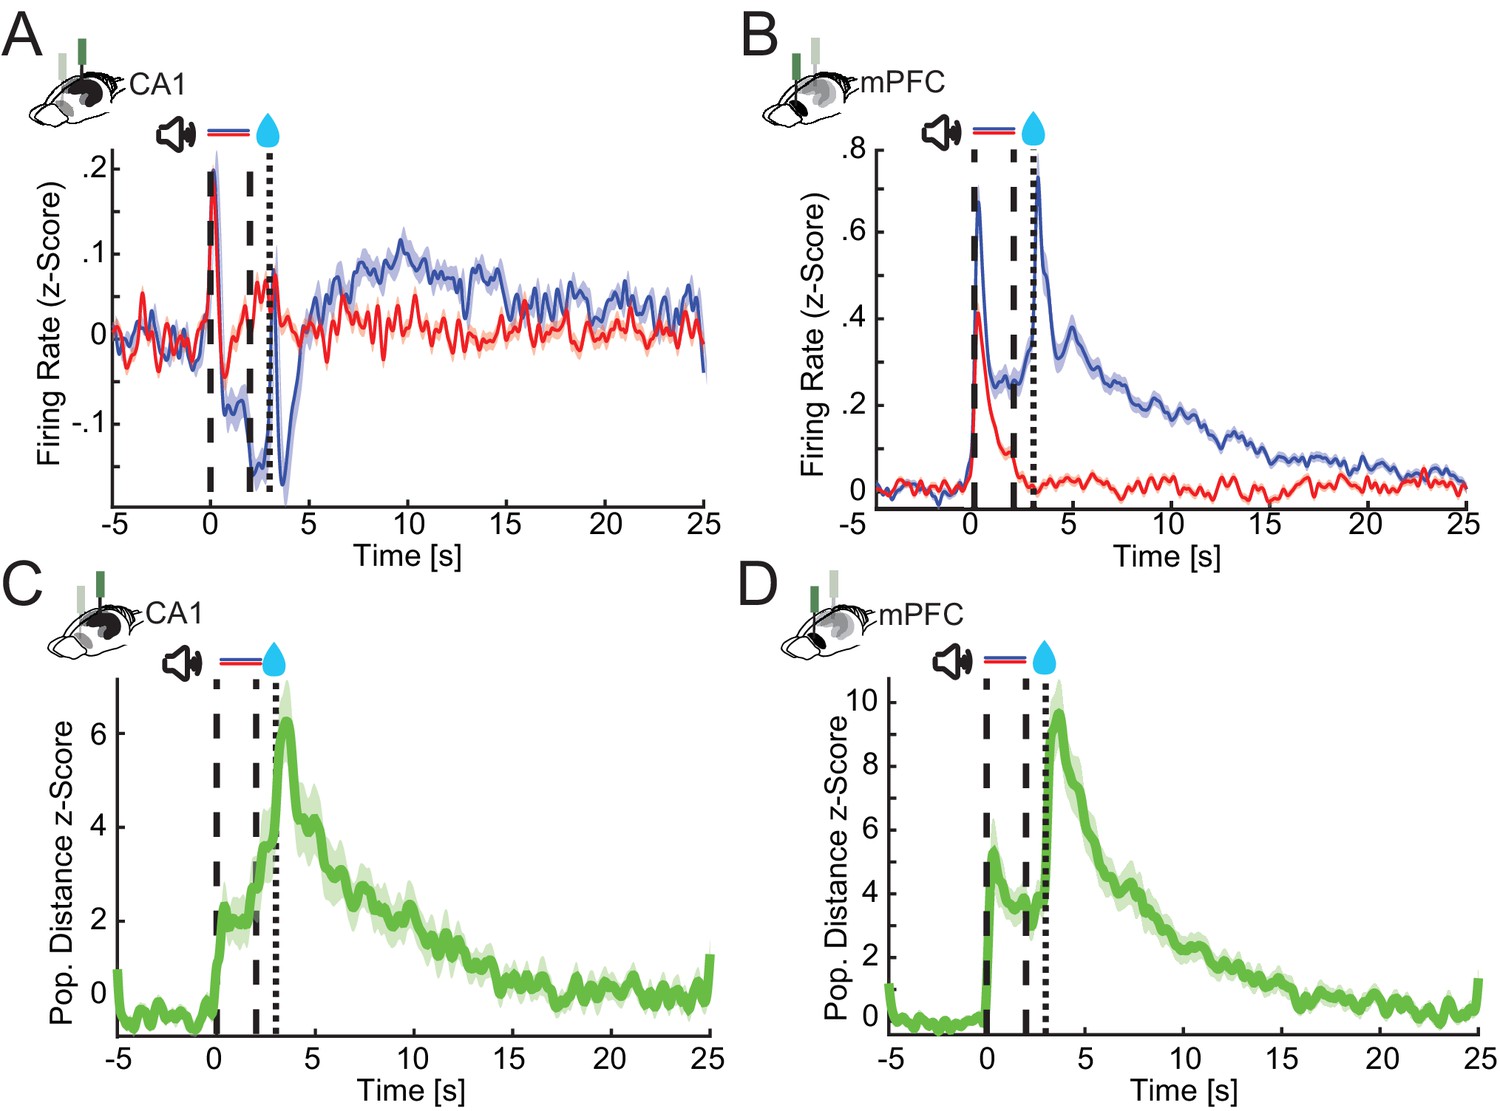
CA1 and prefrontal cortex (PFC) single cells and population responses slowly decay back to baseline after conditioning trials.
Z-scored firing rates of all CA1 (A) and PFC (B) neurons recorded during postlearning sessions for 25 s after trial onset. (C and D) Average z-scored Euclidean distance between CS+ and CS− nonlick cell population rate vector trajectories during appetitive auditory trace conditioning (AATC) task for CA1 (n = 36) and PFC (n = 38) (shaded areas represent standard error of the mean [SEM]).
Figure 3—figure supplement 2
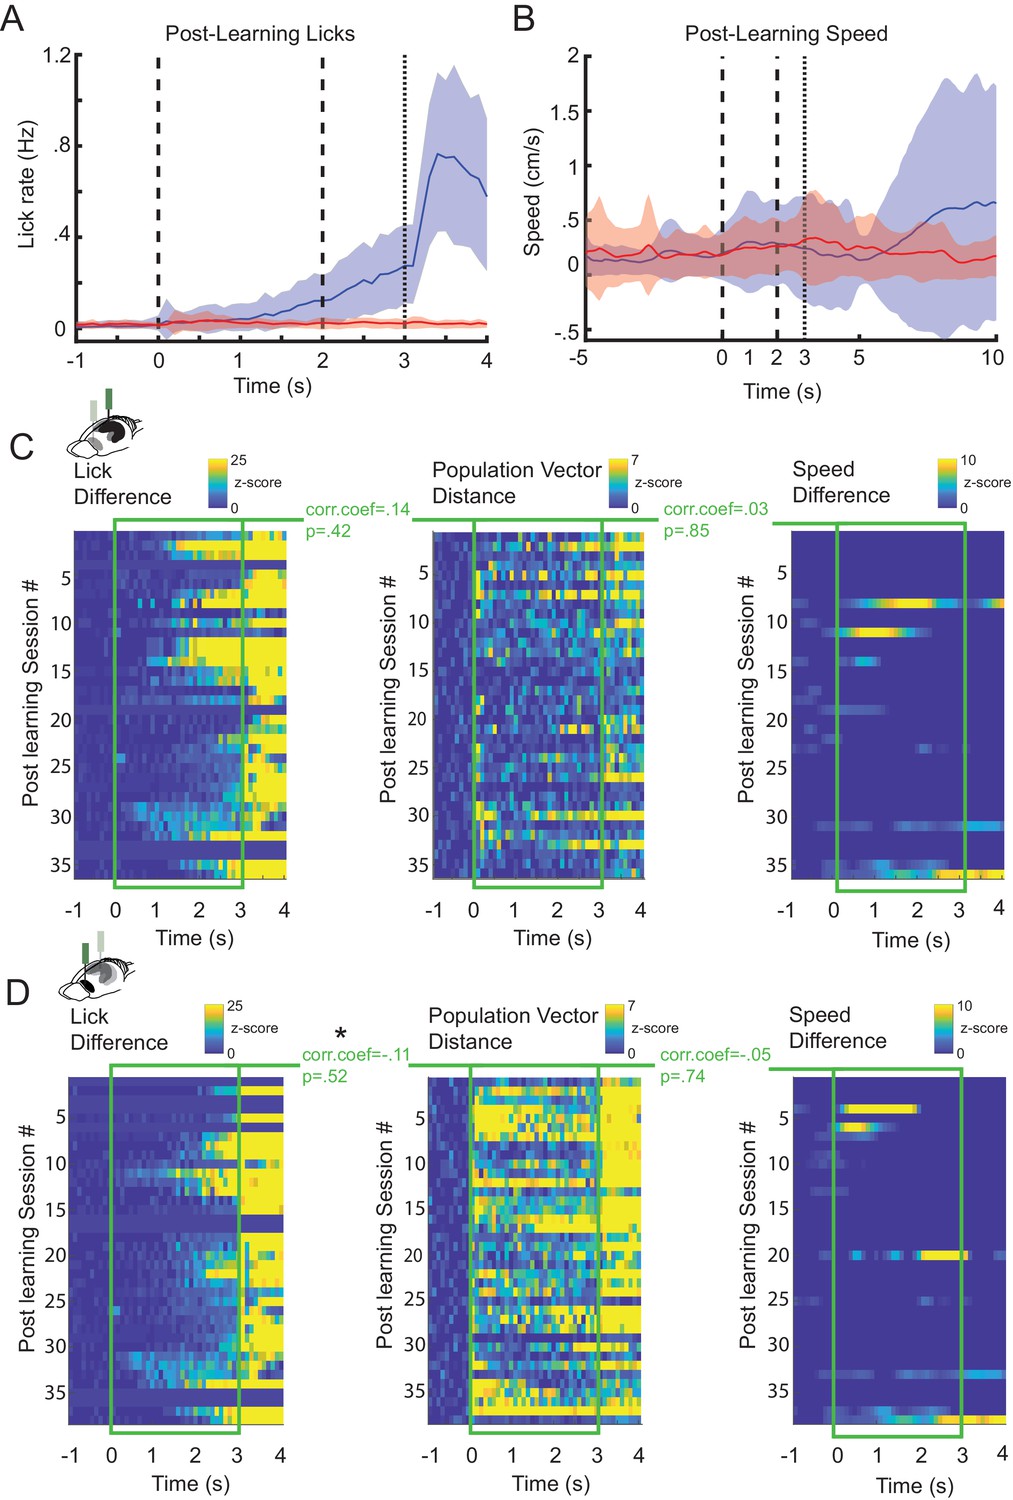
CA1 and prefrontal cortex (PFC) nonlick cell population activity does not correlate with lick or running behavior.
(A) Average lick responses during postlearning trials for CS+ and CS− trials (52 sessions, 17 animals) (shaded areas represent standard error of the mean [SEM]). (B) Average running speed during postlearning CS+ and CS− trials (52 sessions, 17 animals). Correlation between nonlick population rate vector differences (CS+ vs CS− trials) for all postlearning sessions in CA1 (C) and PFC (D) (middle) and differences in lick rate (CS+ vs CS− trials) (left) and differences in running speed (CS+ vs CS− trials) (right) for all postlearning sessions (* represents Pearson correlation, p<0.05).
Figure 4 with 1 supplement
CA1–PFC interaction during trace conditioning.
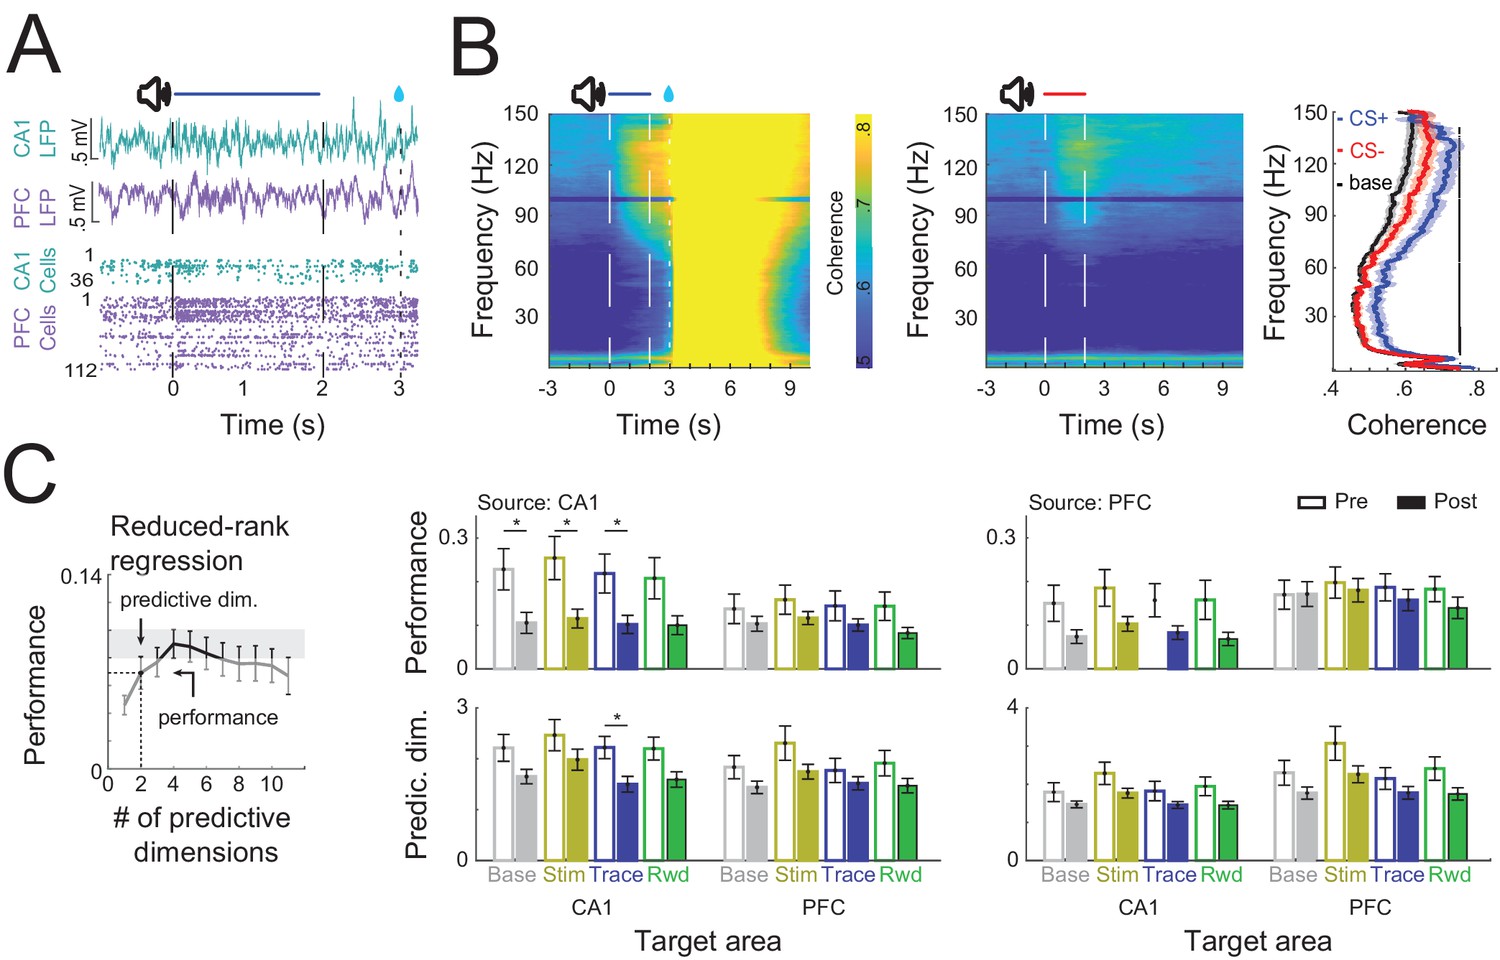
(A) Example of simultaneously recorded local field potential (LFP) and single-cell activity from CA1 and PFC during a CS+ conditioning trial. (B) CA1–PFC LFP coherence during CS+ trials (right) and CS− trials (left). Average coherence during baseline and during the trace period (right). Black bar indicates significant difference between CS+ post and CS− post trials (permutation test at each frequency <0.05). (C) (Left) Schematic representation of how performance and the number of predictive dimensions were calculated for each regression. (Right) Reduced-rank regression between CA1 and PFC spiking activity during conditioning trials in pre- and postlearning sessions (Solid and filled bars represent prelearning and postlearning sessions, respectively, * refers to Wilcoxon ranksum test p<0.05, error bars represent standard error of the mean [SEM]).
Figure 4—figure supplement 1

CA1–prefrontal cortex (PFC) single-cell interaction does not change across different task periods.
(A) Schematic representation of ridge regression. A full-rank model was computed using 10-fold crossvalidation and L1 regularization. The model with the best performance over the regularization parameter λ was selected. (B) Full-model ridge regression between CA1 and PFC spiking activity during conditioning trials in pre- and postlearning sessions. Solid and filled bars represent prelearning and postlearning sessions, respectively, error bars represent standard error of the mean [SEM], and * refers to p < 0.05 in a Wilcoxon rank sum test.
Figure 5 with 3 supplements
CA1 and prefrontal cortex (PFC) cell assemblies show different awake Sharp-Wave Ripple (aSWR) reactivation dynamics.
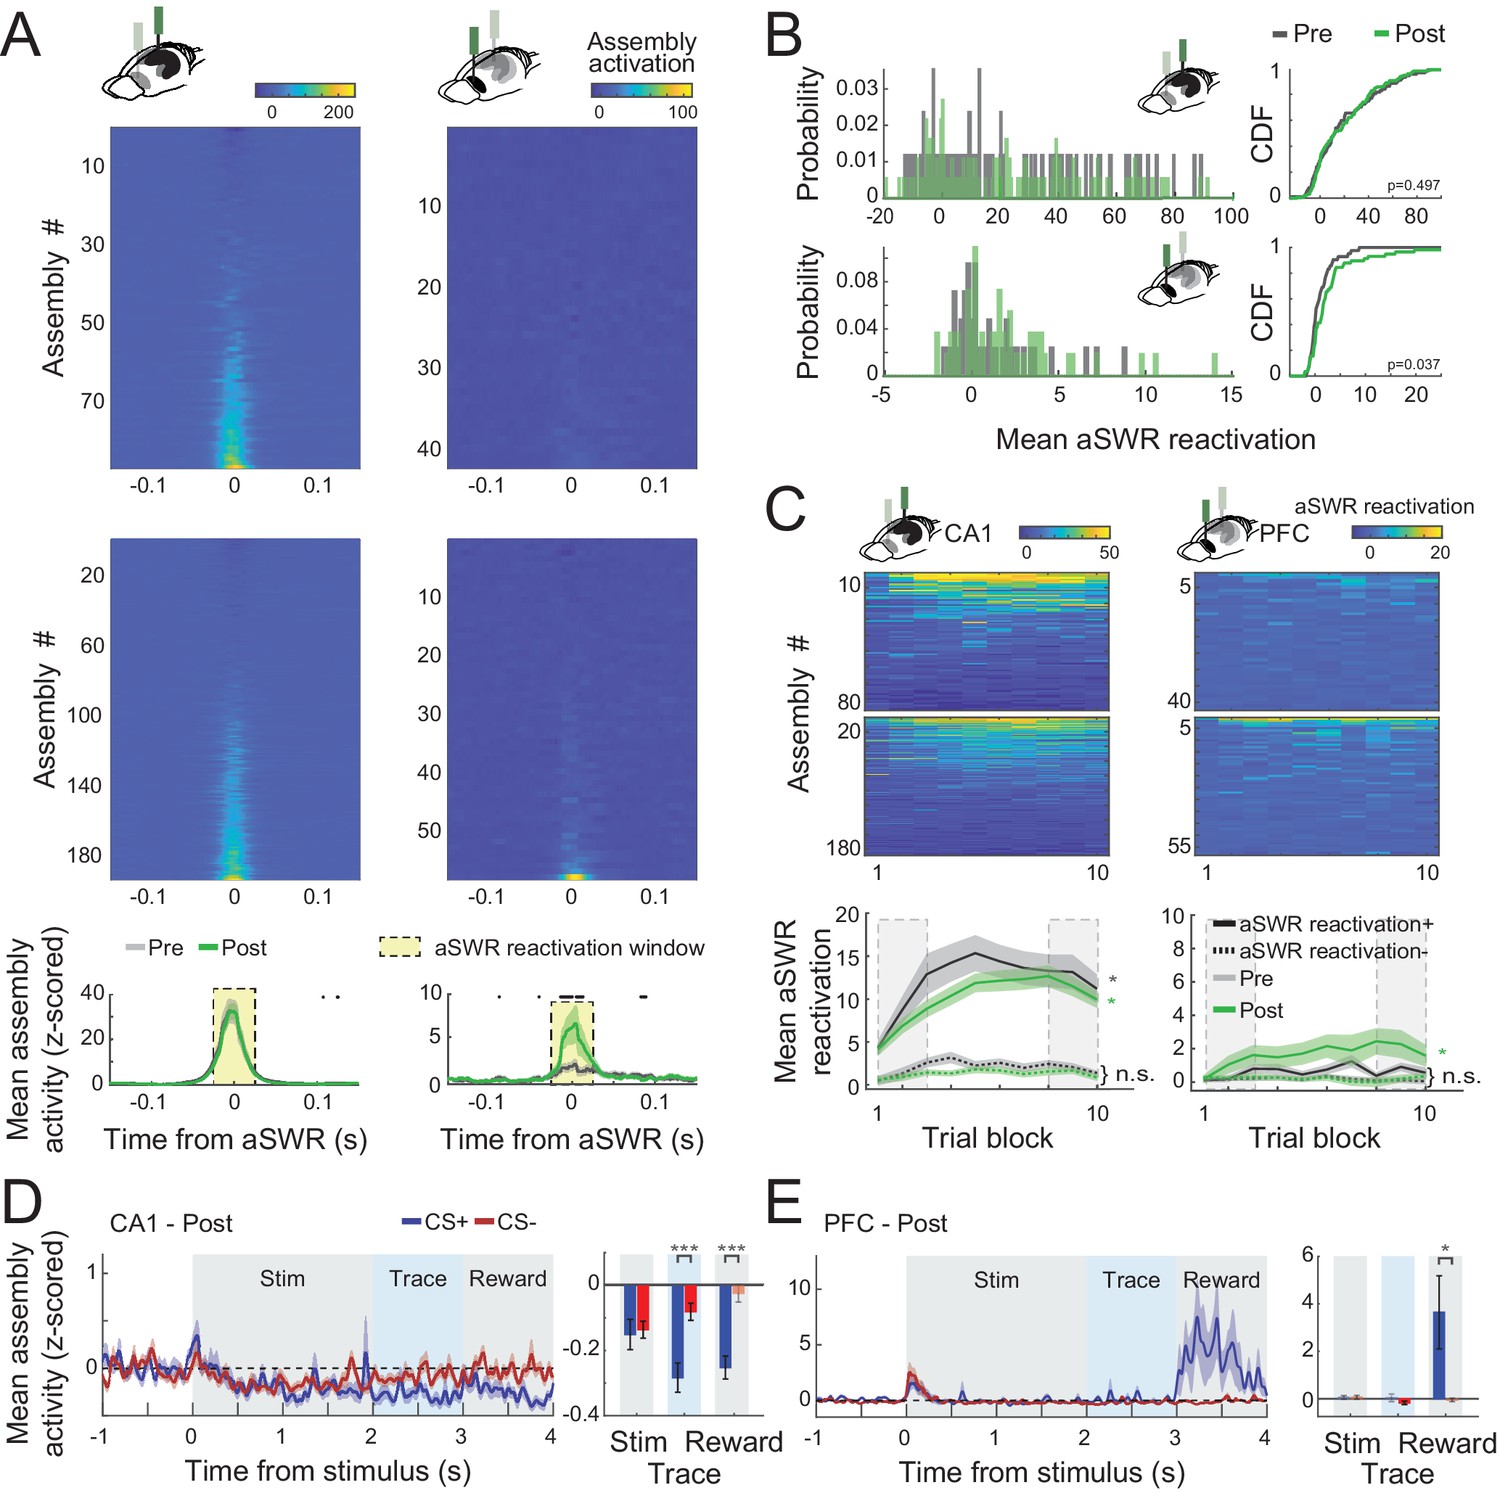
(A) Average (z-scored) assembly activation triggered by aSWR occurring in the intertrial intervals for CA1 and PFC, pre- and postlearning sessions (top). Mean aSWR-triggered activation over all the assemblies for pre- and postsessions for each area. Shaded areas represent the standard error of the mean (SEM). Black dots represent windows in which pre- and postassembly activity were statistically different (Wilcoxon rank sum test; p < 0.05). Notice the higher aSWR-triggered activation of assemblies in PFC in postsessions. (B) Histogram (left) and cumulative distribution function (CDF; right) of the mean assembly activity on the reactivation window denoted in A. p values refer to a two-sample Kolmogorov–Smirnov test between pre- and postdistributions. (C) Average aSWR reactivation of each assembly per session (top). Sessions were divided into 10 blocks of equal trial length. Mean aSWR reactivation of all positively (reactivation+) and negatively (reactivation−) reactivated assemblies. Asterisks refer to Wilcoxon signed-rank test performed between the first and last three trial blocks (dashed rectangles) of each area/learning condition (n.s.: nonsignificant; *p < 0.05 and shaded areas represent SEM). Note the evident increase in CA1 aSWR assembly reactivation across the session in both pre- and postsessions for positively modulated assemblies (reactivation+). (D) Mean (z-scored) assembly activity triggered by the stimulus onset for the 25 % most strongly aSWR-reactivated assemblies in CA1 (left). Average of the traces over each trial period is shown for CS+ and CS− (right). Notice the initial decrease of assembly activity in CA1 during the stimulus and the posterior separation between CS+ and CS−. (E) The same as in D, but for PFC assemblies. Note the difference between CS+ and CS− assembly activity during the reward period. Asterisks refer to a Wilcoxon signed-rank test comparing CS+ and CS− (*p < 0.05; ***p < 0.001). Error bars refer to SEM and darker bars denote mean assembly activity significantly different from 0 (p < 0.05; t-test).
Figure 5—figure supplement 1

Awake Sharp-Wave Ripple (aSWR) reactivation of assemblies detected during intertrial intervals.
(A) (Left) Mean reactivation around aSWRs of assemblies detected during the intertrial intervals (excluding aSWR events) for pre- and postlearning sessions. (Middle) Histogram of mean assembly aSWR reactivation on the reactivation window (yellow rectangle) for pre- and postlearning sessions. (Right) Cumulative distribution of mean assembly aSWR reactivation. p values refer to a two-sample Kolmogorov–Smirnov test between pre- and postdistributions. (B) Similar to A, but using sham aSWR times to compute the average reactivation (aSWR events were randomly shifted by ~200 ms).
Figure 5—figure supplement 2

Distribution of awake Sharp-Wave Ripples (aSWRs) during trace conditioning.
(A) Example of simultaneously recorded local field potential (LFP) and single-cell activity from CA1 and prefrontal cortex (PFC) during aSWRs. (B) Ripple rate during CS+ (blue) and CS− (red) trials across all conditioning sessions. Average lick rate during CS+ trials is overlaid in green (shaded areas indicate standard error of the mean [SEM]). (C) Average aSWR rate increases from early to late within individual sessions (top) and average aSWR rate does not change between pre- and postlearning sessions (bottom) (error bars represent SEM and ** refers to Wilcoxon rank sum test; p < 0.01).
Figure 5—figure supplement 3

Detecting cell assemblies in neural populations.
(A) The rastergram (left) of each trial was computed and binned in 20-ms bins with no overlap (middle). After concatenating the activity of all trials, the activity of each neuron was z-scored and the correlation matrix was computed (right). (B) The eigenvalues of the correlation matrix were then computed and compared to the analytical (Marchenko–Pastur) distribution to estimate the amount of assembly patterns present in the data (top). After that, independent component analysis was used to extract the assembly patterns (bottom). (C) The patterns in B were then used to project the assembly activity during the trial, using 20-ms bins with steps of 1 ms.
Figure 6 with 1 supplement
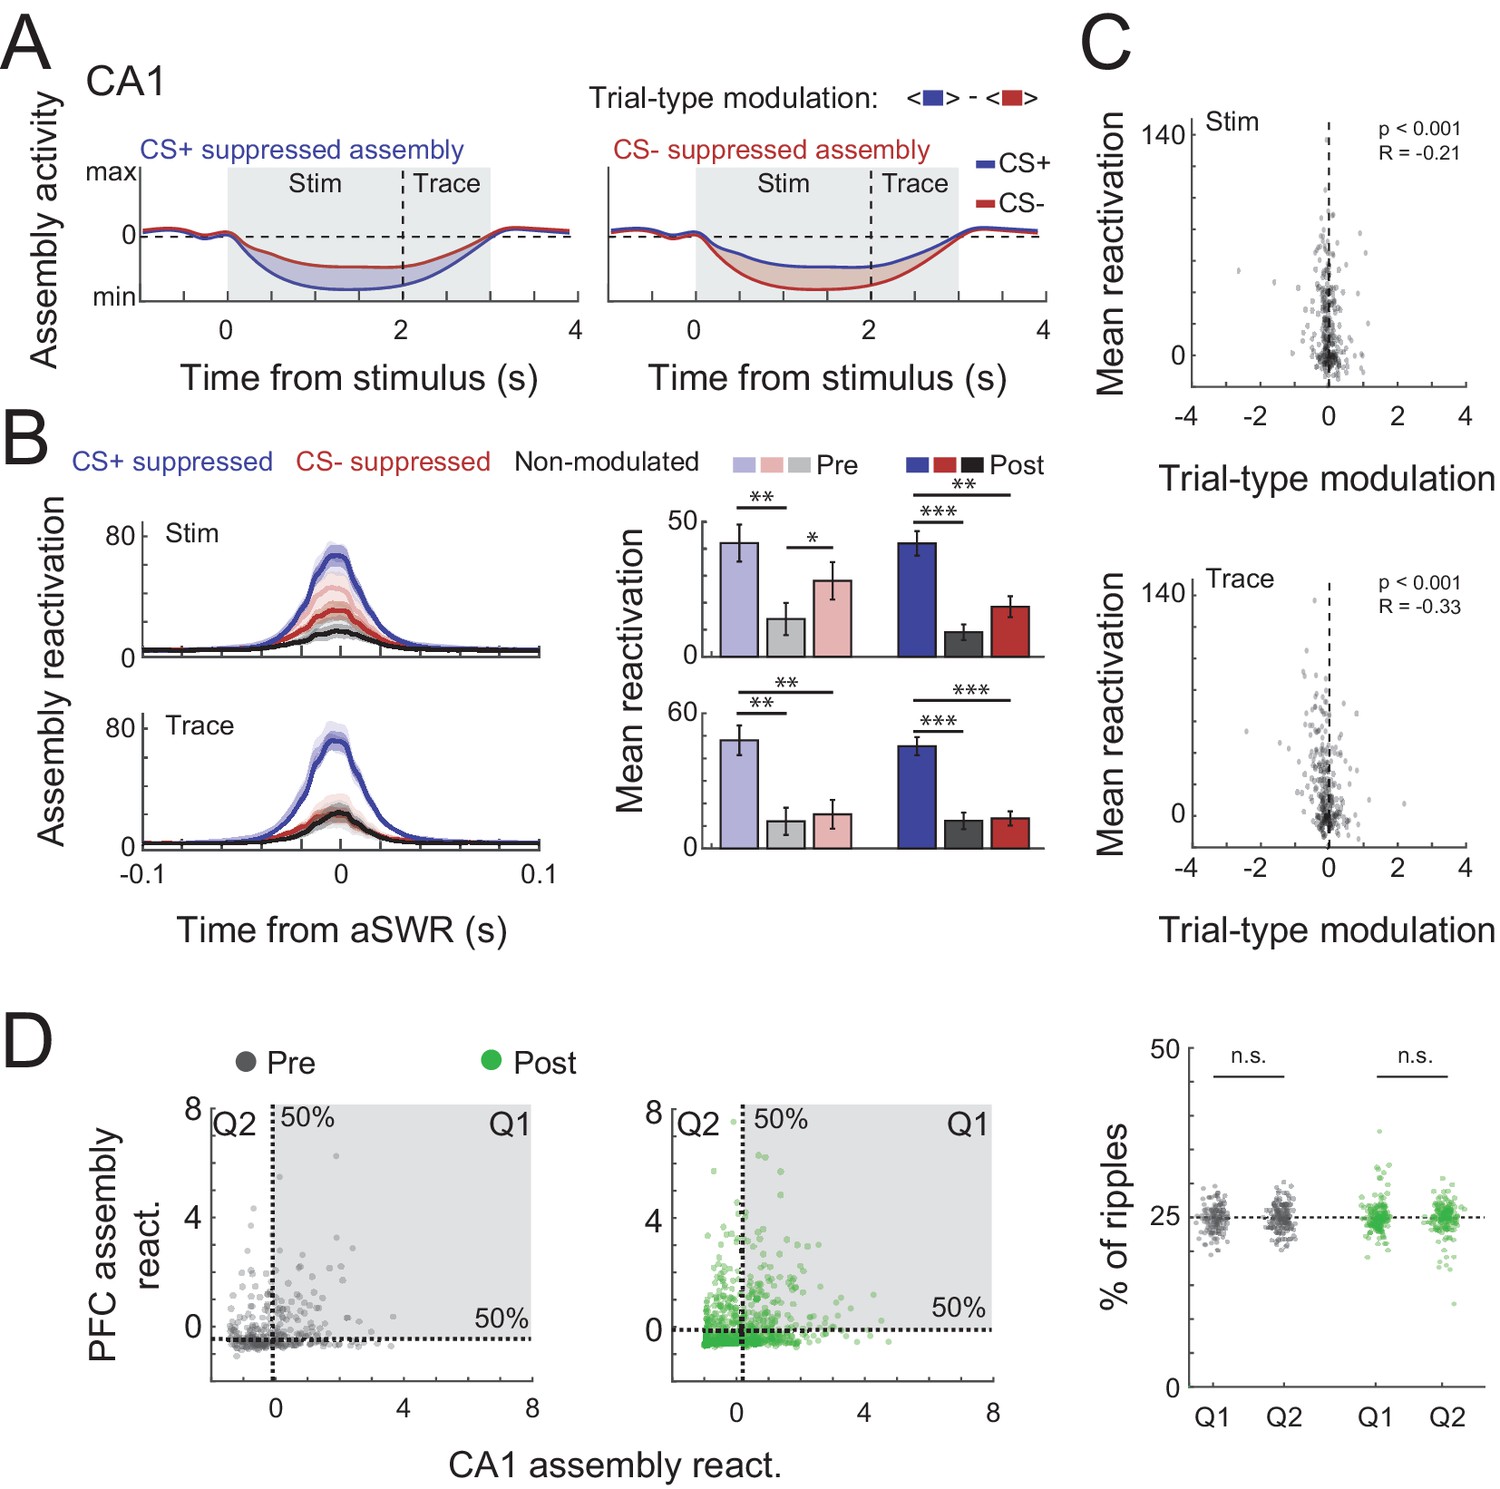
Trial-type modulation and prefrontal cortex (PFC) coactivation of CA1 assemblies.
(A) Schematic representation of trial-type modulation scores, CS+ and CS− suppressed assemblies. The modulation score was defined as the difference between average assembly activation on CS+ and CS− trials during a specific period. (B) Mean awake Sharp-Wave Ripple (aSWR) reactivation of CS+ suppressed, CS− suppressed, and nonmodulated assemblies pre- and postlearning over time (left) and within 50 ms window around ripples (right). Error bars denote standard error of the mean (SEM) (*p < 0.05; **p < 0.01; ***p < 0.001). (C) Scatter plot and Pearson’s correlation values between trial-type modulation score and average aSWR reactivation for all CA1 assemblies (pre- and postlearning). Notice the stronger reactivation of negatively modulated assemblies (CS+ suppressed). (D) (Left) Example of joint reactivation for two pairs of CA1–PFC assemblies. Quadrants were defined using the median aSWRs reactivation of each area and the proportion of reactivations in each quadrant was computed. (Right) Percentage of ripple reactivations in first and second quadrants defined in left for all possible combination of assembly pairs (Wilcoxon signed-rank test).
Figure 6—figure supplement 1
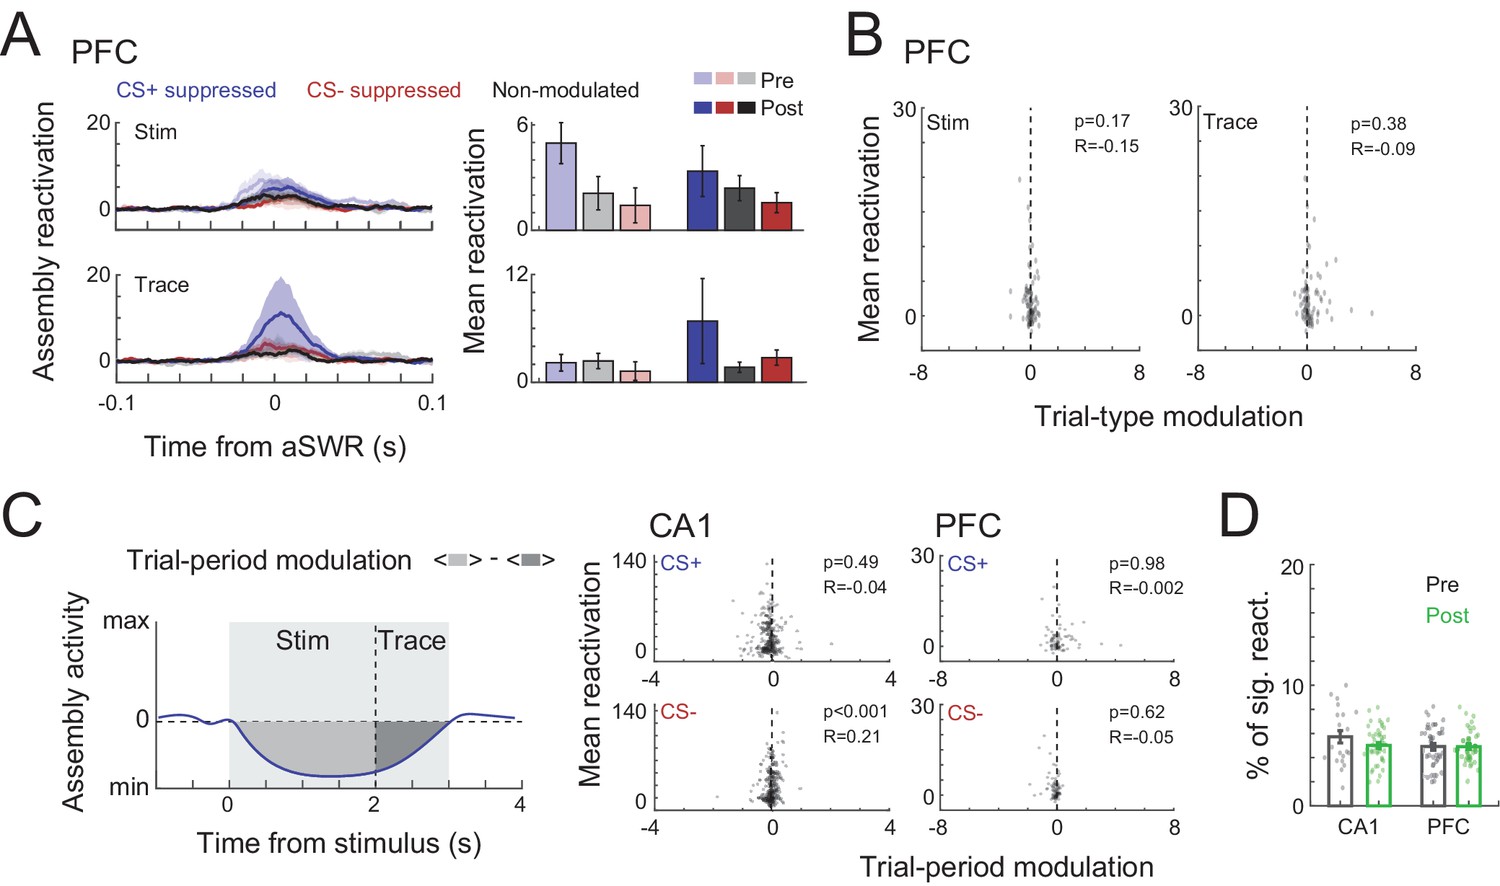
Trial-type modulation of prefrontal cortex (PFC) assemblies and trial-period modulation.
(A) Mean awake Sharp-Wave Ripple (aSWR reactivation of CS+ suppressed, CS− suppressed, and nonmodulated assemblies in PFC over time (left) and within 50 ms window around ripples (right). Error bars denote standard error of the mean (SEM)). (B) Scatter plot and Pearson’s correlation values between trial-type modulation score and average aSWR reactivation for all CA1 assemblies (pre- and postlearning). (C) (Left) Schematic representation of trial-period modulation scores. The trial-period modulation score was defined as the difference between average assembly activation on stimulus and trace periods in CS− trials. (Right) Scatter plot and Pearson’s correlation values between trial-period modulation scores and aSWRs reactivation for assemblies in CA1 and PFC. (D) Percentage of significant assembly reactivations during aSWRs.
Author response image 1
Additional files
Download links
A two-part list of links to download the article, or parts of the article, in various formats.
Downloads (link to download the article as PDF)
Open citations (links to open the citations from this article in various online reference manager services)
Cite this article (links to download the citations from this article in formats compatible with various reference manager tools)
Learning differentially shapes prefrontal and hippocampal activity during classical conditioning
eLife 10:e65456.
https://doi.org/10.7554/eLife.65456


