Cytosolic aggregation of mitochondrial proteins disrupts cellular homeostasis by stimulating the aggregation of other proteins
- ReMedy International Research Agenda Unit, University of Warsaw, Poland
- Centre of New Technologies, University of Warsaw, Poland
- IMol Polish Academy of Sciences, Poland
- International Institute of Molecular and Cell Biology, Poland
- Centre for Misfolding Diseases, Department of Chemistry, University of Cambridge, United Kingdom
- Institute of Bioorganic Chemistry, Polish Academy of Sciences, Poland
Figures
Figure 1 with 1 supplement
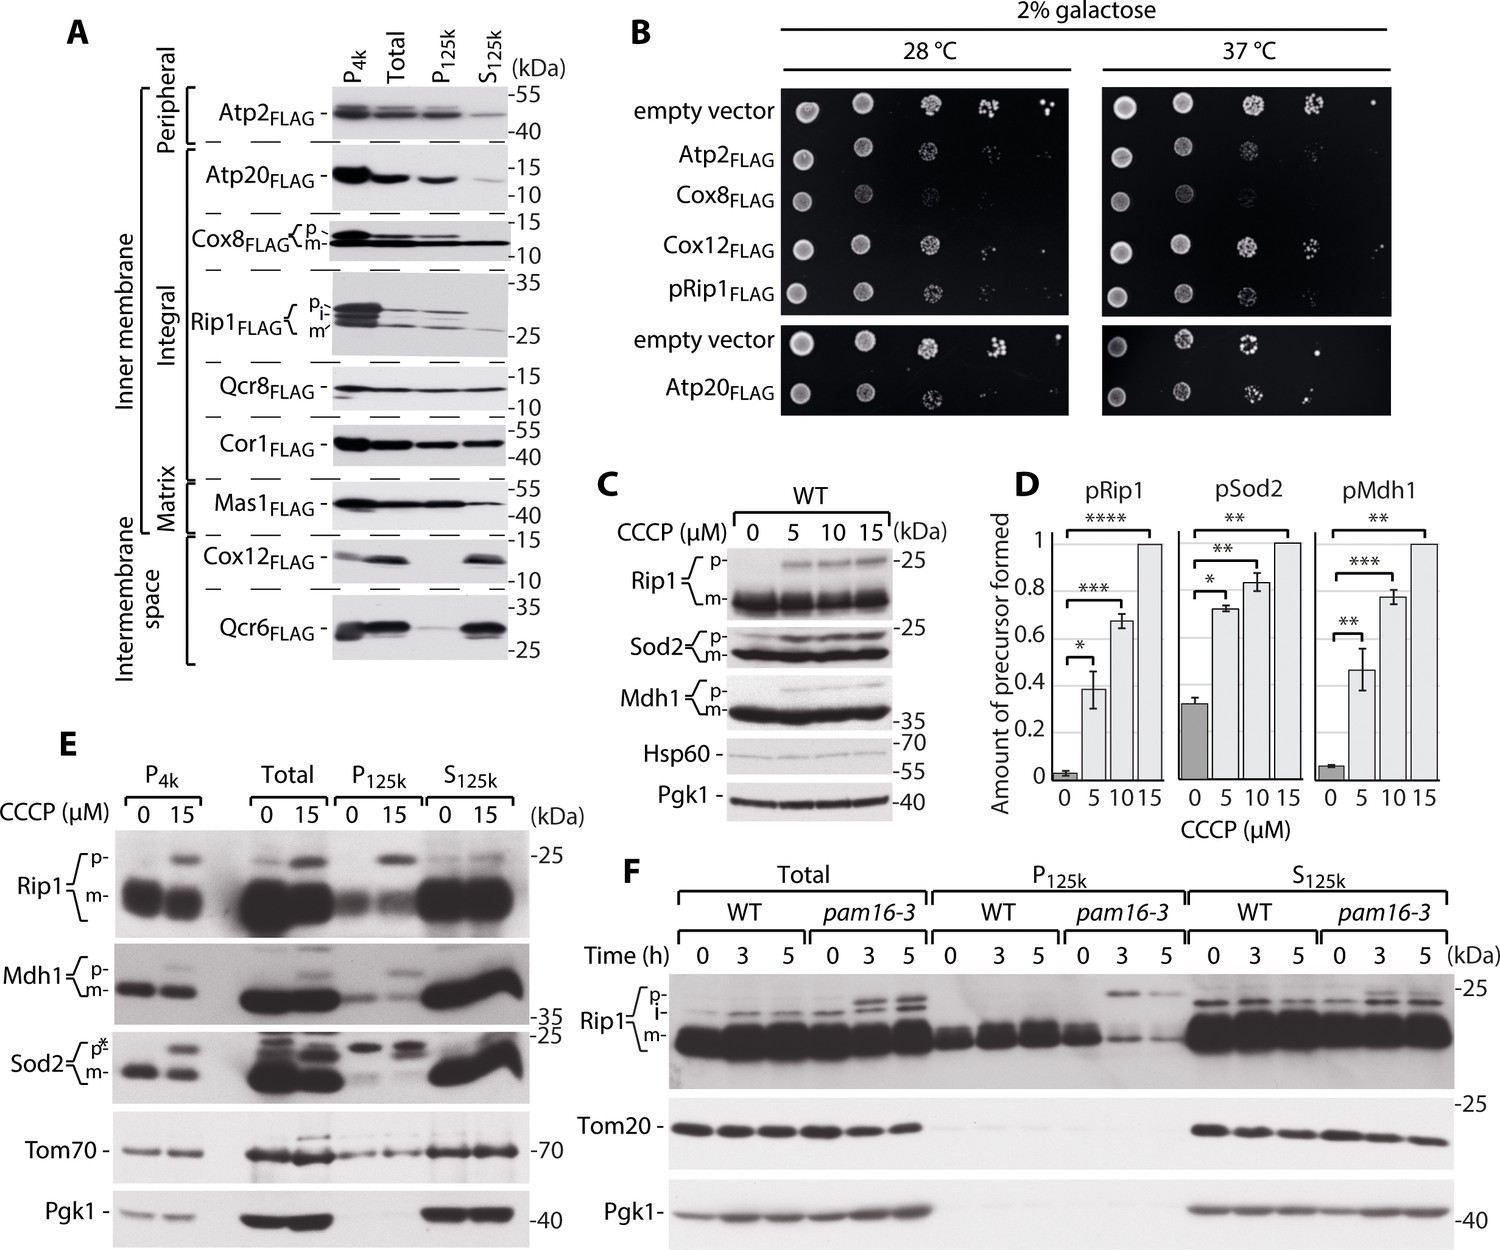
Supersaturated nuclear-encoded mitochondrial proteins aggregate in the cytosol.
(A) SDS-PAGE analysis of aggregation assay fractions of WT yeast cells that overexpressed Atp2FLAG, Atp20FLAG, Cox8FLAG, pRip1FLAG, Qcr8FLAG, Cor1FLAG, Mas1FLAG, Cox12FLAG, and Qcr6FLAG for 3 hr when 2% galactose with 0.1% glucose was used as the carbon source. Pellet fractions after 4000 and 125,000× g centrifugation are indicated as P4k and P125k, respectively. The soluble fraction at 125,000× g is indicated as S125k. n = 3. (B) Ten-fold dilutions of WT cells that expressed metastable proteins or controls that were spotted on selective medium agar plates with galactose as the main carbon source at 28 and 37°C. (C) Total protein cell extract from WT yeast grown at 24°C and treated with 0, 5, 10, or 15 µM carbonyl cyanide m-chlorophenyl hydrazine (CCCP) for 30 min. (D) Quantification of pRip1, pSod2, and pMdh1 from (C). Quantified data are shown as mean ± SEM. n = 3. (E) SDS-PAGE analysis of aggregation assay fractions of yeast cells that were treated with 15 µM CCCP for 30 min, with 2% sucrose as the carbon source. (F) SDS-PAGE analysis of aggregation assay fractions of WT (pam16WT) and pam16-3 mutant yeast strains grown at 19°C and shifted to 37°C for 0, 3, or 5 hr, with 2% sucrose as the carbon source. In (A), (C), (E), and (F), the samples were separated by SDS-PAGE and identified by western blot with specific antisera. n = 3 for each experiment. *Nonspecific; p: presequence protein; i: intermediate protein; m: mature protein. *p<0.05, **p≤0.01, ***p≤0.001, ****p≤0.0001.
-
Figure 1—source data 1
Aggregation propensity characterization of mitochondrial proteins.
Protein sequences and information about mitochondrial targeting presequences were acquired from the Saccharomyces Genome Database and verified using Mitofates (Fukasawa et al., 2015) and MitoProt (Claros and Vincens, 1996) software. Protein solubility was analyzed using CamSol (Sormanni et al., 2015) software. Proteins and sequence residues with scores < –1 were poorly soluble and indicated as potential self-assembly hotspots (red). Scores > 1 characterize highly soluble proteins and sequence residues (blue). TMDs: transmembrane domains; IMS: intermembrane space; IM: inner membrane.
- https://cdn.elifesciences.org/articles/65484/elife-65484-fig1-data1-v2.docx
Figure 1—figure supplement 1
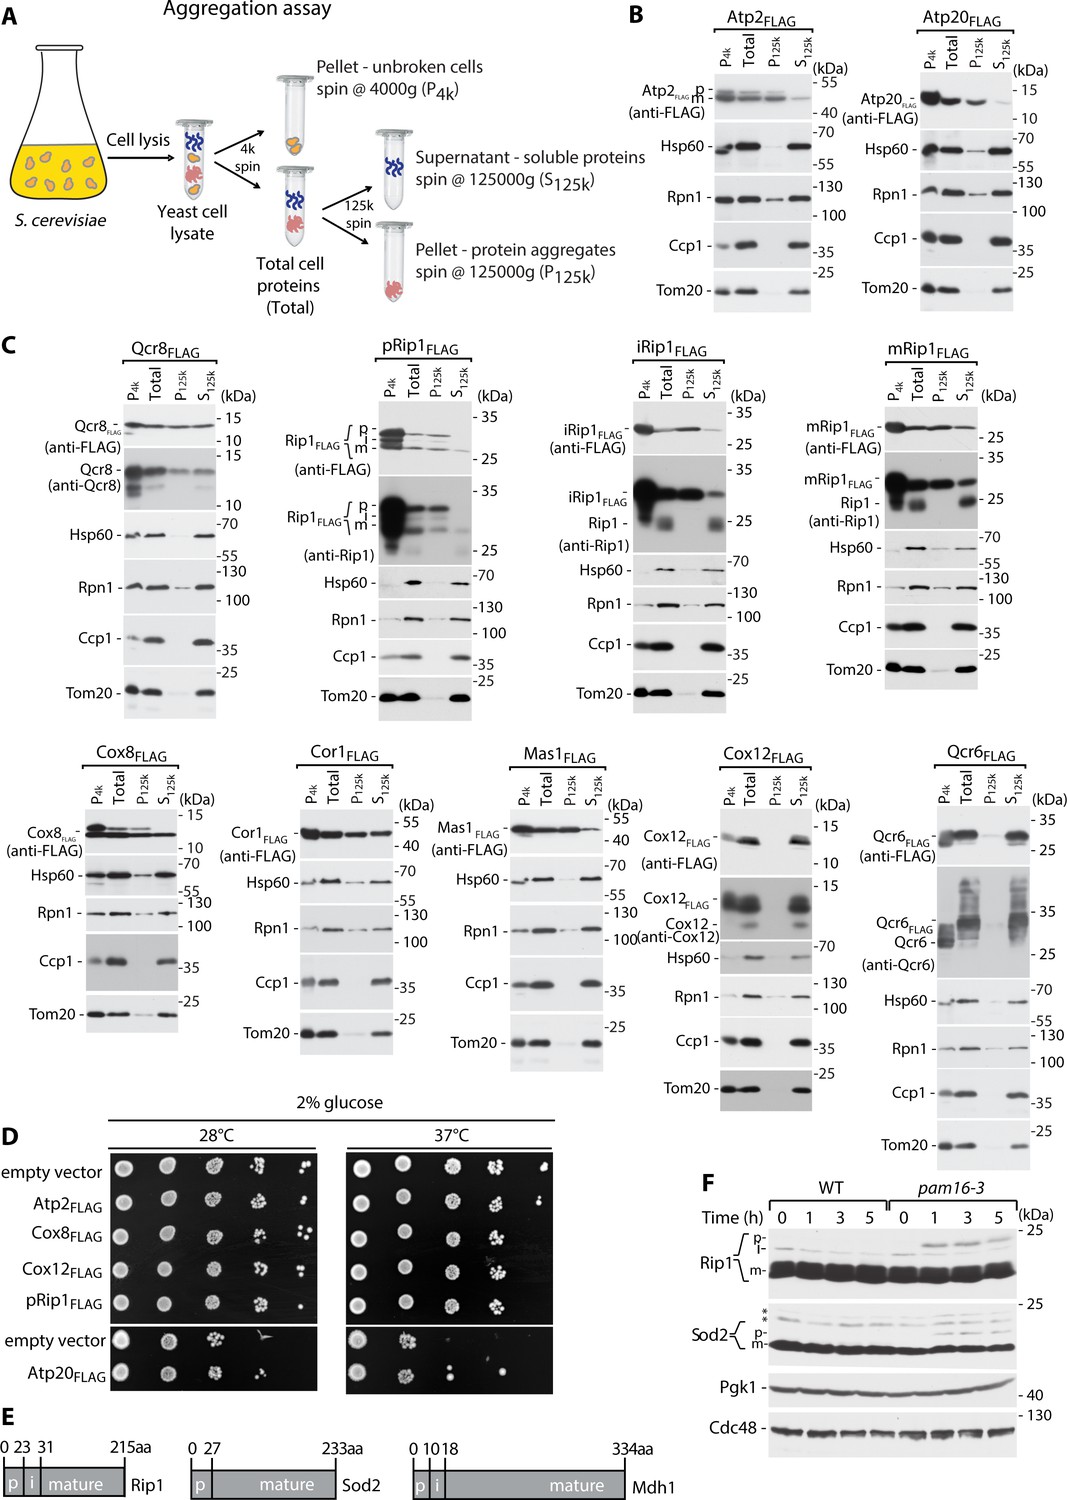
Supersaturated nuclear-encoded mitochondrial protein aggregate in the cytosol and stimulate growth defects.
(A) Schematic representation of the aggregation assay. (B, C) Metastable proteins aggregate in the cell, showing SDS-PAGE analysis of aggregation assay fractions of WT yeast cells that overexpressed Atp2FLAG and Atp20FLAG (B) and Cox8FLAG, Qcr8FLAG, pRip1FLAG, iRip1FLAG, mRip1FLAG, Cor1FLAG, Mas1FLAG, Cox12FLAG, and Qcr6FLAG (C) for 3 hr at 28°C, with 2% galactose with 0.1% glucose as the carbon source. (D) Metastable proteins exhibit a temperature-sensitive phenotype. Each protein-expressing strain was subjected to consecutive 10-fold dilutions and spotted on selective medium agar plates with glucose as the main carbon source at 28 and 37°C. (E) Cartoon representation of Rip1, Sod2, and Mdh1 mitochondrial proteins containing their presequences. (F) Total protein cell extract from WT (pam16WT) and pam16-3 mutant yeast strains that were grown at a permissive temperature of 19°C and shifted to a restrictive temperature of 37°C for 0, 1, 3, or 5 hr. In (B), (C), and (F), protein samples were separated by SDS-PAGE and identified by western blot with specific antisera. Each experiment was repeated three times. p: presequence protein; m: mature protein; i: intermediate; *: nonspecific; aa: amino acid.
Figure 2 with 2 supplements
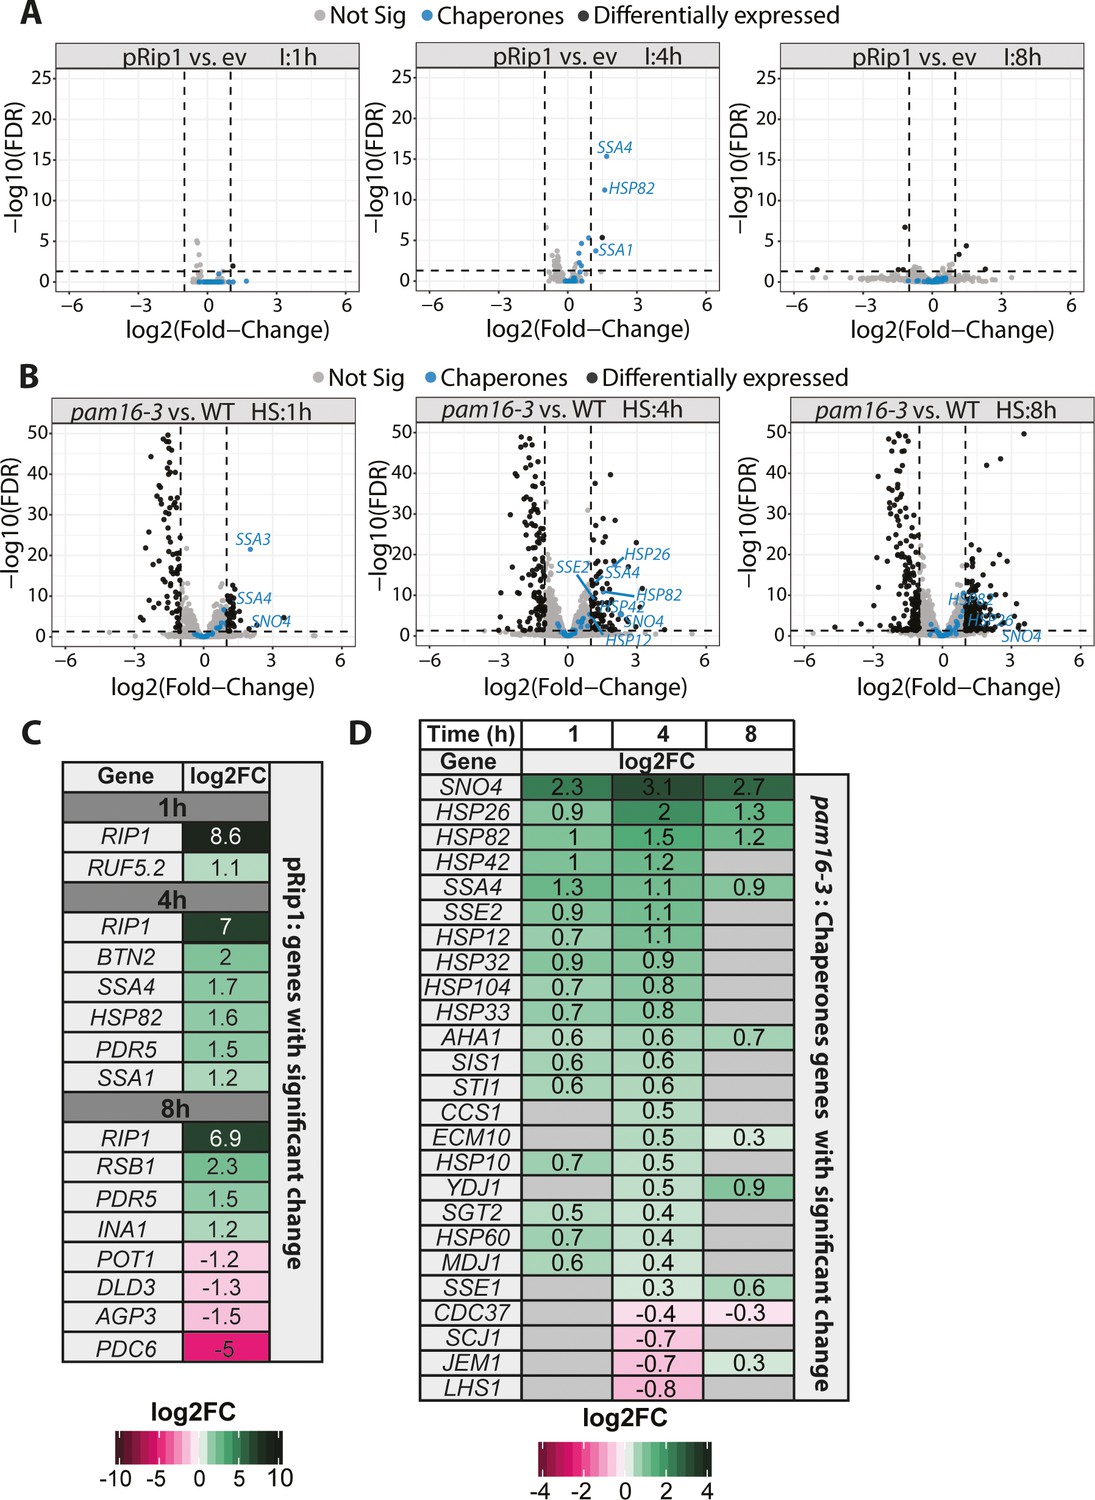
Mitochondrial protein import defects stimulate specific transcriptomic responses.
(A, B) Volcano plot comparison of changes in expression (in terms of the logarithm of the fold change) assessed by the RNA-seq analysis of (A) WT yeast cells that overexpressed pRip1 compared with the empty vector (ev) control (induction [I] was performed under control of the CUP1 promoter for 1, 4, or 8 hr for both ev and pRip1) and (B) the pam16-3 strain compared with WT (pam16WT) (both cell types were grown at a permissive temperature of 19°C and shifted to a restrictive temperature of 37°C for 1, 4, or 8 hr). HS: heat shock time (in hours). Differentially expressed genes that encode molecular chaperones are indicated in blue. The gene name is displayed for each molecular chaperone if it was detected as differentially expressed (i.e., 5% false discovery rate [FDR], log2 fold change [log2FC] ± 1). (C) All differentially expressed genes in pRip1 samples after 1, 4, and 8 hr of overexpression. (D) Analysis of changes in the expression of genes that encode molecular chaperones using pam16-3 samples that were treated as in (B). Up- and downregulated genes (5% FDR) are shown in green and pink, respectively. The intensity of the color shades reflects the level of expression change (log2FC). Genes that were not detected or those without statistically significant expression changes are depicted in gray.
-
Figure 2—source data 1
Full list of gene changes in response to pRip1 overexpression.
- https://cdn.elifesciences.org/articles/65484/elife-65484-fig2-data1-v2.xlsx
-
Figure 2—source data 2
Full list of gene changes in response to pam16-3 overexpression.
- https://cdn.elifesciences.org/articles/65484/elife-65484-fig2-data2-v2.xlsx
-
Figure 2—source data 3
Gene expression matrices in response to pRip1 overexpression.
- https://cdn.elifesciences.org/articles/65484/elife-65484-fig2-data3-v2.xlsx
-
Figure 2—source data 4
Gene expression matrices in response to pam16-3 mutation.
- https://cdn.elifesciences.org/articles/65484/elife-65484-fig2-data4-v2.xlsx
Figure 2—figure supplement 1
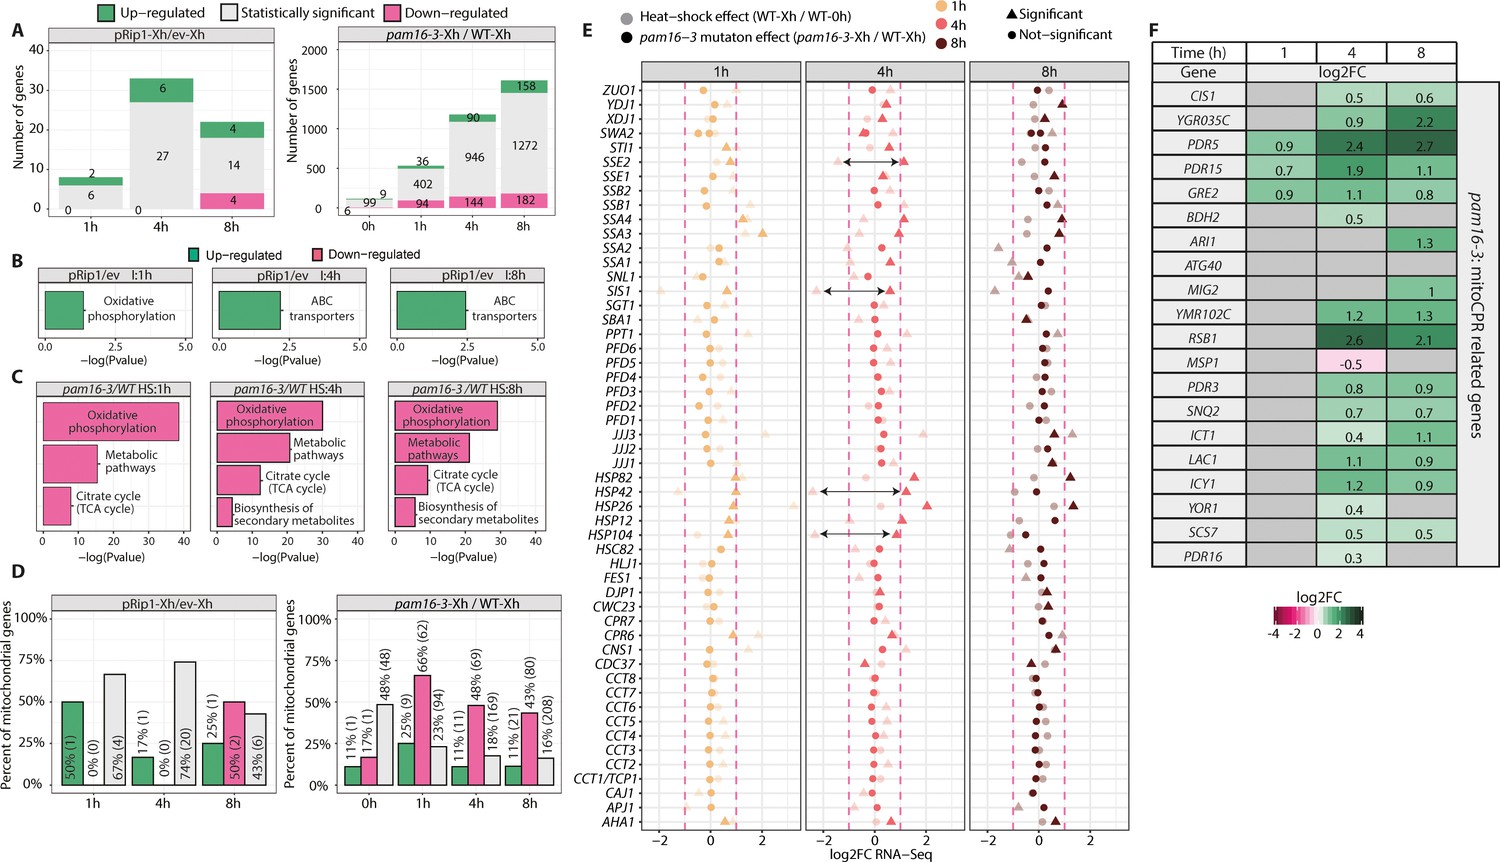
Characterization of gene change that was attributable to mitochondrial protein import defects.
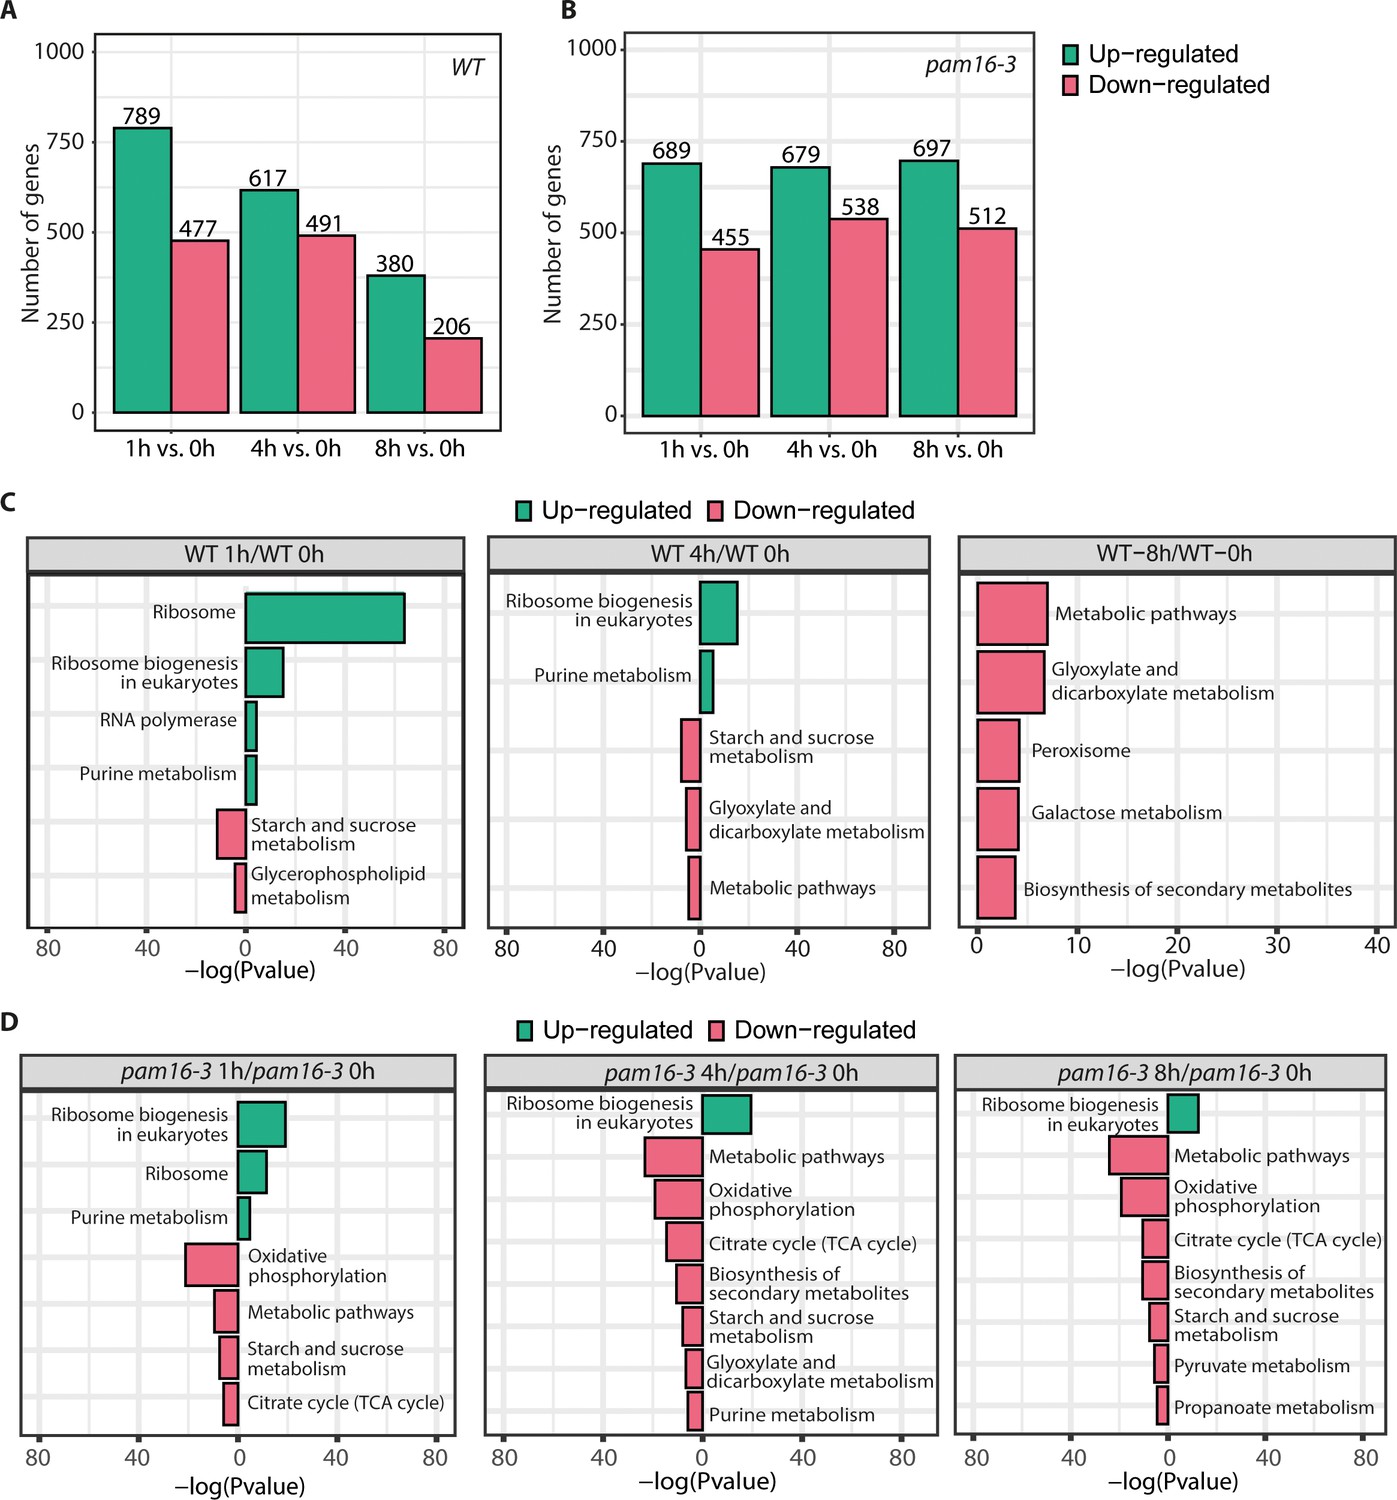
(A) Bar plots of the total number of detected gene transcripts in pam16-3 compared with WT at the indicated time of heat shock and pRip1 compared with the empty vector (ev) at the indicated expression time by RNA-seq. The proportions of significant genes (5% false discovery rate [FDR]) are shown in gray shades (statistically significant), and the proportions of differentially expressed features in the pam16-3 and pRip1 samples (5% FDR; log2FC ± 1) are shown in green (upregulated) and pink (downregulated). The number of genes in each group is indicated. (B, C) Kyoto Encyclopedia of Genes and Genomes (KEGG) enrichment analysis of differentially expressed genes for pRip1 vs. ev (B) and pam 16-3 vs. WT (C) samples, respectively. The results are shown as a negative log10 p value after Bonferroni correction. Bars in green indicate KEGG terms that were enriched for upregulated genes. Pink bars represent KEGG terms for downregulated features. No KEGG terms were identified for down- and upregulated pRip1 and pam16-3 genes, respectively. I: induction time; HS: heat shock time (in hours). (D) Bar plots of the proportion of mitochondrial genes that encode the high confidence mitochondrial proteome (HCMP) in each set. The proportions of significant genes (5% FDR) are shown in gray shades (statistically significant). The proportions of differentially expressed features in the pam16-3 and pRip1 samples (5% FDR; log2FC ± 1) are shown in green (upregulated) and pink (downregulated). The number of genes in each group is indicated. The number of genes in each fraction is indicated in parentheses. (E) Expression analysis of selected molecular chaperone genes based on RNA-seq analysis in pam16-3 strains. Cells were grown at a permissive temperature of 19°C and shifted to a restrictive temperature of 37°C for 1, 4, and 8 hr. Dark shades indicate the expression level in pam16-3 compared with WT strains. Light shades show expression changes in WT samples that were triggered by the heat shock response. To estimate transcriptional changes that were induced by the higher temperature, WT samples that were incubated at 37°C for 1, 4, and 8 hr were compared against untreated WT samples (0 hr). Arrows indicate chaperones for which the largest increase in gene levels of molecular chaperones was observed because of the mitochondrial import defect compared with changes that were only attributable to heat shock. (F) Analysis of expression changes for genes that are related to the mitoCPR (Weidberg and Amon, 2018) response based on the RNA-seq analysis in pam16-3 strain samples as in (A). Up- and downregulated genes (5% FDR) are shown in green and pink, respectively. The intensity of the color shades reflects the level of expression change (log2FC).
Figure 2—figure supplement 2
Characterization of gene change that was attributable to heat shock in WT and the pam16-3 mutant.
(A, B) Bar plots of the number of changed gene transcripts in WT (A) and pam16-3 (B) for the indicated heat shock time. Values of log2FC ± 1 are shown in green (upregulated) and pink (downregulated). The number of genes in each group is indicated. (C, D) Kyoto Encyclopedia of Genes and Genomes (KEGG) enrichment analysis for differentially expressed genes for WT (C) and pam 16-3 (D) samples for the indicated heat shock time, respectively. The results are shown as a negative log10 p value after Bonferroni correction. Bars in green indicate enriched KEGG terms for the upregulated genes. Pink bars represent KEGG terms for downregulated features.
Figure 3 with 2 supplements
Cytosolic mitochondrial protein aggregation elicits a molecular chaperone response to restore cellular homeostasis.
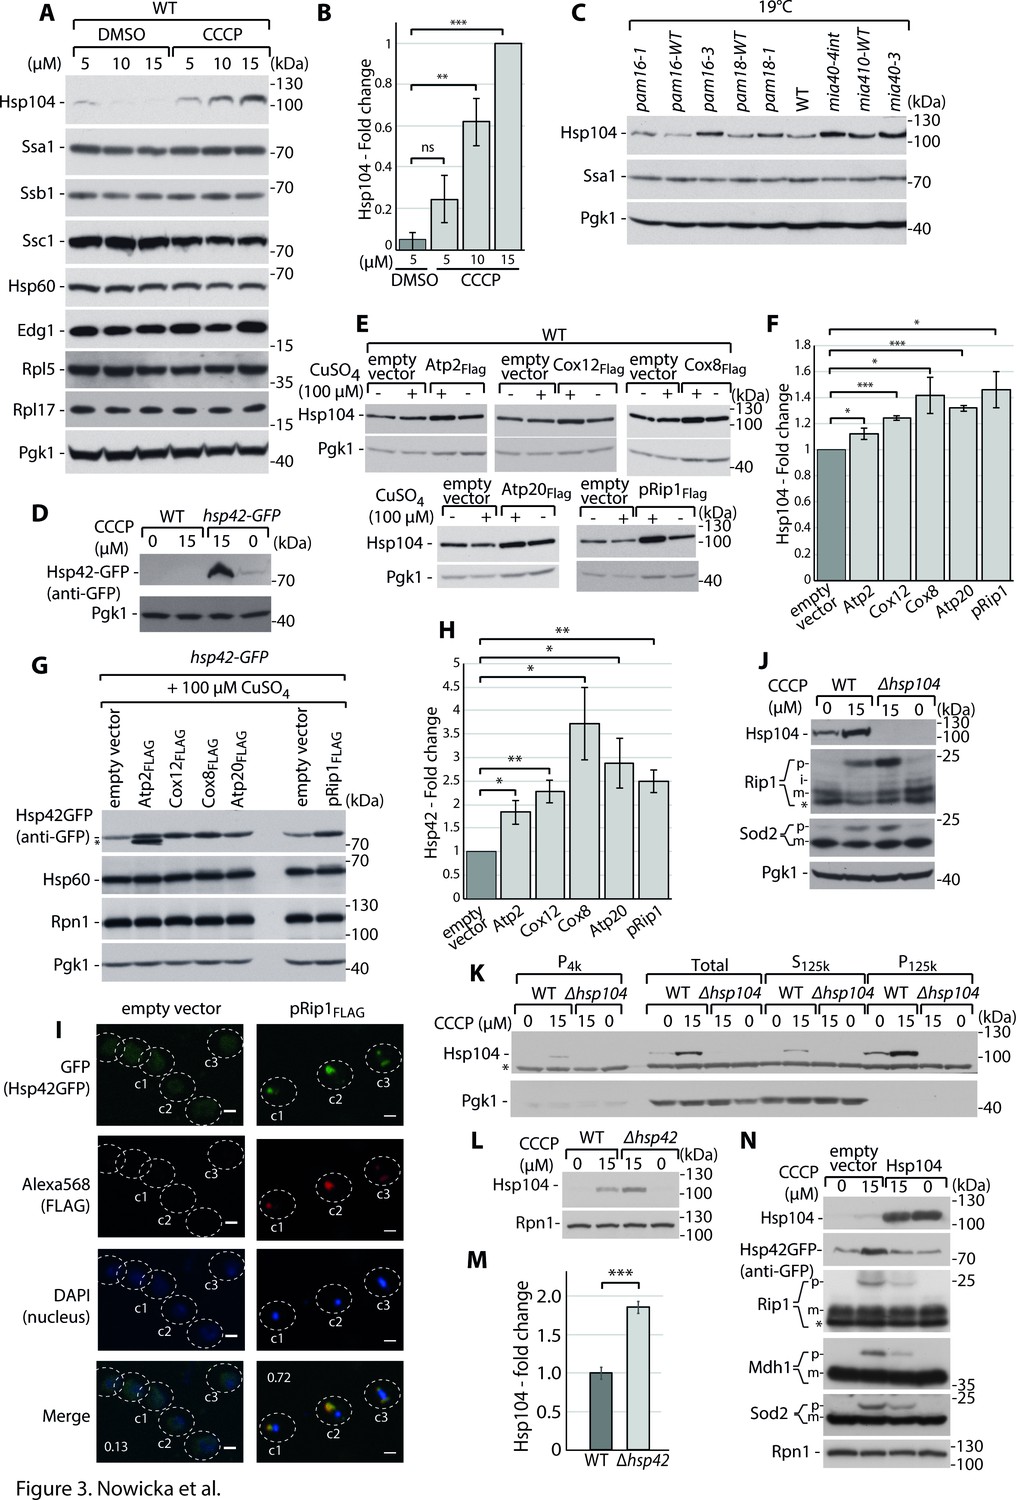
( A-D) Hsp104 and Hsp42 are upregulated in response to impairment in mitochondrial protein import. (A) Total protein cell extracts from WT yeast cells were grown at 24°C and treated with 0, 5, 10, or 15 µM carbonyl cyanide m-chlorophenyl hydrazine (CCCP) for 30 min. (B) Quantified changes in Hsp104 protein expression from (A). Quantified data are shown as mean ± SEM. n = 3. (C) Total protein cell extracts from WT (YPH499), pam16-WT, pam16-1, pam16-3, pam18-WT, pam18-1, mia40-4WT, mia40-4int, and mia40-3 grown at a permissive temperature of 19°C and shifted to a restrictive temperature of 37°C for 3 hr. (D) Total protein cell extracts from WT yeast cells and hsp42-GFP yeast grown at 24°C and treated with 0 or 15 µM CCCP for 30 min. (E–H) Metastable protein overexpression increases the expression levels of molecular chaperones. Total protein cell extracts that expressed the indicated metastable proteins or an empty vector control for 4 hr showed higher levels of Hsp104 (E) and Hsp42 (G). (F, H) Quantitative analyses of Hsp104 (F) and Hsp42 (H) levels from (E) and (G), respectively, are shown. Quantified data are shown as the mean ± SEM. n = 3. (I) Aggregated metastable proteins co-localize with Hsp42-GFP. Representative confocal microscope images show metastable proteins that were tagged with Alexa568 fluorophore in the hsp42-GFP yeast strain. Scale bar = 2 μm. See Materials and methods for further details. Pearson’s correlation coefficients were calculated for the indicated cells for each condition. (J) Total protein cell extracts from WT yeast cells and Δhsp104 yeast grown at 24°C and treated with 0 or 15 µM CCCP for 30 min. (K) SDS-PAGE analysis of aggregation assay fractions of samples of WT yeast cells and Δhsp104 yeast grown at 24°C and treated with 0 or 15 µM CCCP for 30 min, with 2% sucrose as the carbon source. (L) Total protein cell extracts from WT yeast cells and Δhsp42 yeast grown at 24°C and treated with 0 or 15 µM CCCP for 30 min. (M) Quantified changes in Hsp104 expression from (L). Quantified data are shown as the mean ± SEM. n = 3. (N) Total protein cell extracts from WT yeast cells and yeast cells that expressed Hsp104 grown overnight at 24°C and treated with 0 or 15 µM CCCP for 30 min. In (A, C–E, G, J–L, N), the samples were separated by SDS-PAGE and identified by western blot with specific antisera. Each experiment was repeated three times. p: presequence protein; m: mature protein; *: nonspecific. Significance in (B, F, H, M): *p<0.05, **p≤0.01, ***p≤0.001, ****p≤0.0001; ns: nonsignificant.
Figure 3—figure supplement 1
Total protein cell extract changes that were attributable to mitochondrial import defects.
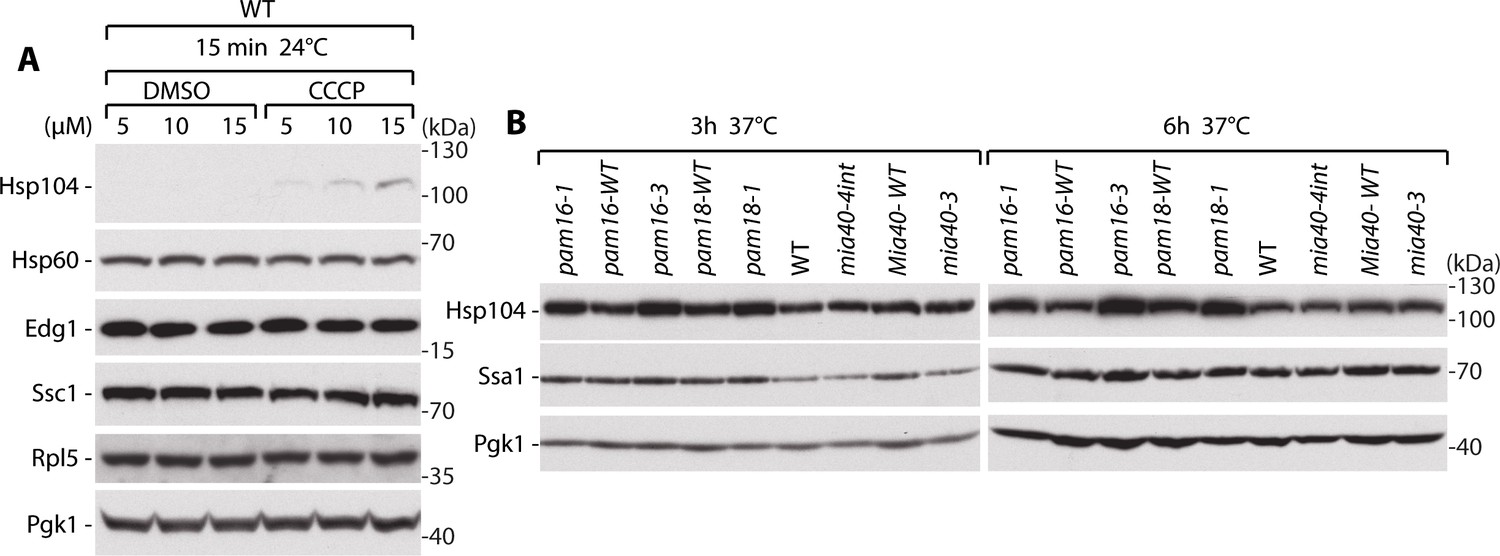
(A) Total protein cell extracts from WT yeast cells grown at 24°C and treated with 0, 5, 10, or 15 µM carbonyl cyanide m-chlorophenyl hydrazine (CCCP) for 15 min. (B) Total protein cell extracts from WT (YPH499), pam16-WT, pam16-1, pam16-3, pam18-WT, pam18-1, mia40-4WT, mia40-4int, and mia40-3 grown at 19°C and shifted to 37°C for 6 hr. In (A, B), protein samples were separated by SDS-PAGE and identified by western blot with specific antisera. Each experiment was repeated three times.
Figure 3—figure supplement 2
Cellular effects of Hsp42 and Hsp104 overexpression during mitochondrial import defects.
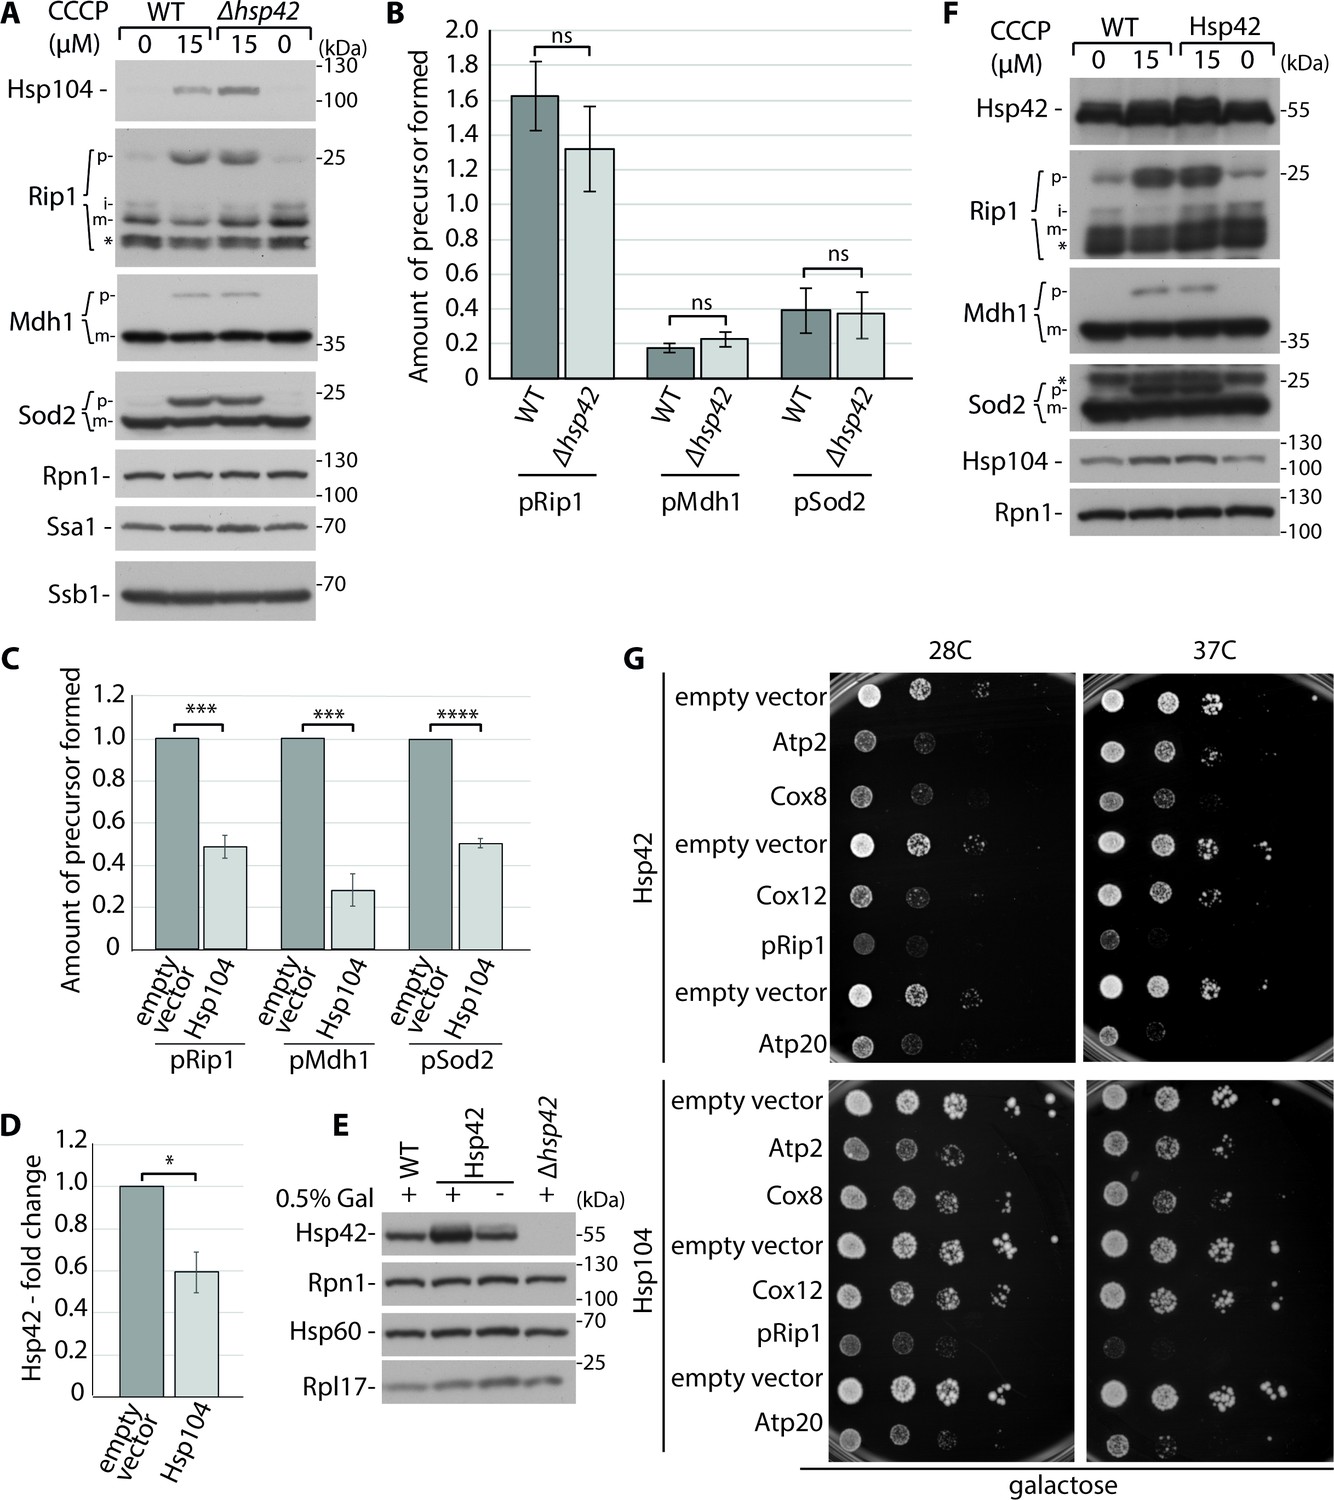
(A) Total protein cell extracts from WT yeast cells and Δhsp42 yeast grown at 24°C and treated with 0 or 15 µM carbonyl cyanide m-chlorophenyl hydrazine (CCCP) for 30 min. (B) Quantification of pRip1, pSod2, and pMdh1 from (A). Quantified data are shown as the mean ± SEM. n = 3. (C) Quantification of pRip1, pSod2, and pMdh1 from Figure 3N. Quantified data are shown as the mean ± SEM. n = 3. (D) Quantification of Hsp42 chaperone from Figure 3N. Quantified data are shown as the mean ± SEM. n = 3. (E) Total protein cell extracts from WT yeast cells, yeast cells that expressed Hsp42 under the Gal1 promoter, and Δhsp42 yeast grown at 24°C. (F) Total protein cell extracts from WT yeast cells and yeast cells that expressed Hsp42 and grown overnight at 24°C and treated with 0 or 15 µM CCCP for 30 min. (G) Ten-fold dilutions of WT cells that expressed Hsp42 or Hsp104 along with the indicated metastable protein expression spotted on selective medium agar plates with galactose as the main carbon source at 28 and 37°C. In (A, E, F), samples were separated by SDS-PAGE and identified by western blot with specific antisera. Each experiment was repeated three times. p: presequence protein; m: mature protein; *: nonspecific. Significance in (B–D): *p<0.05, **p≤0.01, ***p≤0.001, ****p≤0.0001; ns: nonsignificant.
Figure 4 with 1 supplement
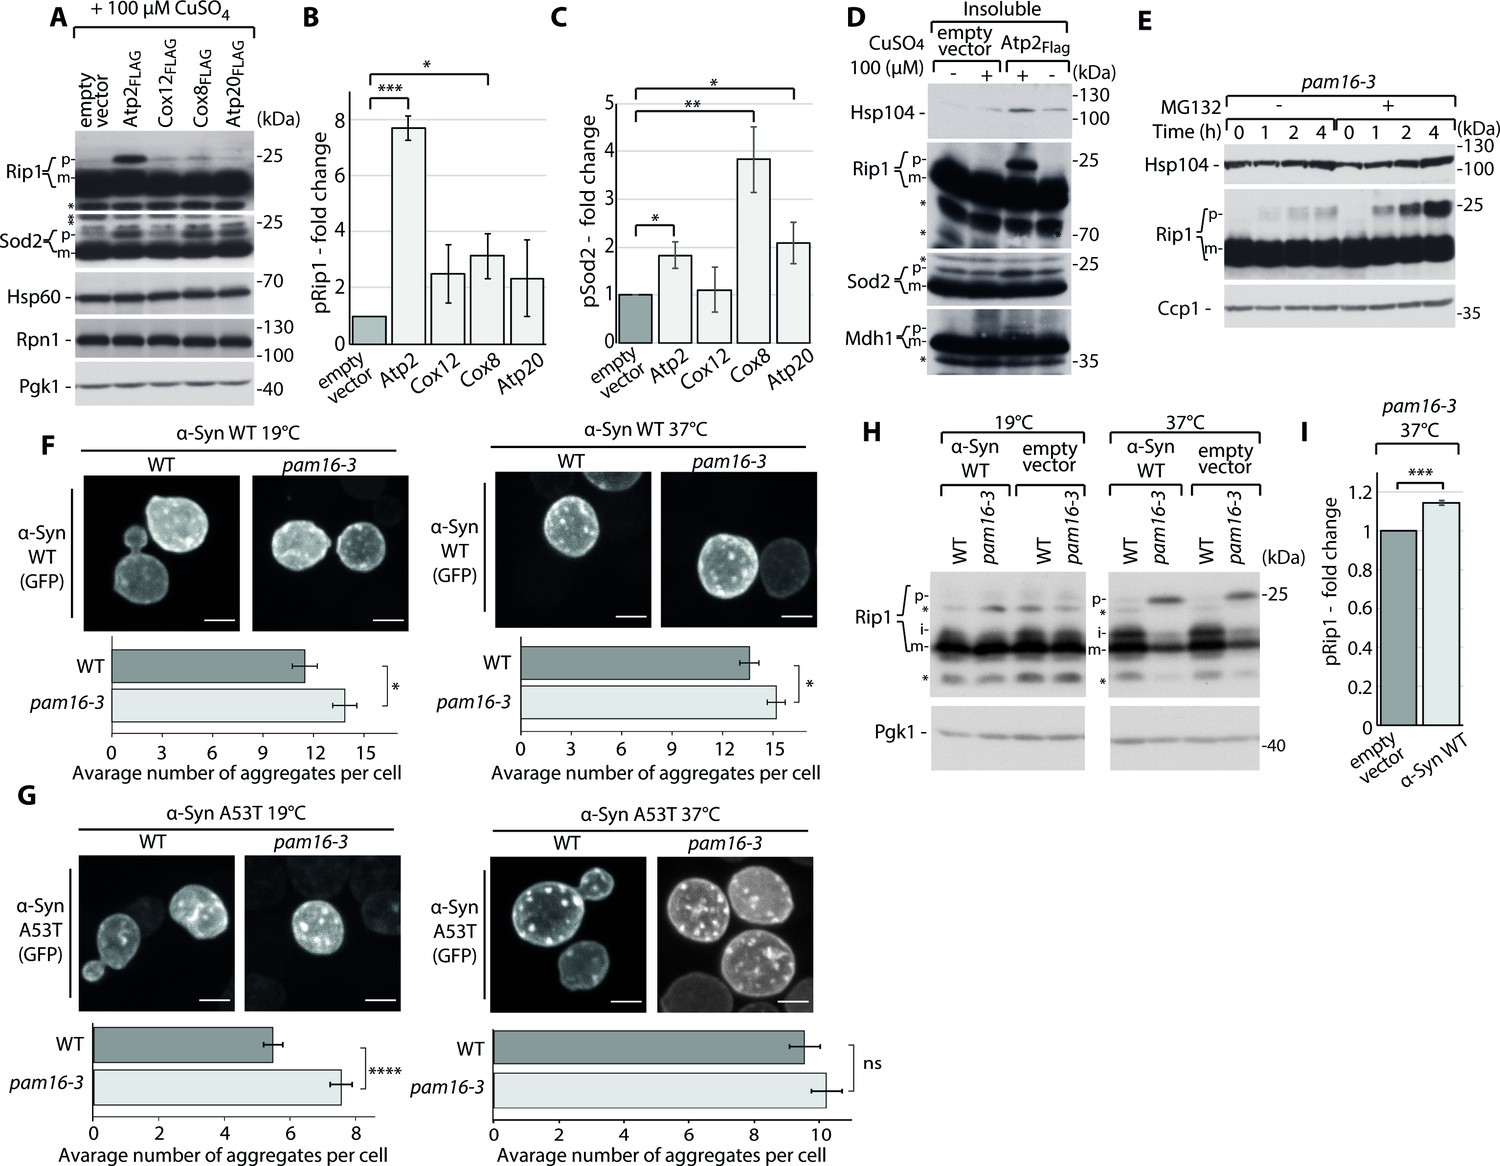
Mitochondrial protein import dysfunction enhances impairment in cellular homeostasis.
(A–D) Metastable proteins cause the accumulation and aggregation of other mitochondrial precursor proteins. (A) Total protein cell extracts from hsp42-GFP cells that expressed selected metastable proteins or an empty vector control overnight. Changes for pRip1 (B) and pSod2 (C) were quantified. Quantified data are shown as the mean ± SEM. n = 3. (D) SDS-PAGE analysis of aggregation assay fractions of hsp42-GFP yeast cells that overexpressed Atp2FLAG or an empty vector control for 3 hr, with 2% sucrose as the carbon source. Insoluble, S4k aggregation assay fraction. (E) Total protein cell extract from pam16-3 mutant yeast strains treated with 75 µM MG132 for 1 hr under permissive growth conditions and subsequently heat shocked at 37°C for 0, 1, 2, or 4 hr. (F, G) Representative confocal images of α-Syn WT-GFP (F) and A53T-GFP (G) aggregates in WT (pam16-WT) and pam16-3 yeast strains. α-Syn WT-GFP and A53T-GFP were induced for 4 hr at 19°C and for an additional 2 hr at 19°C for control or at 37°C for heat shock. Scale bar = 2 μm. See Materials and methods for further details. The bar plot shows the average number of aggregates per cell. The data are shown as the mean ± SEM. n = 57–83 for α-Syn WT-GFP. n = 154–175 for α-Syn A53T-GFP. (H) Total cell extracts of WT (pam16-WT) and pam16-3 yeast strains that expressed α-Syn WT-GFP induced for 4 hr at 19°C and for an additional 2 hr at 19°C for control or 37°C for heat shock. (I) Quantitative analysis of pRip1 from (H). Quantified data are shown as the mean ± SEM. n = 3. In (A, D, E, H), protein samples were separated by SDS-PAGE and identified by western blot with specific antisera. Each experiment was repeated three times. For western blot: p: presequence protein; i: intermediate protein; m: mature protein; *: nonspecific. *p<0.05, **p≤0.01, ***p≤0.001, ****p≤0.0001; ns: nonsignificant.
-
Figure 4—source data 1
Source data for the average number of aggregates per cell and average aggregates size: α-Syn WT-GFP and α-Syn A53T-GFP for WT (pam16-WT) and pam16-3 strains at 19 and 37°C.
- https://cdn.elifesciences.org/articles/65484/elife-65484-fig4-data1-v2.xlsx
Figure 4—figure supplement 1
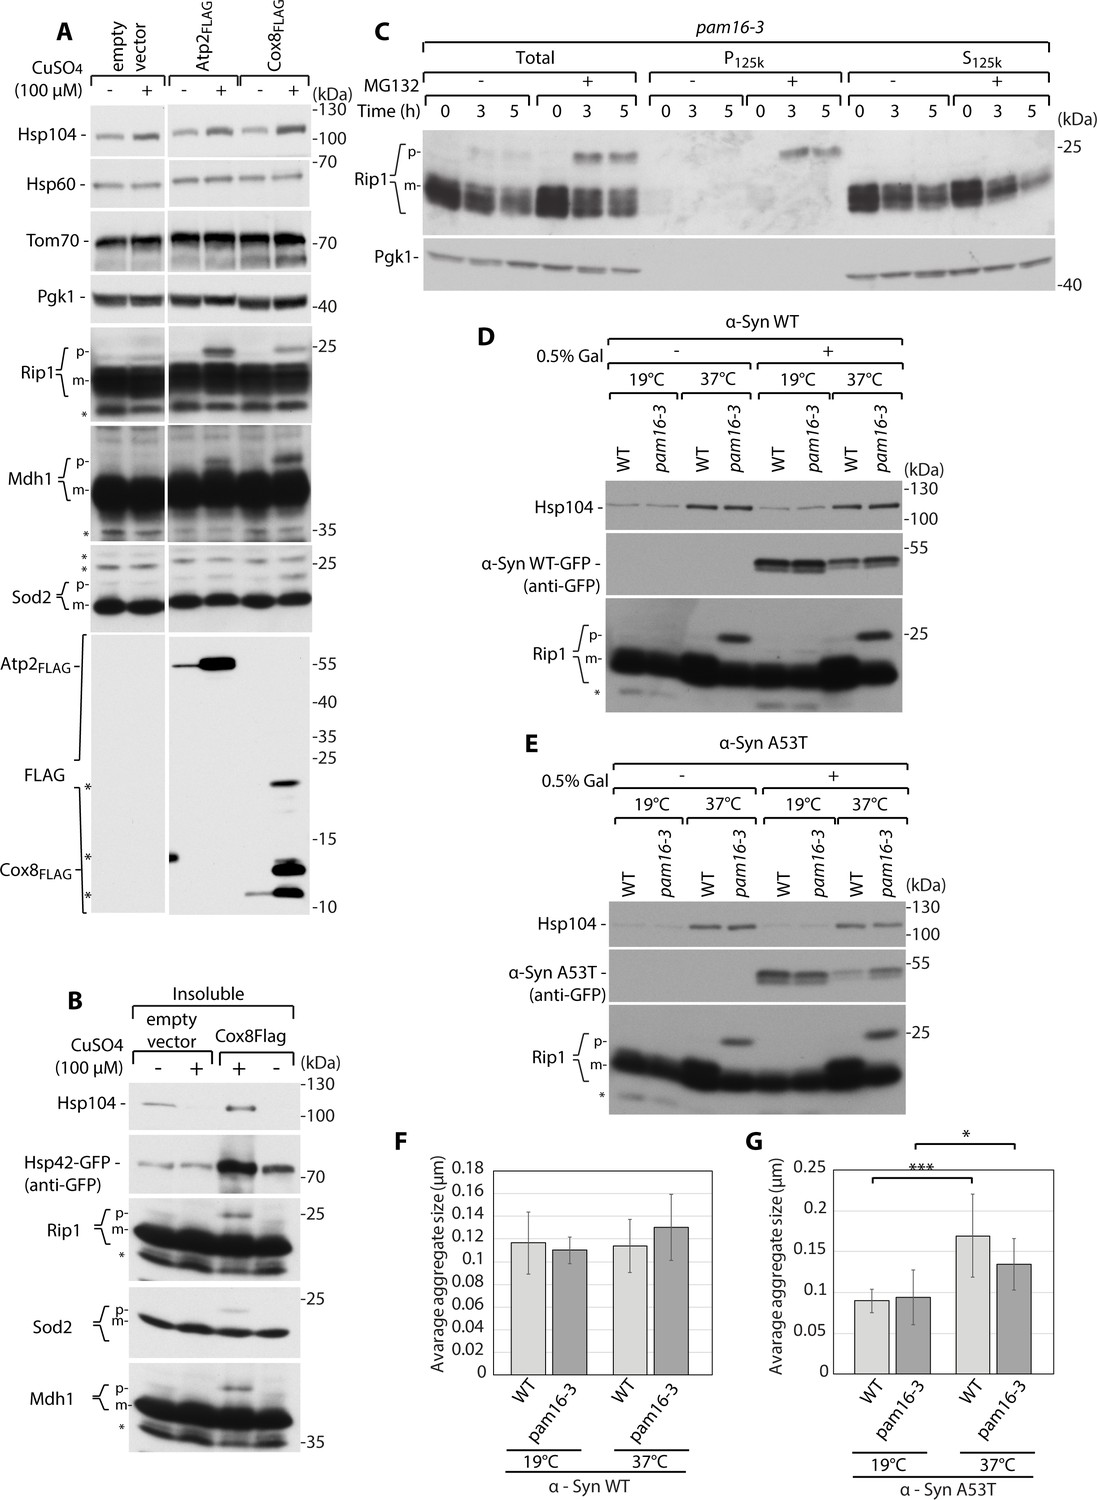
Effects of mitochondrial protein import dysfunction on cellular homeostasis.
(A) The presence of metastable proteins results in the cytosolic accumulation of other mitochondrial precursors proteins, showing the SDS-PAGE analysis of total protein cell extracts from hsp42-GFP yeast cells that expressed Atp2FLAG, Cox8FLAG, or an empty vector control for 3 hr, corresponding to the aggregation assay from Figure 4D, Figure 4—figure supplement 1B. (B) SDS-PAGE analysis of aggregation assay fractions of hsp42-GFP yeast cells that overexpressed Cox8FLAG or an empty vector control for 3 hr, with 2% sucrose as the carbon source. Insoluble, S4k aggregation assay fraction. (C) SDS-PAGE analysis of aggregation assay fractions of the pam16-3 mutant yeast strain grown at a permissive temperature of 19°C to the mid-logarithmic phase. Cells were treated with 75 µM MG132 for 1 hr and heat shocked at 37°C for 0, 3, or 5 hr, with 2% galactose as the carbon source. (D, E) WT (pam16-WT) and pam16-3 yeast strains that expressed α-Syn WT-GFP (D) or A53T-GFP (E) samples that were used for the confocal images presented in Figure 4F and G were subjected to the SDS-PAGE analysis of total protein cell extracts. (F, G) Quantification of average aggregate size (in µm) for WT and pam16-3 yeast strains that expressed α-Syn WT-GFP (F) or A53T-GFP (G) from Figure 4F and G, respectively. Quantified data are shown as the mean ± SD. n = 10. In (A–E), protein samples were separated by SDS-PAGE and identified by western blot with specific antisera. Each experiment was repeated three times. *p<0.05, **p≤0.01, ***p≤0.001, ****p≤0.0001; ns: nonsignificant.
Figure 5 with 1 supplement
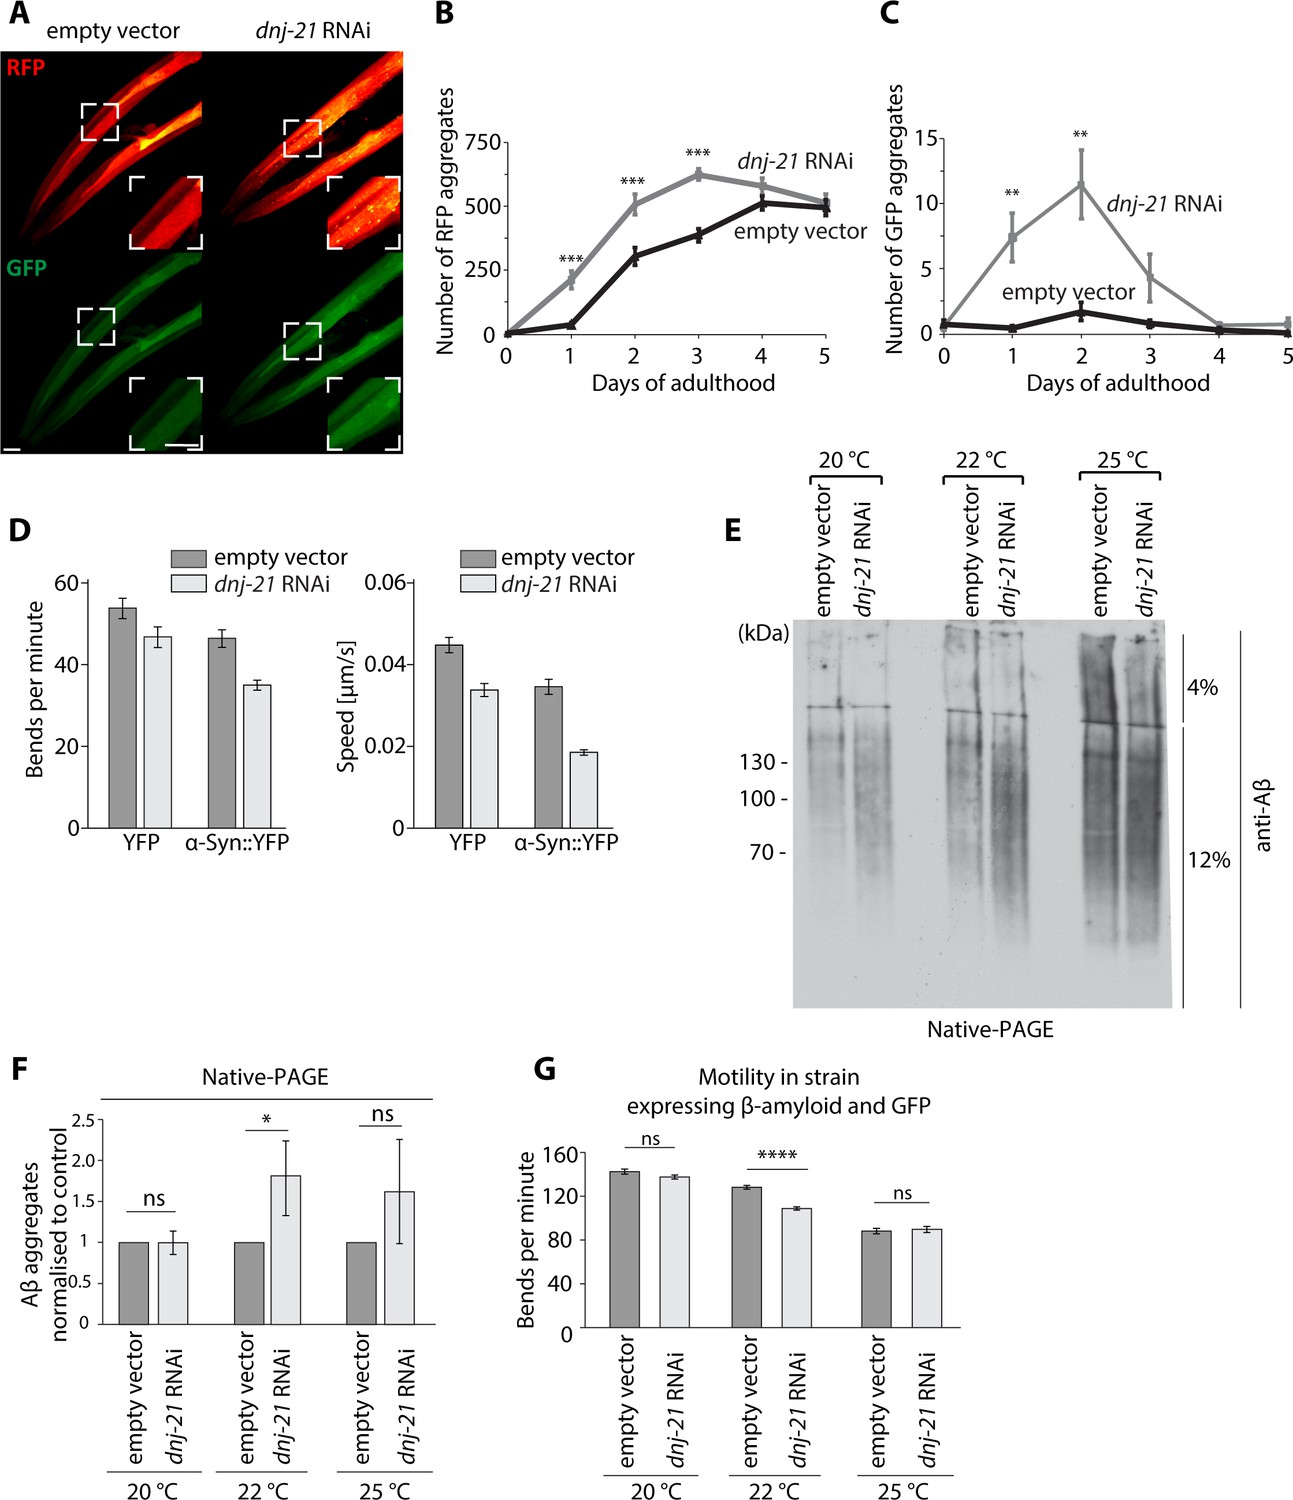
Mitochondrial dysfunction results in the accumulation of Aβ aggregates in C. elegans.
(A–C) Mitochondrial dysfunction stimulates the aggregation of model proteins in C. elegans. (A) Confocal images of worms that expressed wrmScarlet and green fluorescent protein (GFP) in body wall muscle [pmyo-3::wrmScarlet+ pmyo::GFP]. The zoomed image is presented in the white box. Scale bar = 20 μm. (B) Number of red fluorescent protein (RFP) aggregates at different days of adulthood of strain [pmyo-3::wrmScarlet+ pmyo-3::GFP] strain upon dnj-21 RNAi. n = 14–16 worms for empty vector. n = 8–16 worms for dnj-21 RNAi. (C) Number of GFP aggregates present at different days of adulthood of [pmyo-3::wrmScarlet+ pmyo-3::GFP] strain upon dnj-21 RNAi. n = 14–16 worms for empty vector. n = 8–16 worms for dnj-21 RNAi. (D) Motility of Parkinson’s disease model strain that expressed α-Syn::YFP in the body wall muscle or control strain that expressed YFP in the body wall muscle upon the silencing of dnj-21. An empty vector was used as the control. Data were obtained using an automated body bend assay. The data are shown as the mean ± SEM, with at least n = 700 for each condition. (E) Protein aggregation under native conditions in worms that expressed Aβ upon dnj-21 RNAi. Worms were cultured at 20°C or shifted to 22 or 25°C. n = 3. (F) Aβ levels were calculated from the native aggregation data in (E). The data are shown as the mean ± SD. n = 3. (G) Motility in worms that expressed Aβ and GFP upon dnj-21 RNAi. The data are shown as the mean ± SEM. n = 50 worms per condition. Overall differences between conditions were assessed by unpaired t-test by assuming equal variance. *p<0.05, **p≤0.01, ***p≤0.001, ****p≤0.0001; ns: nonsignificant.
-
Figure 5—source data 1
Source data for worms that expressed wrmScarlet and green fluorescent protein (GFP) in body wall muscle.
- https://cdn.elifesciences.org/articles/65484/elife-65484-fig5-data1-v2.xlsx
-
Figure 5—source data 2
Source data for worms that expressed α-Syn::YFP and Aβ.
- https://cdn.elifesciences.org/articles/65484/elife-65484-fig5-data2-v2.xlsx
Figure 5—figure supplement 1
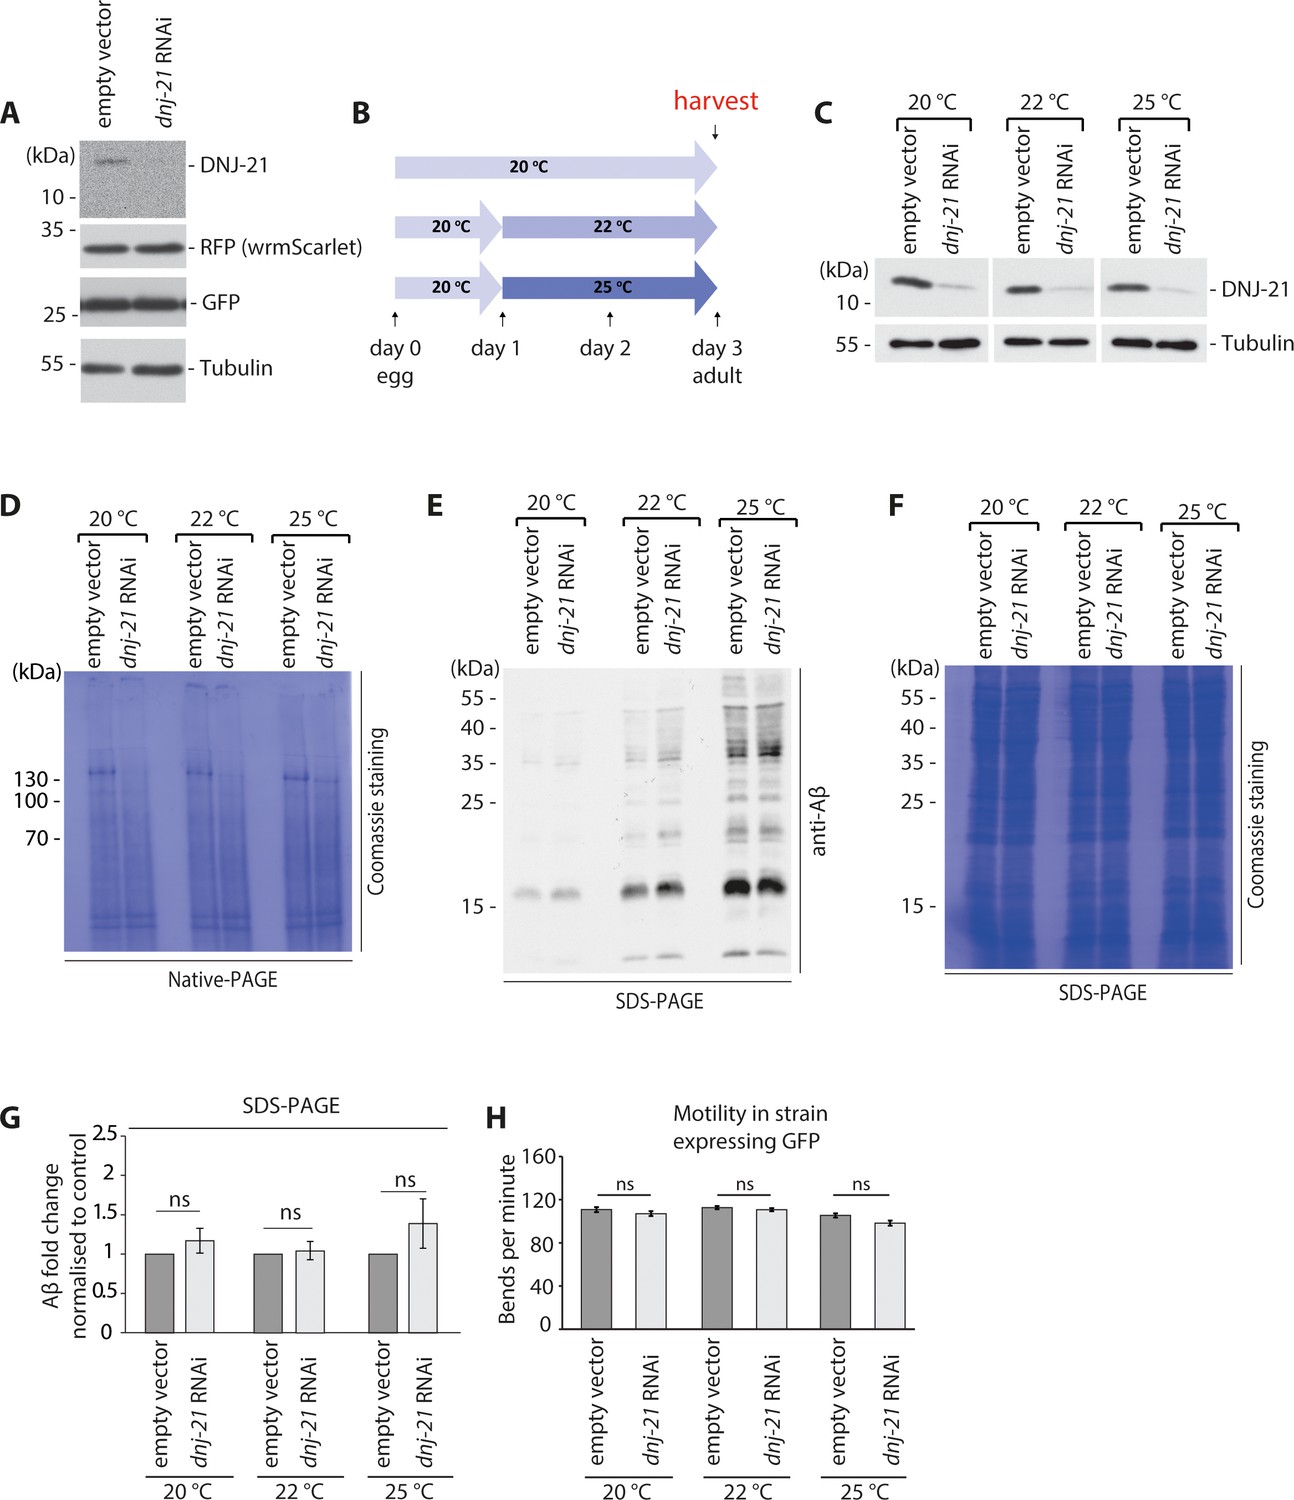
Scheme and controls for experiments on mitochondrial dysfunction in C. elegans that resulted in Aβ accumulation.
(A) RNAi silencing effectiveness on protein levels upon dnj-21 RNAi in worms strain [pmyo-3::wrmScarlet+ pmyo::GFP]. (B) Scheme of temperature shifts during worm culture in the experiments that are presented in Figure 5E–G, Figure 5—figure supplement 1D-F. (C) Protein levels in worms that expressed Aβ peptides upon dnj-21 RNAi. Worms were cultured with the indicated temperature shift. n = 3 biological replicates. (D) Coomassie staining as a loading control for data that are presented in Figure 5E. n = 3 biological replicates. (E) SDS-PAGE analysis of aggregate levels in worms that expressed Aβ peptides upon dnj-21 RNAi. n = 3 biological replicates. Worms were cultured at 20°C or with a temperature shift to 22 or 25°C. (F) Coomassie staining as a loading control for data that are presented in (E). n = 3 biological replicates. (G) Aβ levels calculated from the SDS-PAGE analysis of aggregates in (E). The data are shown as the mean ± SD. n = 3. Overall differences between conditions were assessed by unpaired t-test by assuming unequal variance. (H) Motility in worms that expressed green fluorescent protein (GFP) upon dnj-21 RNAi. The data are shown as the mean ± SEM. Overall differences between conditions were assessed by unpaired t-test by assuming equal variance. n = 35 worms for culture at 20°C. n = 60 worms for culture with 22°C shift. n = 50 worms for culture with 25°C shift. *p<0.05, **p≤0.01, ***p≤0.001, ****p≤0.0001; ns: nonsignificant.
Author response image 1
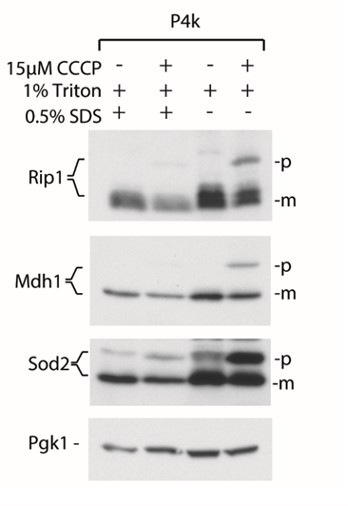
Addition of SDS in the lysis buffers results in better cell lysis and smaller amounts of mature forms of proteins in the P4k fraction based on the aggregation assay.
Author response image 2
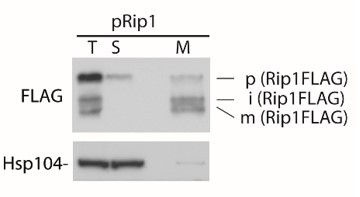
Fractionation of cells expressing pRip1.
T- total cells, S – supernatant, cytosolic fraction, M – mitochondrial fraction.
Author response image 3
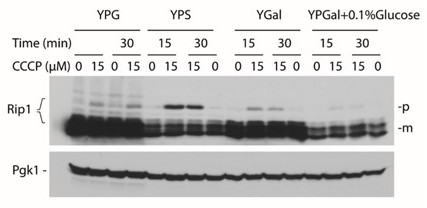
pRip1 levels for the different sources of carbon used for growth conditions.
YPG – glycerol based, YPS – sucrose based, YPGal – galactose based, YPGal + 0.1% Glucose – galactose based with addition of glucose.
Author response image 4
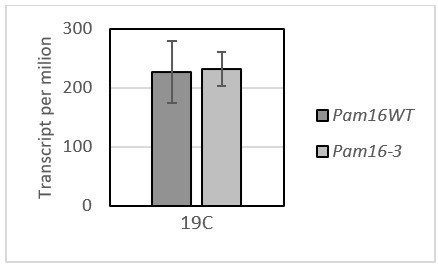
The change in the transcript per million between the WT and pam16-3 under permissive temperature.
Author response image 5
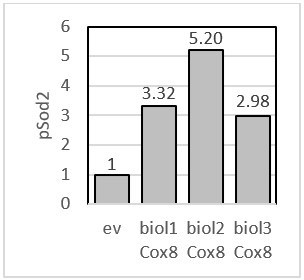
pSod2 – fold change presented for each biological replicate when Cox8 was overexpressed.
Author response image 6

pRip1 – fold change presented for each biological replicate when Cox8, Atp2, and Atp20 was overexpressed.
Author response image 7
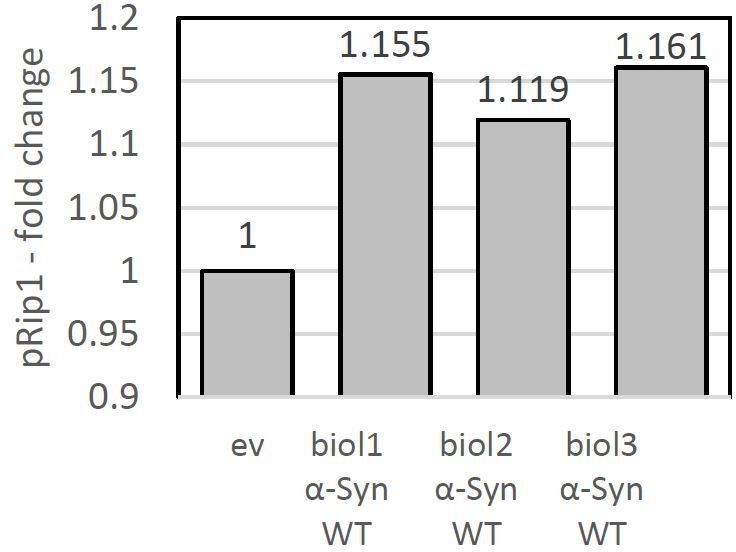
pRip1 – fold change presented for each biological replicate.
Conditions: pam16-3 at 37°C.
Tables
Key resources table
| Reagent type (species) or resource | Designation | Source or reference | Identifiers | Additional information |
|---|---|---|---|---|
| Strain, strain background (Saccharomyces cerevisiae) | YPH499 | Standard laboratory strain | In-house ID: 524 | MATa, ade2-101, his3-D200, leu2-D1, ura3-52, trp1-D63, lys2-801 |
| Strain, strain background (Saccharomyces cerevisiae) | BY4741 | Standard laboratory strain | In-house ID: 755 | MATa, his3D1, leu2D0, met15D0, ura3D0 |
| Strain, strain background (Saccharomyces cerevisiae) | Δhsp104 | Euroscarf | In-house ID: 1001 | |
| Strain, strain background (Saccharomyces cerevisiae) | hsp42-GFP | Invitrogen | In-house ID: 1005 | |
| Strain, strain background (Saccharomyces cerevisiae) | Hsp42-BY4741 | Provided by Dr. Bernd Bukau | In-house ID: 1178 | -His selection; Gal1 promoter |
| Strain, strain background (Saccharomyces cerevisiae) | pam16WT | 10.1038/nsmb735 | In-house ID: 736 | |
| Strain, strain background (Saccharomyces cerevisiae) | pam16-1 | 10.1038/nsmb735 | In-house ID: 733 | |
| Strain, strain background (Saccharomyces cerevisiae) | pam16-3 | 10.1038/nsmb735 | In-house ID: 734 | |
| Strain, strain background (Saccharomyces cerevisiae) | pam18WT | 10.1083/jcb.200308004 | In-house ID: 738 | |
| Strain, strain background (Saccharomyces cerevisiae) | pam18-1 | 10.1083/jcb.200308004 | In-house ID: 739 | |
| Strain, strain background (Saccharomyces cerevisiae) | mia40WT | 10.1038/sj.emboj.7600389 | In-house ID: 398 | |
| Strain, strain background (Saccharomyces cerevisiae) | mia40-3 | 10.1038/sj.emboj.7600389 | In-house ID: 178 | |
| Strain, strain background (Saccharomyces cerevisiae) | mia40-4int | 10.1083/jcb.200804095 | In-house ID: 739 | |
| Strain, strain background (Caenorhabditis elegans) | Worms expressing GFP | Caenorhabditis Genetics Center (CGC) | RRID:WB-STRAIN:WBStrain00005101CL2122 dvIs15 [(pPD30.38) unc-54(vector) + (pCL26) mtl-2::GFP] | Control strain for GM101 |
| Strain, strain background (Caenorhabditis elegans) | Worms expressing Aβ and GFP | Caenorhabditis Genetics Center (CGC) | RRID:WB-STRAIN:WBStrain00007866GMC101 dvIs100 [punc-54::A-beta-1–42::unc-54–3'-UTR+ mtl-2p::GFP] | |
| Strain, strain background (Caenorhabditis elegans) | α-syn::YFP | 10.1371/journal.pgen.1000027 | OW40 zgIs15 [punc-54::αsyn::YFP]IV | |
| Strain, strain background (Caenorhabditis elegans) | YFP | 10.1371/journal.pgen.1000027 | OW450 rmIs126 [punc-54::YFP]V | Control strain for OW40 |
| Strain, strain background (Caenorhabditis elegans) | [pmyo-3::wrmScarlet+ pmyo::GFP] | A strain generated in our laboratory | ACH87: wacIs11 [pmyo-3::mGFP::SL2 gdp-2-wrmScarlet::unc-54-3´UTR, unc-119(+)] | |
| Strain, strain background (Escherichia coli) | HB101 | Caenorhabditis Genetics Center (CGC) | RRID:WB-STRAIN:WBStrain00041075HB101 | E. coli strain used as a food source for worms |
| Strain, strain background (Escherichia coli) | HT115(DE3) | Caenorhabditis Genetics Center (CGC) | RRID:WB-STRAIN:WBStrain00041074HT115(DE3) | E. coli strain used as a food source for worms in RNAi experiments |
| Strain, strain background (Escherichia coli) | OP50 | Caenorhabditis Genetics Center (CGC) | RRID:WB-STRAIN:WBStrain00041971OP50 | E. coli strain used as a food source for worms |
| Antibody | Anti-Rip1 (rabbit polyclonal) | Custom made | WB (1:500) | |
| Antibody | Anti-Sod2 (rabbit polyclonal) | Custom made | WB (1:500) | |
| Antibody | Anti-Mdh1 (rabbit polyclonal) | Custom made | WB (1:500) | |
| Antibody | Anti-Hsp60 (rabbit polyclonal) | Custom made | WB (1:500) | |
| Antibody | Anti-Pgk1 (rabbit polyclonal) | Custom made | WB (1:500) | |
| Antibody | Anti-Tom70 (rabbit polyclonal) | Custom made | WB (1:500) | |
| Antibody | Anti-Ssa1 (rabbit polyclonal) | Custom made | WB (1:500) | |
| Antibody | Anti-Ssb1 (rabbit polyclonal) | Custom made | WB (1:500) | |
| Antibody | Anti-Ssc1 (rabbit polyclonal) | Custom made | WB (1:500) | |
| Antibody | Anti-Rpl17 (rabbit polyclonal) | Custom made | WB (1:500) | |
| Antibody | Anti-Ccp1 (rabbit polyclonal) | Custom made | WB (1:500) | |
| Antibody | Anti-Qcr8 (rabbit polyclonal) | Custom made | WB (1:500) | |
| Antibody | Anti-Qcr6 (rabbit polyclonal) | Custom made | WB (1:500) | |
| Antibody | Anti-Cox12 (rabbit polyclonal) | Custom made | WB (1:500) | |
| Antibody | Anti-Tom20 (rabbit polyclonal) | Custom made | WB (1:500) | |
| Antibody | Anti-Edg1 (rabbit polyclonal) | Custom made | WB (1:500) | |
| Antibody | Anti-Cdc48 (rabbit polyclonal) | Custom made | WB (1:500) | |
| Antibody | Anti-Rpl5 (rabbit polyclonal) | Custom made | WB (1:500) | |
| Antibody | Anti-Dnj21 (rabbit polyclonal) | Custom made | WB (1:500) | |
| Antibody | Anti-Rpn1 (rabbit polyclonal) | Custom made | WB (1:500) | |
| Antibody | Anti-Hsp42 (rabbit polyclonal) | Provided by Dr. Bernd Bukau | WB (1:5000) | |
| Antibody | Anti-Hsp104(rabbit polyclonal) | Enzo | RRID:AB_11181448ADI-SPA-1040-F | WB (1:1000) |
| Antibody | Anti-GFP(mouse monoclonal) | Sigma | RRID:AB_39091311814460001 | WB (1:1000) |
| Antibody | anti-3-PGDH (rabbit polyclonal) | Millipore | RRID:AB_2783876ABS571 | IF(1:1000), WB (1:1000) |
| Antibody | Anti-beta amyloid 1–16 (mouse monoclonal) | BioLegend | RRID:AB_2564653803001 | WB (1:1000) |
| Antibody | Anti-Tubulin (mouse monoclonal) | Sigma | RRID:AB_477593T9026 | WB (1:500) |
| Antibody | Anti-mCherry (anti-wrmScarlet/RFP); (rabbit polyclonal) | Abcam | RRID:AB_2571870ab167453 | WB (1:1000) |
| Antibody | Anti-FLAG(mouse monoclonal) | Sigma | RRID:AB_262044F1804 | IF (1:1000)WB (1:1000) |
| Antibody | Alexa Fluor 568(goat anti-mouse) | Invitrogen | RRID:AB_144696A11031 | IF (1:500) |
| Recombinant DNA reagent | L4440 (control for RNAi in C. elegans) (plasmid) | AddGene | #1654 | |
| Recombinant DNA reagent | dnj-21 RNAi (plasmid) | Recombinant DNA generated in our laboratory | pMJS1 In-house ID: 435p | Plasmid used for silencing of dnj-21 |
| Recombinant DNA reagent | Hsp104-pFL46L (plasmid) | 10.1128/MCB.20.19.7220–7229.2000 | Provided by Dr. Magdalena Boguta | |
| Recombinant DNA reagent | α-Syn WT-GFP (plasmid) | 10.1126/science.1090439 | Provided by Dr. Tiago Outeiro | |
| Recombinant DNA reagent | α-Syn A53T-GFP (plasmid) | 10.1126/science.1090439 | Provided by Dr. Tiago Outeiro | |
| Recombinant DNA reagent | Empty vector with FLAG-tag, pCup1 (plasmid) | Recombinant DNA generated in our laboratory | pPCh26 In-house ID: 435p | See Supplementary file 3 |
| Recombinant DNA reagent | Cox8 (plasmid) | Recombinant DNA generated in our laboratory | pPCh17In-house ID: 481p | See Supplementary file 3 |
| Recombinant DNA reagent | Atp2 (plasmid) | Recombinant DNA generated in our laboratory | pPCh18In-house ID: 482p | See Supplementary file 3 |
| Recombinant DNA reagent | Cor1 (plasmid) | Recombinant DNA generated in our laboratory | pPCh19In-house ID: 484p | See Supplementary file 3 |
| Recombinant DNA reagent | Mas1 (plasmid) | Recombinant DNA generated in our laboratory | pPCh20In-house ID: 485p | See Supplementary file 3 |
| Recombinant DNA reagent | Qcr6 (plasmid) | Recombinant DNA generated in our laboratory | pPCh21In-house ID: 486p | See Supplementary file 3 |
| Recombinant DNA reagent | Qcr8 (plasmid) | Recombinant DNA generated in our laboratory | pPCh22In-house ID: 487p | See Supplementary file 3 |
| Recombinant DNA reagent | pRip1 (plasmid) | Recombinant DNA generated in our laboratory | pPCh23In-house ID: 488p | See Supplementary file 3 |
| Recombinant DNA reagent | iRip1 (plasmid) | RDNA generated in our laboratory | pPCh24In-house ID: 489p | See Supplementary file 3 |
| Recombinant DNA reagent | mRip1 (plasmid) | Recombinant DNA generated in our laboratory | pPCh29In-house ID: 490p | See Supplementary file 3 |
| Recombinant DNA reagent | Atp20 (plasmid) | Recombinant DNA generated in our laboratory | pPCh30In-house ID: 483p | See Supplementary file 3 |
| Recombinant DNA reagent | Cox12 (plasmid) | Recombinant DNA generated in our laboratory10.1186/s12915-018-0536-1 | pPB36.1In-house ID: 471p | See Supplementary file 3 |
| Sequence-based reagent | Primers | This paper | PCR primers | See Supplementary file 2 |
| Commercial assay or kit | RNeasy Mini Kit | Qiagen | 74104 | |
| Chemical compound, drug | CCCP | Sigma | C2759 | |
| Chemical compound, drug | MG132 | Enzo | BML-PI102-0005 | |
| Software, algorithm | ZEN | Zeiss | ZEN 2012 SP5 FP3 (black) | Confocal Microscopy Data Collection Software |
| Software, algorithm | FastQC | www.bioinformatics.babraham.ac.uk/projects/fastqc | RRID:SCR_014583 | |
| Software, algorithm | Salmon (v0.11.2) | 10.1038/nmeth.4197 | RRID:SCR_017036 | |
| Software, algorithm | DESeq2 version 1.26.0 | 10.1186/s13059-014-0550-8 | RRID:SCR_015687 | |
| Other | ProLong Diamond antifade mountant with DAPI | Thermo Fisher Scientific | P36962 |
Additional files
-
Supplementary file 1
Side-by-side comparison of gene expression levels that were attributable to heat shock and the pam16-3 mutant.
- https://cdn.elifesciences.org/articles/65484/elife-65484-supp1-v2.xlsx
-
Supplementary file 2
Nucleotides used to clone protein coding sequences and CUP1 promoter into pESC-URA.
- https://cdn.elifesciences.org/articles/65484/elife-65484-supp2-v2.xlsx
-
Supplementary file 3
List of plasmids used in this study.
- https://cdn.elifesciences.org/articles/65484/elife-65484-supp3-v2.xlsx
-
Transparent reporting form
- https://cdn.elifesciences.org/articles/65484/elife-65484-transrepform1-v2.docx
Download links
A two-part list of links to download the article, or parts of the article, in various formats.
Downloads (link to download the article as PDF)
Open citations (links to open the citations from this article in various online reference manager services)
Cite this article (links to download the citations from this article in formats compatible with various reference manager tools)
Cytosolic aggregation of mitochondrial proteins disrupts cellular homeostasis by stimulating the aggregation of other proteins
eLife 10:e65484.
https://doi.org/10.7554/eLife.65484


