Whole-brain connectivity atlas of glutamatergic and GABAergic neurons in the mouse dorsal and median raphe nuclei
- Britton Chance Center for Biomedical Photonics, Wuhan National Laboratory for Optoelectronics, MoE Key Laboratory for Biomedical Photonics, School of Engineering Sciences, Huazhong University of Science and Technology, China
- HUST-Suzhou Institute for Brainsmatics, JITRI, China
- CAS Center for Excellence in Brain Science and Intelligence Technology, Chinese Academy of Science, China
- School of Biomedical Engineering, Hainan University, China
Figures
Figure 1 with 6 supplements
Whole-brain mapping of monosynaptic input neurons to cell-type-specific neurons in the DR and MR.
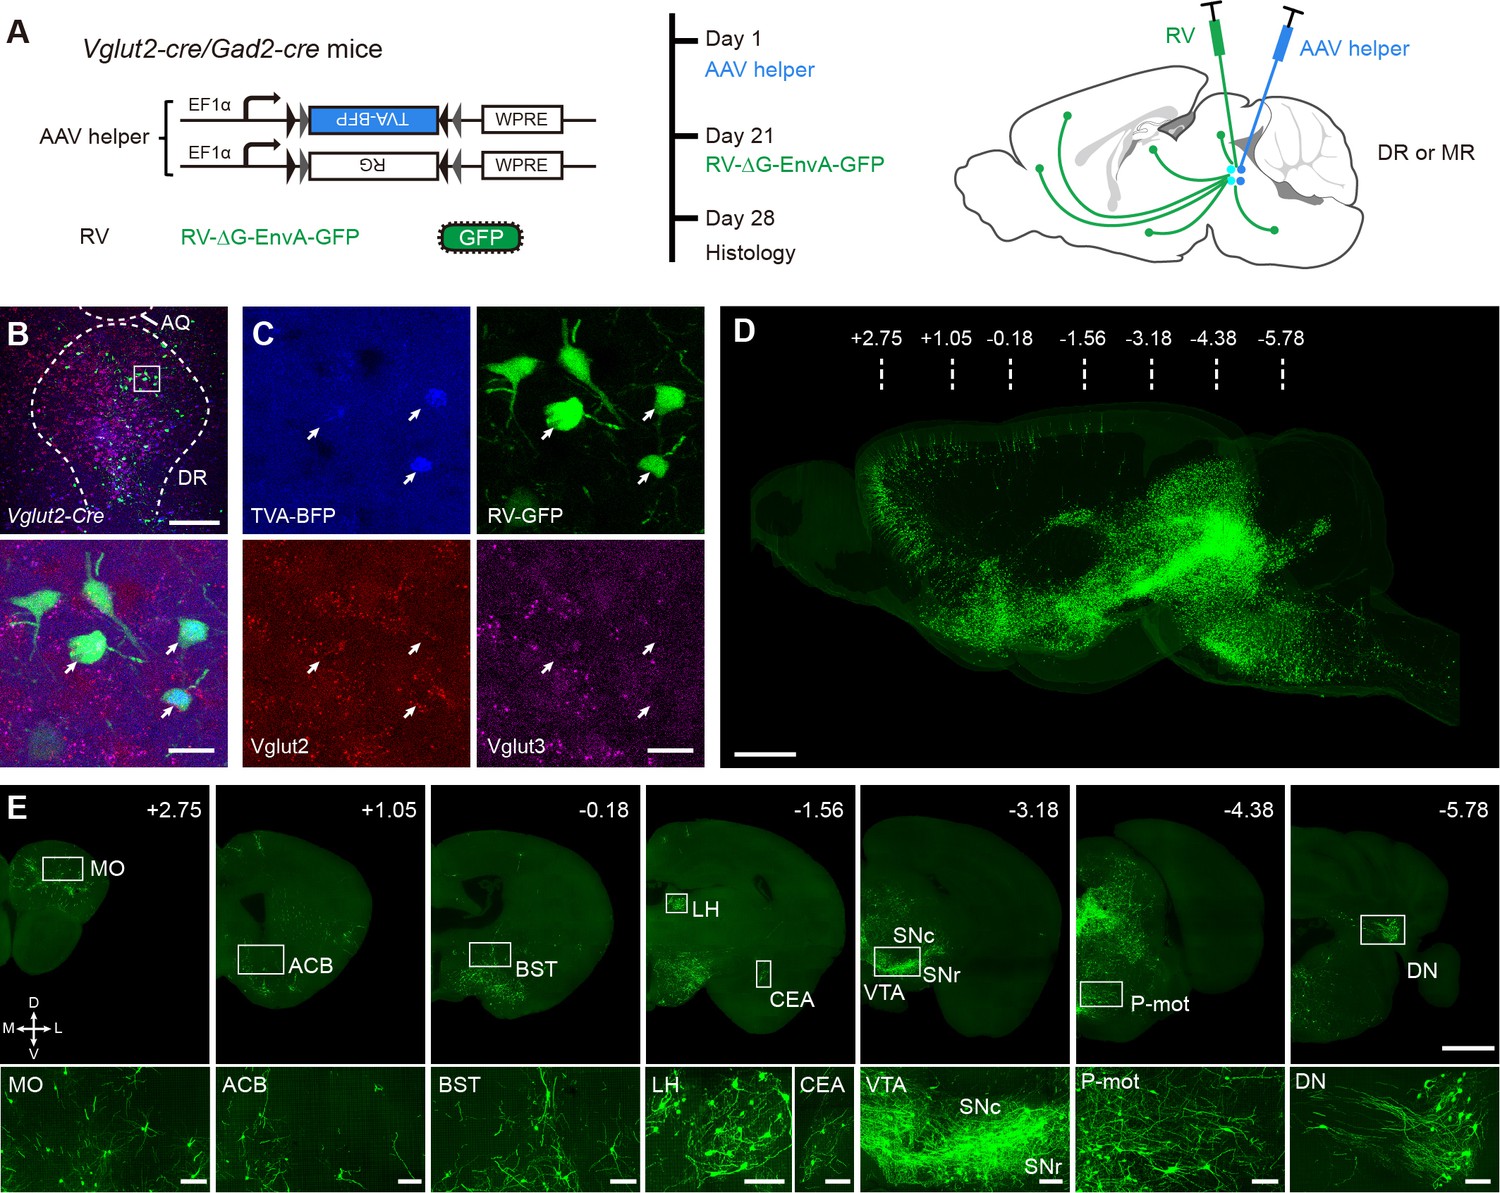
(A) Schematic of monosynaptic rabies virus tracing the inputs to cell-type-specific neurons. The AAV helper virus expresses a fusion of TVA- BFP and RG, and the modified rabies virus pseudotyped with EnvA expresses GFP. The experimental strategy and time line are shown on the right. (B) Characterization of the specificity of starter cells at the DR in Vglut2-Cre mice using in situ hybridization. Bottom, enlarged view of the box area in the top image. Scale bar, top, 200 μm, bottom, 20 μm. (C) Detailed view of the bottom image in (B). White arrows, starter cells. (D) Three-dimensional rendering of whole-brain input neurons to DR glutamatergic neurons from a representative sample. Scale bar, 1 mm. (E) Representative coronal sections of maximum intensity projection showing the distribution of input neurons to DR glutamatergic neurons. The projections are 50 μm thick. Scale bars, top row, 1 mm, bottom row, 100 μm. A, anterior; P, posterior; M, medial; L, lateral. The details of abbreviations for brain regions see Supplementary file 1.
Figure 1—figure supplement 1
Distribution and total number of Vglut2+ and Gad2+ neurons in the DR and MR.
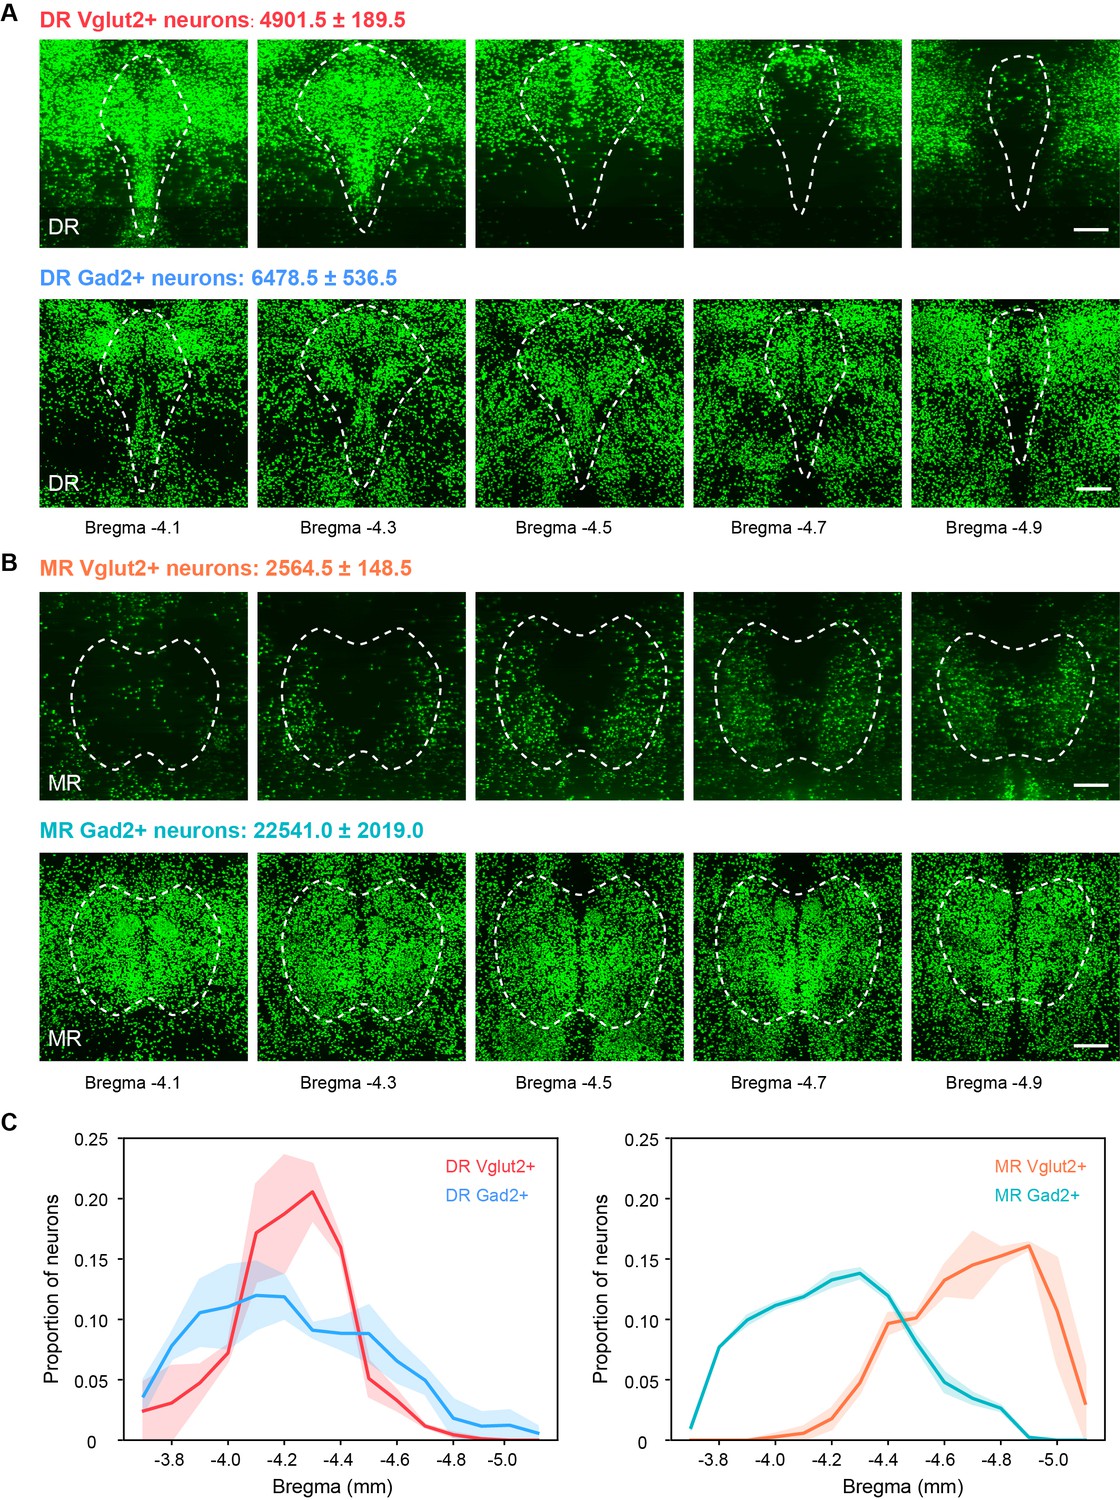
(A) Representative coronal sections of maximum intensity projection showing the distribution of Vglut2+ and Gad2+ neurons in the DR. The projections are 200 μm thick. Scale bar, 200 μm. The total number of Vglut2+ and Gad2+ neurons in the DR are presented as mean ± s.e.m., n = 2. (B) Representative coronal sections of maximum intensity projection showing the distribution of Vglut2+ and Gad2+ neurons in the MR. The projections are 200 μm thick. Scale bar, 200 μm. The total number of Vglut2+ and Gad2+ neurons in the MR are presented as mean ± s.e.m., n = 2. (C) Density plot of specific neuron types in the DR and MR along the anterior-posterior axis. Bin width, 100 μm. The shaded area indicates s.e.m., n = 2.
Figure 1—figure supplement 2
Validation of the labeling of whole-brain inputs.
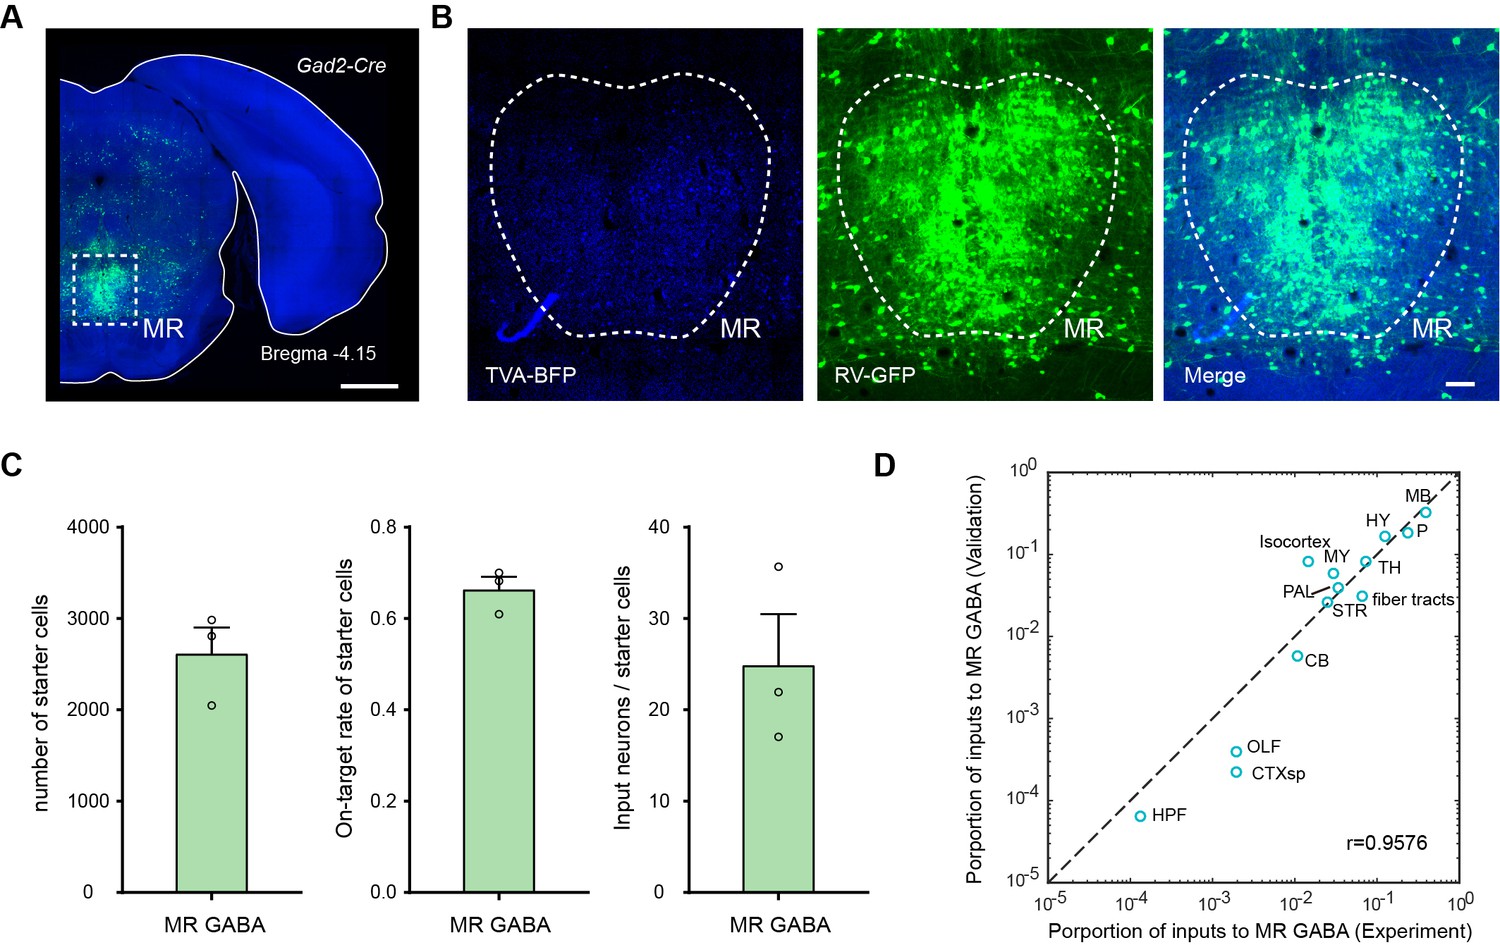
(A) Representative coronal section of the injection site showing the starter cells (cyan). The image is from a representative sample that label the inputs to MR Gad2+ neurons. Scale bar, 1 mm. (B) Enlarged view of dotted box area in (A). Scale bar, 100 μm. (C) The number and on-target rate of labeled starter neurons, and the ratio of input neurons to starter cell. The data are from validation samples that label the inputs to MR Gad2+ neurons. Data are shown as mean ± s.e.m., n = 3. (D) Comparison of inputs to MR Gad2+ neurons.
Figure 1—figure supplement 3
Characterization of the specificity of starter cells using in situ hybridization.
(A) In situ hybridization at the MR in Vglut2-Cre mouse. (B) Enlarged view of the box area in (A). White arrows, starter cells. Scale bar, A, 200 μm, B, 20 μm.
Figure 1—figure supplement 4
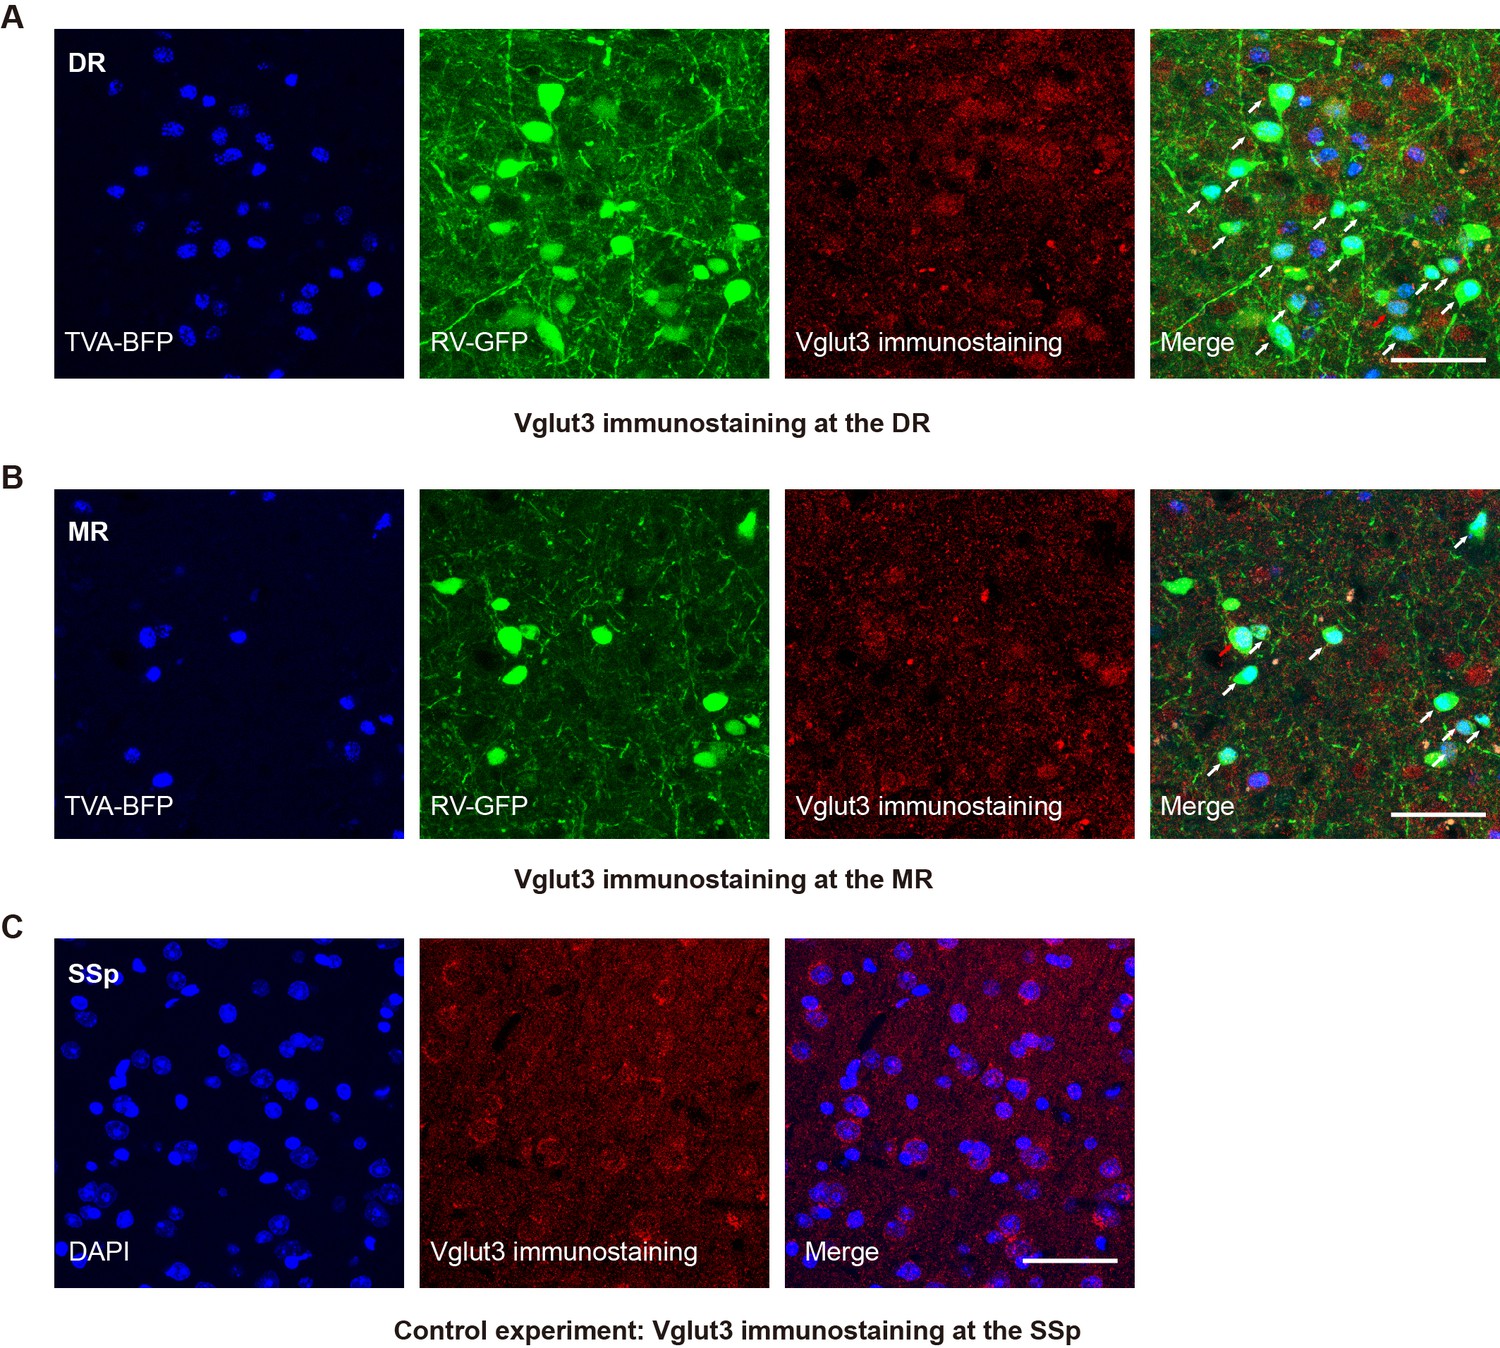
Validation of the specificity of starter cells using immunohistochemical staining.
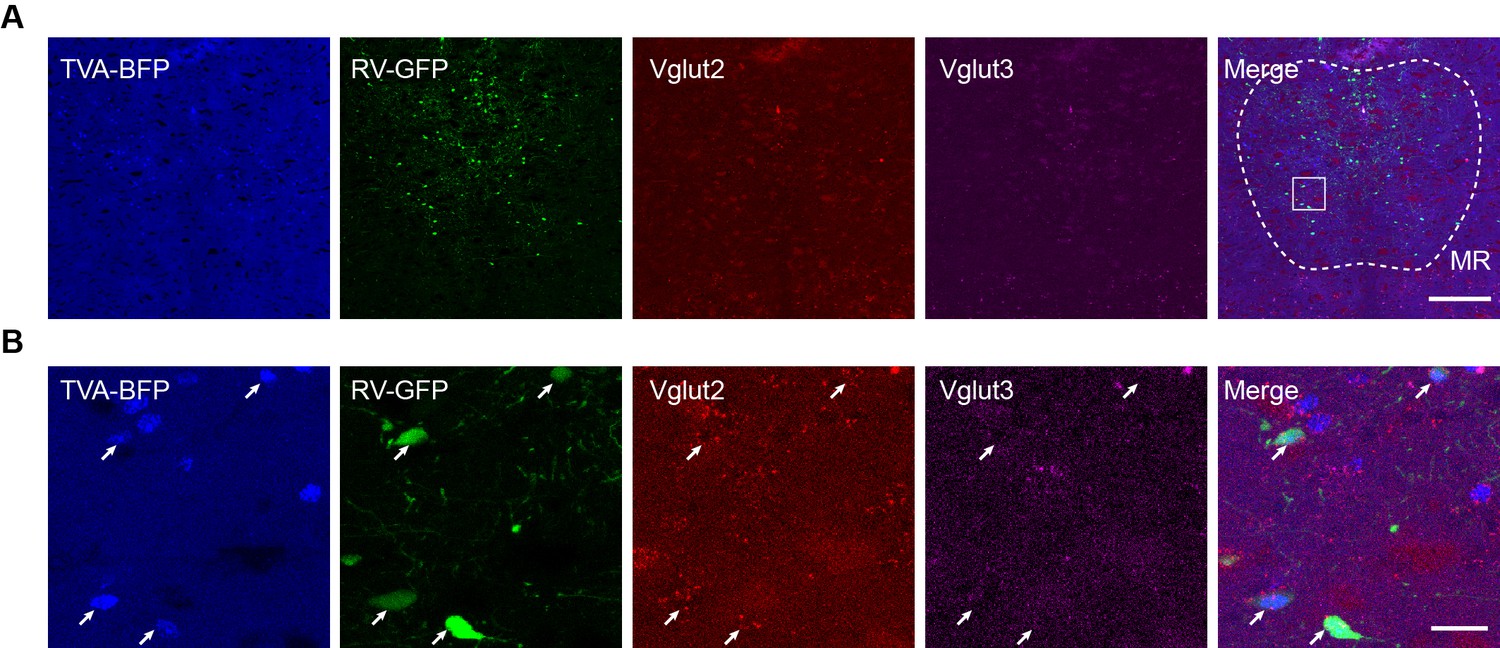
(A) Immunohistochemical staining against Vglut3 at the DR in Vglut2-Cre mouse. White arrows, starter cells. Red arrows, starter cells that are Vglut3 positive. (B) Immunohistochemical staining against Vglut3 at the MR in Vglut2-Cre mouse. White arrows, starter neurons. Red arrows, starter cells that are Vglut3 positive. (C) Control experiment, immunohistochemical staining against Vglut3 at the SSp in Vglut2-Cre mouse. Scale bar, 50 μm.
Figure 1—figure supplement 5
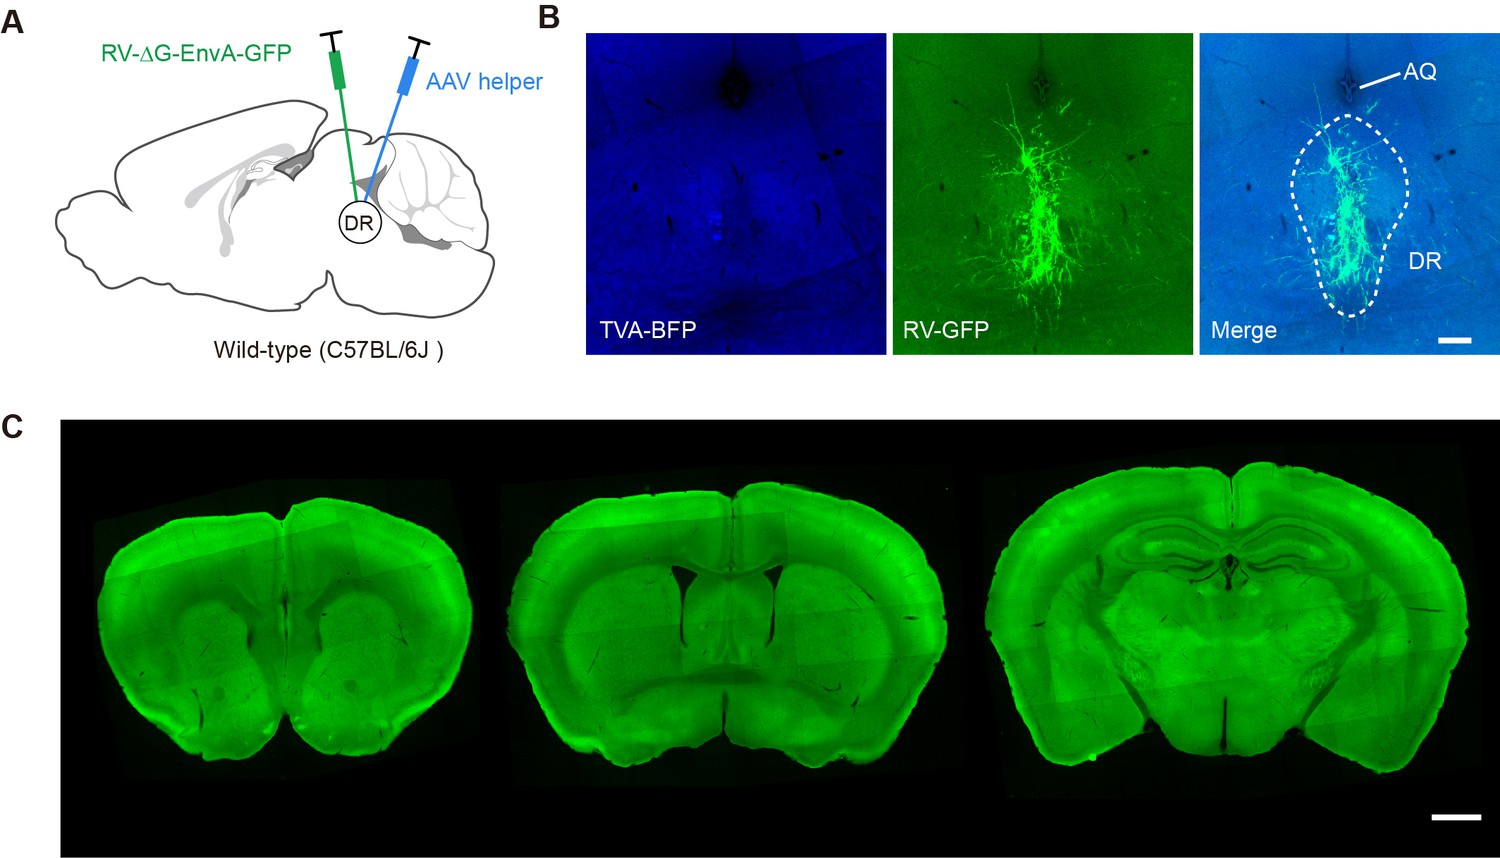
Control experiments for mapping monosynaptic inputs.
(A) Schematic of viral injections into wild-type mice. (B) Representative coronal section showing labeled neurons at the injection site. (C) Representative coronal sections showing upstream brain regions known to send inputs to DR Vglut2+ neurons to confirm that there is no transsynaptic transmission of the RV in wild-type mice. Scale bar, B, 200 μm. C, 1 mm.
Figure 1—figure supplement 6
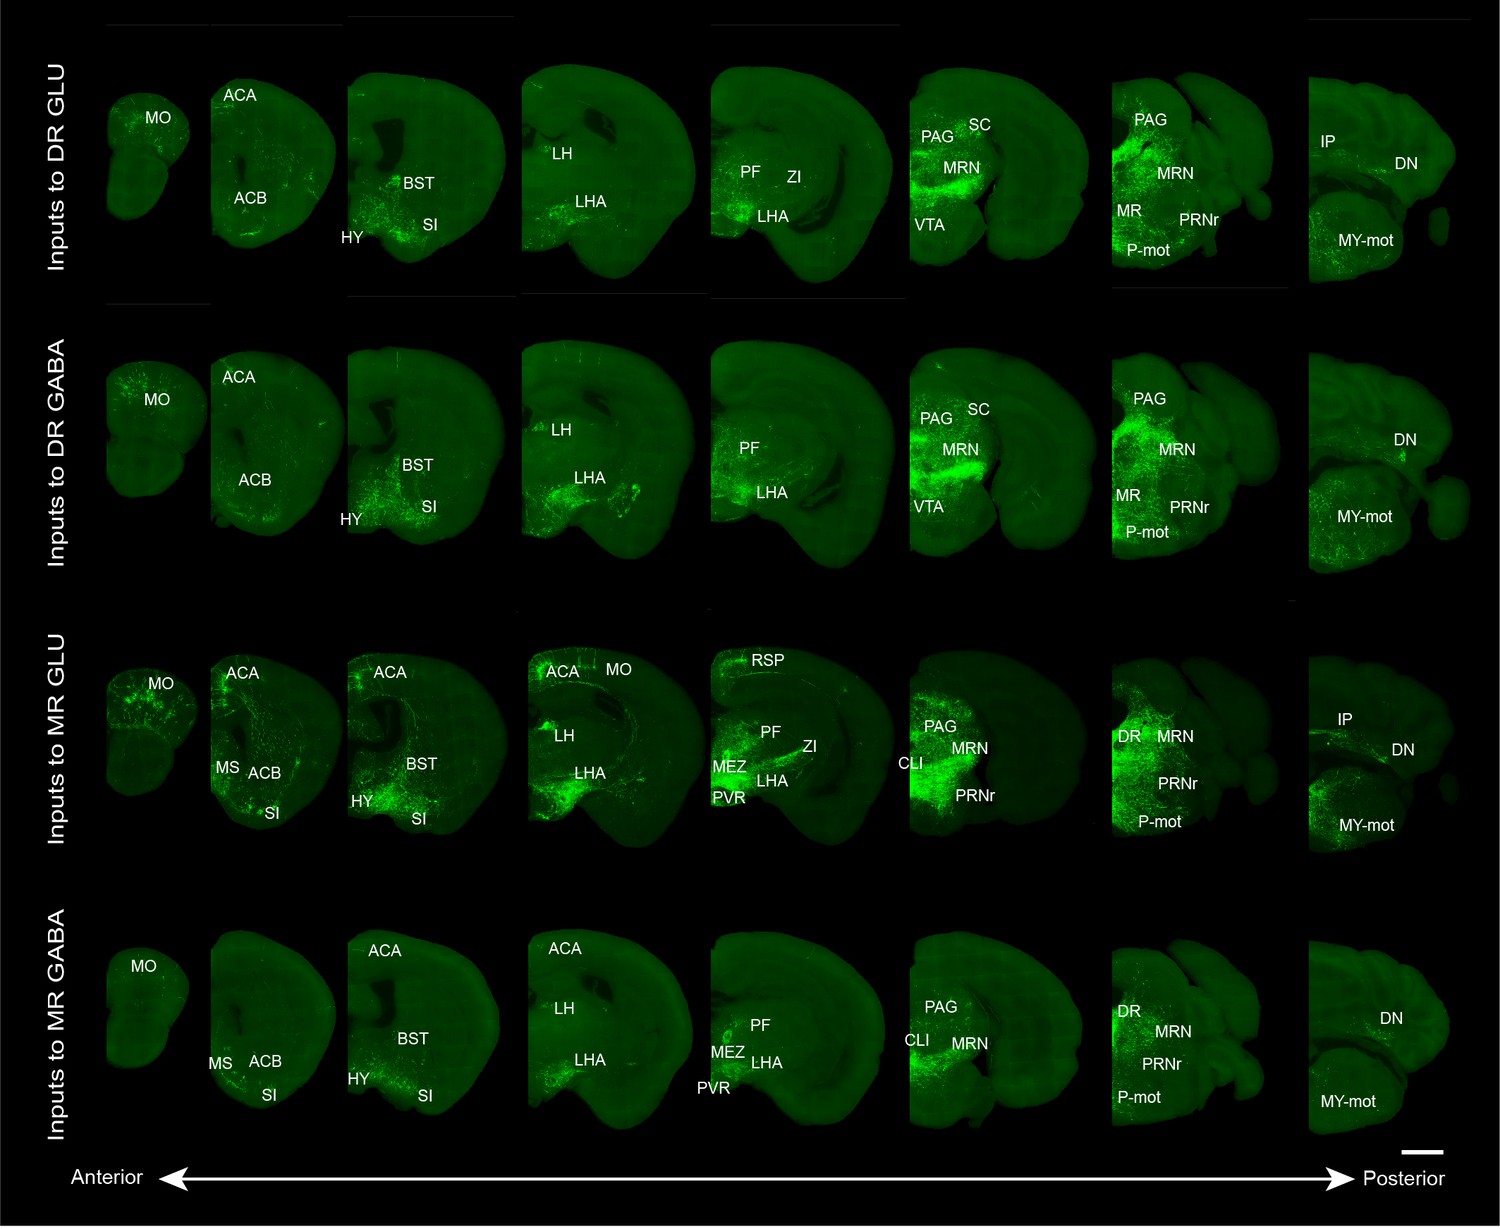
Representative images showing whole-brain inputs to the glutamatergic and GABAergic neurons in the DR and MR.
The images are from maximum intensity projections of the coronal sections of representative samples. The projections were 50 μm thick. Scale bar, 1 mm. The details of abbreviations for brain regions see Supplementary file 1.
Figure 2 with 1 supplement
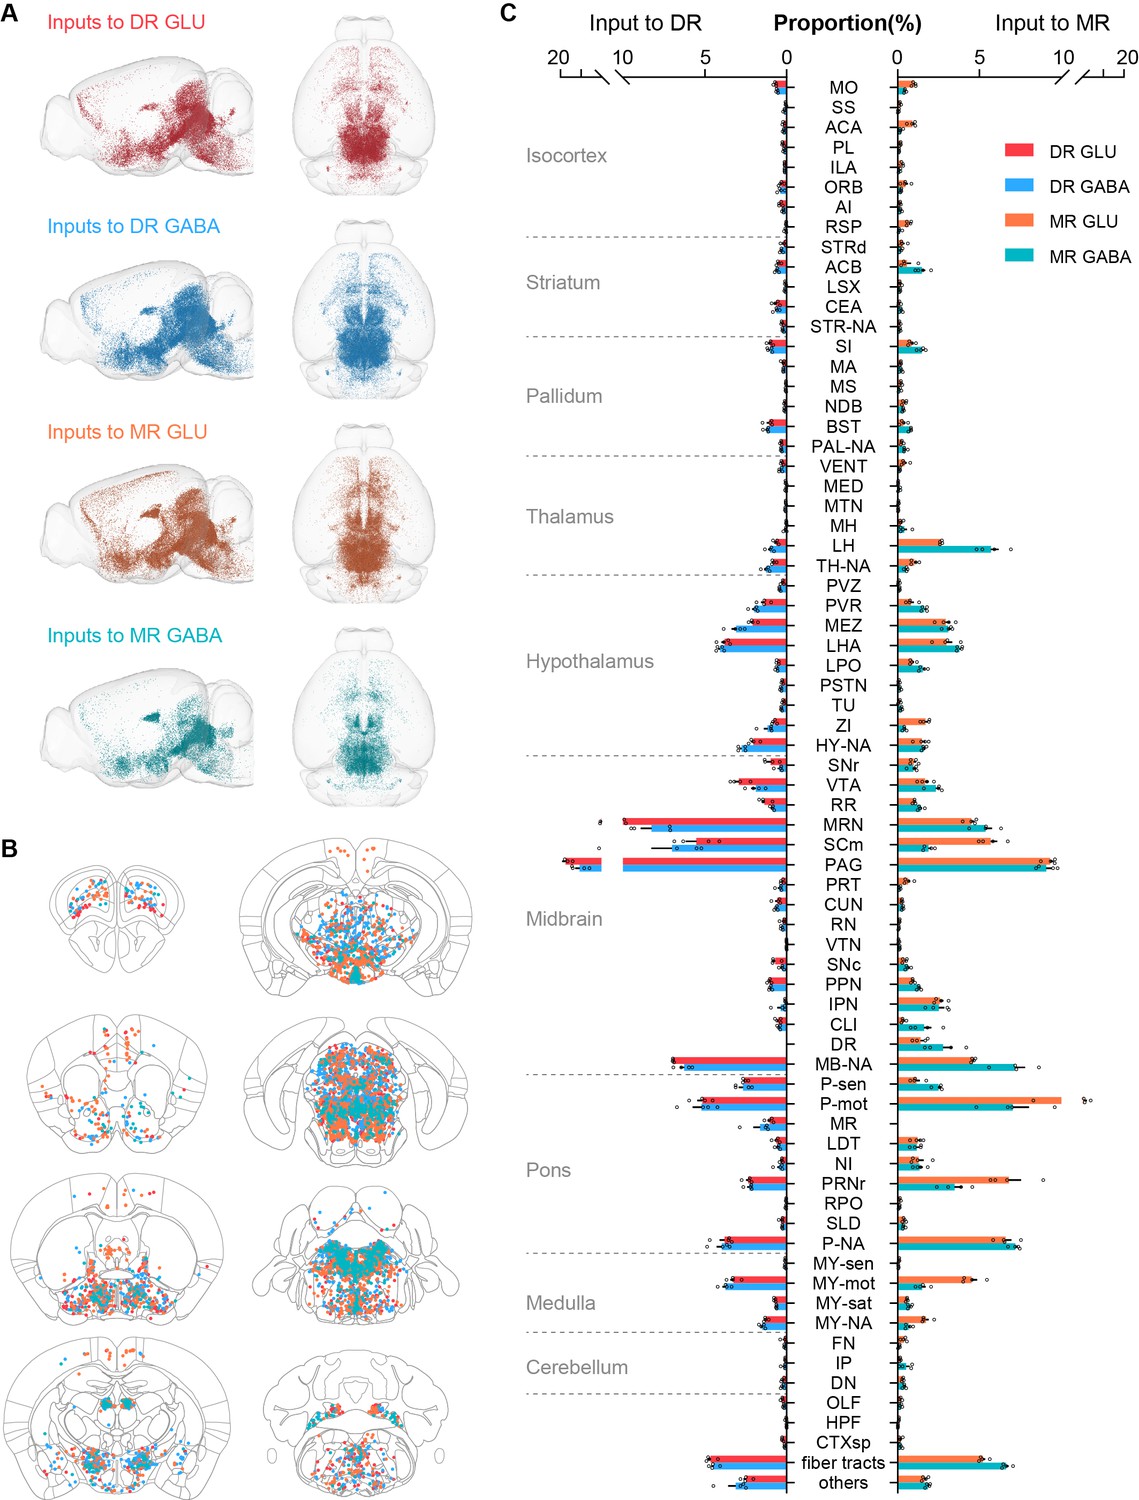
Whole-brain distribution of input neurons to glutamatergic and GABAergic neurons in the DR and MR.
(A) Three-dimensional visualization of whole-brain inputs to glutamatergic neurons (GLU) and GABAergic neurons (GABA) in the DR and MR in representative samples. (B) Representative coronal sections illustrating the detected and registered input neurons. One dot represents one input neuron while different colors reflect inputs to different neuron types as in (A). Each section is 50 μm thick. (C) Proportion of the input neurons to glutamatergic and GABAergic neurons in the DR and MR across individual brain regions. Data are shown as mean ± s.e.m., n = 4 per group. The source data see Supplementary file 2. The details of abbreviations for brain regions see Supplementary file 1. The abbreviation NA indicates the non-annotated area in Allen CCFv3.
Figure 2—figure supplement 1
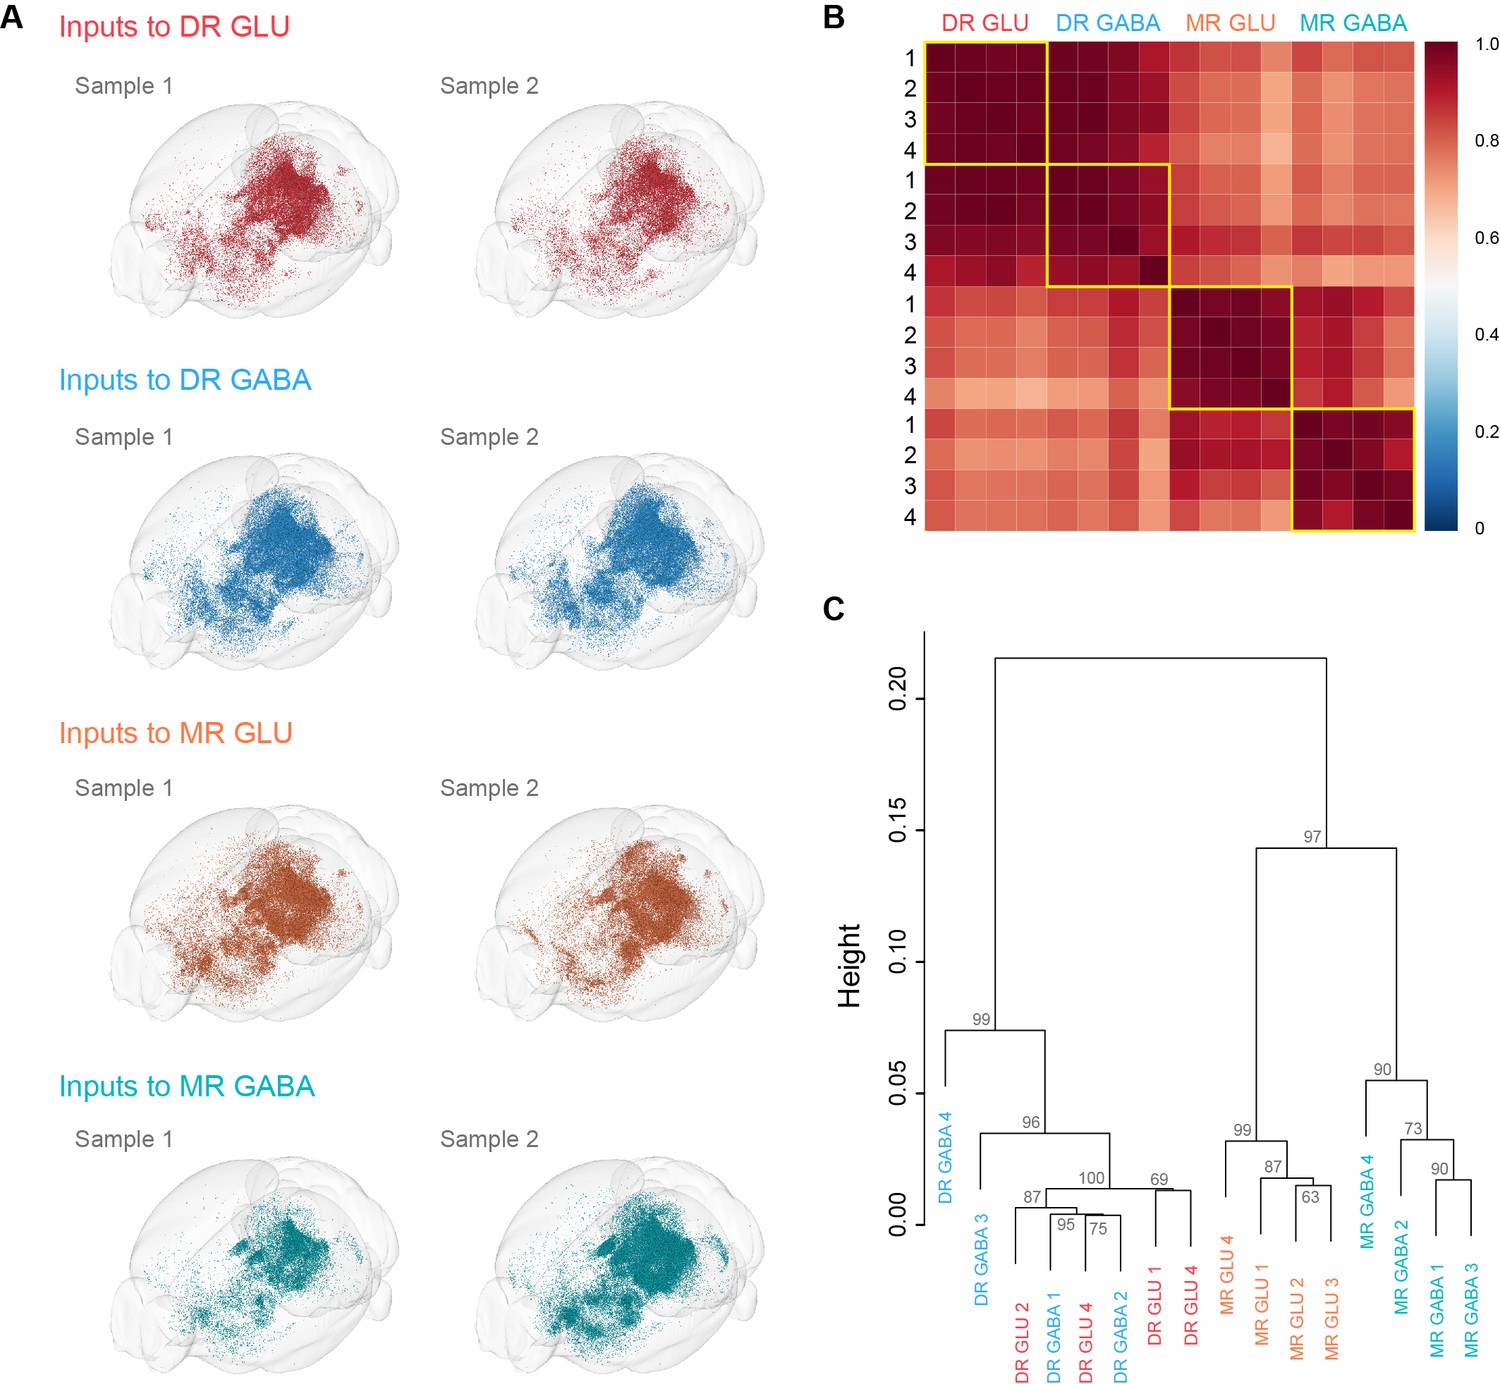
Visualization and comparison of whole-brain inputs across samples.
(A) Visualization of whole-brain inputs to glutamatergic and GABAergic neurons in the DR and MR. The results of two individual samples of the same neuron group demonstrate the reliability of input patterns. (B) Pearson’s correlation coefficients matrix of quantitative whole-brain inputs across individual samples. (C) Hierarchical clustering and bootstrapping based on the quantified whole-brain inputs. The approximately unbiased value shown for each branch indicates the confidence that the cluster is supported by the data.
Figure 3
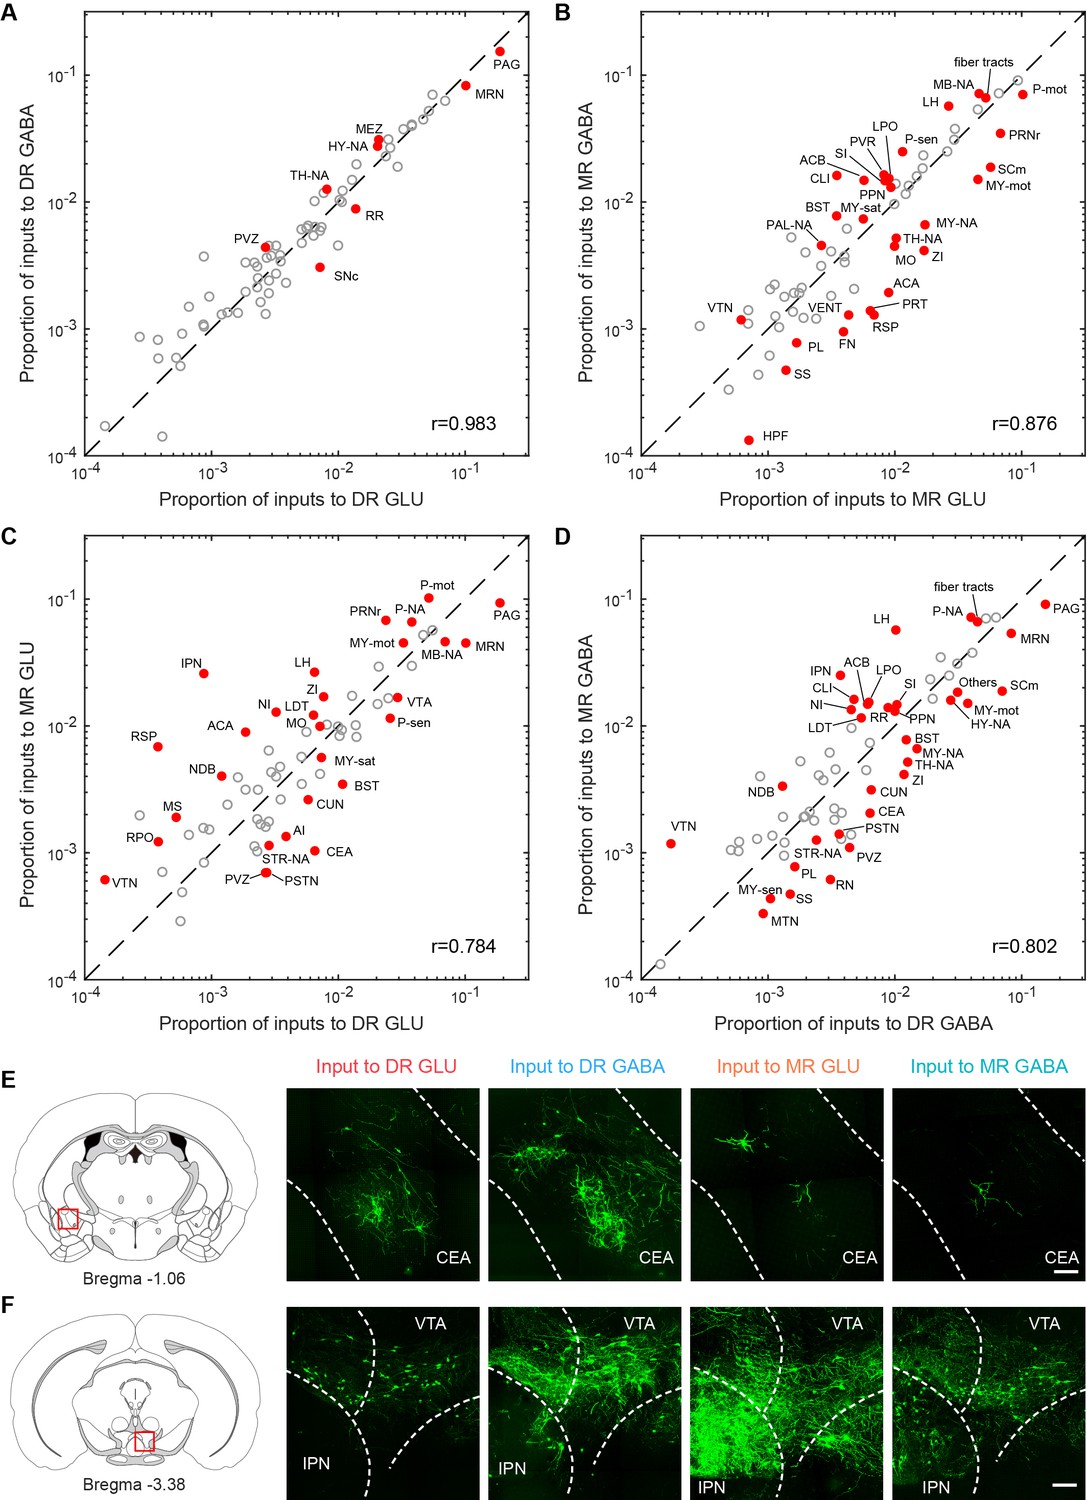
Comparisons of inputs to glutamatergic and GABAergic neurons in the DR and MR.
(A) Comparison between inputs to the glutamatergic and GABAergic neurons in the DR. (B) Comparison between inputs to the glutamatergic and GABAergic neurons in the MR. (C) Comparison between inputs to the glutamatergic neurons in the DR and MR. (D) Comparison between inputs to the GABAergic neurons in the DR and MR. The circles represent the proportion of input neurons in each brain region, where red and solid circles indicate significant differences (p < 0.05, One-way ANOVA followed by multiple comparisons with Tukey’s test). The p-values see Supplementary file 2. r: Pearson’s correlation coefficients. The details of abbreviations for brain regions see Supplementary file 1. (E) Comparison of input neurons in the CEA. Left: position of the images on the right. Right: RV-GFP-labeled input neurons in the CEA. Representative images are from maximum intensity projections of the coronal sections. The projections were 50 μm thick. Scale bar, 100 μm. (F) Comparison of input neurons in the IPN. Left: position of the images on the right. Right: RV-GFP-labeled input neurons in the IPN. Representative images are from maximum intensity projections of the coronal sections. The projections were 50 μm thick. Scale bar, 100 μm.
Figure 4 with 3 supplements
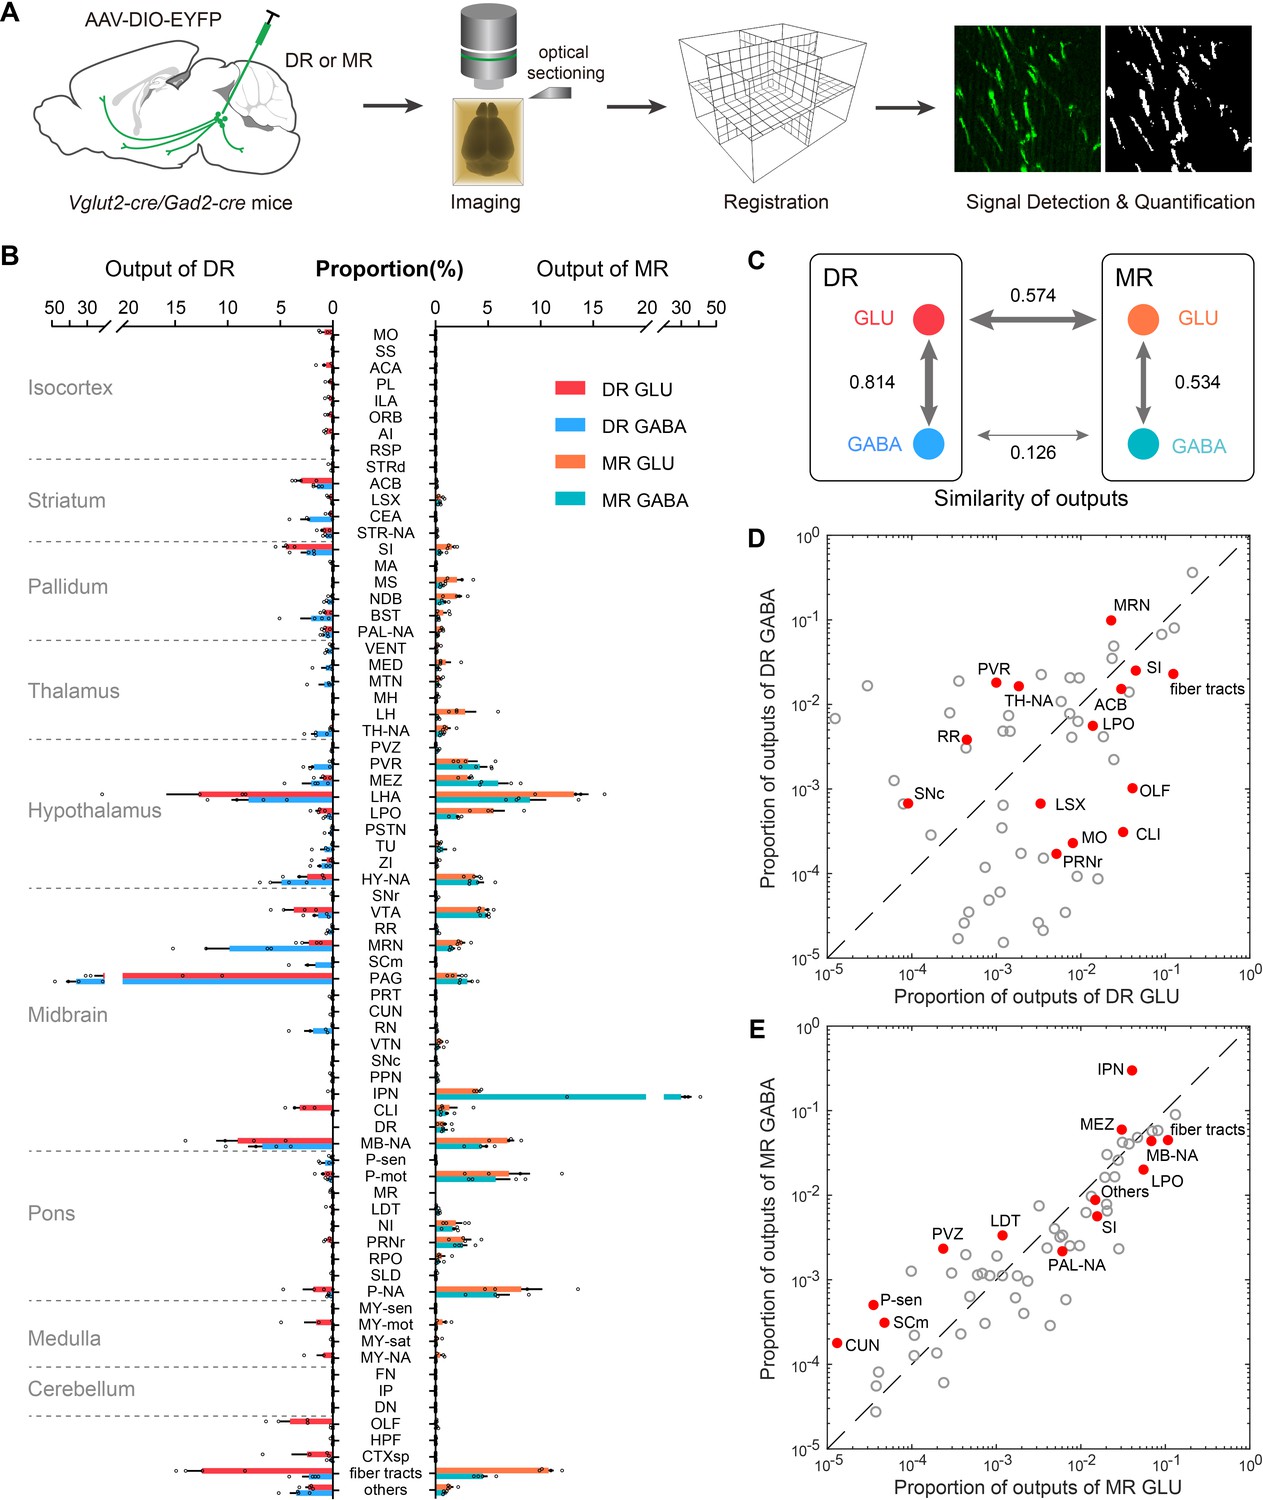
Whole-brain outputs of glutamatergic and GABAergic neurons in the DR and MR.
(A) Schematic outlining viral tracing, whole-brain imaging, data processing and analysis. (B) Proportion of the outputs of glutamatergic and GABAergic neurons in the DR and MR across individual brain regions. Data are shown as mean ± s.e.m., n = 4 per group. The source data see Supplementary file 3. (C) Similarities of whole-brain output patterns. The numbers indicate Pearson’s correlation coefficients. The arrow thickness indicates the magnitude of similarity. (D) Comparison between outputs of glutamatergic and GABAergic neurons in the DR. (E) Comparison between outputs of glutamatergic and GABAergic neurons in the MR. The circles represent the proportion of outputs in each target brain region, where red and solid circles indicate significant differences (p < 0.05, one-way ANOVA). The p-values see Supplementary file 3. The details of abbreviations for brain regions see Supplementary file 1.
Figure 4—figure supplement 1
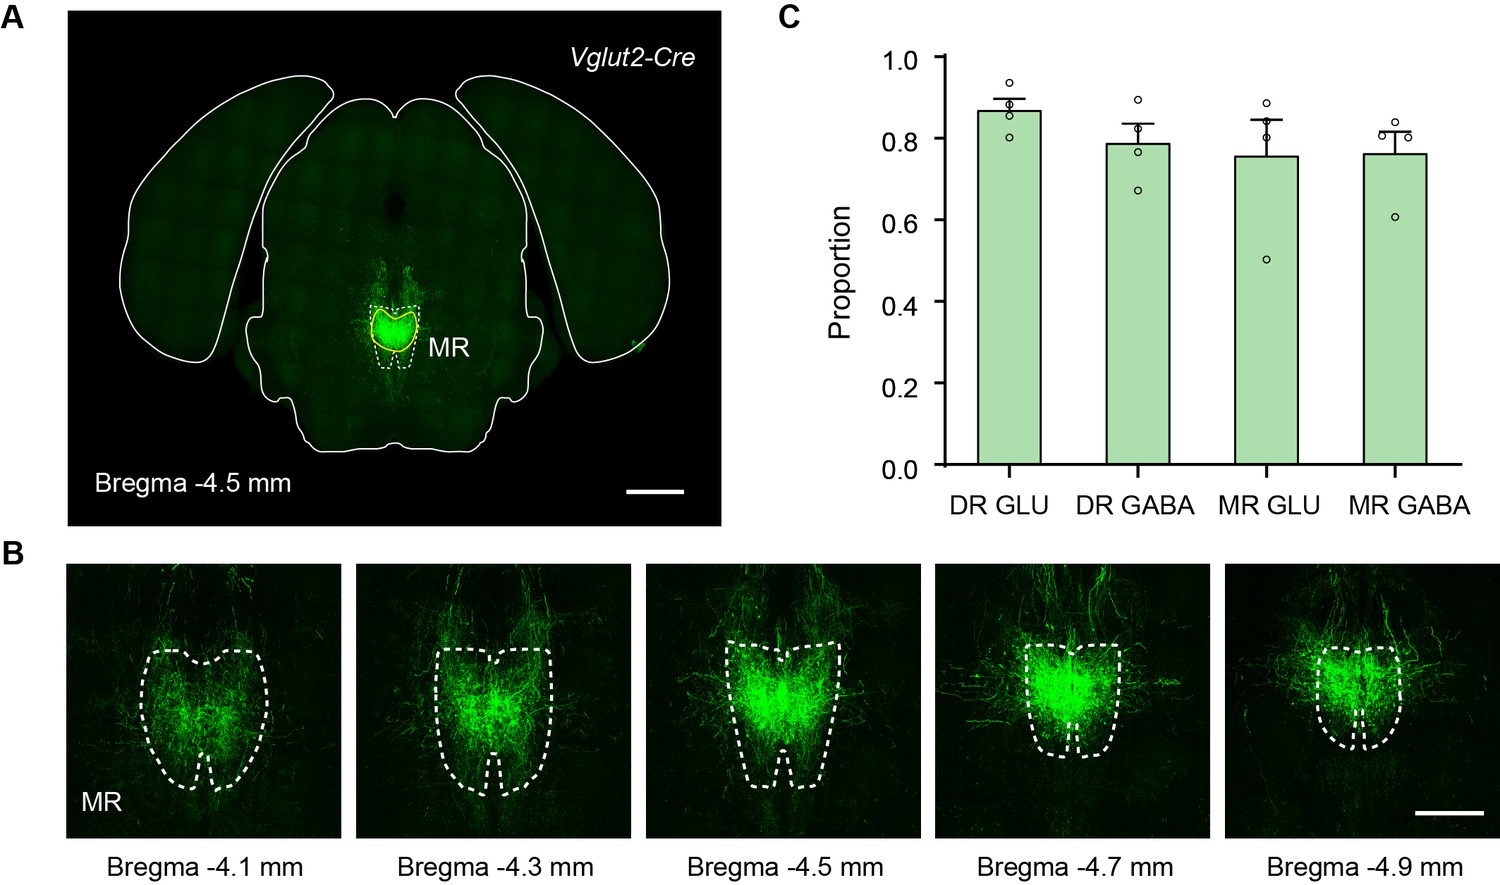
Validation of the injection sites of whole-brain outputs.
(A) Representative coronal section of the injection site of a representative sample that label the outputs of MR Vglut2+ neurons. The dataset has been registered to the Allen CCFv3. White dotted lines, MR in the Allen CCFv3; Yellow lines, segmented injection site. (B) Representative coronal sections of the injection site of the representative sample in (A). (C) Proportion of signal of the injection site in the DR/MR. Data are shown as mean ± s.e.m., n = 4 per group. Scale bars, A, 1 mm; B, 500 μm.
Figure 4—figure supplement 2
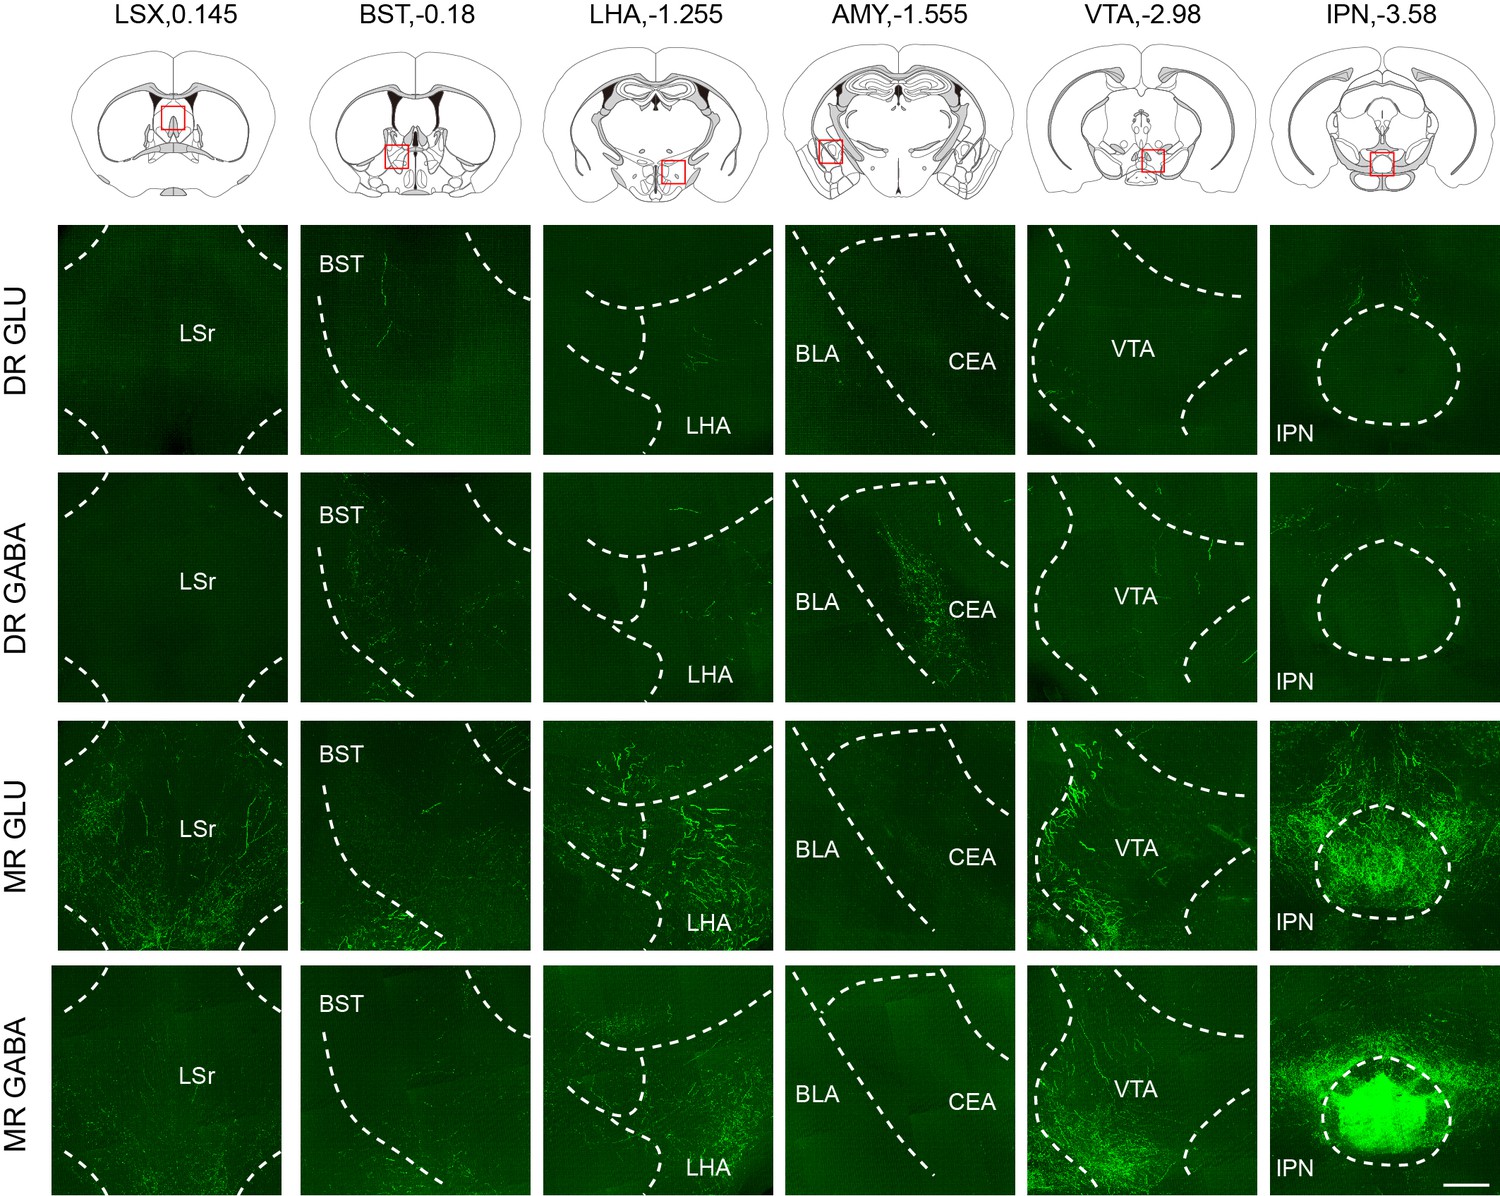
Representative images showing projections from glutamatergic and GABAergic neurons in the DR and MR.
The images are from maximum intensity projections of the coronal sections of representative samples. The projections were 100 μm thick. Scale bar, 200 μm. LSX, lateral septal complex; BST, bed nuclei of the stria terminalis; LHA, lateral hypothalamic area; CEA, central amygdalar nucleus; BLA, basolateral amygdalar nucleus; VTA, ventral tegmental area; IPN, interpeduncular nucleus.
Figure 4—figure supplement 3
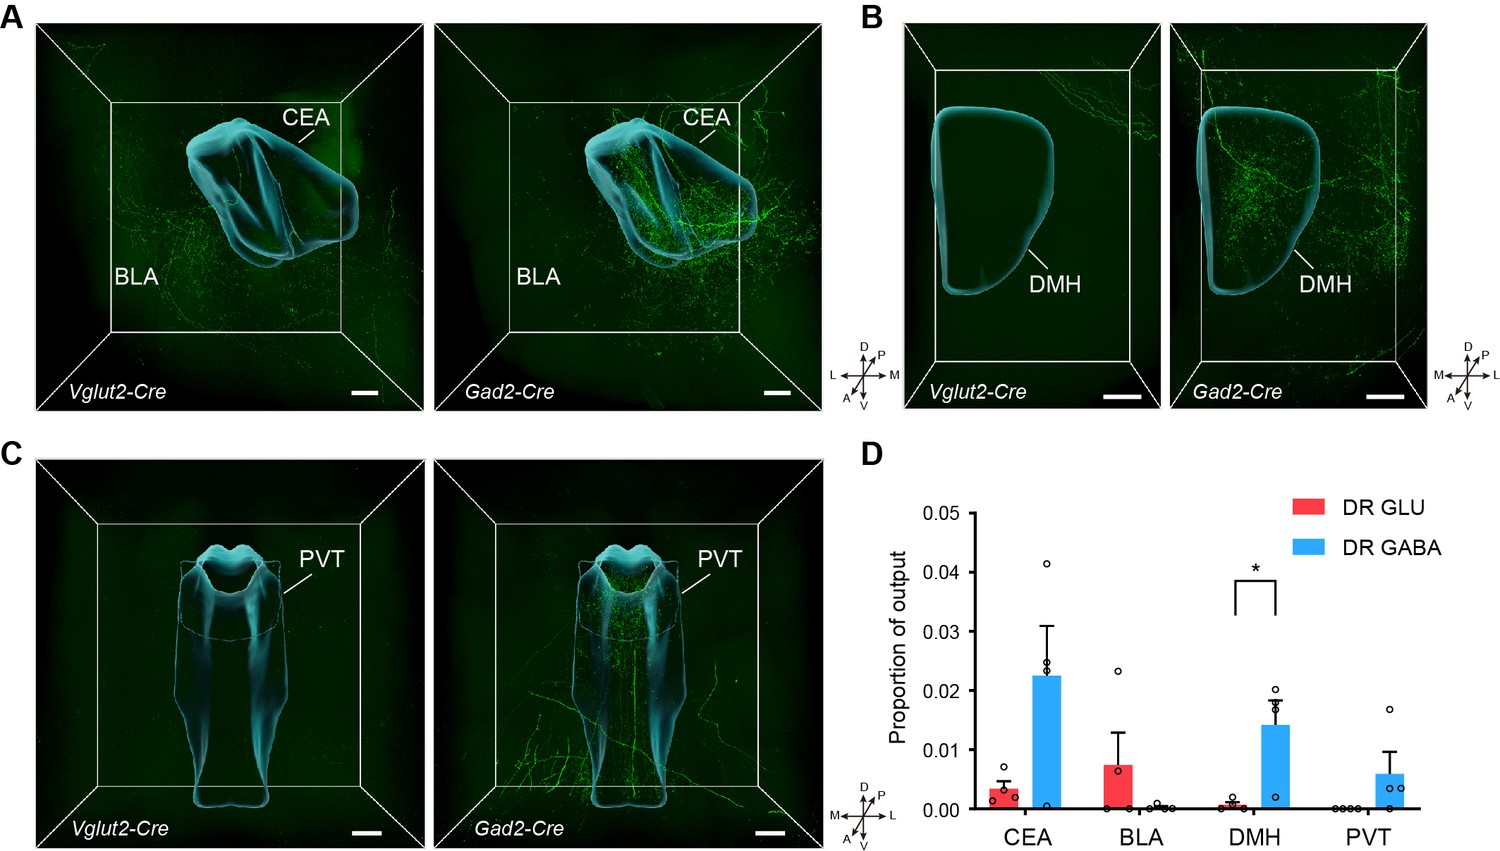
Comparison of outputs from glutamatergic and GABAergic neurons in the DR.
(A) Three-dimensional rendering of projections in the amygdala from glutamatergic and GABAergic neurons in the DR. Scale bar, 200 μm. (B) Three-dimensional rendering of projections in the DMH from glutamatergic and GABAergic neurons in the DR. Scale bar, 200 μm. (C) Three-dimensional rendering of projections in the PVT from glutamatergic and GABAergic neurons in the DR. Scale bar, 200 μm. (D) Quantification and comparison of the proportion of outputs in the target area. One-way ANOVA, *P < 0.05. Data are shown as mean ± s.e.m., n = 4 per group. A, anterior; P, posterior; M, medial; L, lateral; D, dorsal; V, ventral. CEA, central amygdalar nucleus; BLA, basolateral amygdalar nucleus; DMH, dorsomedial nucleus of the hypothalamus; PVT, Paraventricular nucleus of the thalamus.
Figure 5 with 1 supplement
Habenula-raphe circuit.
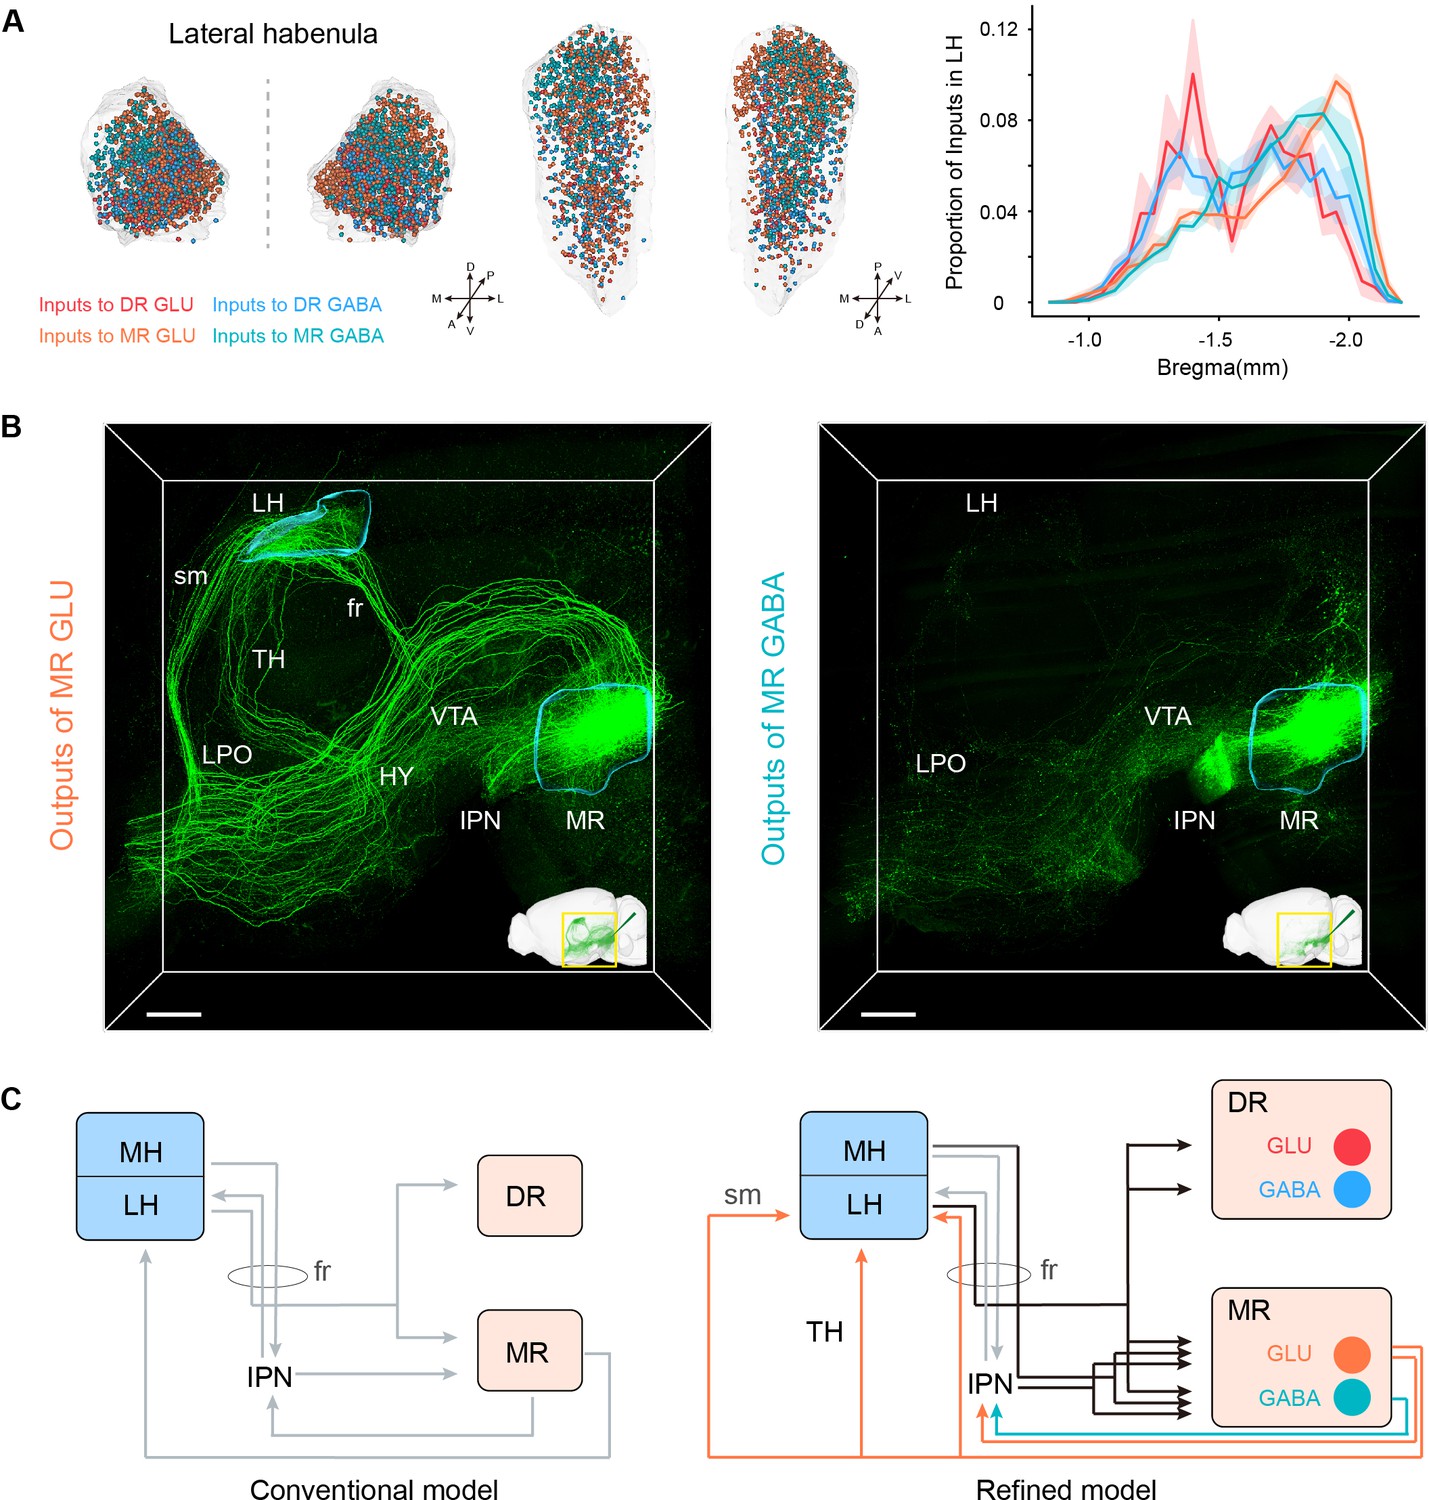
(A) Comparison of inputs in the LH to glutamatergic and GABAergic neurons in the DR and MR. Left and middle Coronal view and horizonal view of three-dimensional rendering of input neurons in the LH from representative samples. One dot represents one input neuron while different colors reflect inputs to different neuron types. Right, density plot of input neurons in the LH along the anterior-posterior axis. Bin width, 50 μm. The shaded area indicates s.e.m., n = 4. (B) Representative projections of MR glutamatergic and GABAergic neurons. The image is a perspective view of three-dimensional rending of projections in the region of interest shown in the bottom right corner. The image in the bottom right corner is three-dimensional rending of projections in the left hemisphere. The rendered data were registered to Allen CCFv3. Scale bar, 500 μm. (C) A refined model of the habenula-raphe circuit based on connections with glutamatergic and GABAergic neurons in the DR and MR. The conventional model is from previous studies (Hikosaka, 2010; Hu et al., 2020). In the refined model, the inputs identified in this study are shown in black, and the outputs of MR glutamatergic and GABAergic neurons are shown in orange and turquoise, respectively; moreover, the known circuits are shown in gray. TH, thalamus; HY, hypothalamus; sm, stria medullaris; fr, fasciculus retroflexus.
Figure 5—figure supplement 1
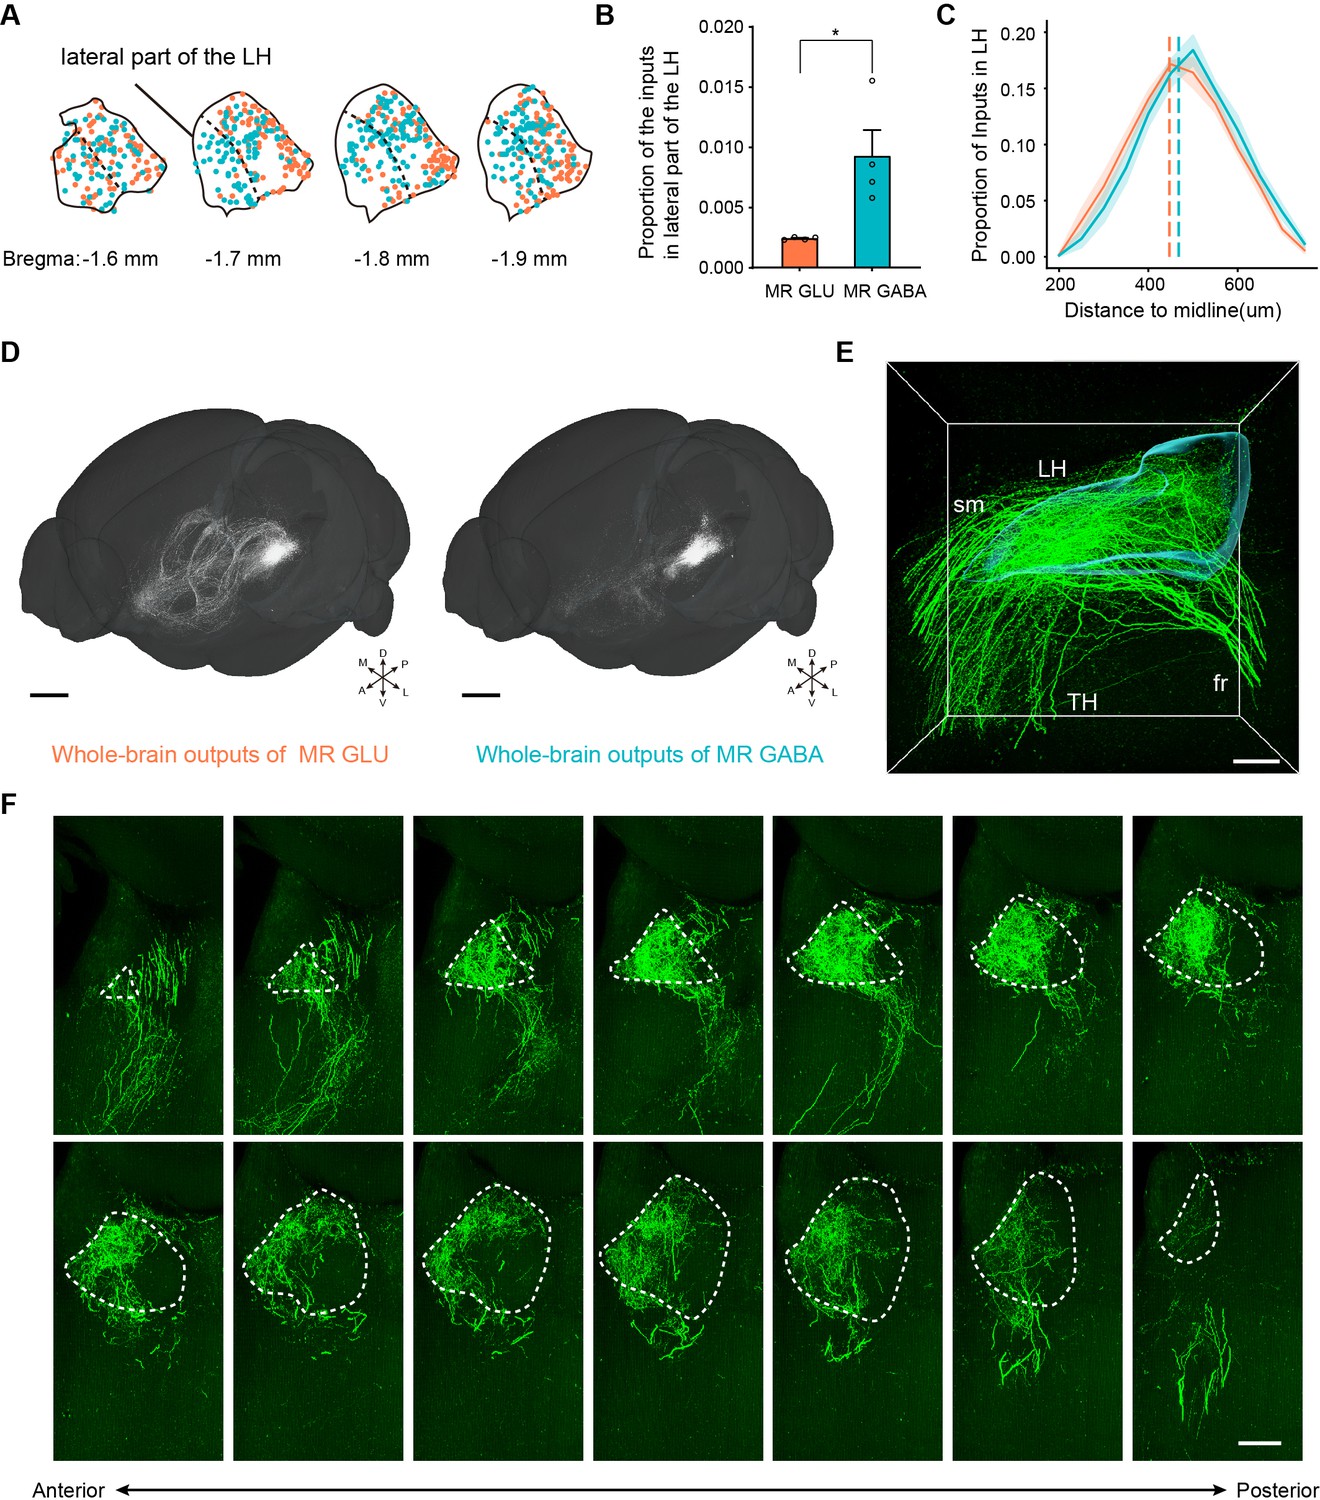
Representative inputs and outputs of glutamatergic and GABAergic neurons in the MR.
(A) Input neurons of MR glutamatergic and GABAergic neurons in the LH in representative samples. One dot represents one input neuron. (B) Quantification and comparison of the inputs to MR glutamatergic and GABAergic neurons in the lateral part of the LH. One-way ANOVA, *p < 0.05. Data are shown as mean ± s.e.m., n = 4 per group. (C) Density plot of input neurons in the LH to MR glutamatergic and GABAergic neurons along the medial–lateral axis. Bin width, 50 μm. The shaded area indicates s.e.m., n = 4. The dashed line denotes the median distance to midline for each population (D) Whole-brain outputs of glutamatergic and GABAergic neurons in the MR of representative samples. Scale bar, 1 mm. (E) Enlarged view of three -dimensional rendering of projections in the LH (left hemisphere) from MR glutamatergic neurons. Scale bar, 200 μm. (F) Images showing the projections in the LH (left hemisphere) from MR glutamatergic neurons. The images are from maximum intensity projections of the coronal sections of a representative sample. The projections were 100 μm thick. Scale bar, 200 μm. A, anterior; P, posterior; M, medial; L, lateral; D, dorsal; V, ventral.
Figure 6 with 1 supplement
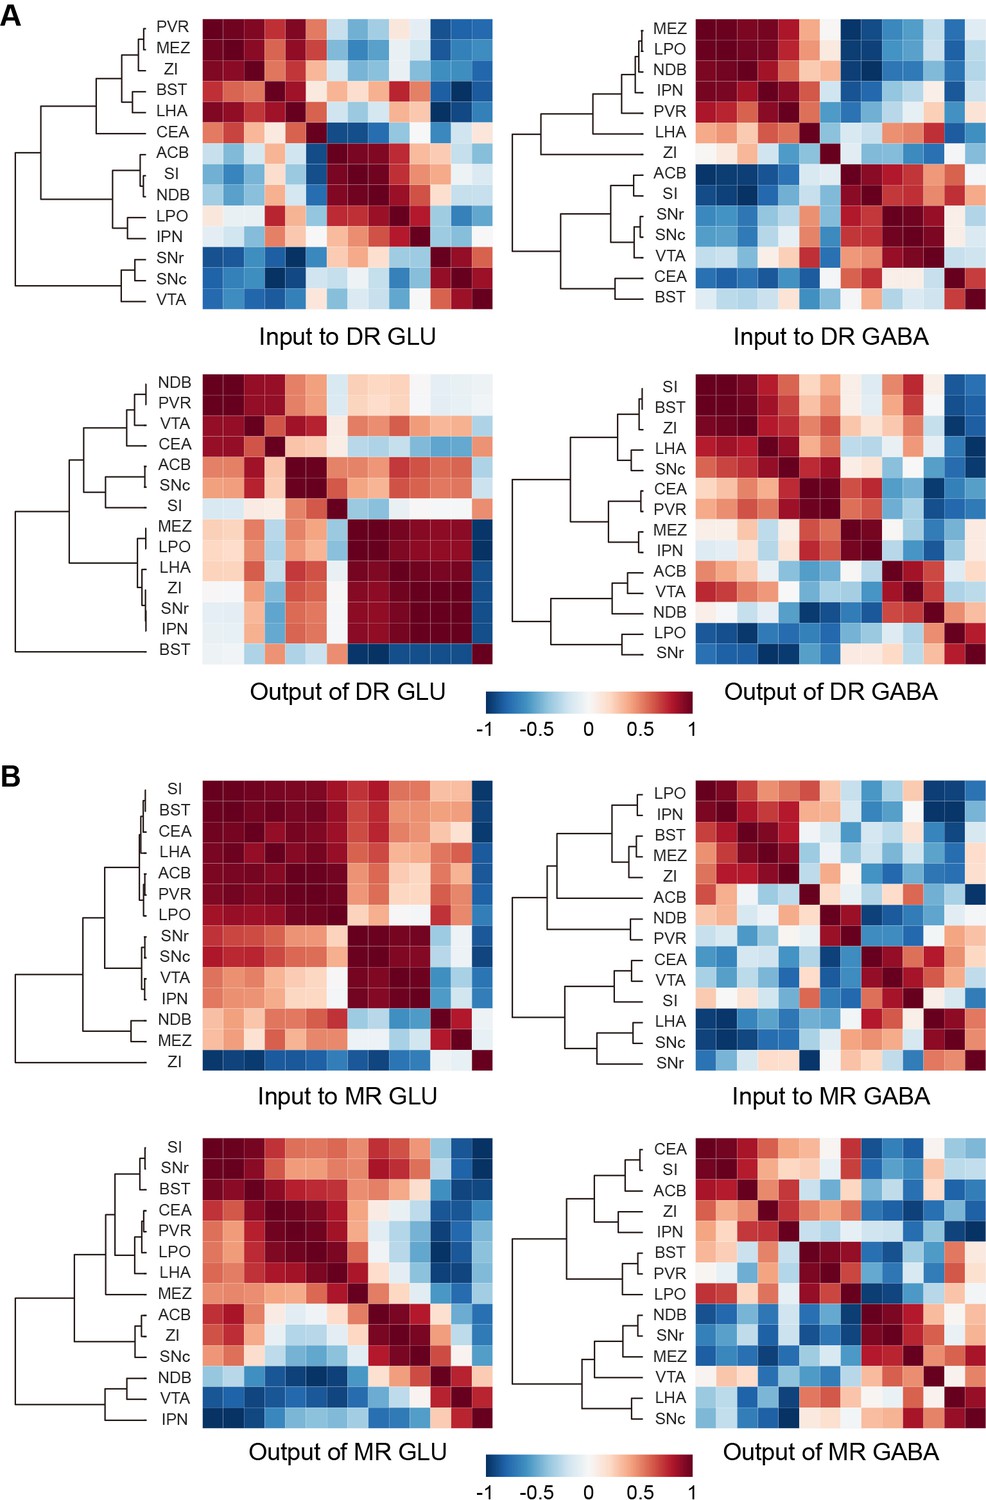
Connectivity patterns of glutamatergic and GABAergic neurons in the DR and MR.
(A) Correlation and hierarchical cluster analysis showing the similarities and variances in brain regions connected with DR glutamatergic and GABAergic neurons. The heatmap represents Pearson’s correlation coefficient matrix. (B) Correlation and hierarchical cluster analysis showing the similarities and variances in brain regions connected with MR glutamatergic and GABAergic neurons. The heatmap represents Pearson’s correlation coefficient matrix. The details of abbreviations for brain regions see Supplementary file 1.
Figure 6—figure supplement 1
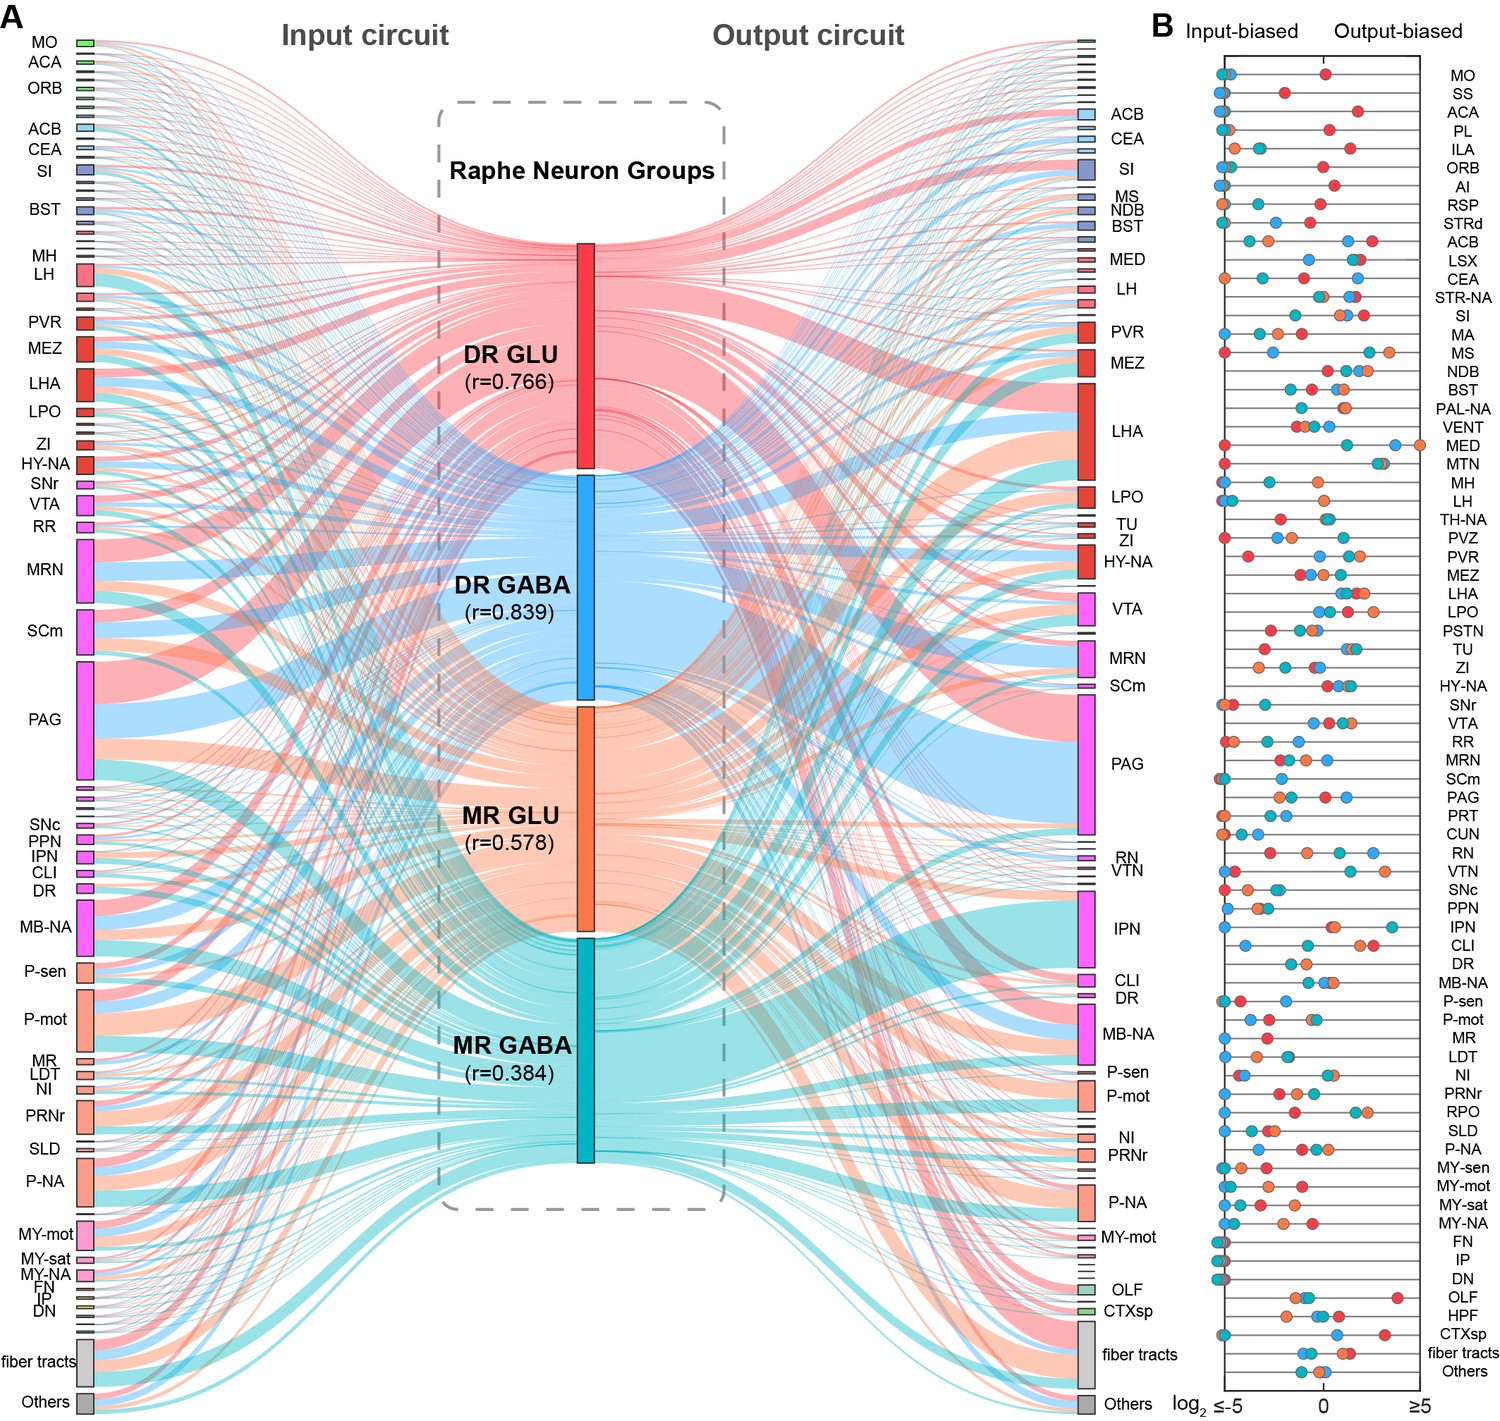
Connectivity pattern of whole-brain inputs and outputs of glutamatergic and GABAergic neurons in DR and MR.
(A) Schematic of whole-brain inputs and outputs of glutamatergic and GABAergic neurons in the DR and MR. The line width reflects proportion. The colors reflect the neurons types. DR glutamatergic and GABAergic neurons and their connections are respectively reflected by red and blue. MR glutamatergic and GABAergic neurons and their connections are respectively reflected by orange and turquoise. r: Pearson’s correlation coefficients reflecting the similarity of whole-brain inputs and outputs of the same neuron group. (B) Reciprocity between whole-brain inputs and outputs of glutamatergic and GABAergic neurons in the DR and MR. The scatter represents the ratio of output to input across brain regions, where colors reflect the neuron types as in (A). The details of abbreviations for brain regions see Supplementary file 1.
Figure 7
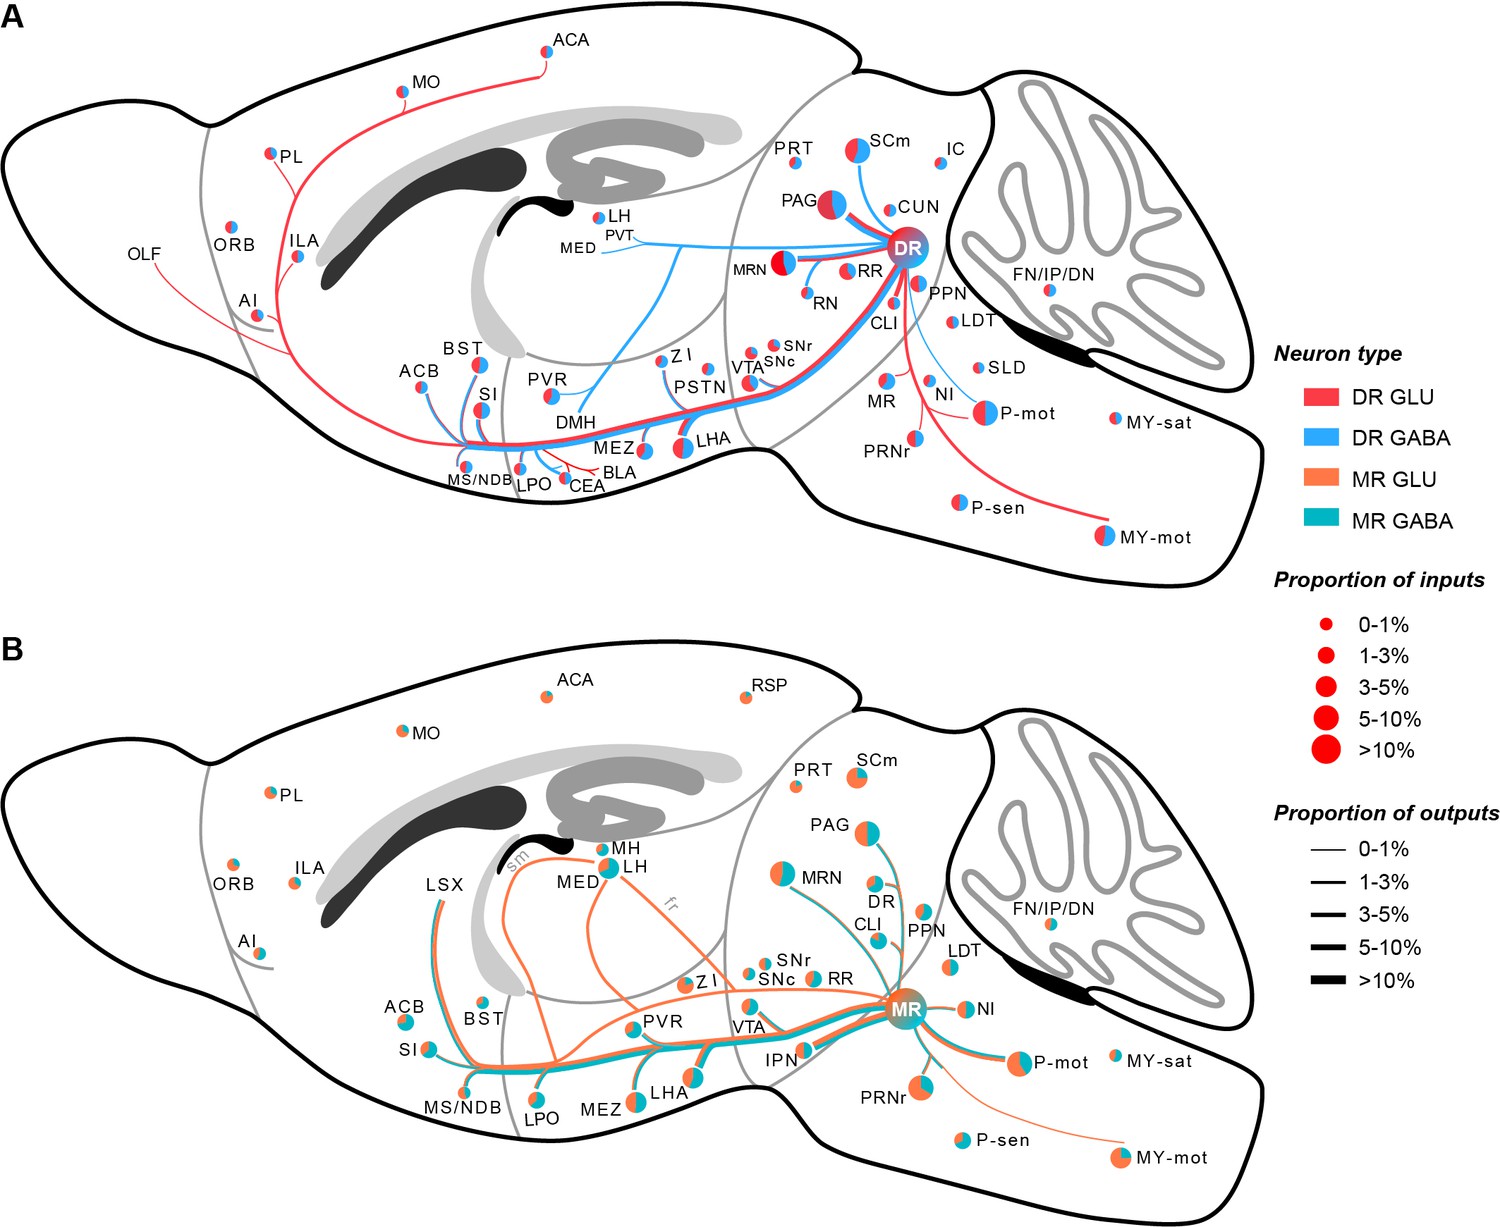
Whole-brain schematic of the inputs and outputs of glutamatergic and GABAergic neurons in the DR and MR.
(A) Whole-brain schematic of the inputs and outputs of glutamatergic and GABAergic neurons in the DR. (B) Whole-brain schematic of the inputs and outputs of glutamatergic and GABAergic neurons in the MR. The pie charts represent the inputs in each brain region, where colors reflect the postsynaptic neuron types, and the size reflects the proportion value. The lines represent outputs in each brain region, where colors reflect the neuron types, and the line thickness reflects the proportion value. The details of abbreviations for brain regions see Supplementary file 1.
Tables
Key resources table
| Reagent type (species) or resource | Designation | Source or reference | Identifiers | Additional information |
|---|---|---|---|---|
| Antibody | Anti-Vglut3(Rabbit polyclonal) | Thermo Fisher Scientific | RRID: AB_2736782 | (1:200) |
| Antibody | Anti-rabbit Alexa Fluor 594 (Donkey polyclonal) | Invitrogen | RRID:AB_141637 | (1:500) |
| Genetic reagent (Mus musculus) | Vglut2-Cre | The Jackson Laboratory | Cat# JAX:016963, RRID:IMSR_JAX:016963 | Slc17a6tm2(cre)Lowl/J |
| Genetic reagent (Mus musculus) | Gad2-Cre | The Jackson Laboratory | Cat# JAX:010802,RRID:IMSR_JAX:010802 | Gad2tm2(cre)Zjh/J |
| Recombinant DNA reagent | rAAV2/9-EF1α-DIO-His-TVA-BFP | BrainVTA Co., Ltd. | http://brainvta.tech/html/AAV_services/ | 2 × 10¹² viral genomes/ml |
| Recombinant DNA reagent | rAAV2/9- EF1α-DIO-RG | BrainVTA Co., Ltd. | http://brainvta.tech/html/AAV_services/ | 2 × 10¹² viral genomes/ml |
| Recombinant DNA reagent | RV-ΔG-EnvA-GFP | BrainVTA Co., Ltd. | http://brainvta.tech/plus/list.php?tid=114 | 2 × 10⁸ infectious units/ml |
| Recombinant DNA reagent | AAV-DIO-EYFP | BrainVTA Co., Ltd. | http://brainvta.tech/html/AAV_services/ | 2 × 10¹² viral genomes/ml |
| Software, algorithm | Amira | FEI, Mérignac Cedex, France | RRID:SCR_007353 | |
| Software, algorithm | Imaris | Bitplane, Zurich, Switzerland | RRID:SCR_007370 | |
| Software, algorithm | Fiji | https://imagej.net/Fiji | RRID:SCR_002285 | |
| Software, algorithm | Python 3.6.4 | http://www.python.org | RRID:SCR_008394 | |
| Software, algorithm | R 4.0.3 | R-project | RRID:SCR_001905 | |
| Software, algorithm | Matlab | Mathworks, MA | RRID:SCR_001622 | |
| Software, algorithm | Graphpad Prism | GraphPad, CA | RRID:SCR_002798 |
Additional files
-
Supplementary file 1
Nomenclature and abbreviations of brain regions.
- https://cdn.elifesciences.org/articles/65502/elife-65502-supp1-v2.xlsx
-
Supplementary file 2
Quantification and comparison of whole-brain inputs to glutamatergic and GABAergic neurons in the DR and MR.
- https://cdn.elifesciences.org/articles/65502/elife-65502-supp2-v2.xlsx
-
Supplementary file 3
Quantification and comparison of whole-brain outputs of glutamatergic and GABAergic neurons in the DR and MR.
- https://cdn.elifesciences.org/articles/65502/elife-65502-supp3-v2.xlsx
-
Transparent reporting form
- https://cdn.elifesciences.org/articles/65502/elife-65502-transrepform1-v2.docx
Download links
A two-part list of links to download the article, or parts of the article, in various formats.
Downloads (link to download the article as PDF)
Open citations (links to open the citations from this article in various online reference manager services)
Cite this article (links to download the citations from this article in formats compatible with various reference manager tools)
Whole-brain connectivity atlas of glutamatergic and GABAergic neurons in the mouse dorsal and median raphe nuclei
eLife 10:e65502.
https://doi.org/10.7554/eLife.65502


