Genomic basis for drought resistance in European beech forests threatened by climate change
- Molecular Ecology, Senckenberg Biodiversity and Climate Research Centre, Germany
- Institute for Organismic and Molecular Evolution, Johannes Gutenberg University, Germany
- LOEWE Centre for Translational Biodiversity Genomics, Germany
- Institute of Human Genetics, University Medical Center, Johannes Gutenberg University, Germany
- Conservation Genetics Section, Senckenberg Research Institute and Natural History Museum Frankfurt, Germany
- Ecological Networks lab, Department of Biology, Technische Universität Darmstadt, Germany
- Department of Applied Ecology, Hochschule Geisenheim University, Germany
- Biological Archives, Senckenberg Biodiversity and Climate Research Centre, Germany
- Functional Environmental Genomics, Senckenberg Biodiversity and Climate Research Centre, Germany
- Agricultural Sciences, Nutritional Sciences, and Environmental Management, Universität Giessen, Germany
- Institute for Ecology, Evolution and Diversity, Johann Wolfgang Goethe-University, Germany
Figures
Figure 1 with 2 supplements
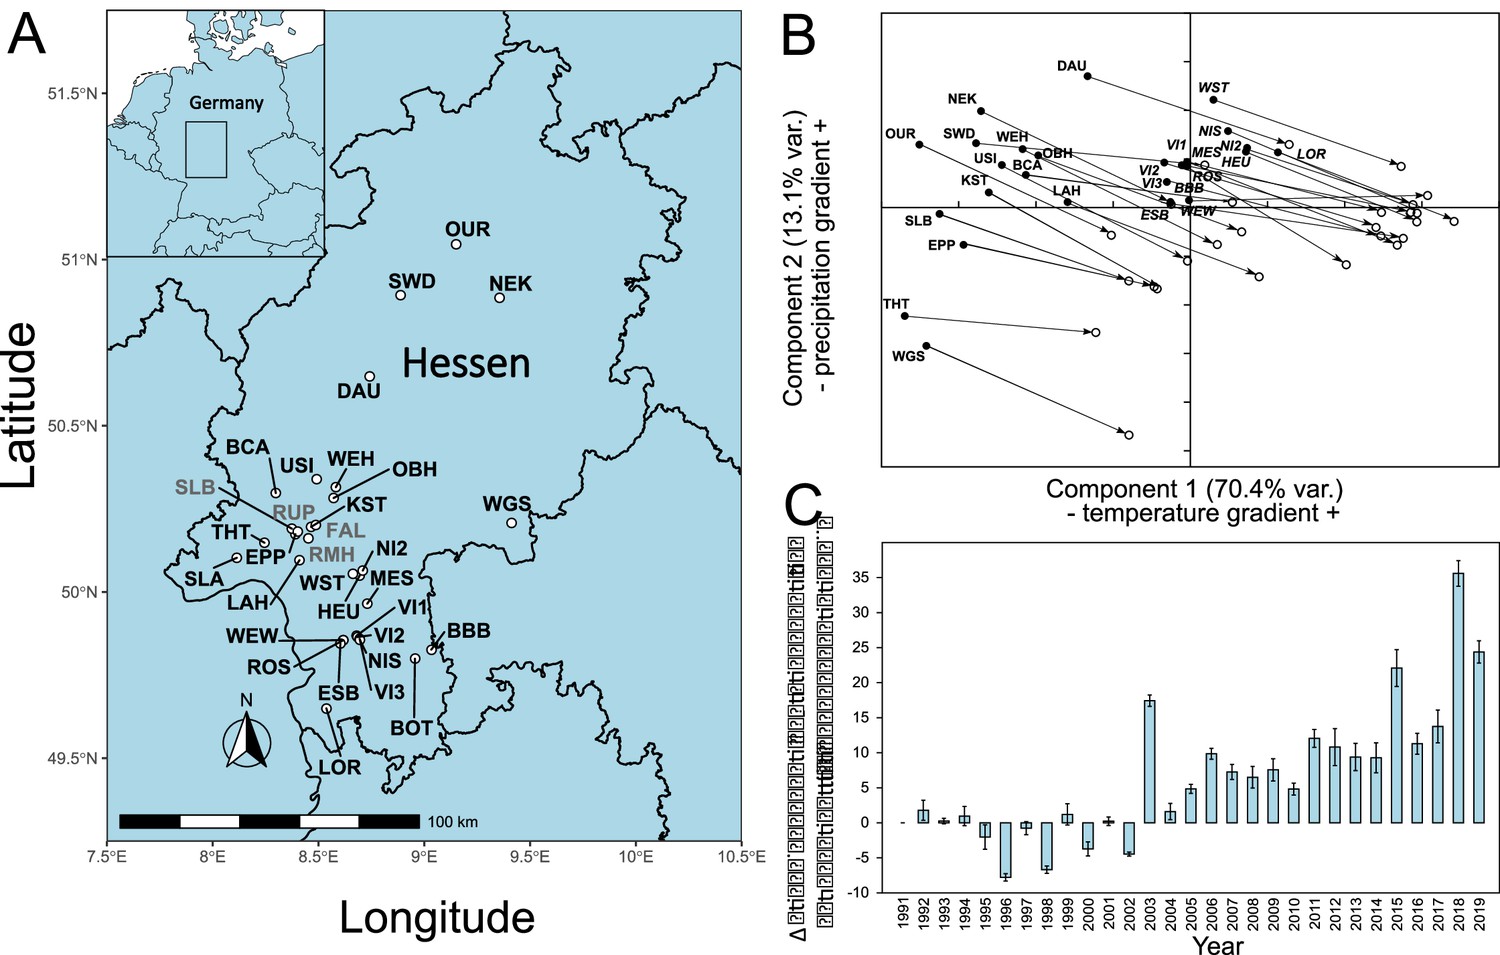
Location of sampling sites and climate history.
(A) Locations of sampling sites in Hessen, Germany. For abbreviations, see Supplementary file 1A. The sites where confirmation individuals were sampled are designated in grey. (B) Principal component analysis of monthly climate data 1950–2019. (C) Development of main growth period drought indicator from 1991 to 2019. Shown is the difference mean monthly evaporation potential in mm from April to September relative to the 1991 level. Climate and drought data obtained from https://opendata.dwd.de/climate_environment/CDC/grids_germany/monthly/.
Figure 1—figure supplement 1
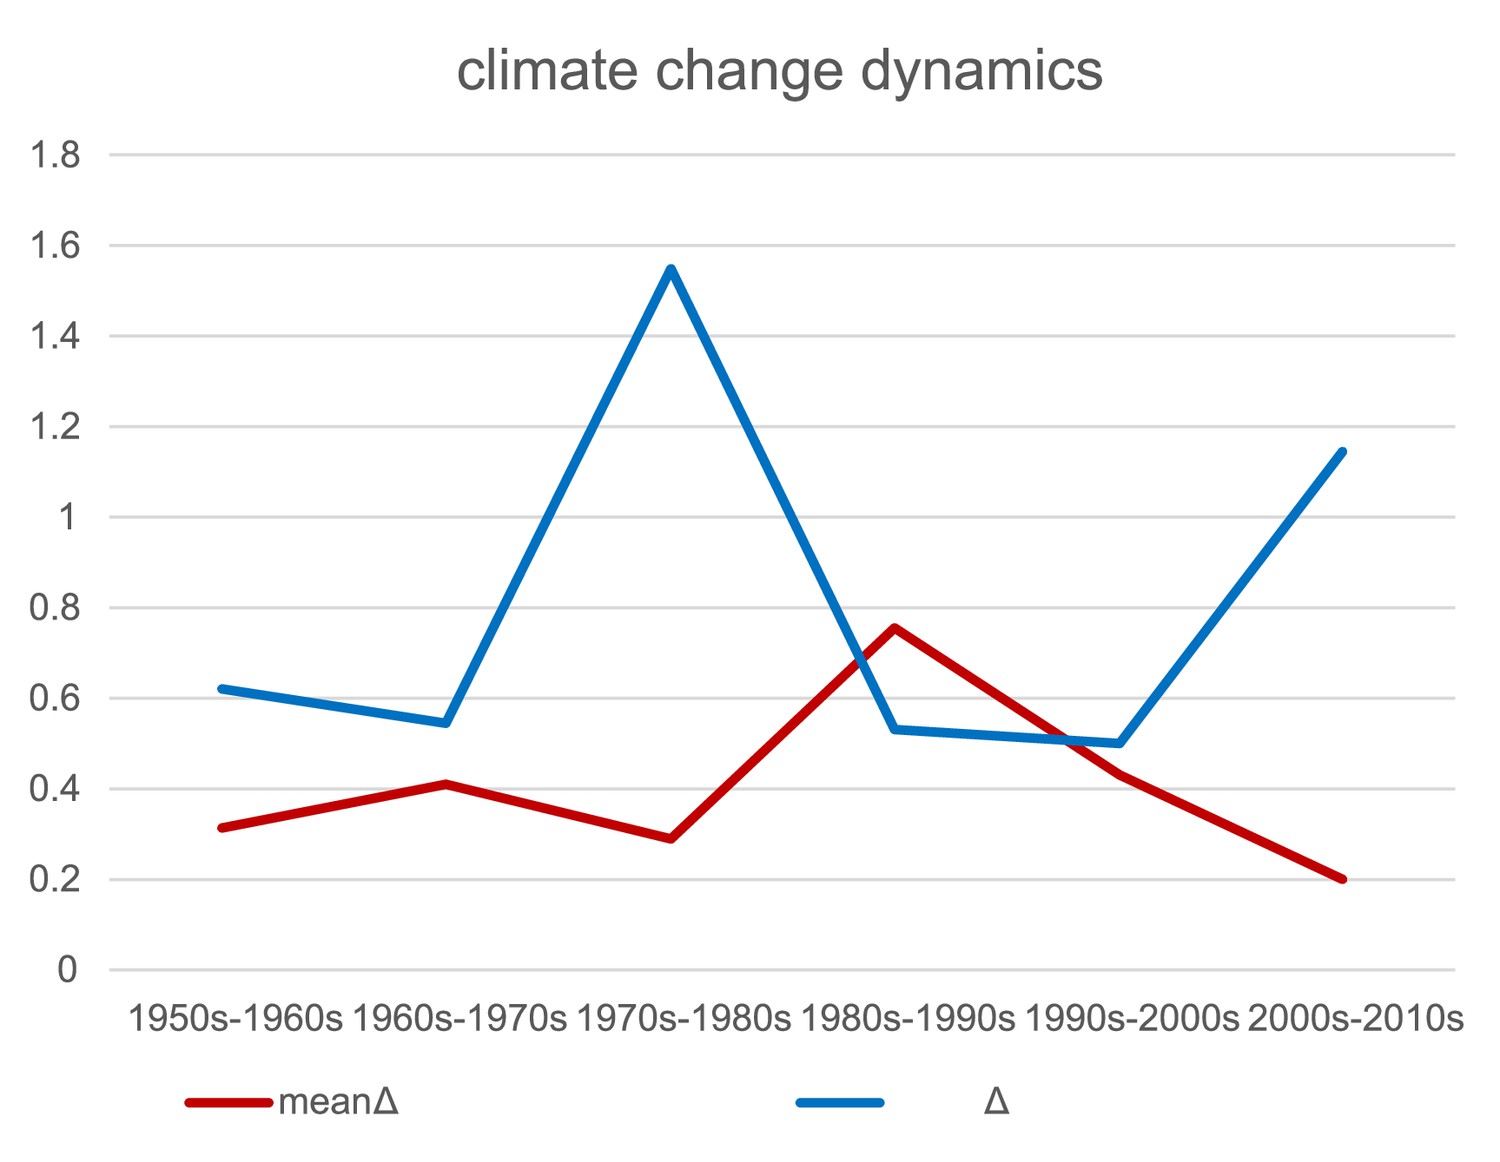
Climate change dynamics.
Mean change of sampling site values along principal component analysis (PCA) axis 1 (temperature, red) and PCA axis 2 (precipitation, blue) among decades.
Figure 1—figure supplement 2
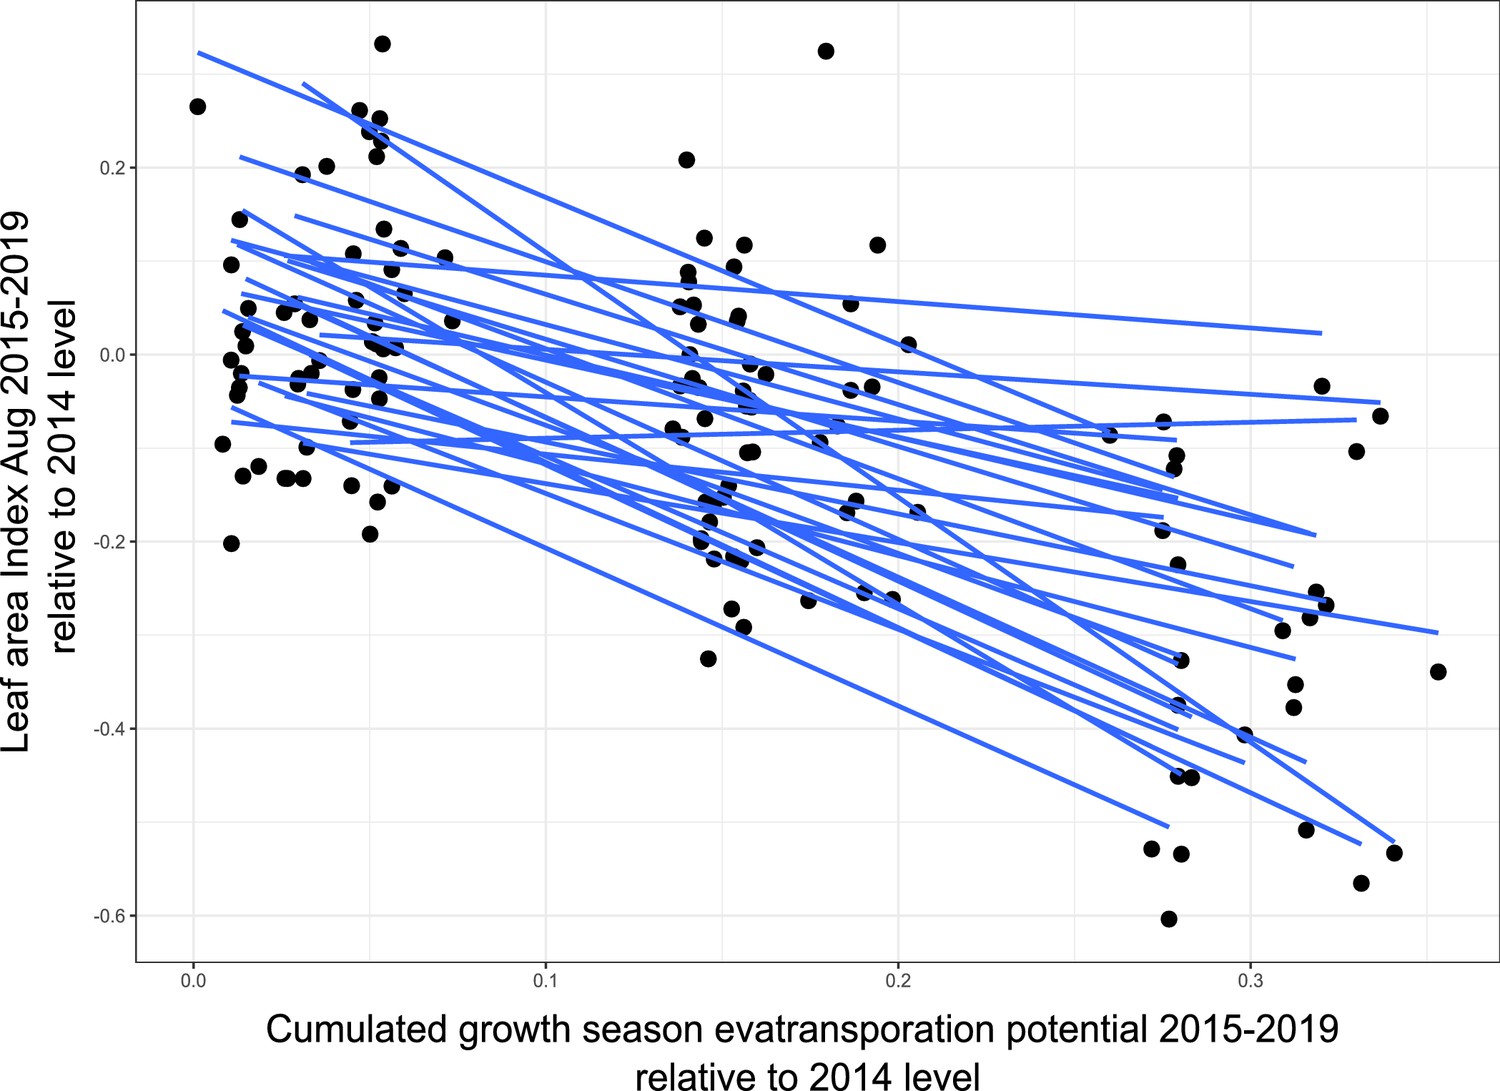
Plot of ‘relative leaf area index’ change relative to 2014 values against ‘cumulated evatransporation potential’ change during the growth season relative to 2014 values for all 1 × 1 km plots encompassing the 27 sampling sites.
The overall correlation is r = 0.695.
Figure 2 with 2 supplements
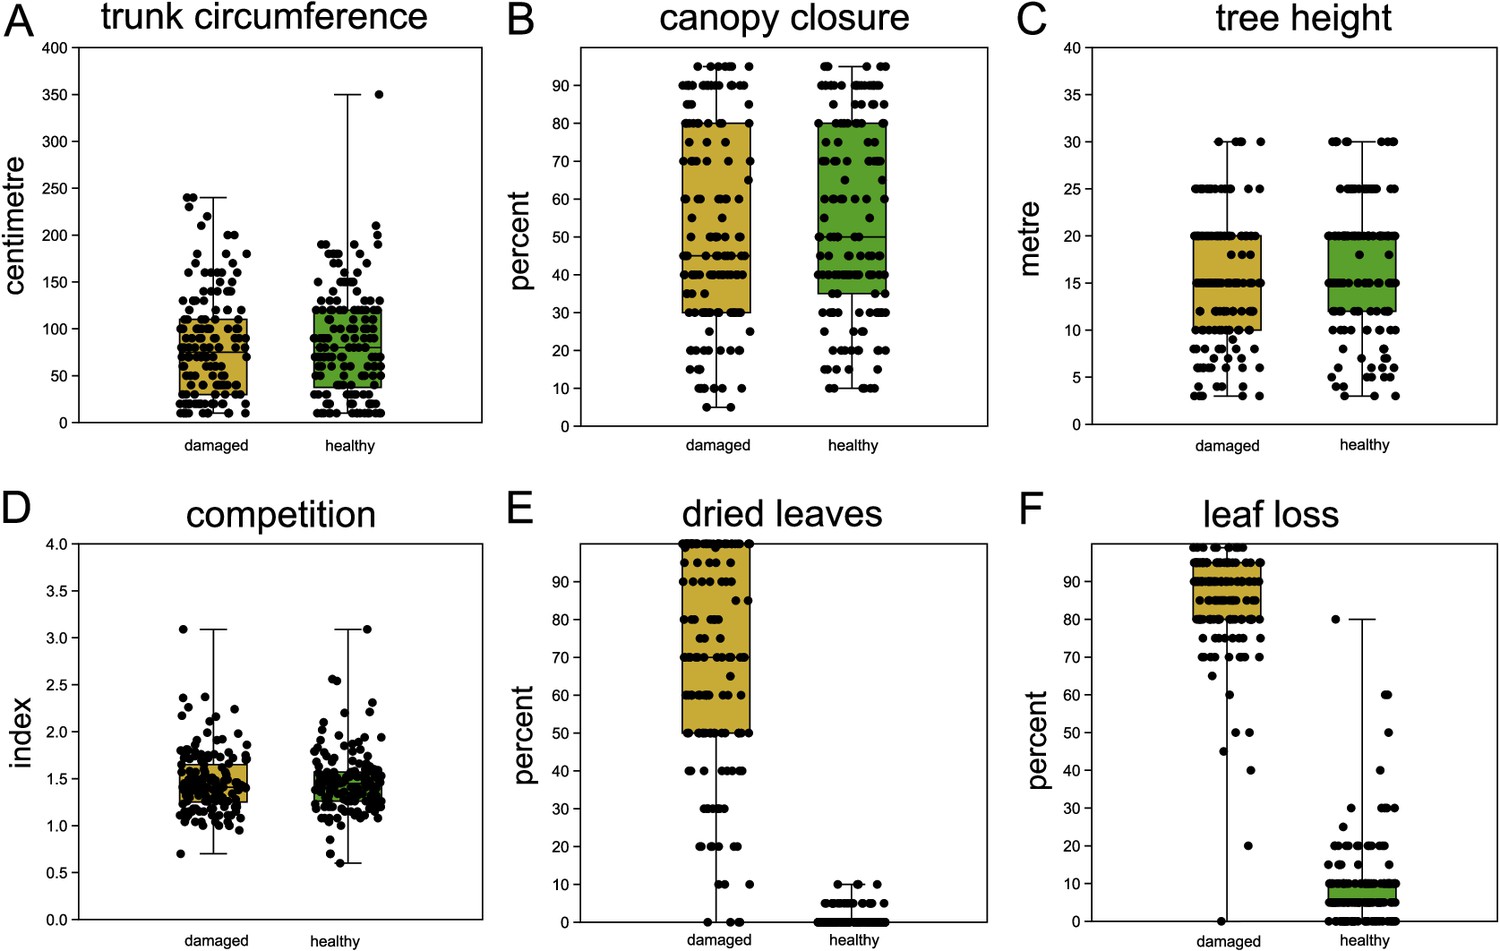
Comparison of sampled beech pairs.
(A) Trunk circumference, (B) canopy closure, (C) tree height, (D) competition index, (E) dried leaves, and (F) leaf loss. Boxplots with indicated means, the boxes represent one standard deviation, the whiskers are the 95% confidence intervals. Damaged trees in ochre, healthy trees in green. Except for (E) and (F), the difference of means among damaged and healthy trees is insignificant between the groups.
Figure 2—figure supplement 1
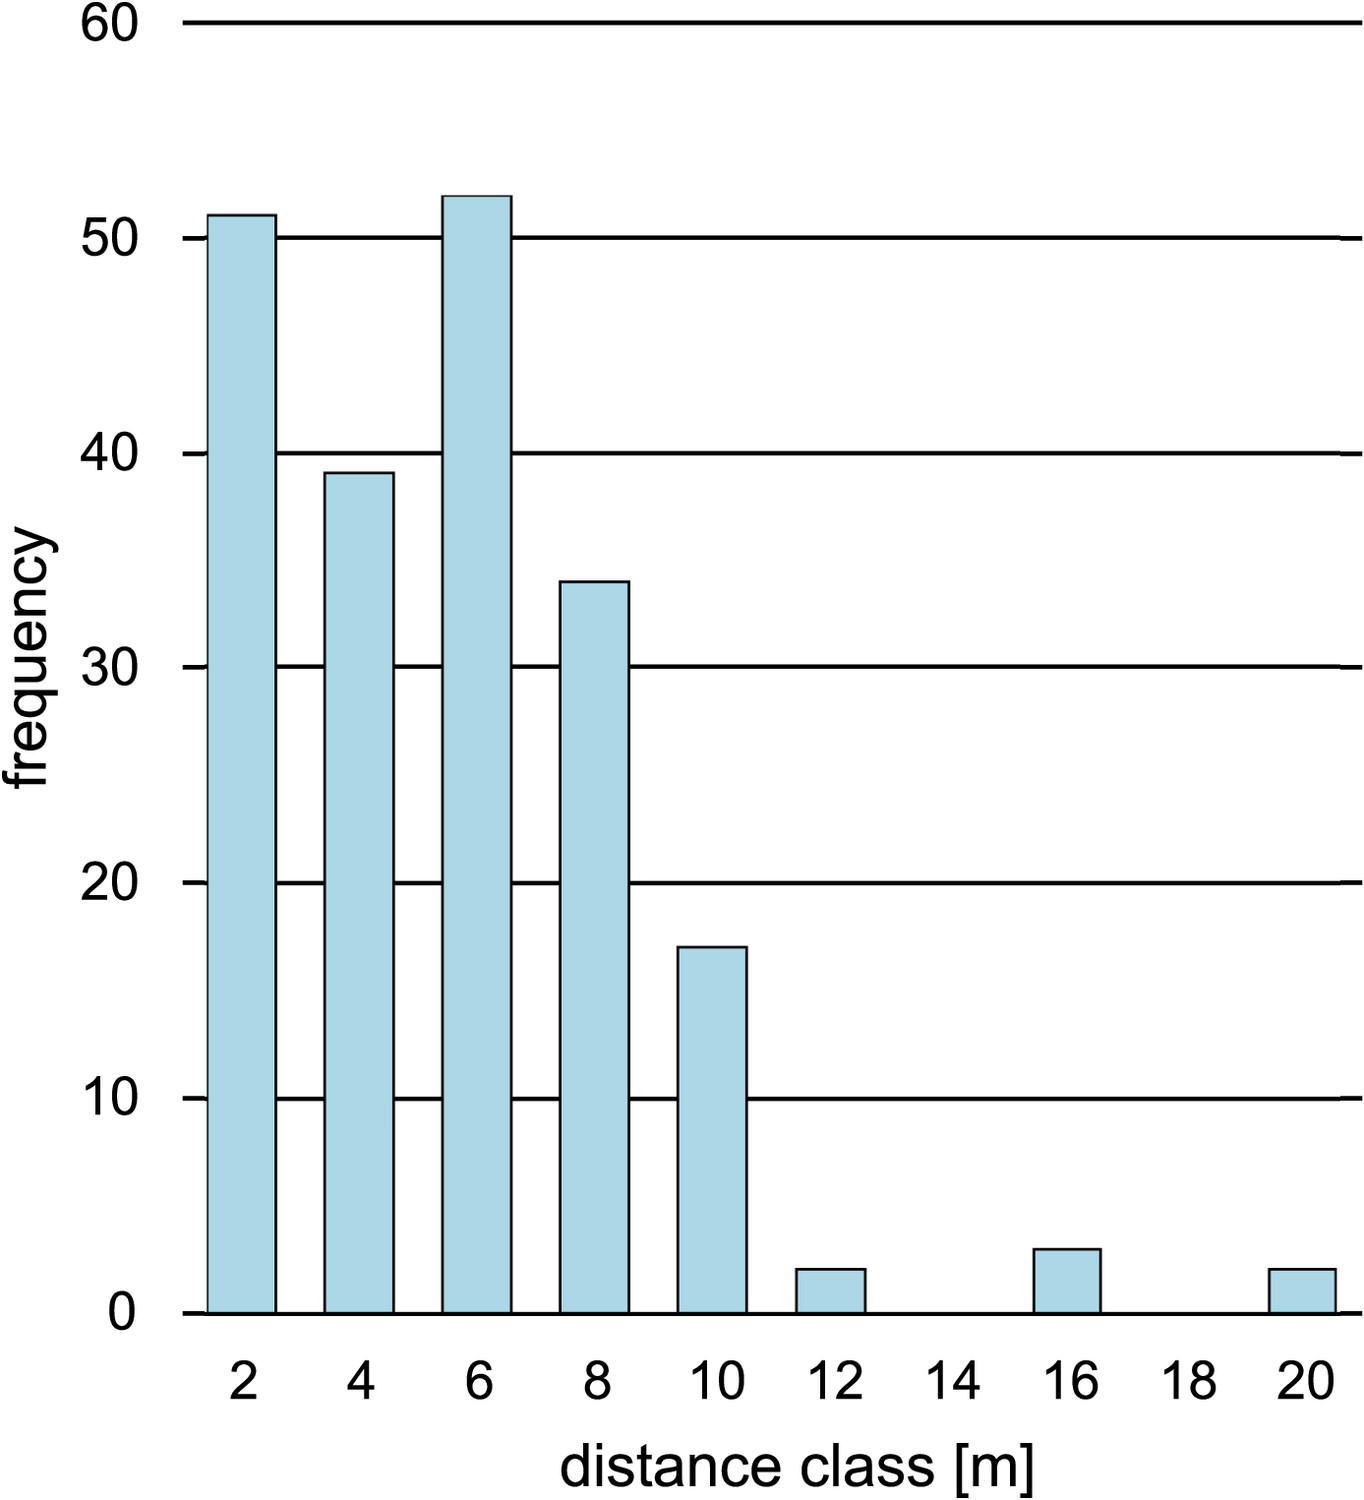
Distribution of pairwise distances between the paired trees.
Figure 2—figure supplement 2
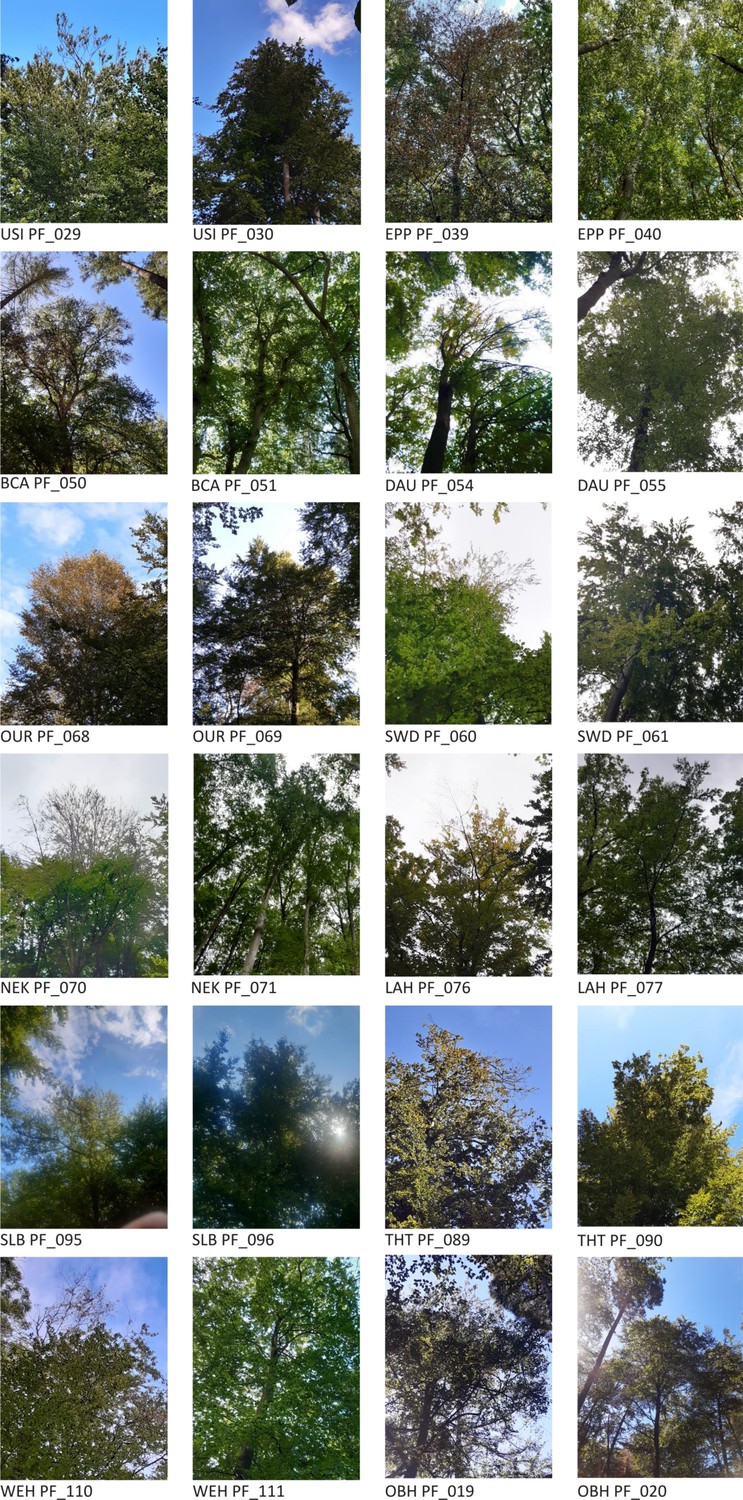
Exemplary pictures of damaged and healthy beech tree pairs from several sampling sites.
Figure 3 with 7 supplements
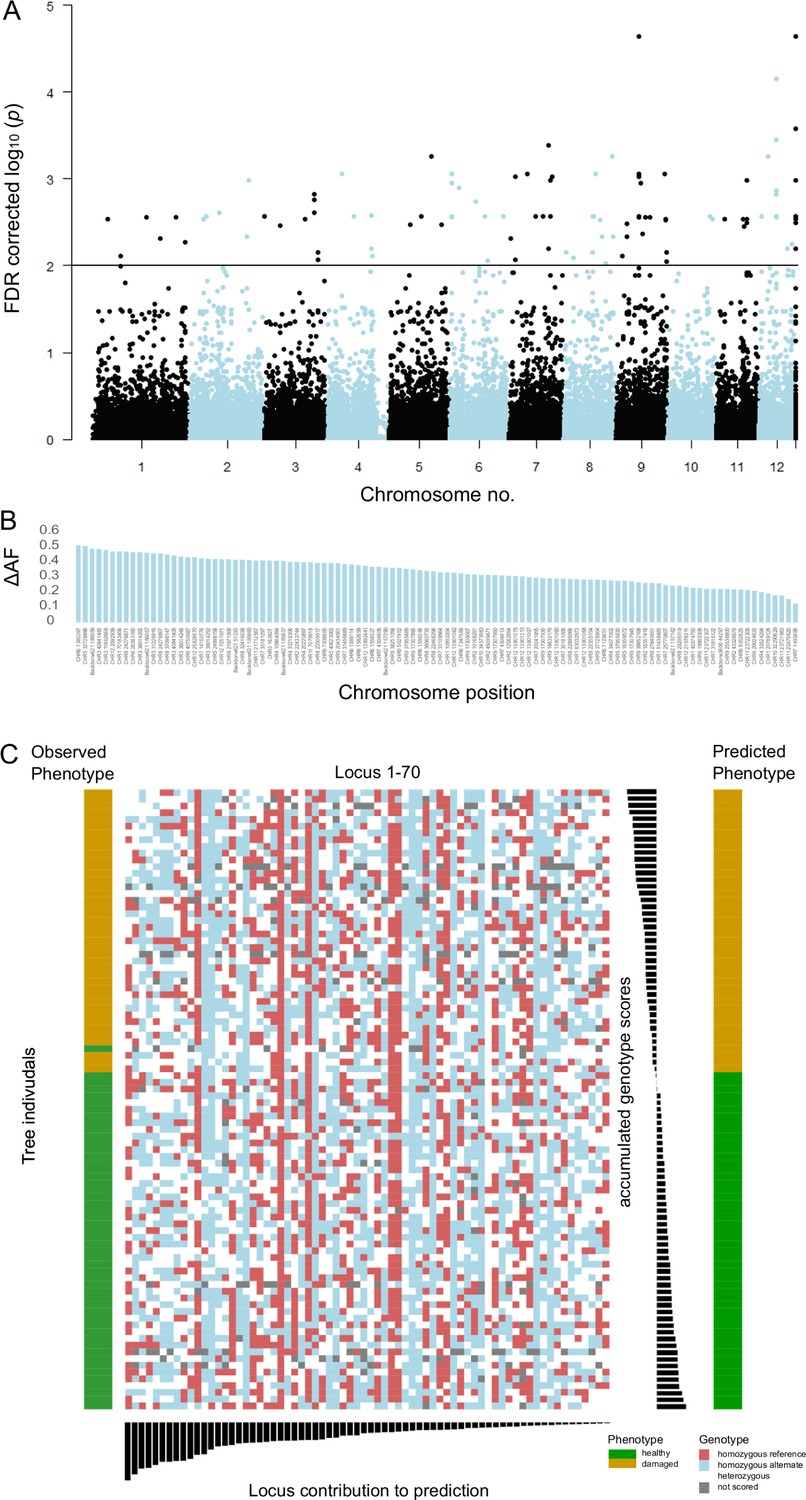
Single-nucleotide polymorphisms (SNPs) significantly associated with damaged phenotypes and combined results of SNP assay and discriminant analyses.
(A) Manhattan plot of false discovery rate (FDR)-corrected –log10 probability values from Cochran–Mantel–Haenszel test. The black horizontal line indicates the chosen significance threshold. SNPs on different chromosomes alternate in colour (black and blue). (B) Mean allele frequency difference at significantly associated SNP loci between healthy and damaged phenotypes. The loci are ordered according to amount of change. (C) The centre of the figure depicts the genotypogram of the SNP assay. Each column represents one of 70 loci, each row one of 92 beech individuals. The scored genotypes are colour-coded, with red squares = homozygous reference allele, light blue = homozygous alternate allele, white = heterozygous SNP, and grey squares = locus could not be scored in the respective individual. The left bar indicates the observed phenotype for each tree individual with ochre rectangles for damaged and green for healthy trees. Below the genotypogram, the relative contribution of each locus to the predictive model of the discriminant analysis is indicated, ordered from high to low. On the right side, first the genotype model scores for each individual are given, with the according predicted phenotype (ochre = damaged; green = healthy).
Figure 3—figure supplement 1
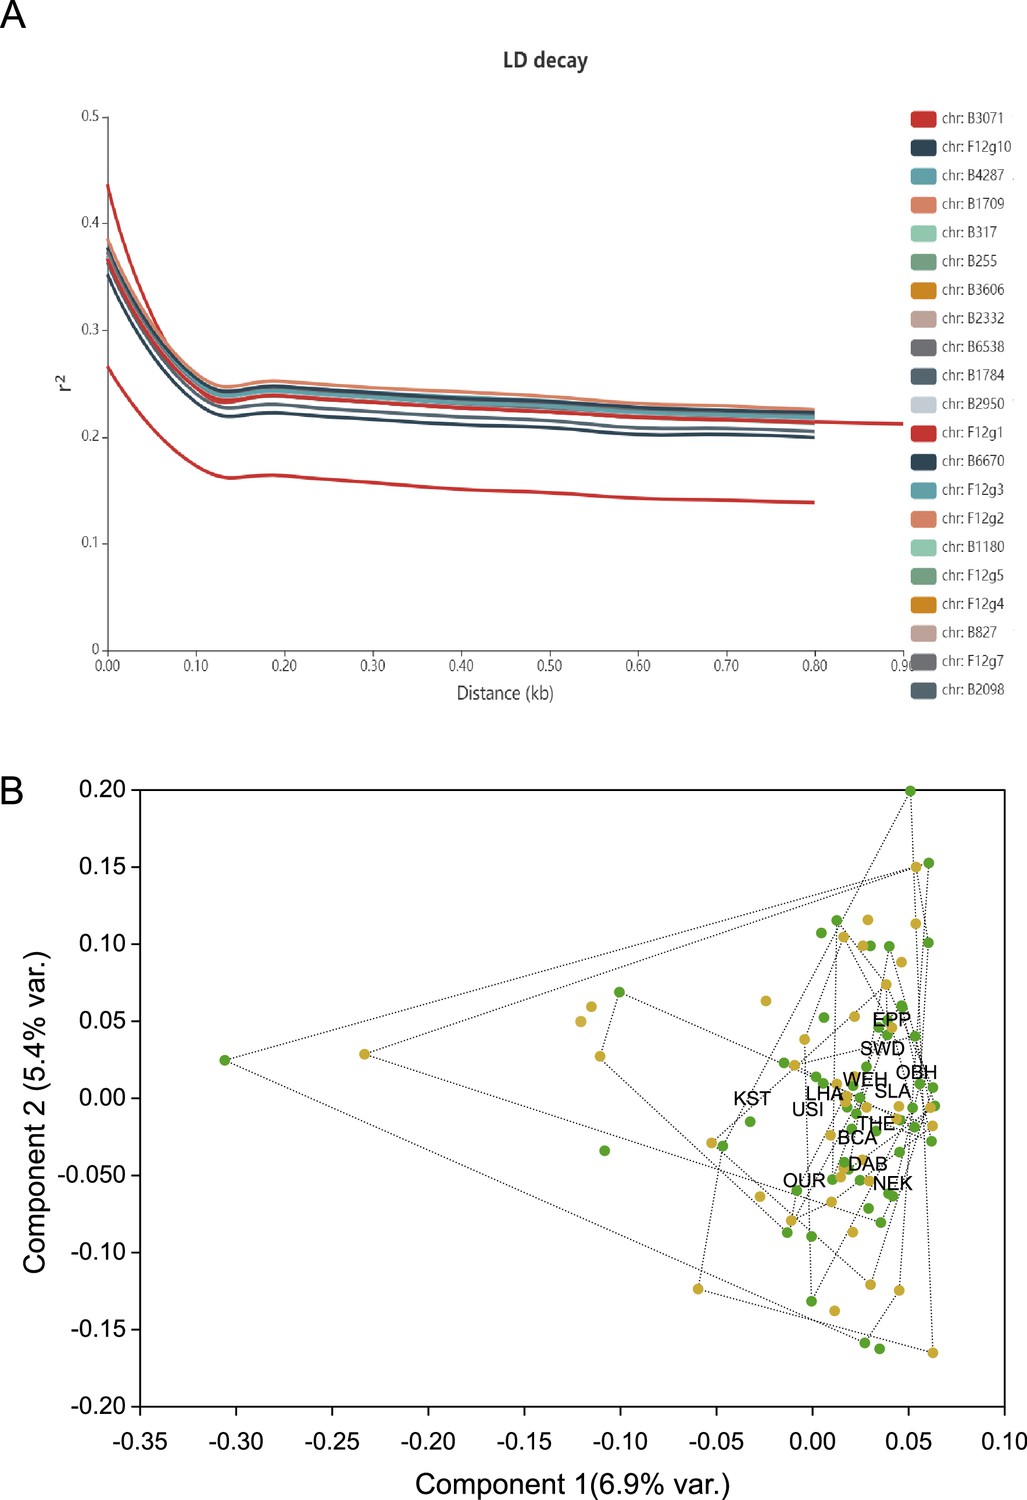
Genome-wide linkage disequilibrium (LD) and principal component analysis on genome-wide single-nucleotide polymorphism (SNP) data.
(A) Decay of genome-wide linkage disequilibrium, measured as r² on allele frequencies gained from individual resequencing, with distance from focal SNP in base pairs. (B) Plot of the first two principal component axes of LD-pruned SNP data from individually sequenced beech individuals from the North population. Healthy trees are indicated by a green dot, damaged ones by ochre. Individuals sampled from the same site are grouped by convex hulls, limited with dotted lines.
Figure 3—figure supplement 2
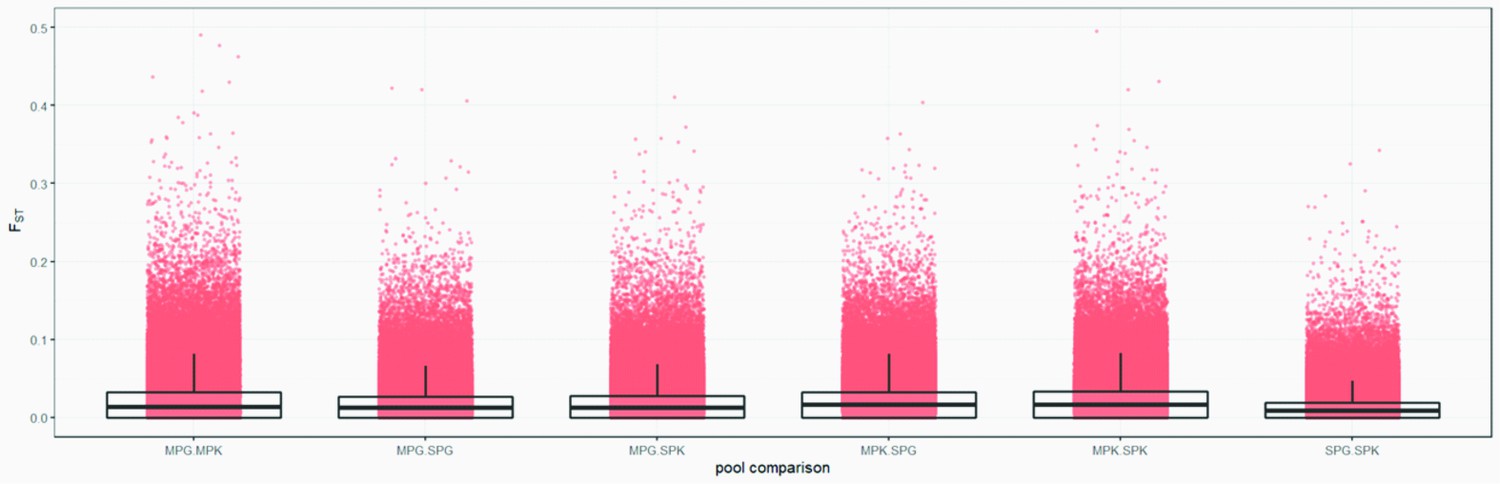
Genome-wide FST distributions in 1 kb windows.
Comparisons between all pools. Please note that the standard deviation included zero in all cases.
Figure 3—figure supplement 3
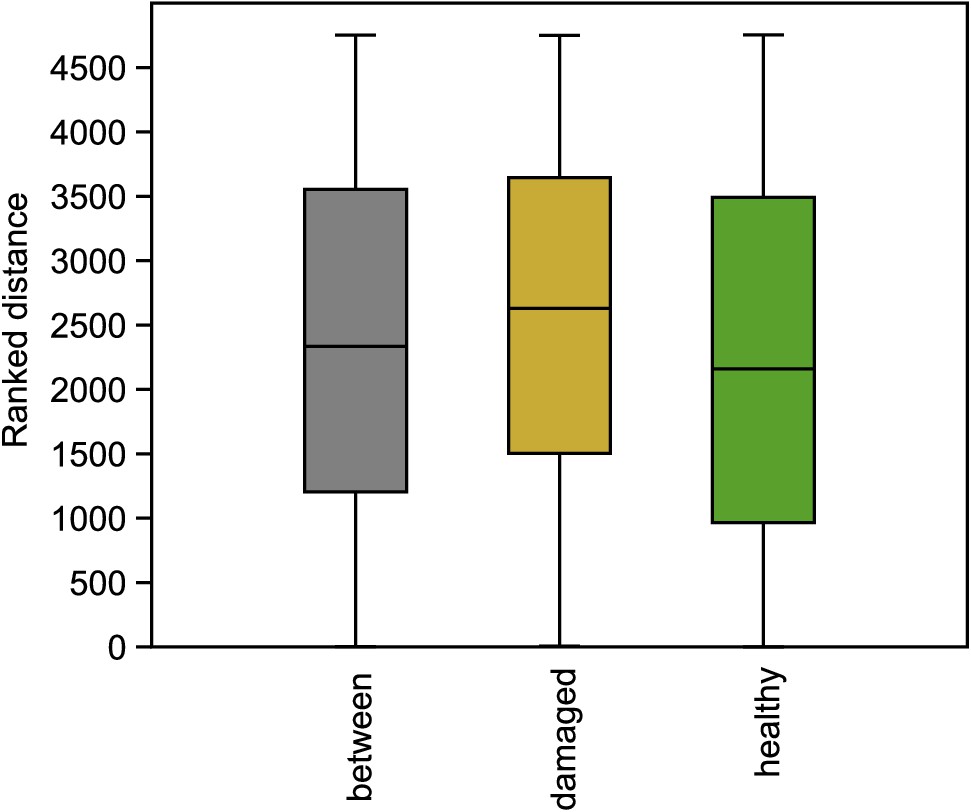
Genomic similarity among individuals within and among phenotypic classes.
Permutation ANOSIM shows that the differences are not significant (p=0.76).
Figure 3—figure supplement 4
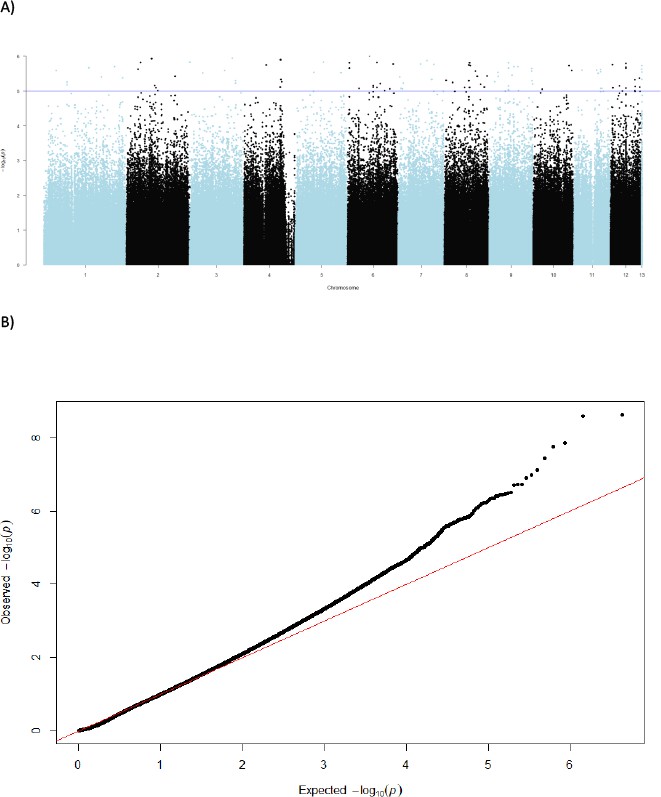
Uncorrected Manhatten-plot.
(A) Manhattan plot of uncorrected p values from Cochran–Mantel–Haenszel test and (B) corresponding QQ-plot. Single-nucleotide polymorphisms on different chromosomes are alternatingly coloured blue and black.
Figure 3—figure supplement 5
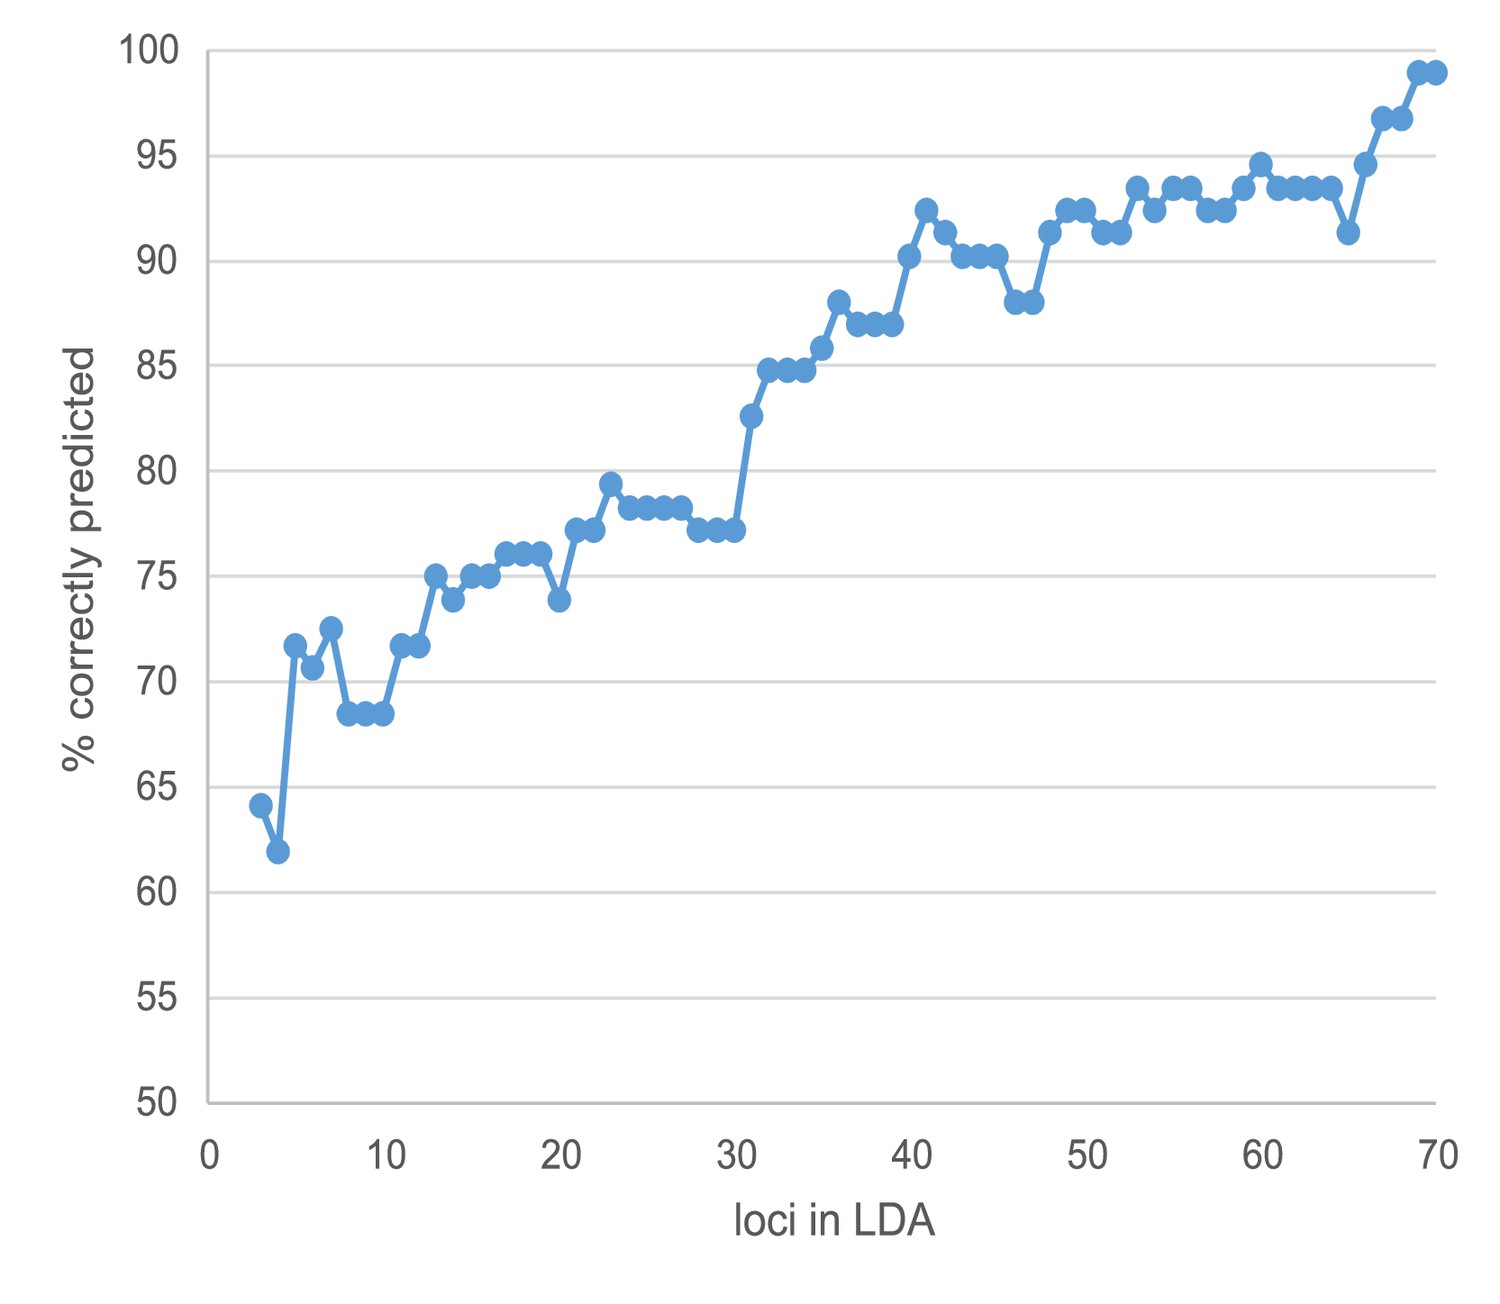
Increase of linear discriminant analysis prediction success with the number of loci involved.
Loci were added according to their decreasing contribution in the final analysis.
Figure 3—figure supplement 6
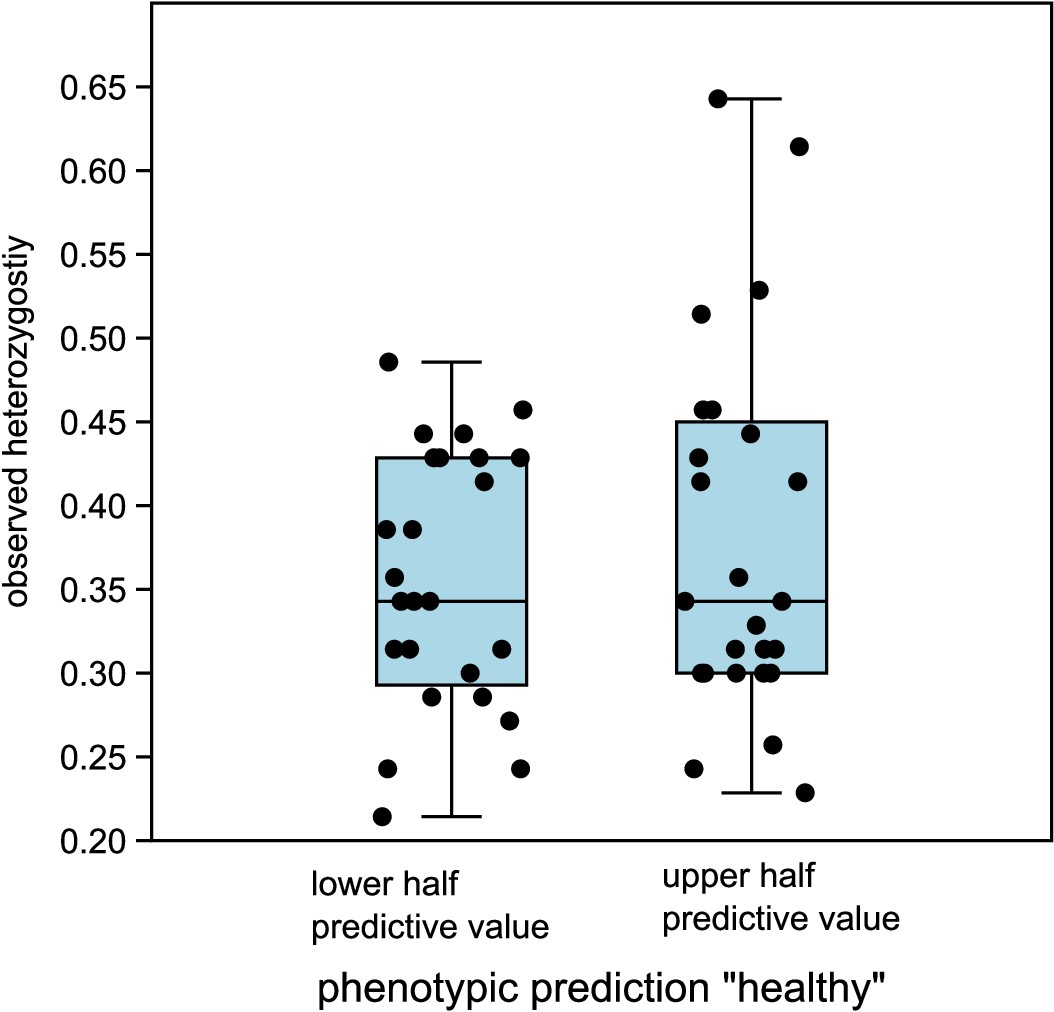
Comparison of observed heterozygosity between lower and upper half of predictive values ‘healthy’ in LDA.
The medians are not significantly different (Mann–Whitney U = 293.5, p same median = 0.72).
Figure 3—figure supplement 7
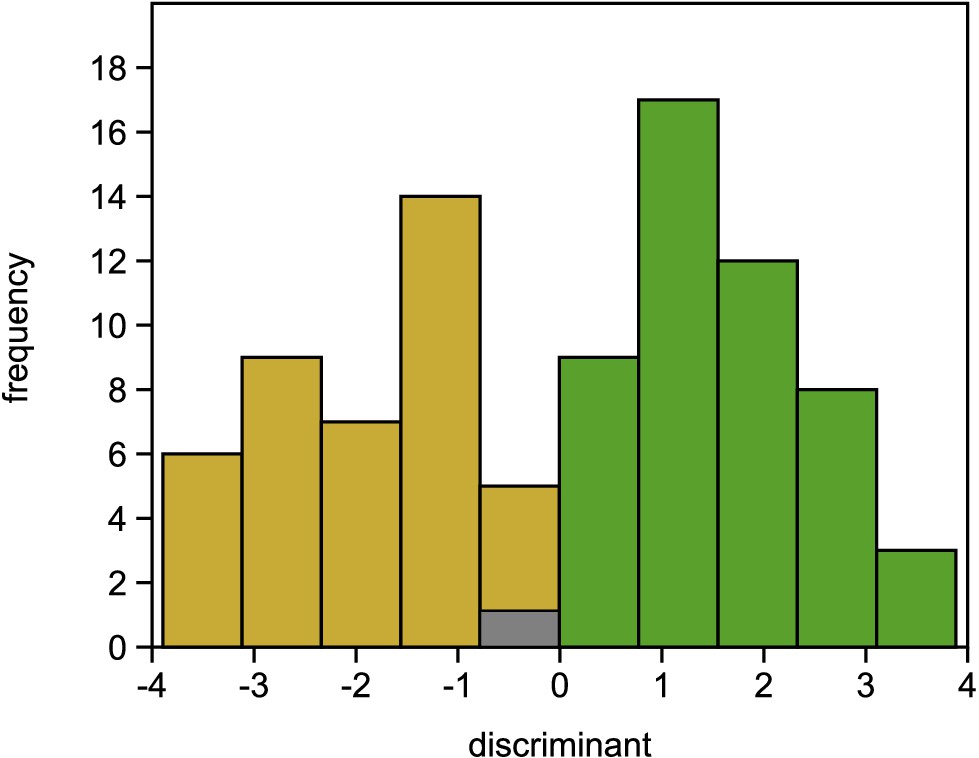
Histogram of linear discriminant analysis results.
Individuals where the predicted phenotype did not match the observed phenotype are shown in grey, and individuals with matching observed/predicted phenotype in green (healthy) or in ochre (damaged).
Tables
Table 1
Genes with significantly associated single-nucleotide polymorphisms (SNPs).
Given are the chromosome number (CHR), nucleotide position (position), the gene ID for Fagus sylvatica (gene), the UniProt ID of the closest match (UniProt ID), the name of the gene (name), the nucleotide base in the reference (ref DNA base), and the alternate base (alt DNA base), if applicable, the amino acid of the reference (ref AA) and the alternate base (non-synonymous change), functional change (effect), and the phenotype associated with the alternate base.
| CHR | Position | Gene | UniProt ID | Name | Ref DNA base | Alt DNA base | Ref AA | Non-synoynmous change | Effect | Phenotype associated with alternate base |
|---|---|---|---|---|---|---|---|---|---|---|
| 1 | 40374762 | 1 .g3851.t1 | None | A | G | C | R | SH side chain > positive charge | Healthy | |
| 10 | 32290645 | 10 .g3914.t1 | None | C | T | F | - | - | ||
| 11 | 20479628 | 11 .g2467.t1 | EXOS5_ORYSJ | Exosome complex exonuclease RRP46 homolog | T | C | T | A | Polar > hydrophobic | Damaged |
| 11 | 23722307 | 11 .g2832.t1 | PCN_ARATH | WD repeat-containing protein PCN | A | G | I | V | Hydrophobic > hydrophobic | Damaged |
| 12 | 13901034 | 12 .g1695.t1 | F4I5S1_ARATH | PB1 domain-containing protein tyrosine kinase | C | A | P | Q | Hydrophobic > polar | Damaged |
| 13901063 | C | T | Q | Stop | Termination | Damaged | ||||
| 13901082 | A | T | H | L | Positive charge > hydrophobic | Damaged | ||||
| 13901094 | T | A | I | N | Hydrophobic > polar | Damaged | ||||
| 2 | 43326571 | 2 .g4736.t1 | None | G | A | R | C | Positive charge > SH side chain | Damaged | |
| 3 | 31226940 | 3 .g3590.t1 | None | C | T | Q | Stop | Termination | Healthy | |
| 4 | 34077017 | 4 .g3980.t1 | CKX1_ARATH | Cytokinin dehydrogenase 1 | C | A | G | C | No side chain > SH side chain | Damaged |
| 5 | 16359587 | 5 .g1807.t1 | GDI2_ARATH | Guanosine nucleotide diphosphate dissociation inhibitor 2 | T | C | P | - | - | |
| 6 | 19865311 | 6 .g2227.t1 | NDUS7_ARATH | NADH dehydrogenase (ubiquinone) iron-sulfur protein 7, mitochondrial | T | C | D | - | - | |
| 6 | 26383172 | 6 .g2921.t1 | None | T | C | A | - | - | ||
| 7 | 1493904 | 7 .g177.t1 | TLP10_ARATH | Tubby-like F-box protein 10 | C | T | G | - | - | |
| 7 | 20242023 | 7 .g2350.t1 | PRK4_ARATH | Pollen receptor-like kinase 4 | A | G | P | - | - | |
| 7 | 4504799 | 7 .g1655 | C | T | W | Stop | Termination | Damaged | ||
| 7 | 31456694 | 7 .g3617.t1 | LSH4_ARATH | Protein LIGHT-DEPENDENT SHORT HYPOCOTYLS 4 | G | T | R | - | - | |
| 7 | 33110000 | 7 .g3816.t1 | None | G | A | L | - | - | ||
| 7 | 4504813 | 7 .g552.t1 | None | G | A | G | - | - | ||
| 4504831 | C | T | L | - | - | |||||
| 8 | 29295139 | 8 .g3494.t1 | VATC_ARATH | V-type proton ATPase subunit C | G | A | G | - | - | |
| 9 | 25538827 | 9 .g3080.t1 | PPA14_ARATH | Probable inactive purple acid phosphatase 14 | G | C | K | N | Positive charge > polar | Damaged |
| 9 | 37955715 | 9 .g4504.t1 | TBL33_ARATH | Protein trichome birefringence-like 33 | G | C | M | I | Hydrophobic > hydrophobic | Damaged |
Additional files
-
Supplementary file 1
Tables with detailed information.
(A) Sampled Fagus sylvatica individuals. (B) Results from Mann–Whitney U-test on difference between damaged and healthy trees for various parameters. (C) List of genes with significant single-nucleotide polymorphisms (SNPs). (D) List of genes closest to significant SNPs. (E) List of 20 most informative SNPs as selected by the entropy-based Scalable Probabilistic Analysis (eSPA) allowing for 85% correct classification. (F) Software pipeline and commands used for PoolSeq analysis. (G) Workflow individual reseq GWAS.
- https://cdn.elifesciences.org/articles/65532/elife-65532-supp1-v3.docx
-
Transparent reporting form
- https://cdn.elifesciences.org/articles/65532/elife-65532-transrepform-v3.docx
Download links
A two-part list of links to download the article, or parts of the article, in various formats.
Downloads (link to download the article as PDF)
Open citations (links to open the citations from this article in various online reference manager services)
Cite this article (links to download the citations from this article in formats compatible with various reference manager tools)
Genomic basis for drought resistance in European beech forests threatened by climate change
eLife 10:e65532.
https://doi.org/10.7554/eLife.65532


