KLF10 integrates circadian timing and sugar signaling to coordinate hepatic metabolism
- Université Côte d’Azur, CNRS, Inserm, iBV, France
- Université Côte d’Azur, CNRS, Institut de Chimie de Nice, France
- Department of Biochemistry and Molecular Biology, Mayo Clinic, United States
Figures
Figure 1 with 1 supplement
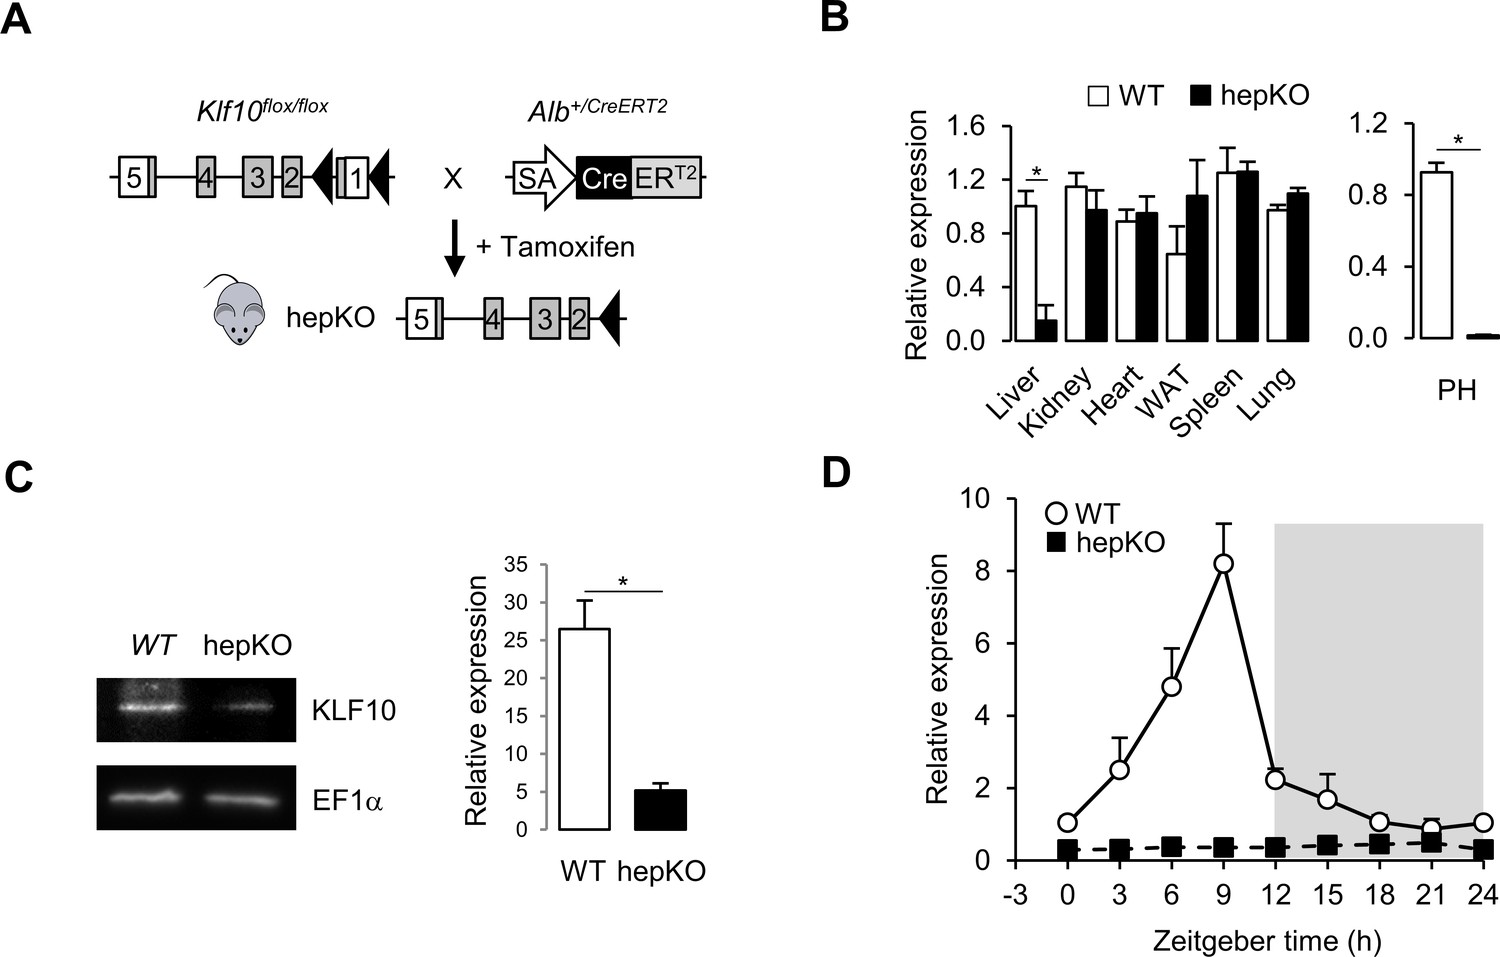
Genetic disruption of Klf10 in mouse hepatocytes.
(A) Schematic illustrating the strategy used for generating HepKO mice. (B) Relative gene expression of Klf10 mRNA across various tissue in WT and HepKO mice as measured at ZT9 (left) and in WT and HepKO primary hepatocytes (PH) (right) (mean ± SEM, n = 3–5). (C) Immunoblot showing KLF10 protein abundance in liver extracts from WT and HepKO mice at ZT9 (left) and quantification of 3–4 independent experiments (right). EF1α was used as loading control. (D) 24 hr gene expression profiles of hepatic Klf10 mRNA measured every 3 hr in WT and HepKO mice (mean ± SEM, n = 3 mice per time point). Statistics: nonparametric Wilcoxon test. *p<0.05.
-
Figure 1—source data 1
Values and statistical test results for Figure 1B and D and Figure 1—figure supplement 1A.
- https://cdn.elifesciences.org/articles/65574/elife-65574-fig1-data1-v2.xlsx
Figure 1—figure supplement 1
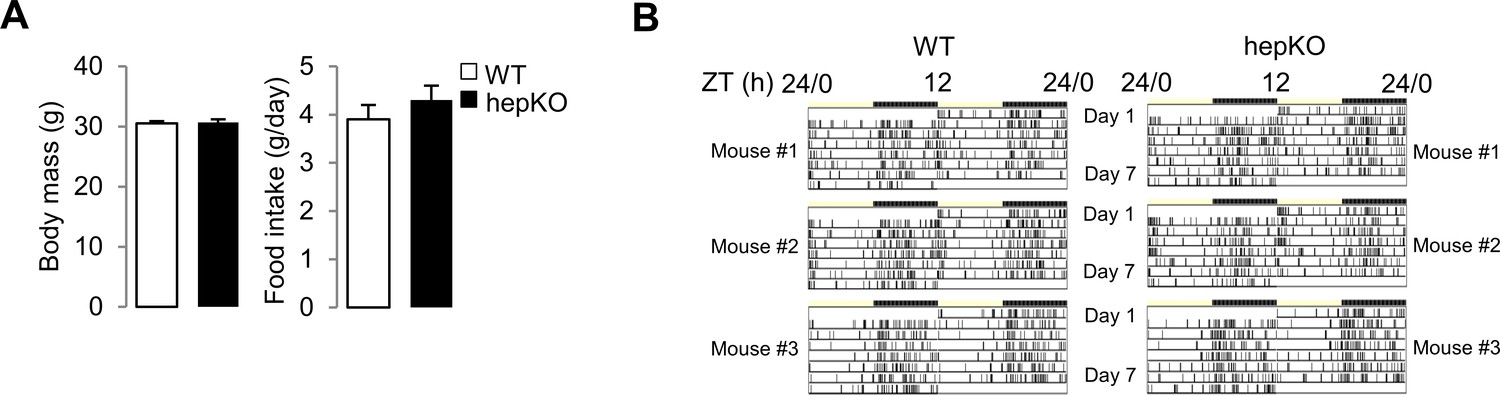
Genetic disruption of Klf10 in mouse hepatocytes.
(A) Body weights (left) and daily food intake (right) of WT and HepKO mice of WT and HepKO mice (mean ± SEM, n = 44 for body weight and n = 6–8 for food intake). (B) Representative actograms of double-plotted food-seeking activity records of WT and HepKO mice. Mice were placed in individual cages containing a Minimetter infrared detection system. Vertical bars represent time points that animals were in the area of the cage containing food. Statistics: nonparametric Kruskal–Wallis test. *p<0.05.
Figure 2 with 1 supplement
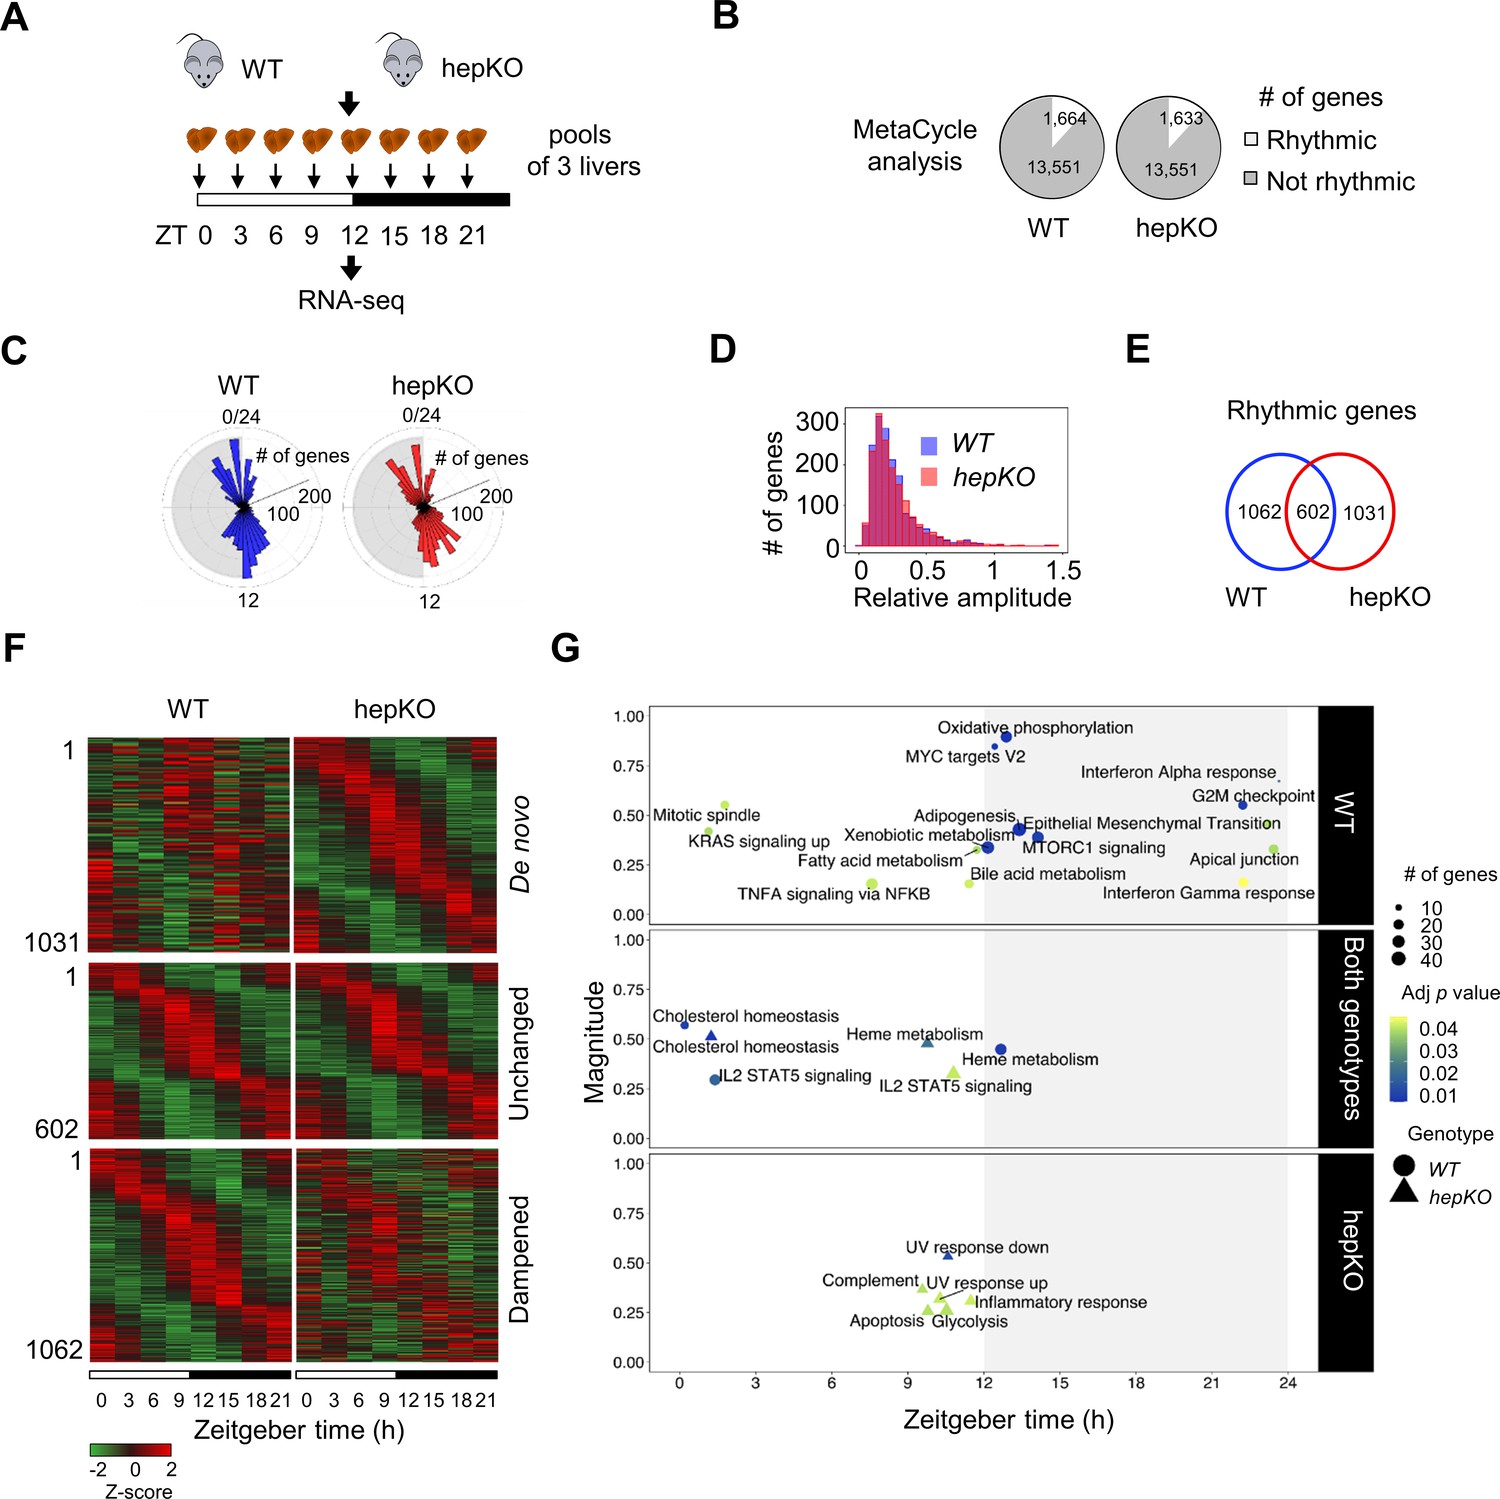
Deletion of hepatocyte KLF10 alters the circadian transcriptome in the liver.
(A) Schematic illustrating the workflow used to assess the circadian transcriptomes of livers in WT and HepKO mice. (B) Number of rhythmic transcripts detected in the livers from WT and HepKO mice. (C) Phase distributions of rhythmic transcripts in the livers of WT and HepKO mice. (D) Relative amplitudes of rhythmic transcripts in the livers of WT and HepKO mice. (E) Number of unique and overlapping rhythmic transcripts in WT and HepKO mice. (F) Heatmaps of transcripts showing de novo, unchanged or dampened oscillatory behavior in the liver of HepKO mice compared to WT mice (pools of three livers per time point). (G) Magnitudes and phases of enriched biological processes identified by Phase Set Enrichment Analysis (PSEA) in WT mice only (top), in HepKO mice only (bottom), and in both genotypes (middle). Statistics: MetaCycle, significance threshold, p<0.05; PSEA; Kuiper test, significance threshold, q < 0.01.
-
Figure 2—source data 1
MetaCycle analysis of the hepatic circadian transcriptome of WT and HepKO mice fed ad libitum and entrained in a 12:12 light/dark (LD) cycle.
(.xlsx 9.65 MB).
- https://cdn.elifesciences.org/articles/65574/elife-65574-fig2-data1-v2.xlsx
-
Figure 2—source data 2
Phase Set Enrichment Analysis (PSEA) of the hepatic transcriptome of WT and HepKO mice fed ad libitum and entrained in a 12:12 light/dark (LD) cycle.
- https://cdn.elifesciences.org/articles/65574/elife-65574-fig2-data2-v2.xlsx
Figure 2—figure supplement 1

Deletion of hepatocyte KLF10 alters the circadian transcriptome in the liver.
(A) Gene expression profiles of clock genes in the livers of WT and HepKO mice (n = 3 pools of liver per time point). (B) Gene expression profiles of genes representative of the heatmaps in Figure 2F in WT and HepKO mice (mean ± SEM, n = 2–4 per time point). (C) Glycemia in WT and HepKO mice measured at ZT6 and ZT18 (mean ± SEM, n = 14). (D) Liver glycogen content in WT and HepKO mice measured at ZT3 and ZT15 (mean ± SEM, n = 5–6). (E) Glucose uptake in WT and HepKO primary hepatocytes (mean ± SEM, n = 4). (F) Glucose production in WT and HepKO primary hepatocytes (mean ± SEM, n = 6). Statistics: nonparametric Kruskal–Wallis test. *p<0.05; ***p<0.005.
-
Figure 2—figure supplement 1—source data 1
Values and statistical test results for Figure 2—figure supplement 1B-F.
- https://cdn.elifesciences.org/articles/65574/elife-65574-fig1-data1-v2.xlsx
Figure 3
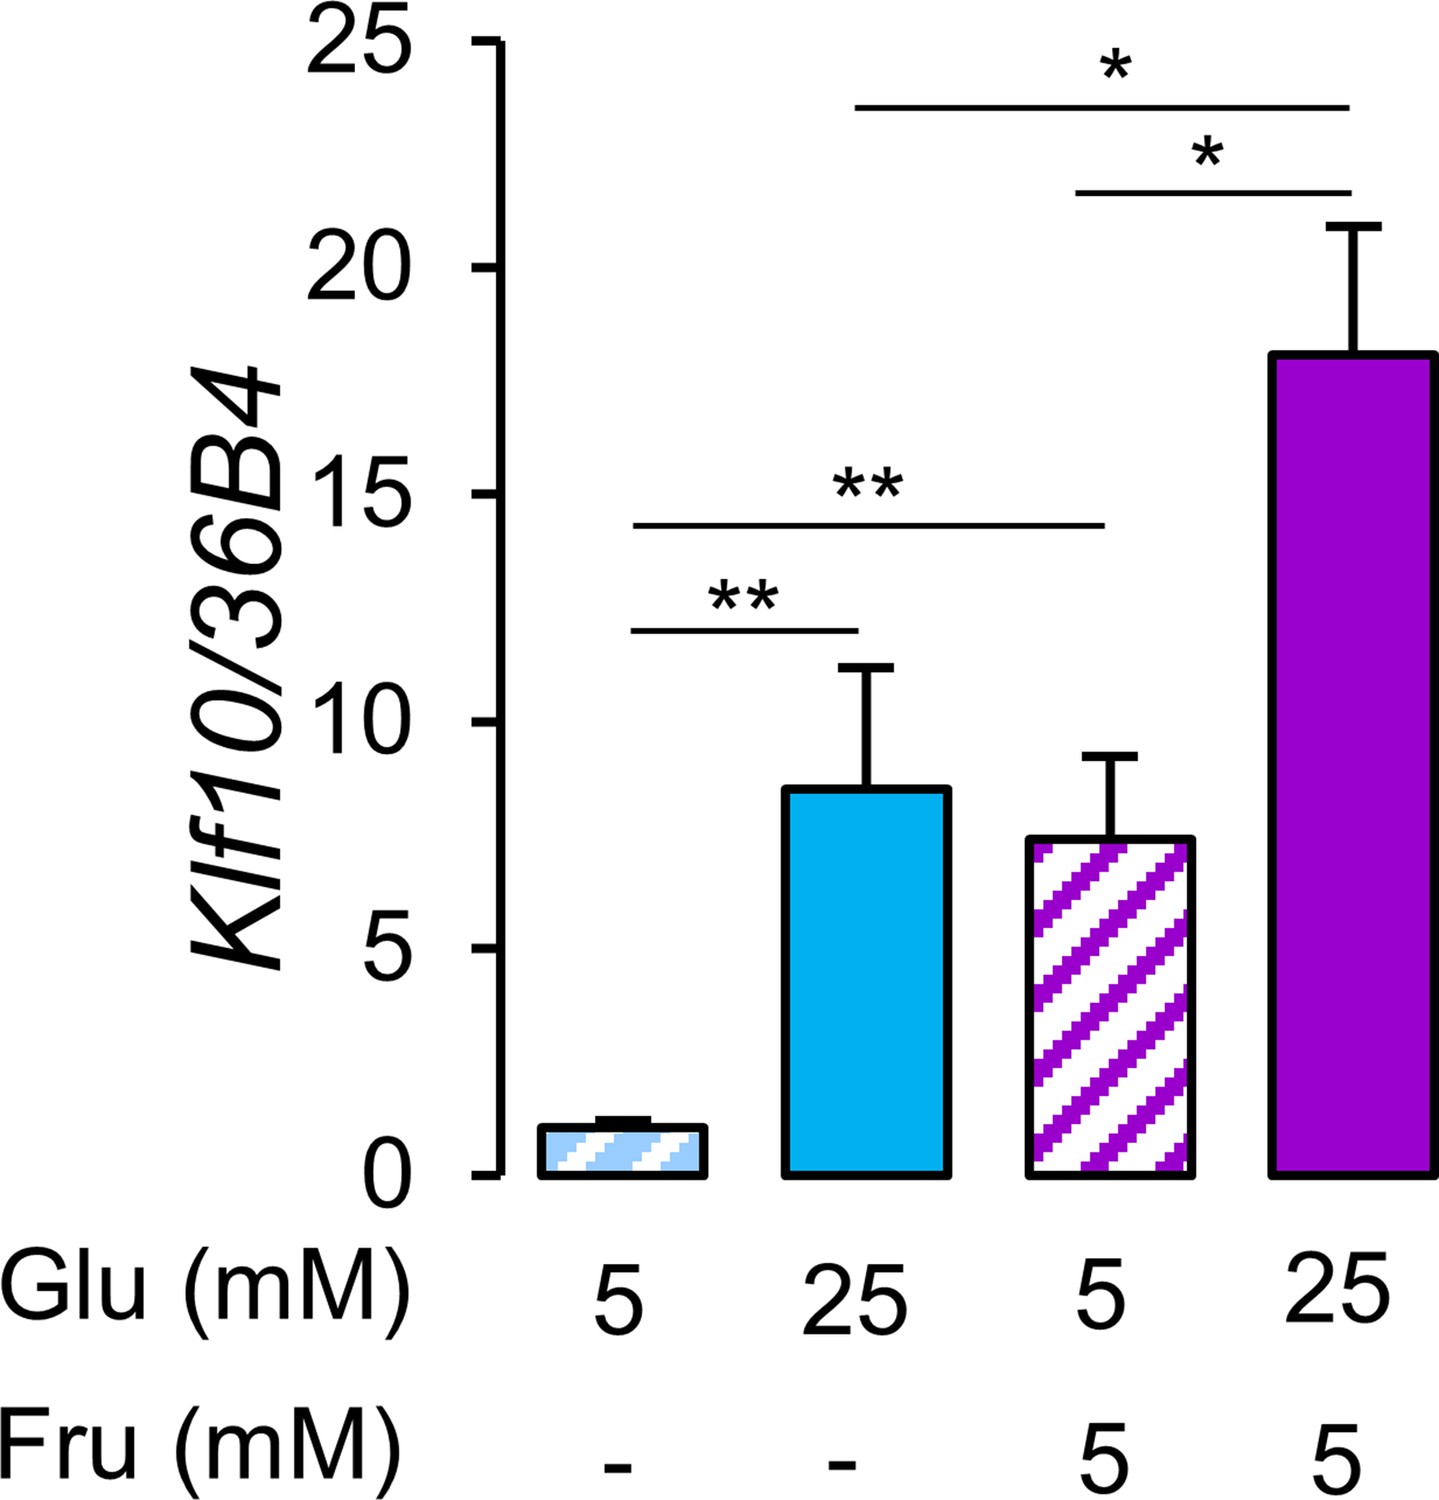
Glucose and fructose are potent inducers of Klf10 expression in hepatocytes.
Expression of the Klf10 mRNA in primary WT mouse hepatocytes challenged with low (5 mM) or high (25 mM) glucose (Glu) in the absence or presence of 5 mM fructose (Fru) (mean ± SEM, n = 6) Statistics: nonparametric Kruskal–Wallis test. *p<0.05, **p<0.01.
-
Figure 3—source data 1
Values and statistical test results for Figure 3.
- https://cdn.elifesciences.org/articles/65574/elife-65574-fig3-data1-v2.xlsx
Figure 4 with 1 supplement

Loss of hepatocyte KLF10 exacerbates the adverse effects associated with increased sugar consumption.
(A) Schematic illustrating the design of the sugar-sweetened water (SSW) challenge experiment. (B) Gene expression of Klf10 at ZT9 and ZT15 in livers of WT and HepKO mice given a chow or chow + SSW diet (mean ± SEM, n = 4–8). (C) Body mass of mice given a chow or chow + SSW diet (mean ± SEM, n = 9–12). (D) Epididymal white adipose tissue mass of mice given a chow or chow + SSW diet (mean ± SEM, n = 9–12). (E) Liver mass of mice given a chow or chow + SSW diet (mean ± SEM, n = 8–12). (F) Liver triglyceride content (mean ± SEM, n = 6–10) (left) and representative images of liver histology (right) in WT and HepKO mice given a chow or chow + SSW diet (scale bar = 50 µm). (G) Blood glucose in WT and HepKO mice given a chow or chow + SSW diet (n = 9–12). (H) Insulin levels in WT and HepKO mice given a chow or chow + SSW diet (mean ± SEM, n = 9–12). (I) Blood glucose levels assessed at regular intervals over a 2 hr period in mice undergoing a glucose tolerance test (GTT) performed at ZT12 (left) and area under the curve of blood glucose levels over the measurement period (right) (mean ± SEM, n = 9–12). (J) Heatmap showing the normalized concentration of metabolites in the liver of WT and HepKO mice given a chow or chow + SSW diet (mean, n = 9–12). Significant pairwise comparisons are boxed. (C–H, J), Measurements were performed during the animals’ feeding period, at ZT15. Statistics: nonparametric Kruskal–Wallis test. *p<0.05, **p<0.01, ***p<0.005.
-
Figure 4—source data 1
Values and statistical test results for Figure 3.
- https://cdn.elifesciences.org/articles/65574/elife-65574-fig4-data1-v2.xlsx
Figure 4—figure supplement 1
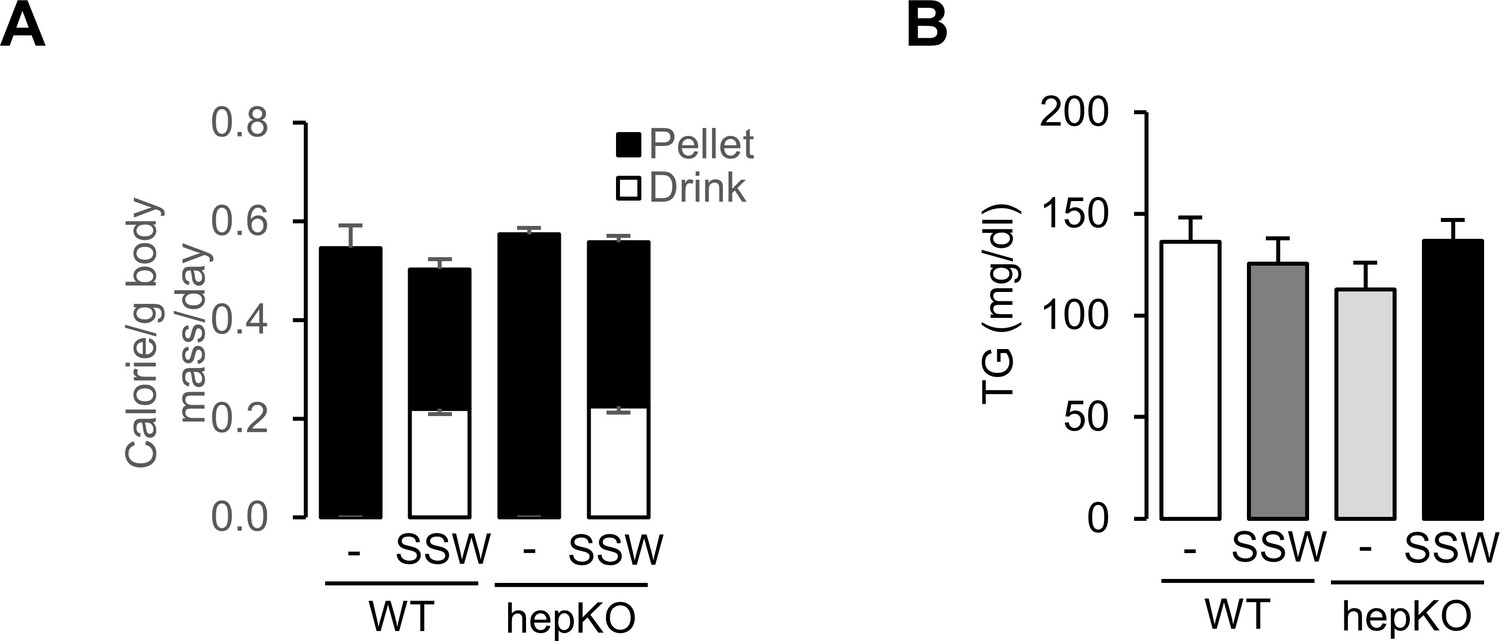
Loss of hepatocyte KLF10 exacerbates the adverse effects associated with increased sugar consumption.
(A) Daily caloric intake in WT and HepKO mice under the chow and chow + sugar-sweetened water (SSW) dietary conditions (mean ± SEM, n = 8–14). (B) Blood triglyceride content at ZT15 in WT and HepKO mice under the chow and chow + SSW dietary conditions (mean ± SEM, n = 6).
Figure 5 with 1 supplement
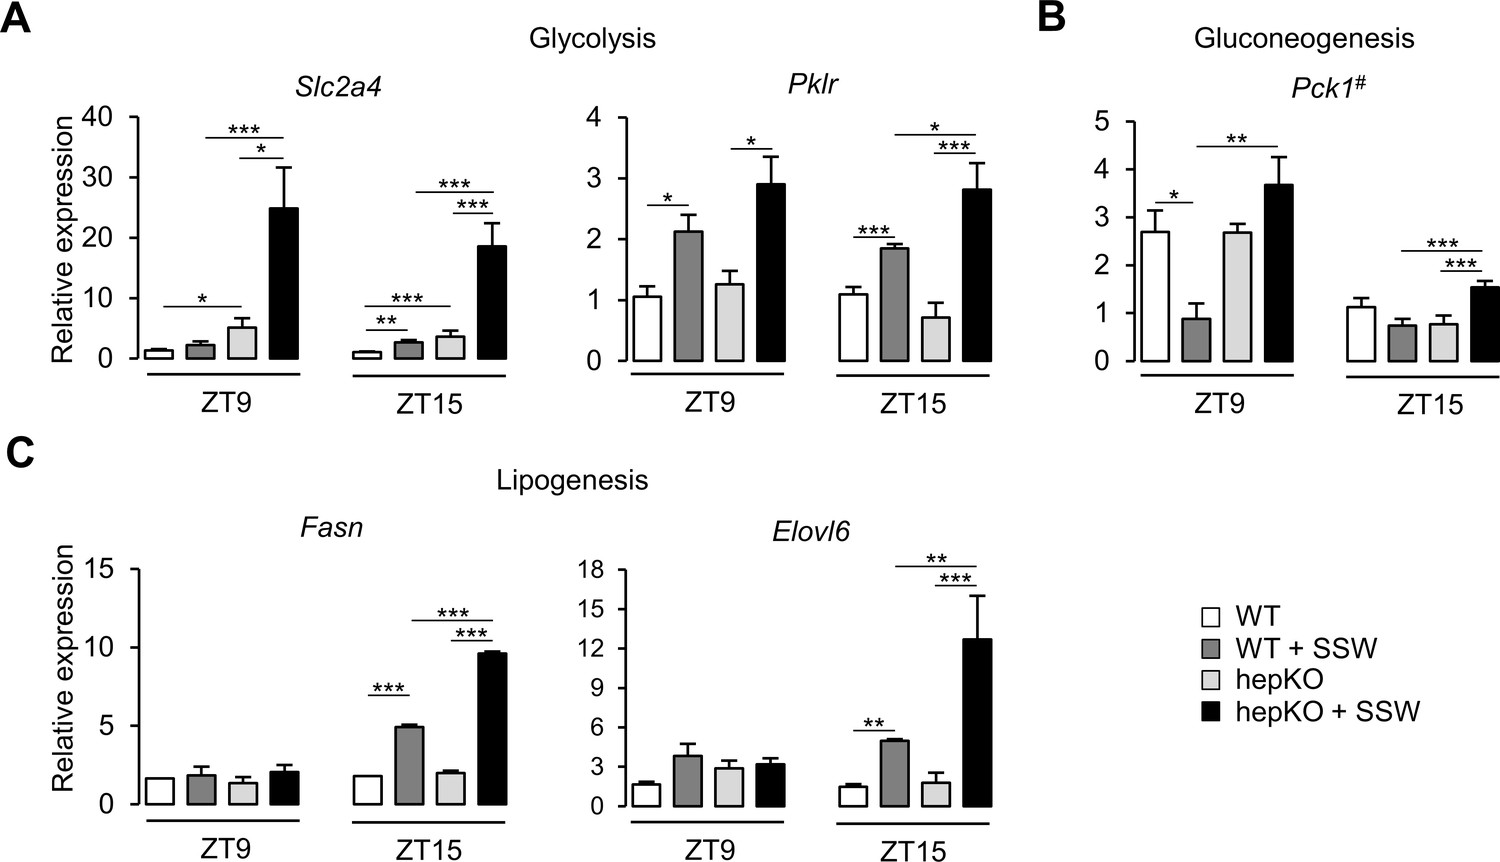
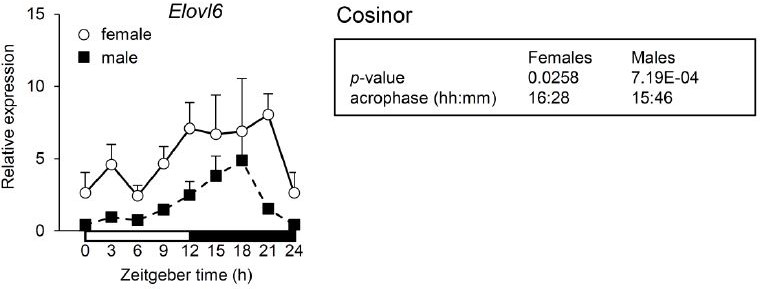
Altered metabolic gene expression in HepKO mice challenged with high sugar.
(A) Expression profiles of Slc2a4 and Pklr. (B) Expression profile of Pck1. (C) Expression profiles of the Fasn and Elovl6. (A–C) Expression was determined at ZT9 and ZT15 in the liver of WT and HepKO mice given a chow or chow + sugar-sweetened water (SSW) diet (mean ± SEM, n = 3–6). The # symbol denotes a direct KLF10 target. Statistics: nonparametric Kruskal–Wallis test. *p<0.05, **p<0.01, ***p<0.005.
-
Figure 5—source data 1
Values and statistical test results for Figure 5.
- https://cdn.elifesciences.org/articles/65574/elife-65574-fig5-data1-v2.xlsx
Figure 5—figure supplement 1
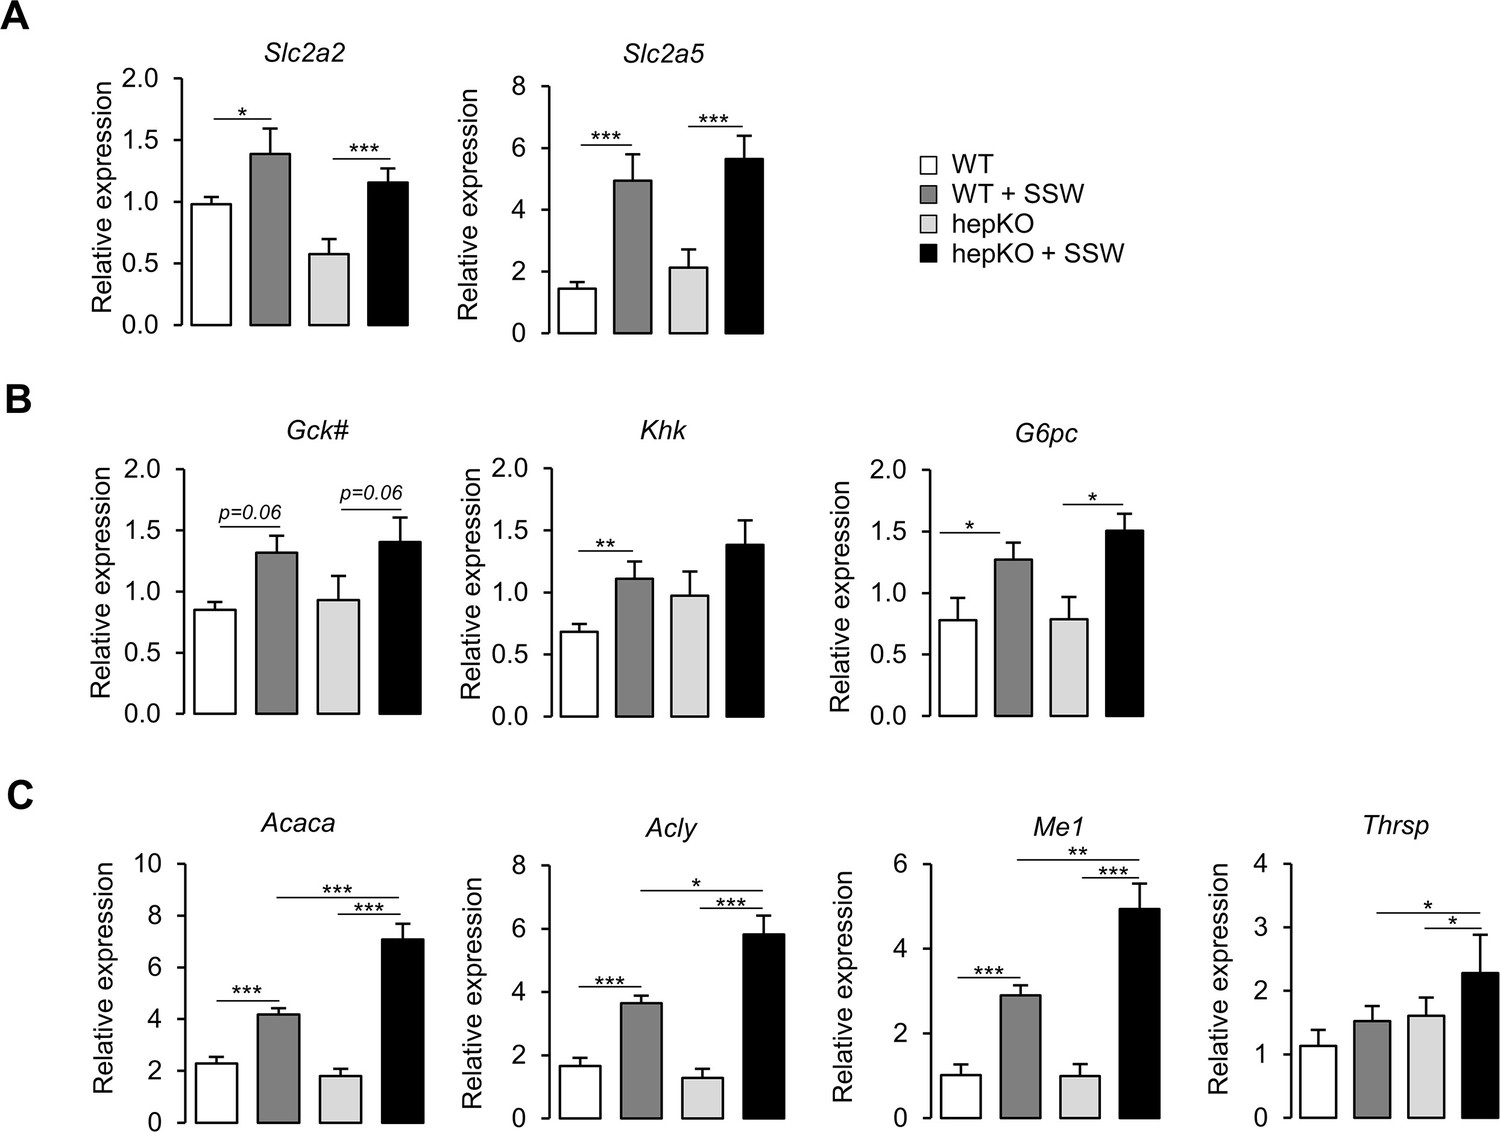
Altered metabolic gene expression in HepKO mice challenged with high sugar.
(A) Expression of Slc2a2 and Slc2a5. (B) Expression of Gck, Khk, and G6pc. (C) Expression of Acaca, Acly, Me1, and Thrsp. (A–C) Expression determined at ZT15 in WT and HepKO mice given a chow or chow + sugar-sweetened water (SSW) diet (mean ± SEM, n = 6–8). The # symbol denotes a direct KLF10 target. Statistics: nnparametric Kruskal–Wallis test. *p<0.05; ***p<0.005.
Figure 6 with 1 supplement
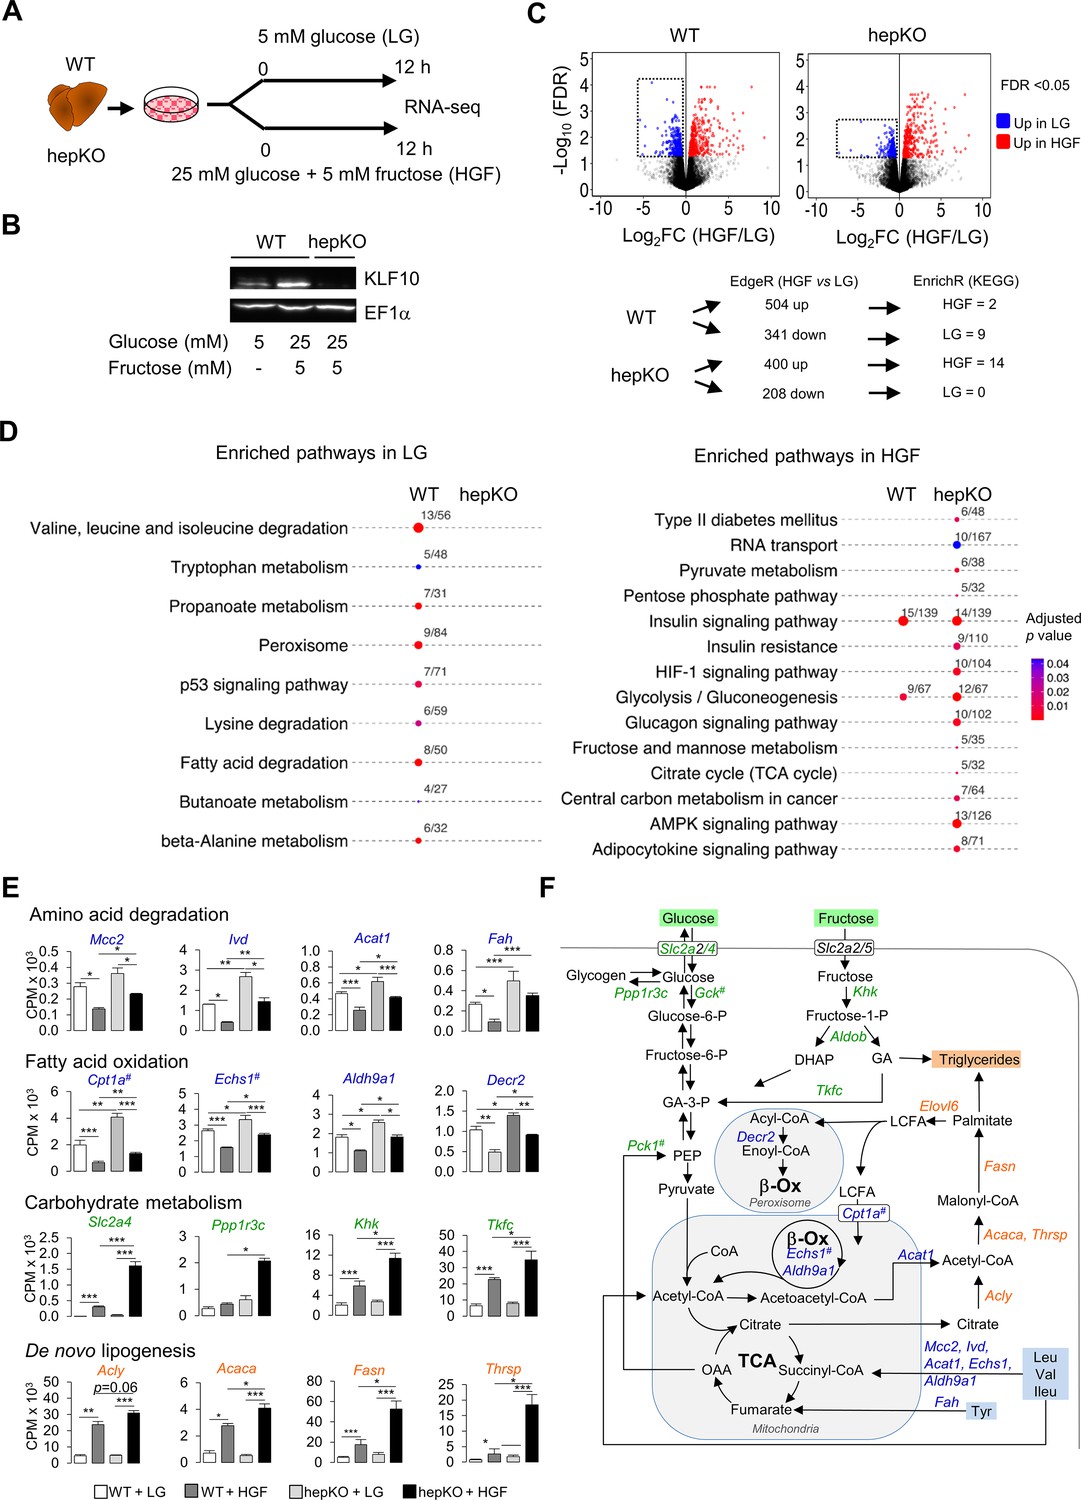
KLF10 governs the transcriptional response to hexose sugars in hepatocytes.
(A) Schematic illustrating the design of the in vitro sugar challenge experiment in WT and HepKO hepatocytes treated with low glucose (LG) or high glucose and fructose (HGF). (B) Representative immunoblot showing KLF10 protein abundance in WT hepatocytes treated with LG or HGF and in HepKO primary hepatocytes treated with HGF. EF1α was used as loading control. (C) Top: volcano plots showing changes in gene expression in WT and HepKO hepatocytes treated with LG or HGF. Positive fold change (FC) values represent genes upregulated under HGF condition, and negative FC values represent genes upregulated under LG conditions. Genes significantly upregulated (FDR < 0.5) and displaying an FC > 2 in HGF (red dots) and in LG (blue dots) conditions. Dashed horizontal lines: FDR = 0.05; dashed vertical lines: FC = 2. Boxed areas highlight the larger number of downregulated genes in WT compared to HepKO hepatocytes. Bottom: summary of differential gene expression (DGE) data shown in the volcano plots and of the enrichment analysis. (D) Kyoto Encyclopedia of Genes and Genomes-enriched pathways in WT and HepKO primary hepatocytes treated with LG or HGF. (E) Expression profiles of genes associated with key metabolic pathways in WT and HepKO primary hepatocytes treated with LG or HGF (mean ± SEM, n = 3). (F) A schematic of key metabolic pathways in hepatocytes. Genes significantly upregulated in HepKO vs. WT hepatocytes when treated with HGF are highlighted on the schematic. DHAP: dihydoxyacetone phosphate; LCFA: long-chain fatty acids; GA: glyceraldehyde; OAA: oxaloacetic acid; PEP: phosphor-enol-pyruvate. In (E) and (F), the # symbol denotes a direct KLF10 target. Statistics: nonparametric Kruskal–Wallis test. *p<0.05; **p<0.01; ***p<0.005.
-
Figure 6—source data 1
Differentially expressed genes in WT and HepKO hepatocytes challenged with high sugar compared to unchallenged cells.
- https://cdn.elifesciences.org/articles/65574/elife-65574-fig6-data1-v2.xlsx
-
Figure 6—source data 2
Kyoto Encyclopedia of Genes and Genomes-enriched pathway in WT and HepKO hepatocytes challenged with high sugar compared to unchallenged cells.
- https://cdn.elifesciences.org/articles/65574/elife-65574-fig6-data2-v2.xlsx
-
Figure 6—source data 3
Values and statistical test results for Figure 6E and Figure 6—figure supplement 1.
- https://cdn.elifesciences.org/articles/65574/elife-65574-fig6-data3-v2.xlsx
Figure 6—figure supplement 1
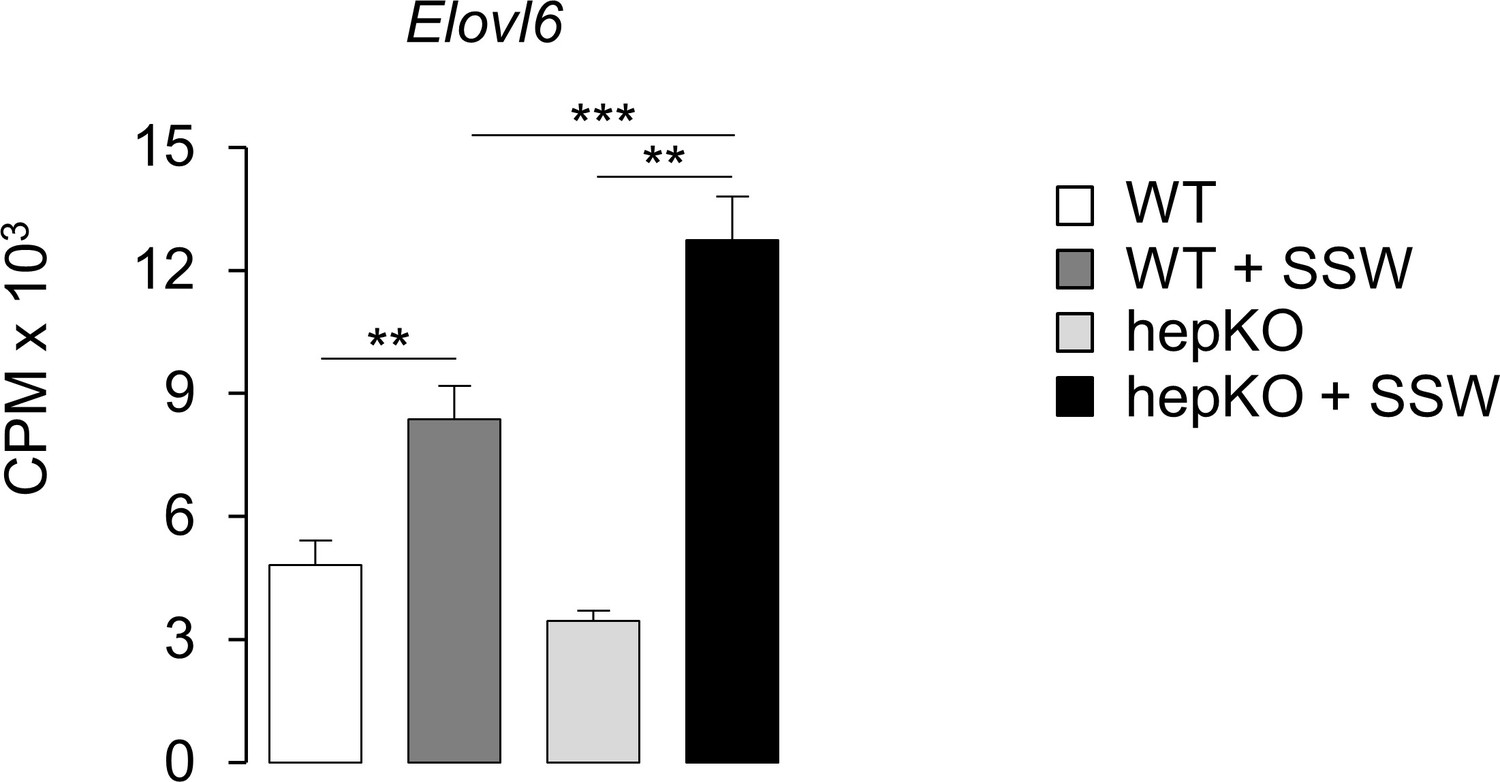
KLF10 governs the transcriptional response to hexose sugars in hepatocytes.
Expression of Elovl6 in WT and HepKO primary hepatocytes treated with low glucose (LG) or high glucose and fructose (HGF) (mean ± SEM, n = 3). Statistics: nonparametric Kruskal–Wallis test. **p<0.01; ***p< 0.005.
Figure 7 with 1 supplement
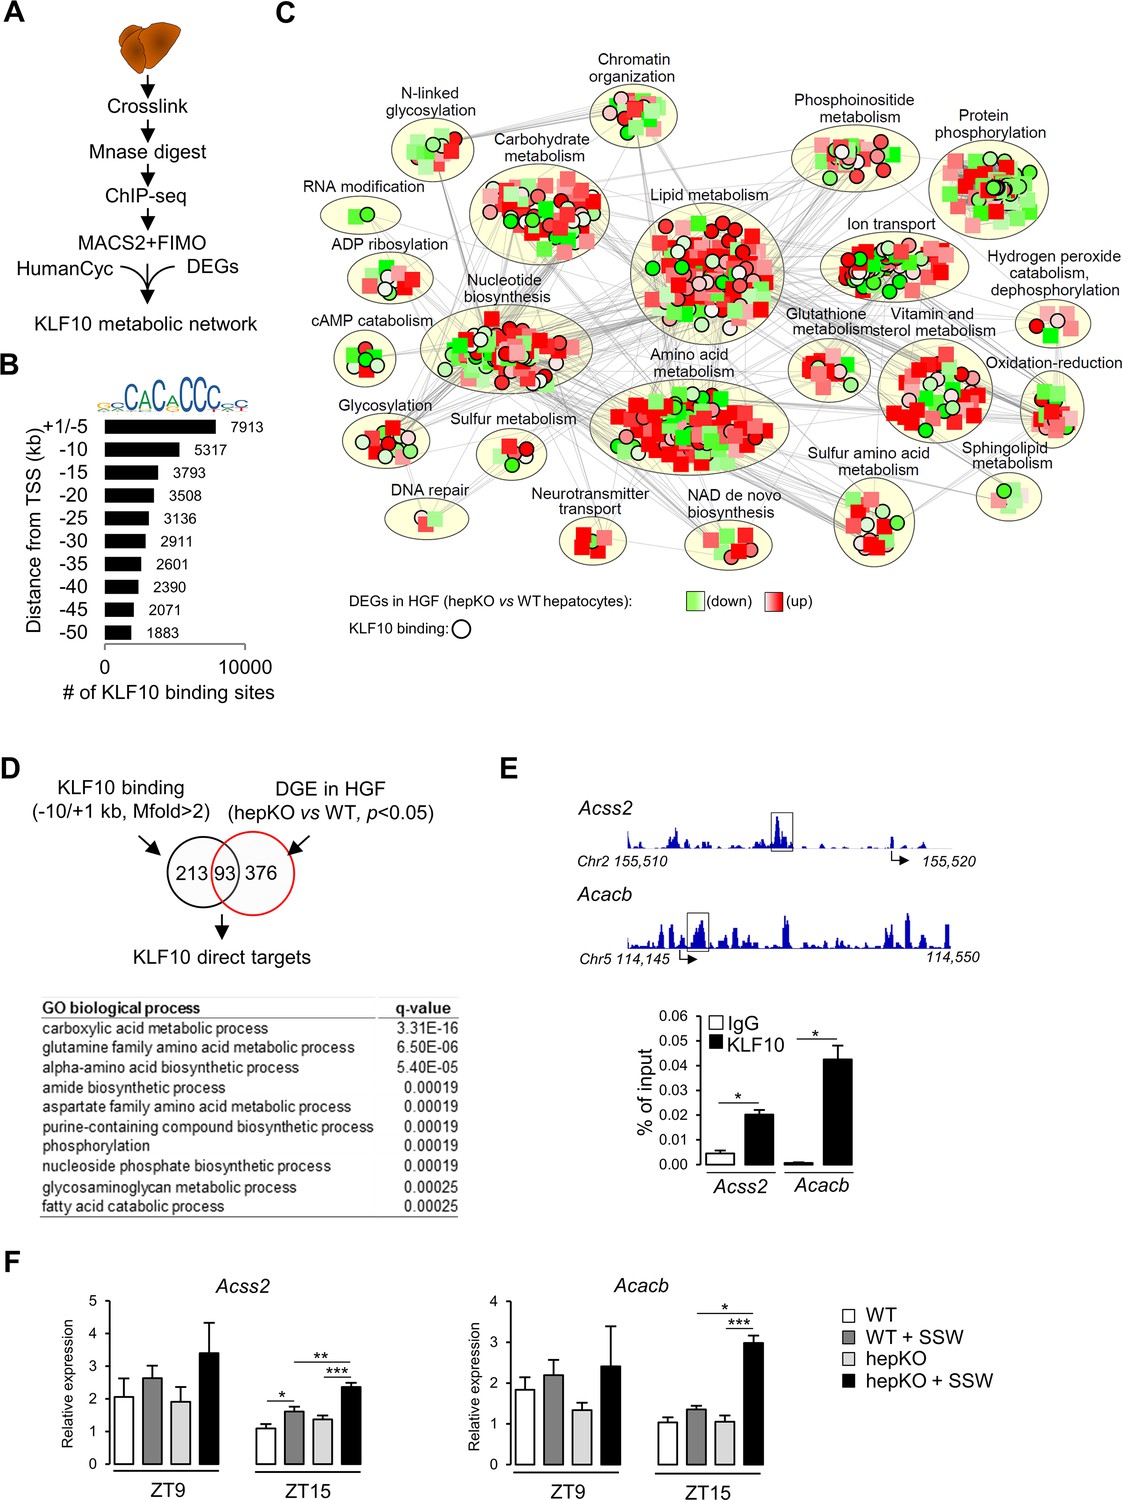
KLF10 regulates a large metabolic network in the liver.
(A) Schematic illustrating the workflow used to identify KLF10 bound loci in mouse liver at ZT9. (B) Jaspar logo representing the KLF10 response element DNA sequence and distribution of KLF10 binding sites in mouse liver as a function of distance to the transcription start site. (C) Visualization of the KLF10 metabolic network constructed with Cytoscape using as inputs ChIP-seq data from mouse liver at ZT9, DGE data in high glucose and fructose (HGF)-treated hepatocytes and the HumanCyc metabolic network, (D) Venn diagram showing the number of direct KLF10 targets (top) and their associated GO biological process annotation (bottom). (E) ChIP-seq tracks near the Acss2 and Acacb promoters (left) and ChIP of the boxed region at ZT15 in the liver of WT mice fed the chow + sugar-sweetened water (SSW) diet (right) (mean ± SEM, n = 4–6). (F) Expression of Acss2 and Acacb at ZT9 and ZT15 in the liver of WT and HepKO mice given a chow or chow + SSW diet (mean ± SEM, n = 4–6). Statistics: nonparametric Kruskal–Wallis test. *p<0.05; **p<0.01; ***p<0.005.
-
Figure 7—source data 1
Genes bound by KLF10 in their –10/+1 kb region or differentially expressed in WT vs. HepKO hepatocytes challenged with high sugar.
- https://cdn.elifesciences.org/articles/65574/elife-65574-fig7-data1-v2.xlsx
-
Figure 7—source data 2
Cytoscape file used to generate, visualize, and analyze the KLF10 regulated metabolic network.
- https://cdn.elifesciences.org/articles/65574/elife-65574-fig7-data2-v2.cys
-
Figure 7—source data 3
Values and statistical test results for Figure 7E and F.
- https://cdn.elifesciences.org/articles/65574/elife-65574-fig7-data3-v2.xlsx
Figure 7—figure supplement 1
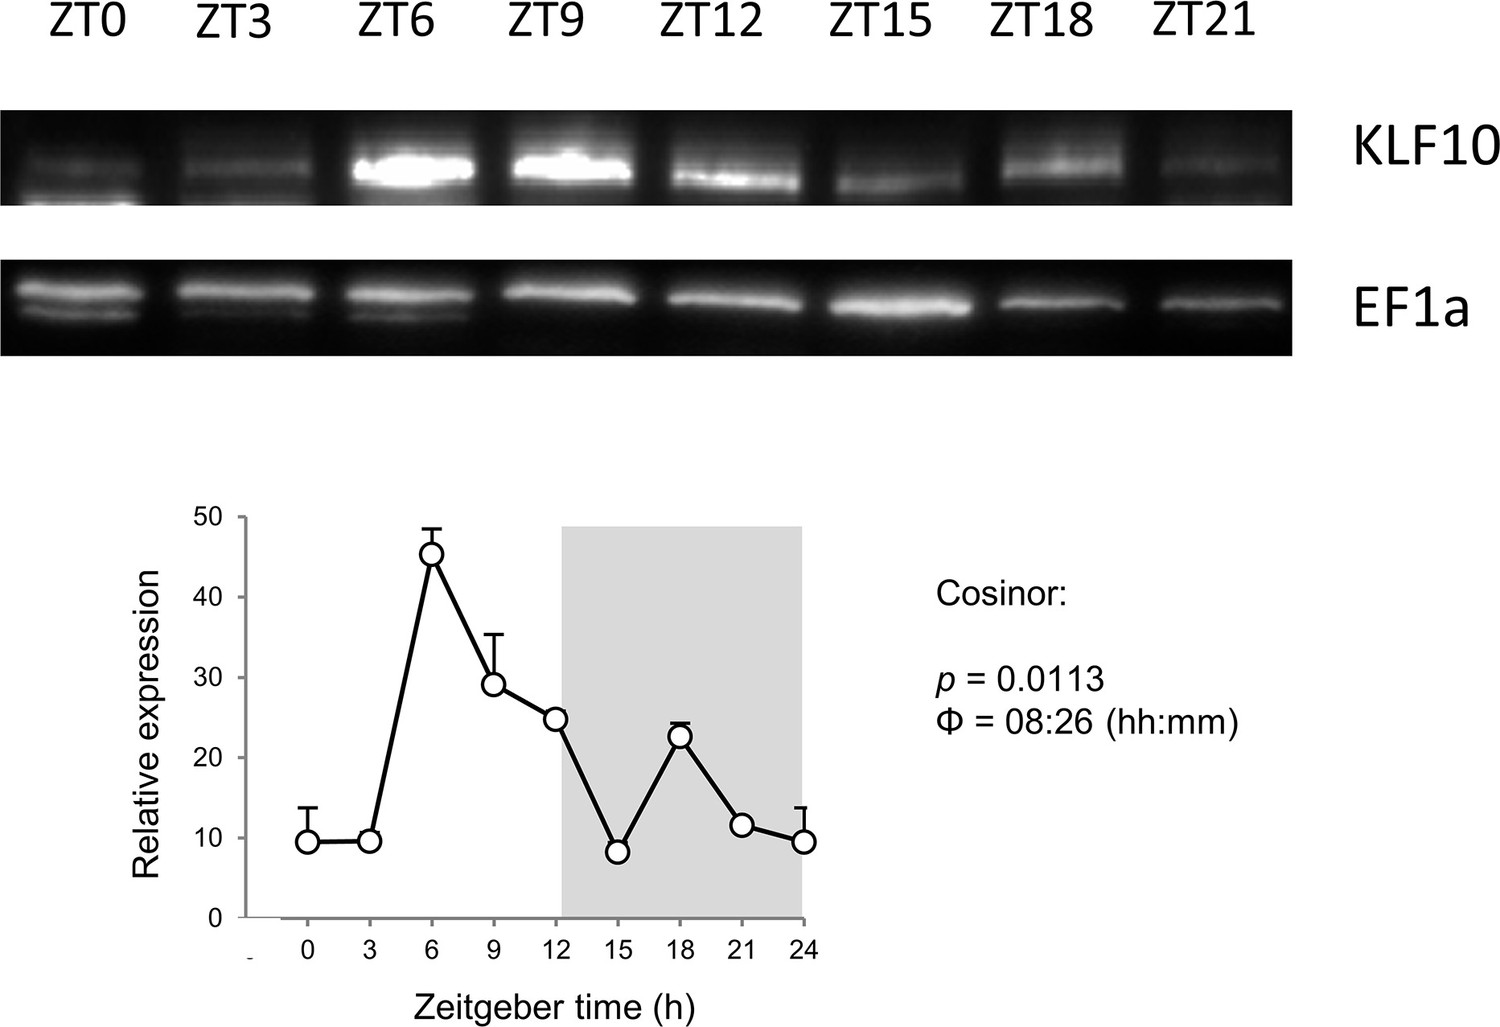
KLF10 regulates a large metabolic network in liver.
(Top) Immunoblot showing the oscillation of KLF10 protein abundance in the liver of mice entrained in a light/dark (LD) 12:12 cycle. (Bottom) Quantification and cosinor analysis of two independent time series.
Author response image 1
Tables
Key resources table
| Reagent type (species) or resource | Designation | Source or reference | Identifiers | Additional information |
|---|---|---|---|---|
| Genetic reagent (Mus musculus, C57BL/6) | WT | Weng et al., 2017 | Klf10flox/flox controls; used males for experiments | |
| Genetic reagent (Mus musculus, C57BL/6) | Alb-CreERT2 | Schuler et al., 2004 | ||
| Genetic reagent (Mus musculus, C57BL/6) | hepKO | This study | Used males for experiments | |
| Cell line (Mus musculus) | WT | This study | Primary heaptocytes from males; used 150,000–250,000 cells per plate as indicated | |
| Cell line (Mus musculus) | hepKO | This study | Primary hepatocytes from males; used 150,000–250,000 cells per plate as indicated | |
| Biological sample (Mus musculus) | Liver, heart, kidney, spleen, lung, white adipose tissue | This study | ||
| Biological sample (Mus musculus) | Blood | This study | ||
| Antibody | Anti-KLF10 (mouse monoclonal) | CDI Laboratories | Cat. #m14-355 | WB (1:800) |
| Antibody | Anti-EGF1a (mouse monoclonal) | Upstate signaling solutions | Cat. #05-235 | WB (1:1000) |
| Antibody | Anti-IgG (goat polyclonal) | Sigma | Cat. #A4416 | WB (1:40,000) |
| Commercial assay or kit | Glucose Hexokinase Assay Kit | Sigma | Cat. #GAHK20-1KT | |
| Commercial assay or kit | PowerUp SYBR green Master Mix | Applied Biosystems | Cat. #A25779 | |
| Commercial assay or kit | QIAquick PCR Purification Kit | Qiagen | Cat. #2810 | |
| Commercial assay or kit | Triglycerides colorimetric assay kit | Cayman | Cat. #10010303 | |
| Commercial assay or kit | NucleoSpin RNA | Macherey-Nagel | Cat. #740955250 | |
| Commercial assay or kit | RNeasy mini kit | QIAGEN | Cat. #74104 | |
| Commercial assay or kit | NEBNext Ultra RNA Library Prep Kit for Illumina | New England Biolabs | Cat. #E7530S | |
| Commercial assay or kit | QubitTM dsDNA HS Assay Kit | Invitrogen | Cat. #Q32854 | |
| Commercial assay or kit | Glucose Uptake-Glo Assay | Promega | Cat. #J1341 | |
| Commercial assay or kit | Mouse Insulin Elisa | Mercodia | Cat. #10-1247-01 | |
| Commercial assay or kit | Glucose (GOD-PAP) | Randox | Cat. #8318 | |
| Chemical compound, drug | DMEM, low glucose, GlutaMAX Supplement, pyruvate | Gibco | Cat. #21885025 | |
| Chemical compound, drug | DMEM, high glucose, GlutaMAX Supplement, pyruvate | Gibco | Cat. #10569010 | |
| Chemical compound, drug | DMEM, glucose-free | Gibco | Cat. #11966025 | |
| Chemical compound, drug | William’s E medium | Gibco | Cat. #22551022 | |
| Chemical compound, drug | Dexamethasone | Sigma | Cat. #D0700000 | Used 10 nM final concentration |
| Chemical compound, drug | Insulin-selenium-transferrin mix | Gibco | Cat. #41400045 | Used 1× final concentration |
| Chemical compound, drug | Insulin (human, recombinant zinc) | Thermo Fisher Scientific | Cat. #12585014 | Used 860 nM final concentration |
| Chemical compound, drug | Percoll | GE Healthcare | Cat. #17089101 | |
| Chemical compound, drug | Protein G Dynabeads | Thermo Fisher Scientific | Cat. #10003D | |
| Chemical compound, drug | Complete protease inhibitor cocktail | Roche | Cat. #11836153001 | |
| Chemical compound, drug | Collagenase CLS3 | Worthington | Cat. #WOLS04180 | Used 500 U/mL final concentration |
| Chemical compound, drug | Collagenase CLS4 | Worthington | Cat. #WOLS04186 | Used 500 U/mL final concentration |
| Chemical compound, drug | Amyloglucosidase | Sigma | Cat. #11202332001 | Used 2 mg/mL final concentration |
| Chemical compound, drug | SuperScript II Reverse Transcriptase | Invitrogen | Cat. #18064014 | Used 200 U per reaction |
| Chemical compound, drug | Micrococcal nuclease | Thermo Fisher Scientific | Cat. #88216 | Used 80 U per reaction |
| Chemical compound, drug | Protein G Dynabeads | Thermo Fisher Scientific | Cat. #10003D | |
| Software, algorithm | R | Bioconductor | https://www.bioconductor.org/ | |
| Software, algorithm | Trimmomatic | Bolger et al., 2014 | http://www.usadellab.org/cms/ | |
| Software, algorithm | FastQC | Babraham Institute | https://www.bioinformatics.babraham.ac.uk/projects/fastqc/ | |
| Software, algorithm | FASTQ Groomer | Galaxy project | https://sourceforge.net/projects/fastqgroomer/ | |
| Software, algorithm | Bowtie2 | Langmead and Salzberg, 2012 | https://github.com/BenLangmead/bowtie2 | RRID: SCR_016368 |
| Software, algorithm | BEDtools | Quinlan and Hall, 2010 | https://github.com/arq5x/bedtools2 | RRID: SCR_006646 |
| Software, algorithm | Rsubread (featureCounts) | Liao et al., 2014 | https://git.bioconductor.org/packages/Rsubread | RRID: SCR_009803 |
| Software, algorithm | MetaCycle | Wu et al., 2016 | https://github.com/gangwug/MetaCycleApp | |
| Software, algorithm | Phase Set Enrichment Analysis | Zhang et al., 2016 | https://github.com/ranafi/PSEA | |
| Software, algorithm | MACS2 | Feng et al., 2012 | https://pypi.org/project/MACS2/ | |
| Software, algorithm | GREAT | McLean et al., 2010 | http://great.stanford.edu/public/html/splash.php | |
| Software, algorithm | FIMO | Bailey et al., 2015 | http://meme-suite.org/tools/fimo | |
| Software, algorithm | FastHeinz | Beisser et al., 2010 | https://www.bioconductor.org/packages/release/bioc/html/BioNet.html | |
| Software, algorithm | clusterMaker2 | Morris et al., 2011 | http://www.rbvi.ucsf.edu/cytoscape/clusterMaker2/ | |
| Software, algorithm | Bingo | Maere et al., 2005 | https://github.com/cytoscape/BiNGO | |
| Software, algorithm | Cytoscape | Shannon et al., 2003 | https://cytoscape.org/ | |
| Other | Qubit fluorometer | Thermo Fisher Scientific | Cat. #Q33238 | |
| Other | FreeStyle InsuLinx glucometer | Abbott | N/A | |
| Other | Laboratory rodent chow diet | Safe diets | Cat. #R03-25 | |
| Other | Apistar syrup (organic) | ICKO | Cat. #HC406 |
Additional files
-
Supplementary file 1
Primers used in the study.
- https://cdn.elifesciences.org/articles/65574/elife-65574-supp1-v2.xlsx
-
Transparent reporting form
- https://cdn.elifesciences.org/articles/65574/elife-65574-transrepform1-v2.docx
Download links
A two-part list of links to download the article, or parts of the article, in various formats.
Downloads (link to download the article as PDF)
Open citations (links to open the citations from this article in various online reference manager services)
Cite this article (links to download the citations from this article in formats compatible with various reference manager tools)
KLF10 integrates circadian timing and sugar signaling to coordinate hepatic metabolism
eLife 10:e65574.
https://doi.org/10.7554/eLife.65574


