Tracking the relation between gist and item memory over the course of long-term memory consolidation
- Department of Psychology, University of Pennsylvania, United States
Figures
Figure 1
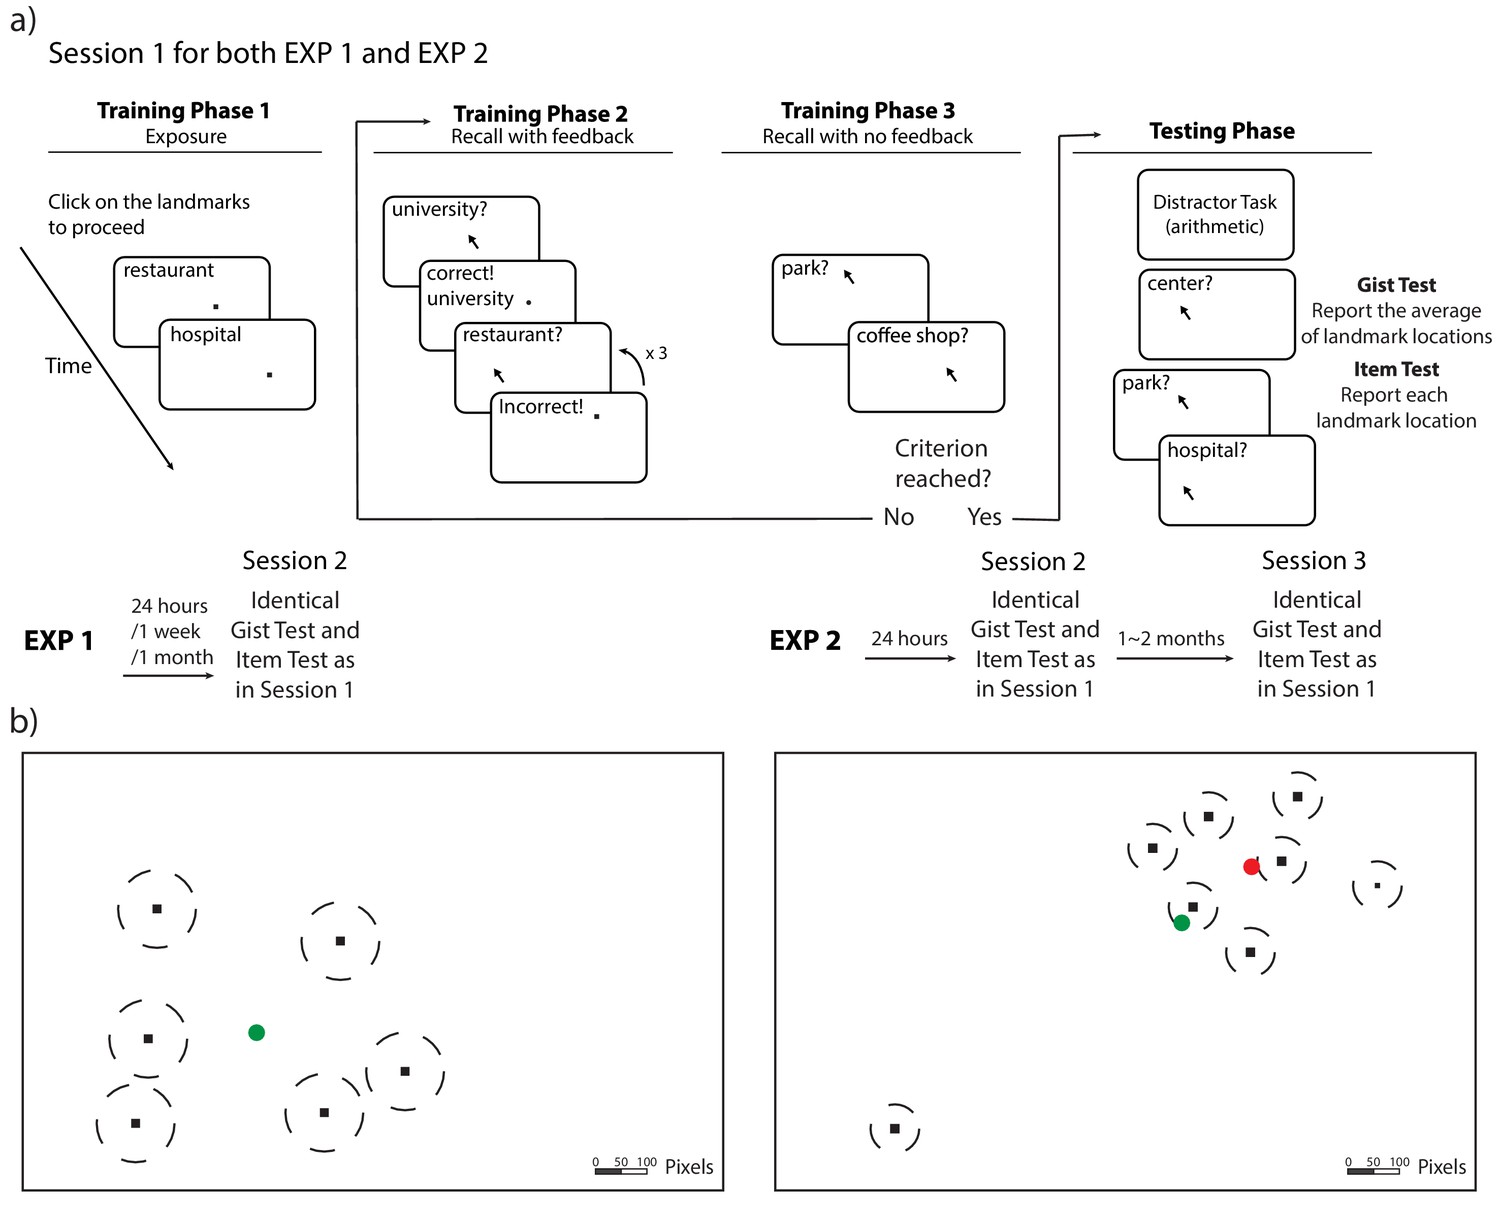
Procedure and stimuli for Experiments 1 and 2.
(a) Schematic illustration of the procedure for Experiments 1 and 2. The procedure of Session 1 is the same for Experiments 1 and 2 (with the exception of the number of trials). Participants completed cycles of encoding (with feedback) and evaluation (without feedback) until they could retrieve each landmark individually within the training criteria. (b) An illustration of the location of the stimuli (drawn to scale) for Experiments 1 and 2. The locations (black dots) were the same for all participants, but the mapping between the location and landmark name was randomized for each participant. The dash lines around the dots indicate the training criteria (80 pixels for Experiment 1 and 50 pixels for Experiment 2). The green circle indicates the center of these encoded locations and the red circle indicates the ‘local’ center of the encoded locations (excluding the outlier) in Experiment 2.
Figure 2 with 2 supplements
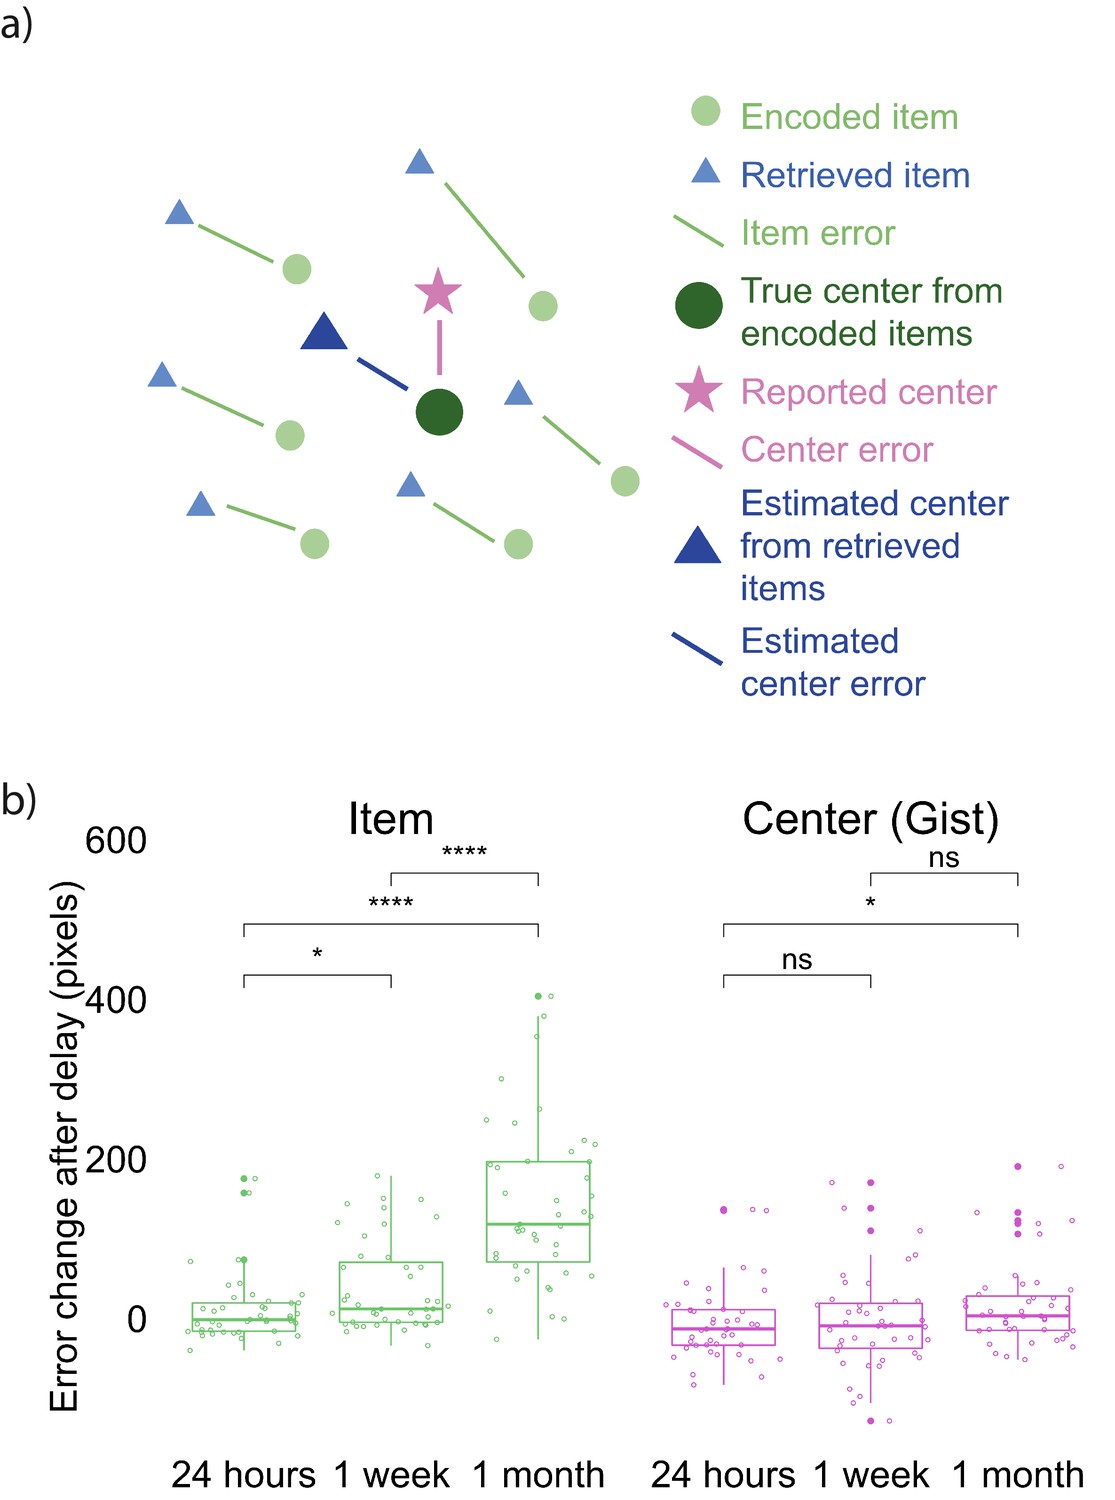
Error measurements and results.
(a) Error measurements. (b) Change in error by group and memory type (the band indicates the median, the box indicates the first and third quartiles, the whiskers indicate ± 1.5 × interquartile range, and the solid points indicate outliers). Greater values indicate an increase in error in Session 2 over Session 1. * indicates p < 0.05 and **** p < 0.0001 by Mann-Whitney tests. Figure 2—figure supplement 1 shows the absolute error for both item and gist memory at Sessions 1 and 2. Figure 2—figure supplement 2 shows the error change over time in reported gist, estimated gist, and simulated gist based on a simple item-only simulation (discussed at the end of Experiment 1 result section).
-
Figure 2—source data 1
Experiment 1 error change over time.
- https://cdn.elifesciences.org/articles/65588/elife-65588-fig2-data1-v3.csv
Figure 2—figure supplement 1
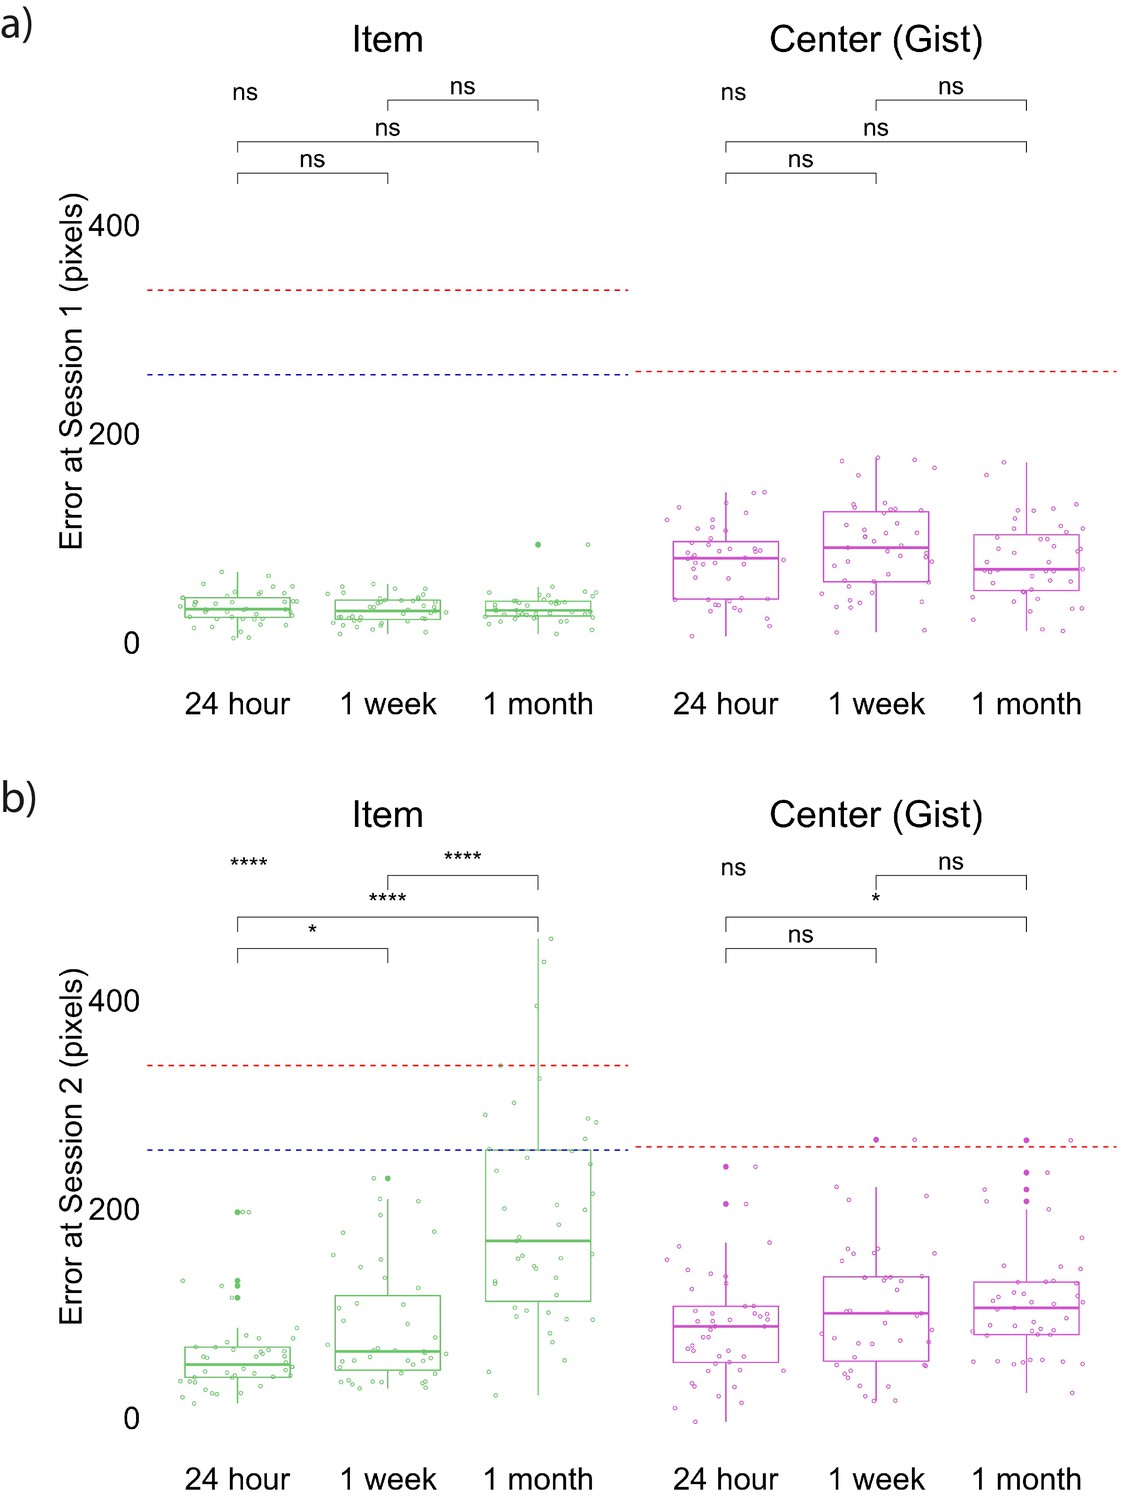
Experiment 1 error in item and gist memory at Session 1 (a) and at Session 2 (b).
* indicates p < 0.05, **** indicates p < 0.0001, and ns indicates p > 0.05 by t-tests between groups and ANOVA (top left). Red dashed lines indicate chance performance for item (defined as the average of distance between encoded item locations and center of the screen) and gist memory (defined as the distance between the center of encoded locations and center of the screen) based on center of the screen. Blue dashed lines indicate chance performance for item memory, based on the center of encoded locations. This corresponds to what participants’ performance would be if they only remembered the center and just clicked the center when asked to recall an item. The band indicates the median, the box indicates the first and third quartiles, the whiskers indicate ± 1.5 × interquartile range, and the solid points indicate outliers.
-
Figure 2—figure supplement 1—source data 1
Experiment 1 Session 1 error.
- https://cdn.elifesciences.org/articles/65588/elife-65588-fig2-figsupp1-data1-v3.csv
-
Figure 2—figure supplement 1—source data 2
Experiment 1 Session 2 error.
- https://cdn.elifesciences.org/articles/65588/elife-65588-fig2-figsupp1-data2-v3.csv
Figure 2—figure supplement 2
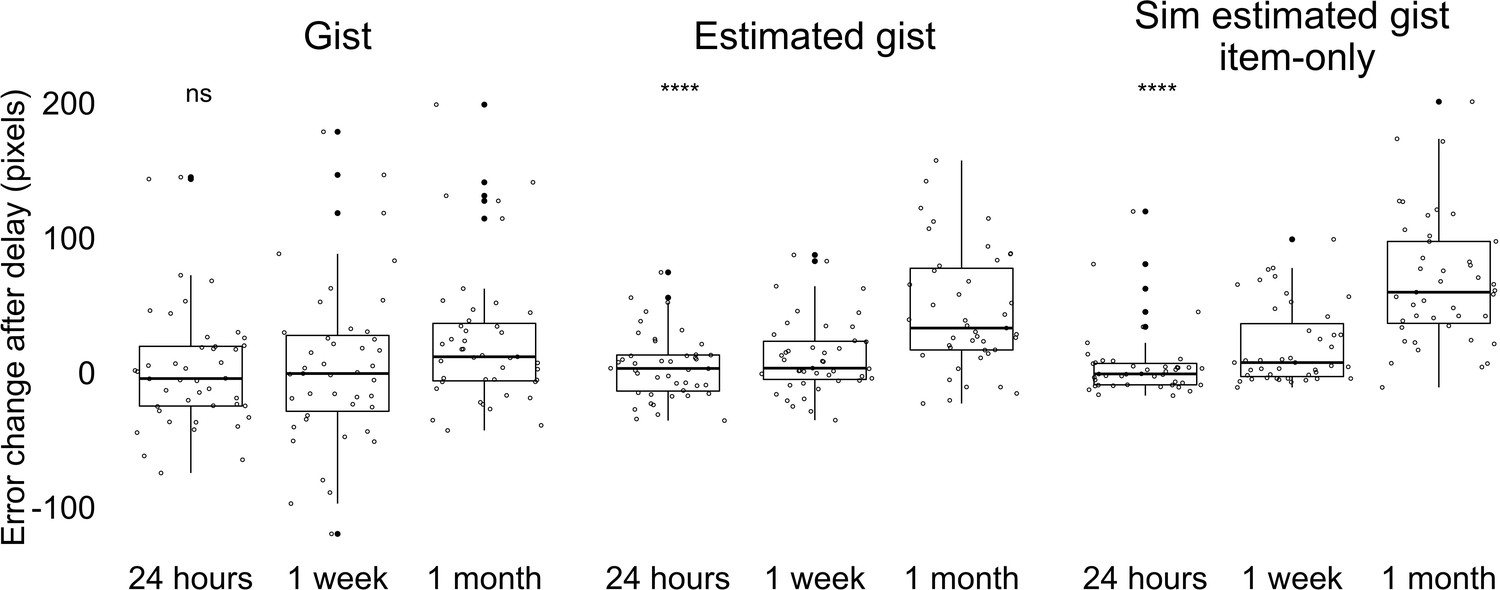
Experiment 1 error change between Session 1 and 2 in gist memory, estimated gist, and simulated estimated gist based on a simple item-only simulation.
Item-only simulation assumed that the magnitude of error for each item memory would remain the same but the direction of error would not be systematically influenced by the gist. [We generated 1000 simulations for each participant. Each simulation consisted of all simulated retrieved items, corresponding to all the landmark locations. For each location, we randomly generated a retrieved location based on the participant’s true error for this specific location, allowing angle to vary randomly across the simulations. Then, we computed the center for these locations to get the simulated estimated gist for each simulated participant. The error for such simulated estimated gist was the Euclidean distance between the true center and the simulated gist. The simulated estimated gist error for each real participant was the average value of simulated estimated gist error for their corresponding 1000 simulated participants]. Aligned rank transformed ANOVA analysis with three gist memory error type revealed a main effect of delay, F(2, 381) = 42.93, p < 0.001, memory type, F(2, 381) = 15.17, p < 0.001, and an interaction between delay and memory type, F(4, 381) = 3.83, p < 0.01, suggesting that the error increase over time was not the same for these gist memory types. For reported gist error (Gr) and simulated estimated gist error (sGe), we found a significant interaction between delay group and gist memory error type, F(2, 254) = 6.68, p = 0.001. For estimated gist error (Ge) and simulated estimated gist error, we also found a significant interaction between delay group and gist memory error type, F(2, 254) = 3.28, p = 0.039. Gist error and estimated gist error both increased less over time compared to the simulated estimated gist error under this simple item-only simulation over time, suggesting that participants’ data are not compatible with this simple item-only simulation. We did not find a significant interaction between Gr and Ge across time, F(2, 254) = 1.18, p = 0.31, consistent with the idea that Ge was calculated from item memories influenced by the center after delay. **** indicates p < 0.0001 and ns indicates p > 0.05 by ANOVA (top left). The band indicates the median, the box indicates the first and third quartiles, the whiskers indicate ± 1.5 × interquartile range, and the solid points indicate outliers.
-
Figure 2—figure supplement 2—source data 1
Experiment 1 error change in reported gist, estimated gist, and simulated estimated gist from an item-only simulation.
- https://cdn.elifesciences.org/articles/65588/elife-65588-fig2-figsupp2-data1-v3.csv
Figure 3
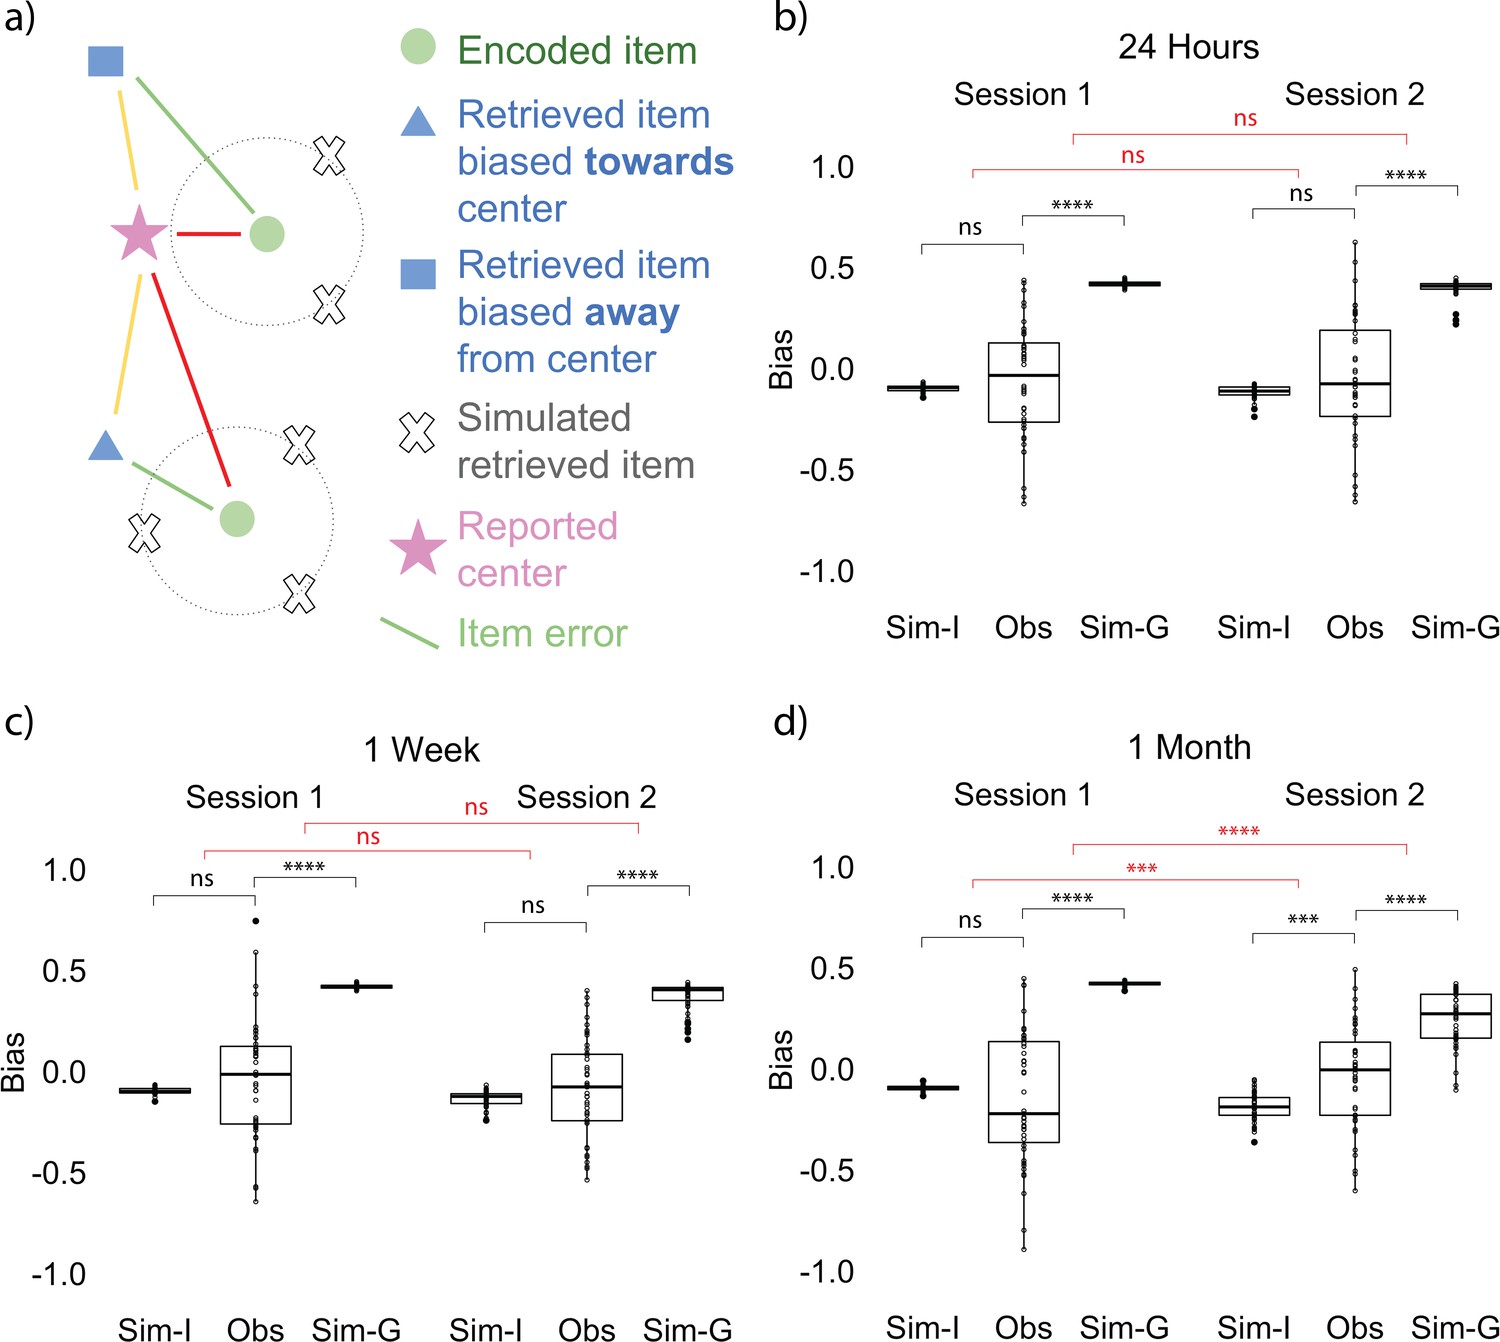
Bias measurement and results at each session.
(a) Bias measurement. The bias for each recalled location is (red - yellow) / green. The blue square is an example of a recalled item that is biased away from the reported center and the blue triangle is an example of a recalled item that is biased toward the reported center. Bias for each participant is an average of bias for all the locations. (b, c, d) Item-only simulated bias (Sim-I), observed bias (Obs), and gist simulated bias (Sim-G) at each session for delay groups of 24 hr, 1 week, and 1 month (the band indicates the median, the box indicates the first and third quartiles, the whiskers indicate ± 1.5 × interquartile range, and the solid points indicate outliers). * indicates p < 0.05, ** p < 0.01, *** p < 0.001, and **** p < 0.0001 by t-tests between observed bias and simulated biases (black) and t-tests comparing the difference in observed bias and simulated biases between sessions (red).
-
Figure 3—source data 1
Experiment 1 bias at each session.
- https://cdn.elifesciences.org/articles/65588/elife-65588-fig3-data1-v3.csv
Figure 4 with 1 supplement
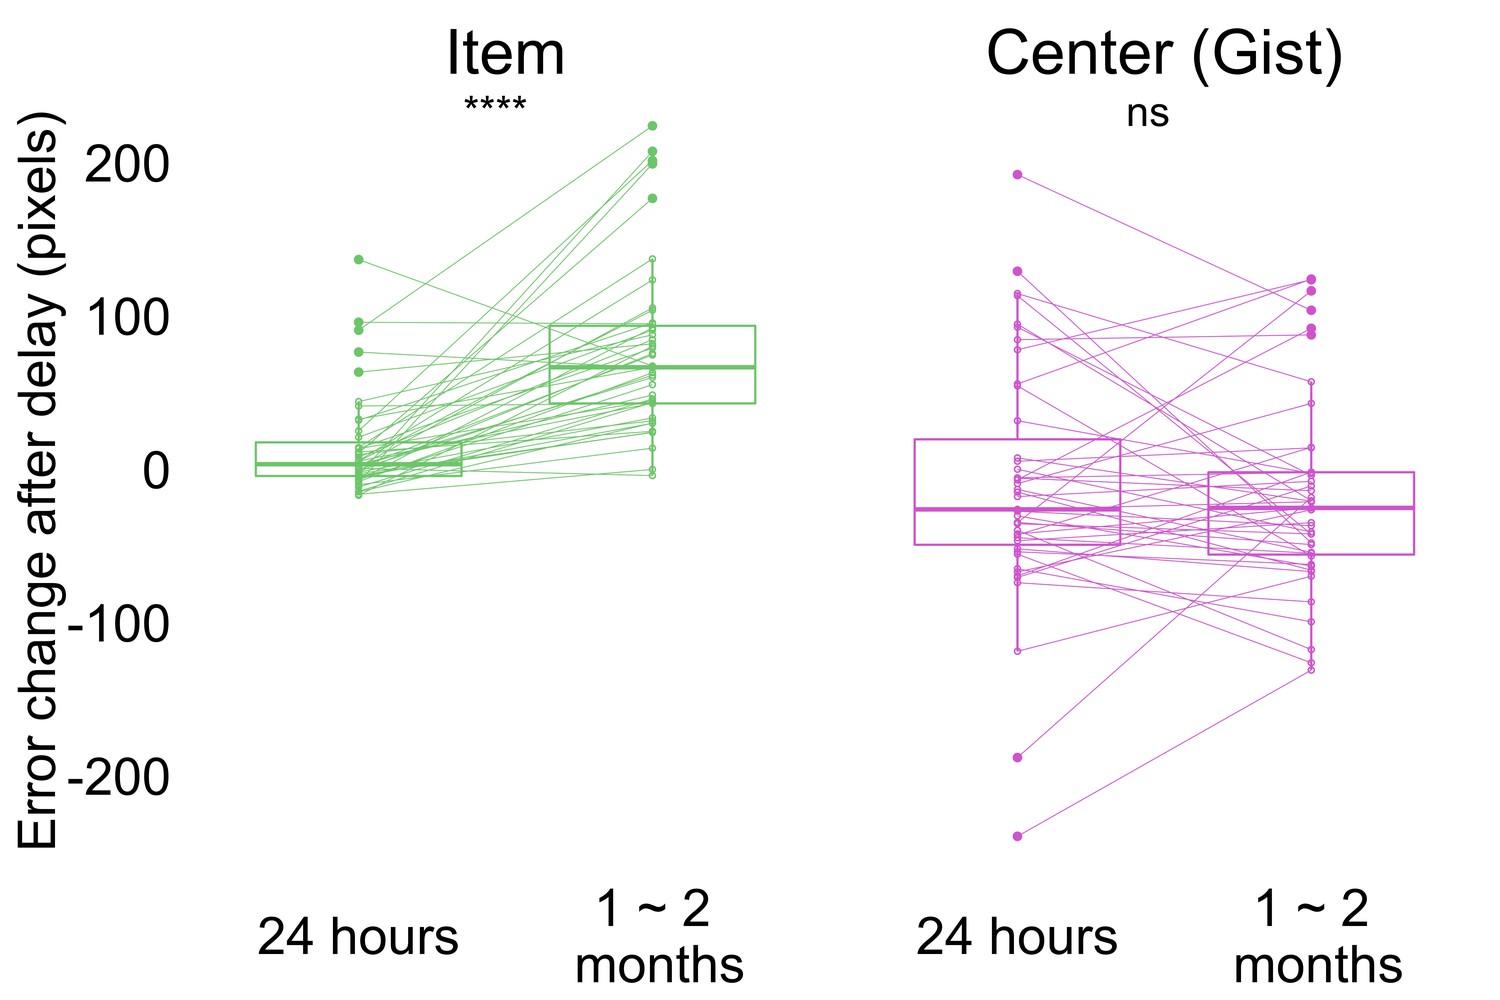
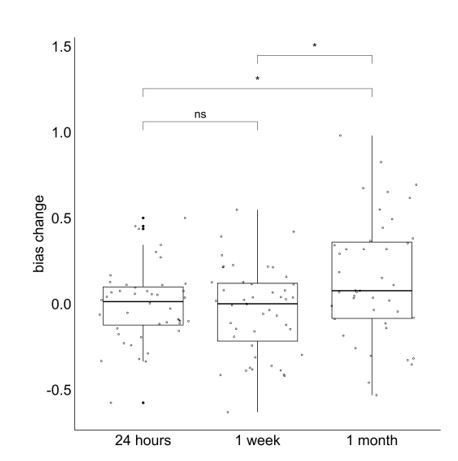
Change in error by delay and memory type (the band indicates the median, the box indicates the first and third quartiles, the whiskers indicate ± 1.5 × interquartile range, and the solid points indicate outliers).
Greater values indicate an increase in error from Session 1 after delay. **** p <0.0001 by Wilcoxon signed rank tests. Dots and lines indicate participants. Figure 4—figure supplement 1 shows the absolute error for both item and memory at all sessions.
-
Figure 4—source data 1
Experiment 2 error change over time.
- https://cdn.elifesciences.org/articles/65588/elife-65588-fig4-data1-v3.csv
Figure 4—figure supplement 1
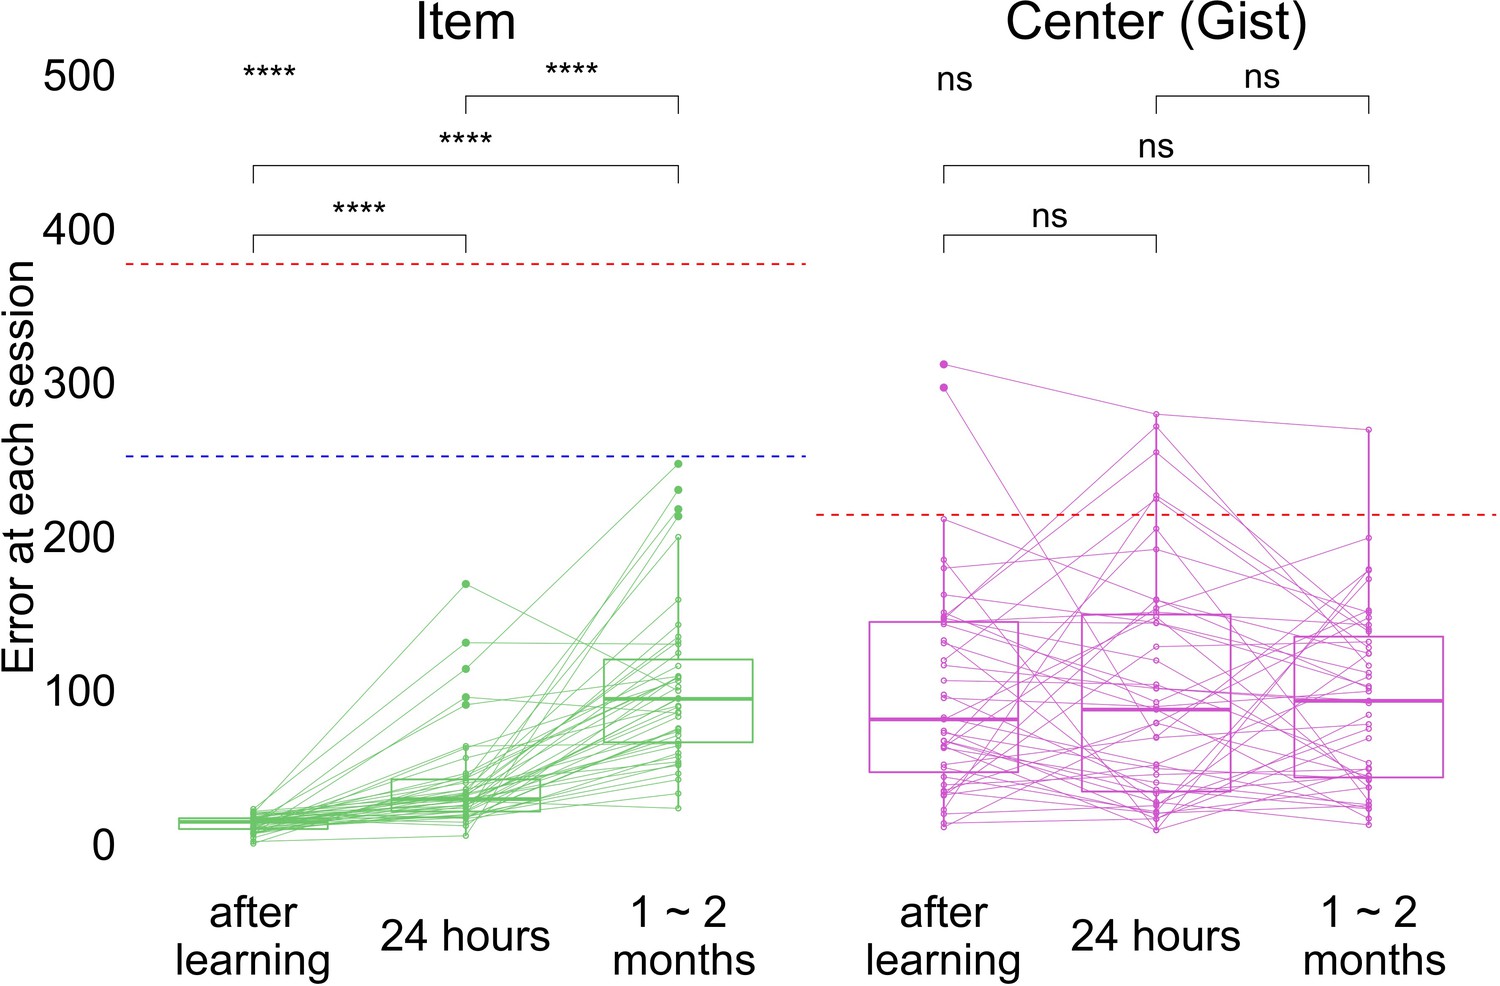
Experiment 2 error in item and gist (center) memory at each session.
Red dashed lines indicate chance performance for item (defined as the average of distance between encoded item locations and center of the screen) and gist memory (defined as the distance between the center of encoded locations and center of the screen) based on center of the screen. Blue dashed lines indicate chance performance for item memory, based on the center of encoded locations. **** indicates p < 0.0001 by paired t-tests and ANOVA (top left). The band indicates the median, the box indicates the first and third quartiles, the whiskers indicate ± 1.5 × interquartile range, and the solid points indicate outliers. Dots and lines indicate participants.
Figure 5
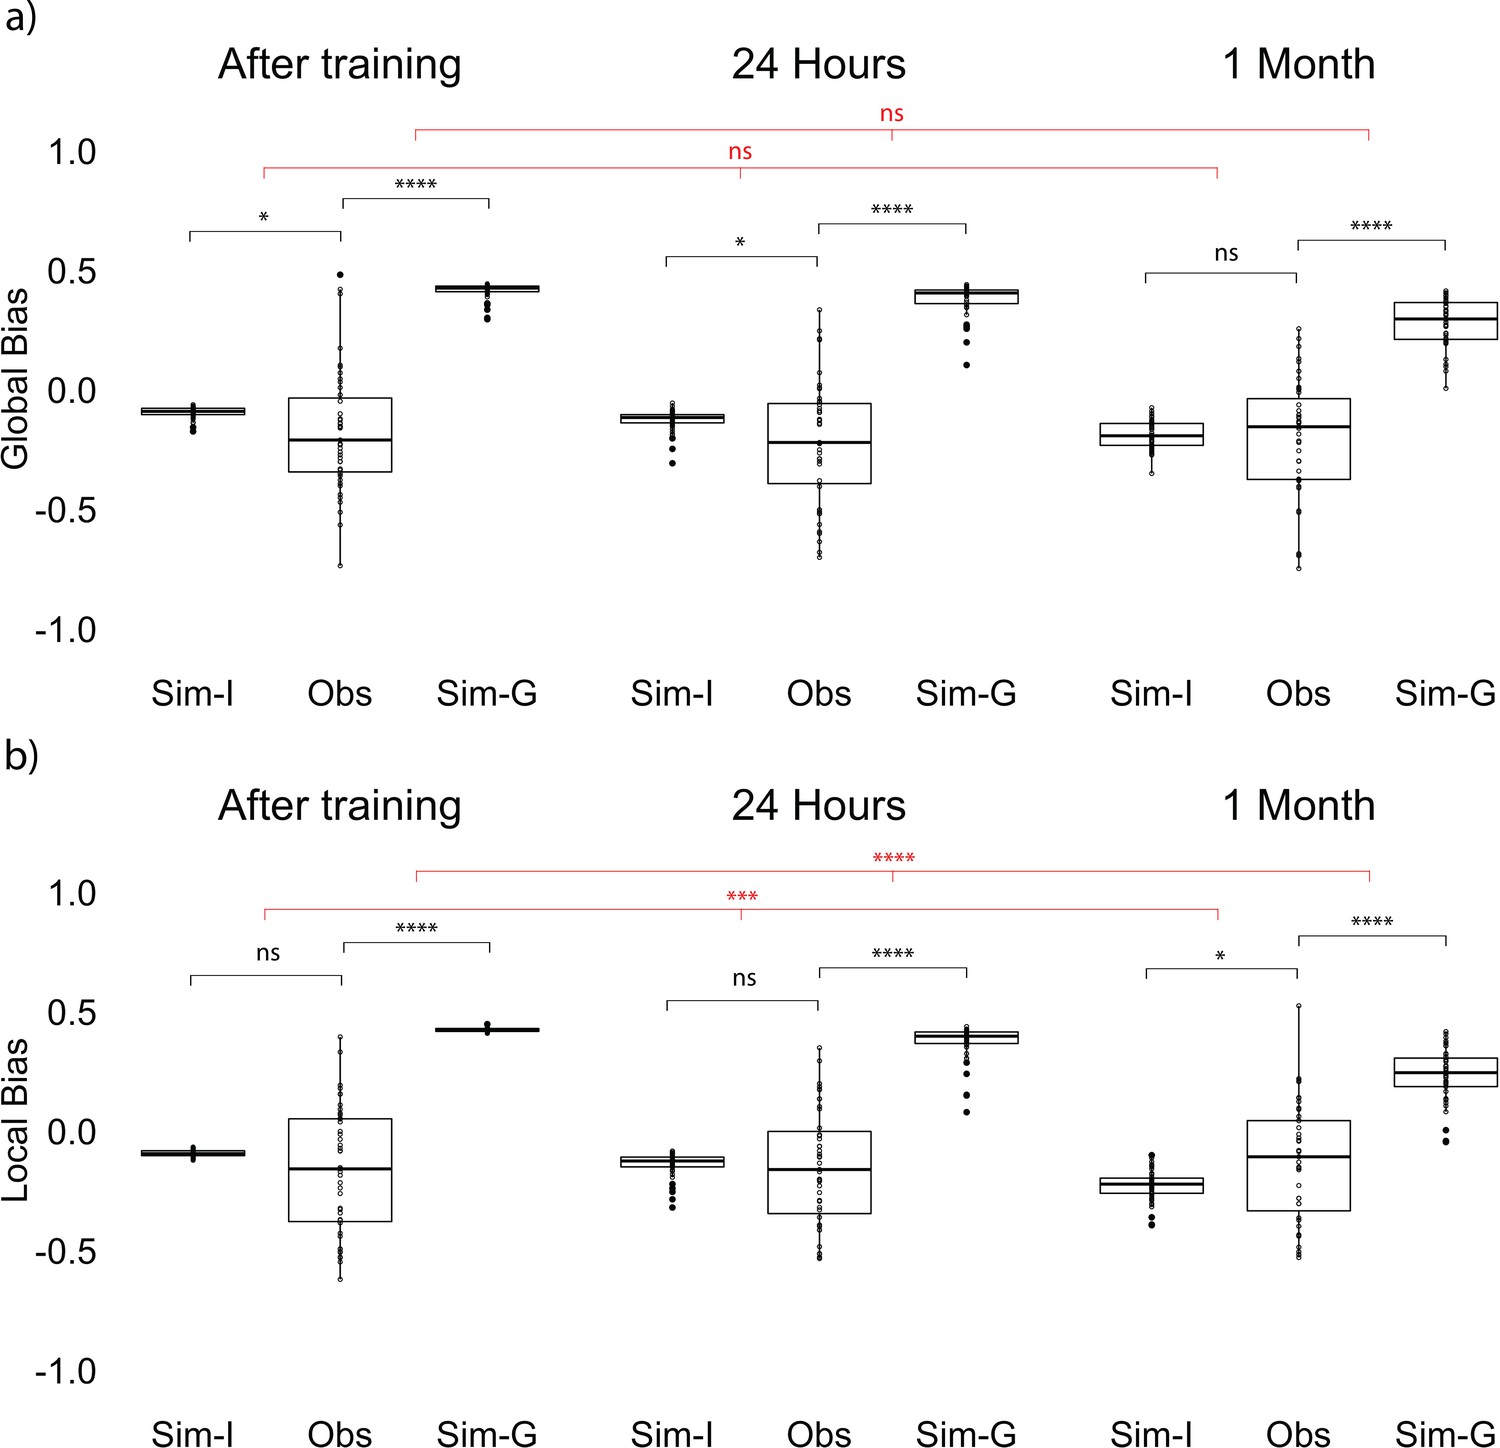
Global and local bias at each session.
(a) Global observed bias (Obs), item-only simulated bias (Sim-I), and gist simulated bias (Sim-G) at each session. Global bias uses the report center. (b) Local observed bias (Obs), item-only simulated bias (Sim-I), and gist simulated bias (Sim-G) at each session. Local bias excludes the outlier item when estimating the center. The band indicates the median, the box indicates the first and third quartiles, the whiskers indicate ± 1.5 × interquartile range, and the solid points indicate outliers. * indicates p < 0.05, *** p < 0.001, and **** p < 0.0001 by paired t-tests between observed data and simulation (black) and repeated measures ANOVA comparing the difference in data and simulations across sessions (red).
-
Figure 5—source data 1
Global bias at each session.
- https://cdn.elifesciences.org/articles/65588/elife-65588-fig5-data1-v3.csv
-
Figure 5—source data 2
Local bias at each session.
- https://cdn.elifesciences.org/articles/65588/elife-65588-fig5-data2-v3.csv
Figure 6
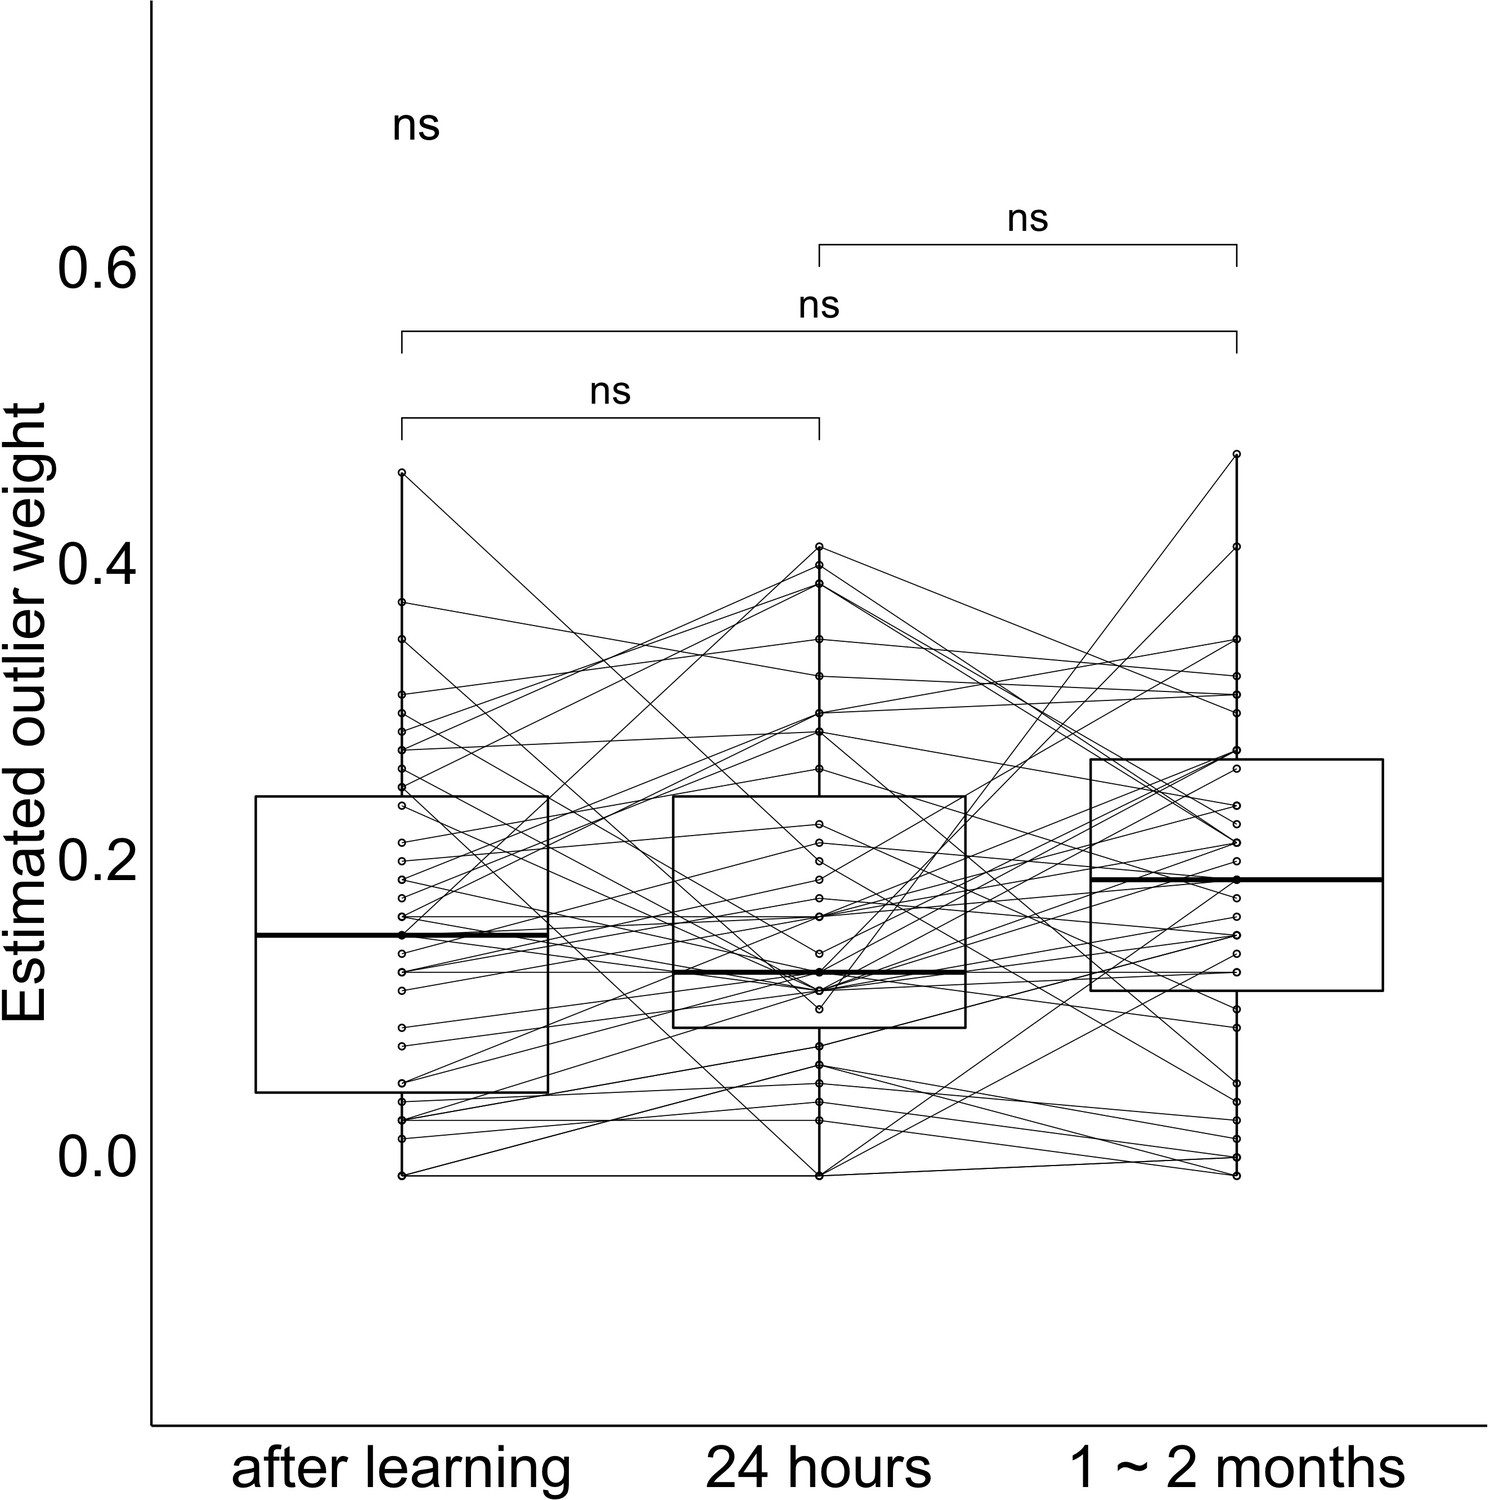
Outlier weight values at each session.
The band indicates the median, the box indicates the first and third quartiles, the whiskers indicate ± 1.5 × interquartile range. Dots and lines indicate participants.
-
Figure 6—source data 1
Outlier weight at each session.
- https://cdn.elifesciences.org/articles/65588/elife-65588-fig6-data1-v3.csv
Figure 7
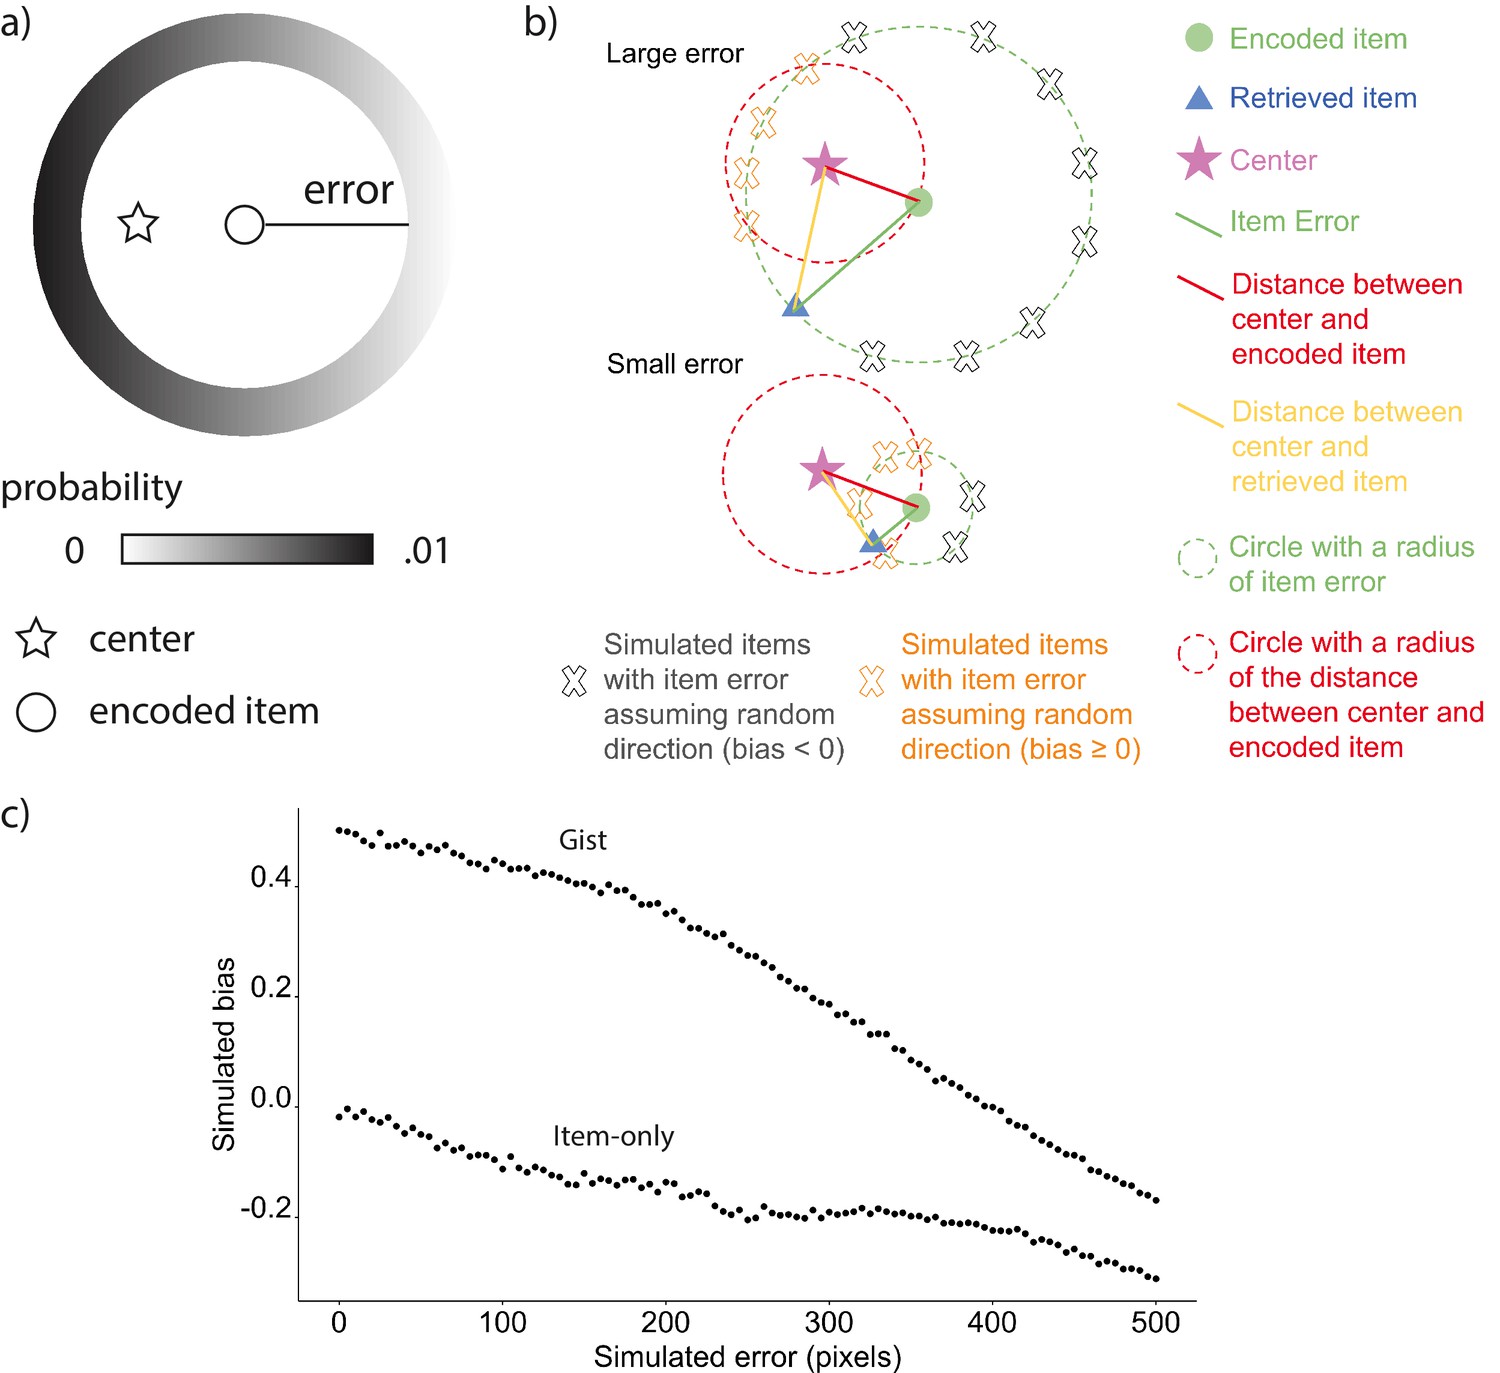
Simulated bias controlling for error.
(a) An example of the probability of simulated locations to be generated for an encoded location given the same extent of error in gist simulation. (b) Items with large errors are more likely to have a negative absolute bias by chance. First, the proportion of the arc with negative absolute bias in the circumference of simulated items is higher for items with large error. Because the distance between any points on the arc defined by the intersection between the green circle and red circle to the center will be shorter than the red distance, the points will all have an absolute bias value ≥ 0 (indicated by orange X marks), whereas the points outside of the arc will have a negative bias (indicated by gray X marks). Second, even though the retrieved item (blue triangle in the lower figure) with small error and the retrieved item with large error (blue triangle in the upper figure) are biased in the same direction, the absolute bias for the retrieved item with the small error is positive, whereas the other is negative, which demonstrates how a retrieved item with large error could cause negative bias without meaningfully being biased away from the center relative to its encoded location. (c) Simulations based on the six encoded locations in Experiment 1 showed that random error of retrievals not assuming direction was negatively correlated with bias for both item-only simulation and gist simulation.
-
Figure 7—source data 1
The relation between simulated error and bias.
- https://cdn.elifesciences.org/articles/65588/elife-65588-fig7-data1-v3.csv
Author response image 1

Author response image 2
Additional files
Download links
A two-part list of links to download the article, or parts of the article, in various formats.
Downloads (link to download the article as PDF)
Open citations (links to open the citations from this article in various online reference manager services)
Cite this article (links to download the citations from this article in formats compatible with various reference manager tools)
Tracking the relation between gist and item memory over the course of long-term memory consolidation
eLife 10:e65588.
https://doi.org/10.7554/eLife.65588


