Quantitative spatial and temporal assessment of regulatory element activity in zebrafish
- MRC Human Genetics Unit, Institute of Genetics & Cancer, University of Edinburgh, United Kingdom
- Centre for Mammalian Synthetic Biology at the Institute of Quantitative Biology, Biochemistry, and Biotechnology, SynthSys, School of Biological Sciences, University of Edinburgh, United Kingdom
Figures
Figure 1 with 1 supplement
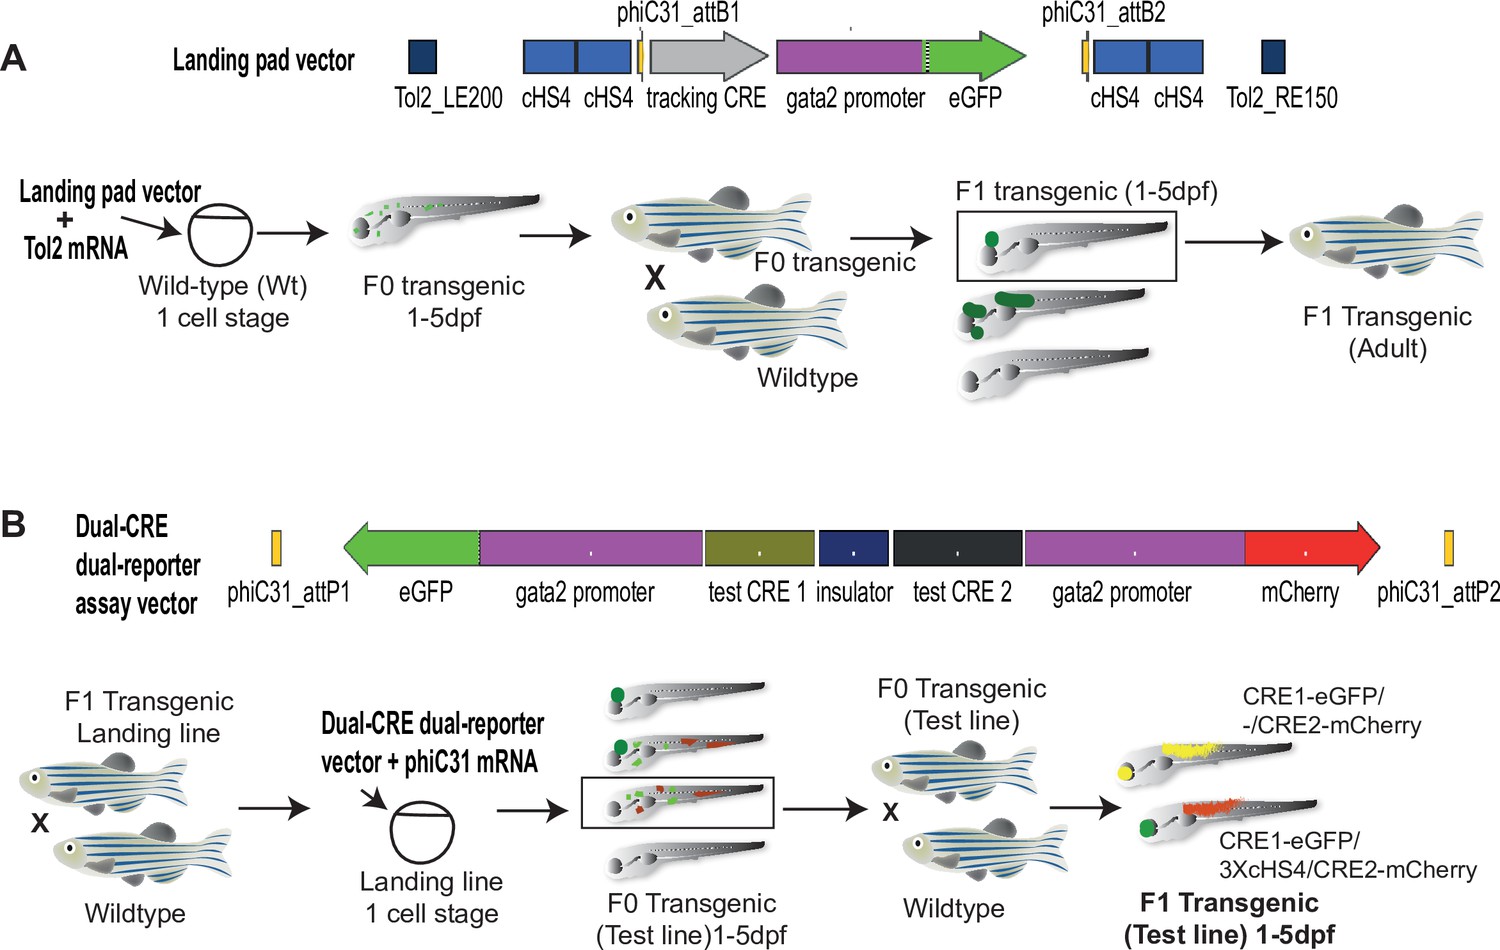
Quantitative Spatial and Temporal Assessment of Regulatory element activity in Zebrafish (Q-STARZ) pipeline.
Diagramatic representation of the Q-STARZ pipeline. (A). Top: map of the landing pad vector. Bottom: scheme for generating stable transgenic ‘landing lines’. The landing pad vector is co-injected with Tol2 mRNA into one-cell stage wild-type embryos. Tol2-mediated recombination integrates the landing pad containing phiC31-attB sites flanking the tracking cis-regulatory element (CRE)-reporter cassette (SHH-SBE2, a CRE driving eGFP in the developing forebrain) at random locations in the zebrafish genome. F0 embryos showing mosaic eGFP expression are raised to adulthood. F1 embryos obtained by outcrossing F0 lines with wild-type zebrafish are screened for tracking CRE-driven reporter (eGFP) expression. Embryos where eGFP expression was only observed in the expected activity domain (forebrain) of the tracking CRE were raised to adulthood to establish stable ‘landing lines’. (B) Top: map of the dual-CRE dual-reporter vector. Bottom: scheme for replacing the tracking cassette in the landing line with the dual-CRE dual-reporter cassette containing the enhancers to be assayed for spatiotemporal activity. Assay vector and mRNA coding for phiC31 integrase are injected in one cell stage embryos derived from outcrossing F1 landing line with wild-type fish. Injected embryos were selected for loss of tracking CRE (SHH-SBE2)-driven eGFP fluorescence in forebrain and mosaic expression of both eGFP and mCherry resulting from the test CREs in the assay cassette. F0 transgenic lines were established from selected embryos and eGFP and mCherry expression imaged in F1 embryos derived from outcrossing these lines with wild-type fish. Signals from both reporters were observed in the activity domains of both CREs in F1 embryos bearing the assay constructs with ‘neutral’ sequence between the two CRE-reporter units (yellow signal seen in expressing tissues in the merge channel). However, eGFP and mCherry expression was restricted to tissues where the associated CREs are active upon inclusion of three copies of the chicken β-globin 5′HS4 (3XcHS4) insulator between the two CRE-reporter units.
Figure 1—figure supplement 1
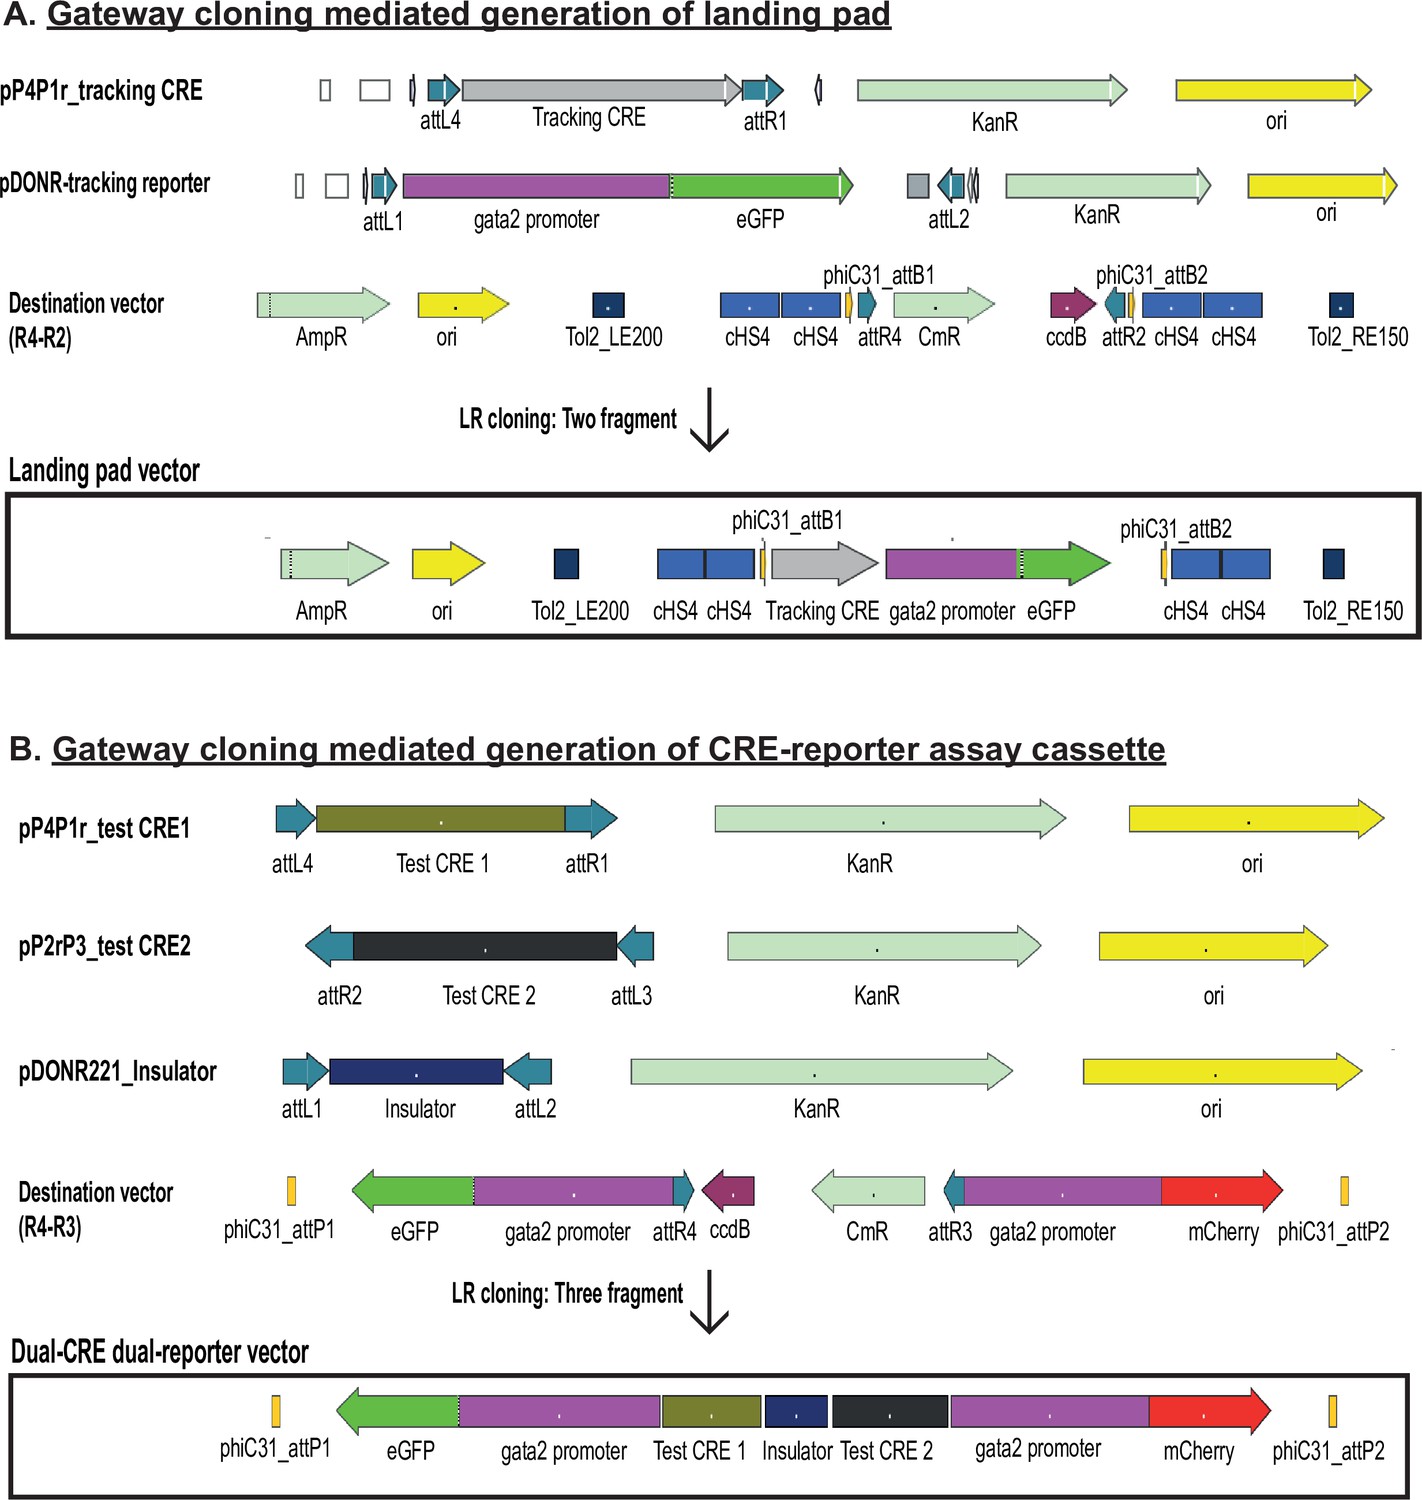
Diagrammatic representation of the gateway cloning strategy used for generating the landing pad (A) and dual-cis-regulatory element (CRE) dual-reporter vector (B).
The recombination sites used in each vector and other salient features are indicated on each vector map.
Figure 2 with 1 supplement
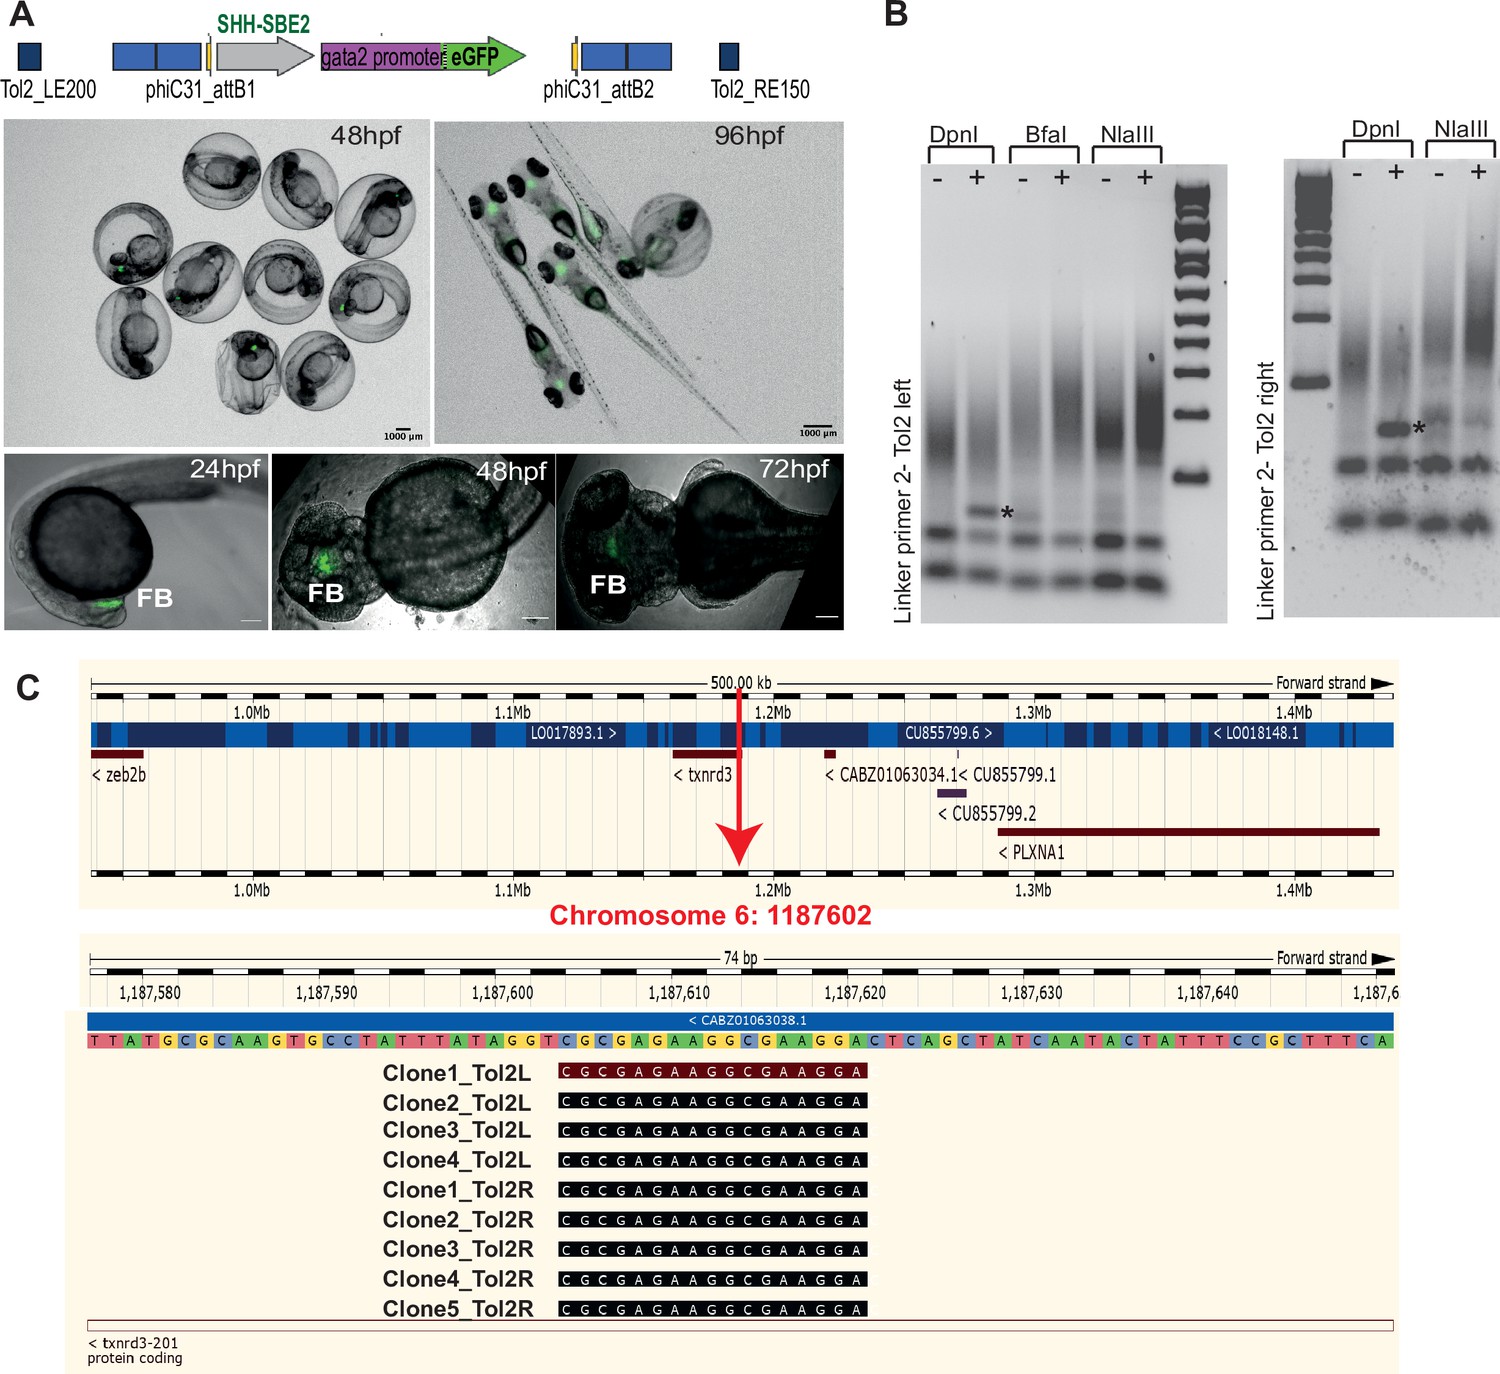
Characterisation of SHH-SBE2 landing line.
(A) Top: schematic of the design of the landing pad bearing SHH-SBE2 as the tracking cis-regulatory element (CRE). Below: CRE activity observed exclusively in the forebrain in F1 embryos with the SHH-SBE2-eGFP tracking cassette. Images shown for pool of F1 embryos (scale bar = 1000 μm) and individual embryos (scale bar = 100 μm) at different stages of embryonic development. FB, forebrain; hpf, hr post fertilisation. Scale bar = 100 μm. (B) Unique bands (*) observed in round 2 of PCR amplification of DpnI digested genomic DNA from F1 embryos bearing the landing pad cassette. (C) Ensembl Genome Browser snapshot depicting the integration site (red arrow) of the SHH-SBE2 landing pad and sequencing data from clones bearing the PCR product shown by * in (B).
Figure 2—figure supplement 1
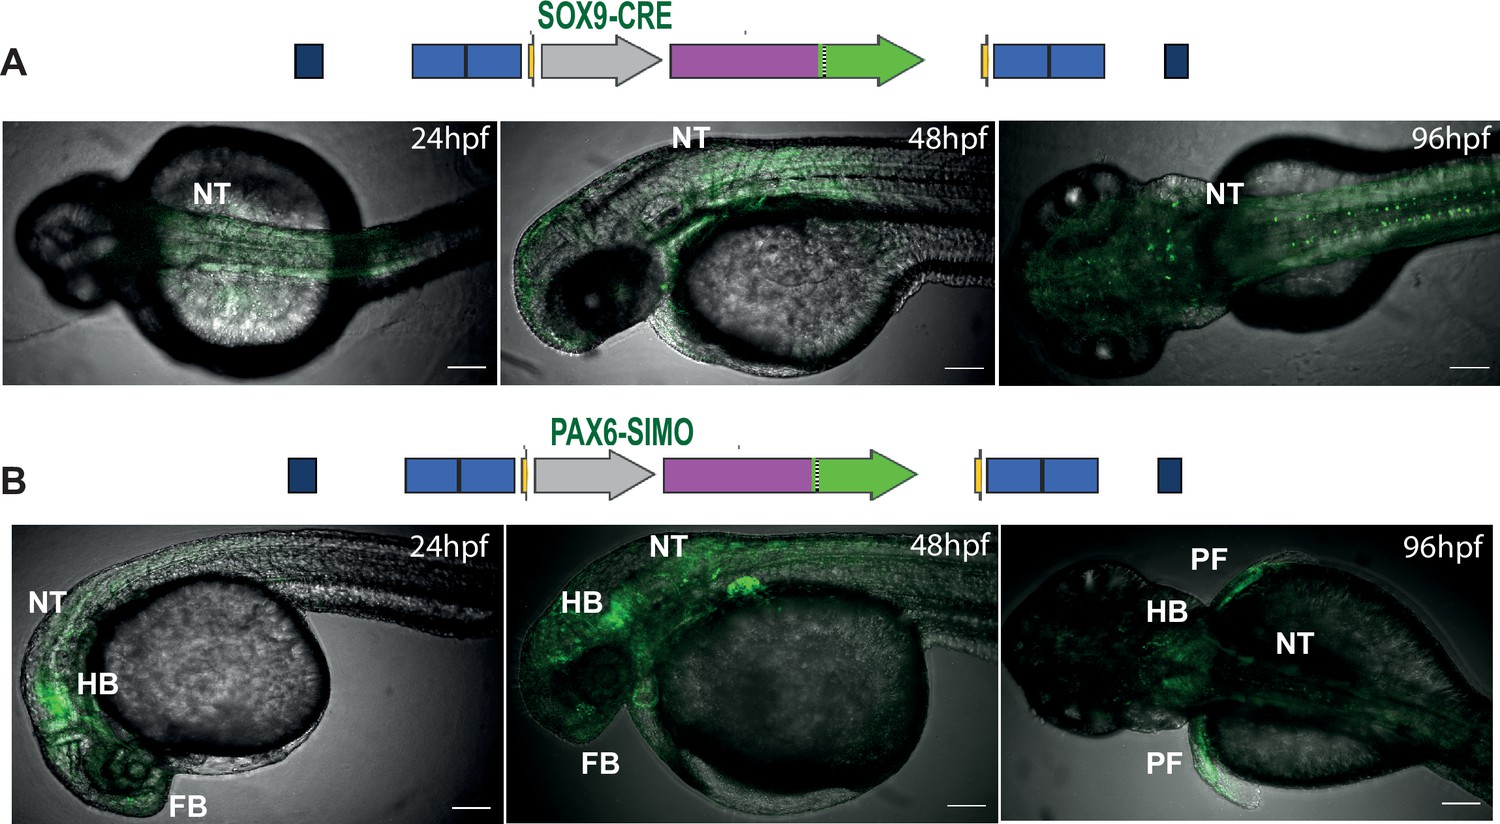
Landing lines with tracking cis-regulatory element (CRE)-driven reporter gene expression influenced by site of integration.
Top: tracking CREs used in the landing line. Bottom: activities of the SOX9 (A) and PAX6-SIMO (B) CREs in the landing pad highly influenced by the site of integration indicated by eGFP expression in multiple tissues. NT, neural tube; HB, hindbrain; PF, pectoral fin; hpf, hr post fertilisation. Scale bar = 100 μm.
Figure 3 with 4 supplements

Quantitative assessment of tissue-specific enhancer activity and effect of insulation on crosstalk between cis-regulatory elements (CREs) in dual-CRE dual-reporter constructs.
Constructs carrying well-characterised CREs from the PAX6 locus (PAX6-7CE3, hindbrain enhancer, and PAX6-SIMO, lens enhancer). (A) Confocal images of 96hpf F1 embryos derived from founder lines injected with the cassettes indicated above each image panel. Top two panels show dye-swap experiment (eGFP and mCherry reporters swapped between the two CREs) with a neutral sequence (–, no insulator activity) between the two CRE-reporter cassettes. eGFP and mCherry expression is observed in both lens and hindbrain indicating complete crosstalk between 7CE3 and SIMO CREs. Bottom panel: inclusion of three copies of the well-characterised chicken β-globin 5′HS4 (3XcHS4) insulator restricts the activities of each enhancer to their respective specific domains. Scale bars = 100 μm. (B) Average of mean fluorescence intensities ratios (G/C: eGFP/mCherry; C/G: mCherry/eGFP) in the lens and hindbrain at 72 and 120 hr post fertilisation (hpf) in F1 embryos derived from founders bearing constructs without (–) or with 1×, 2× or 3× insulator sequences. Each bar indicates average of ratios of mean fluorescence intensities from at least five independent images of embryos bearing the assay construct indicated (n ≥ 5, error bars indicate standard deviation). A highly significant difference in fluorescence intensity ratios (computed by two-tailed Student’s t-test) was observed between embryos at the same stage of development harbouring constructs with no insulator (–) and those with three copies of the insulator (3xI). This demonstrates that fluorescence is progressively restricted to the tissue where the associated CRE is active as the number of copies of the insulator increases. Raw data used for plotting the graphs are provided in Figure 3—source data 1. L, Lens; H, hindbrain, ****p<0.0001, ***p<0.001, **p<0.01.
-
Figure 3—source data 1
Quantification data of eGFP and mCherry intensities in transgenic lines bearing the assay constructs described in Figure 3.
- https://cdn.elifesciences.org/articles/65601/elife-65601-fig3-data1-v1.xlsx
Figure 3—figure supplement 1
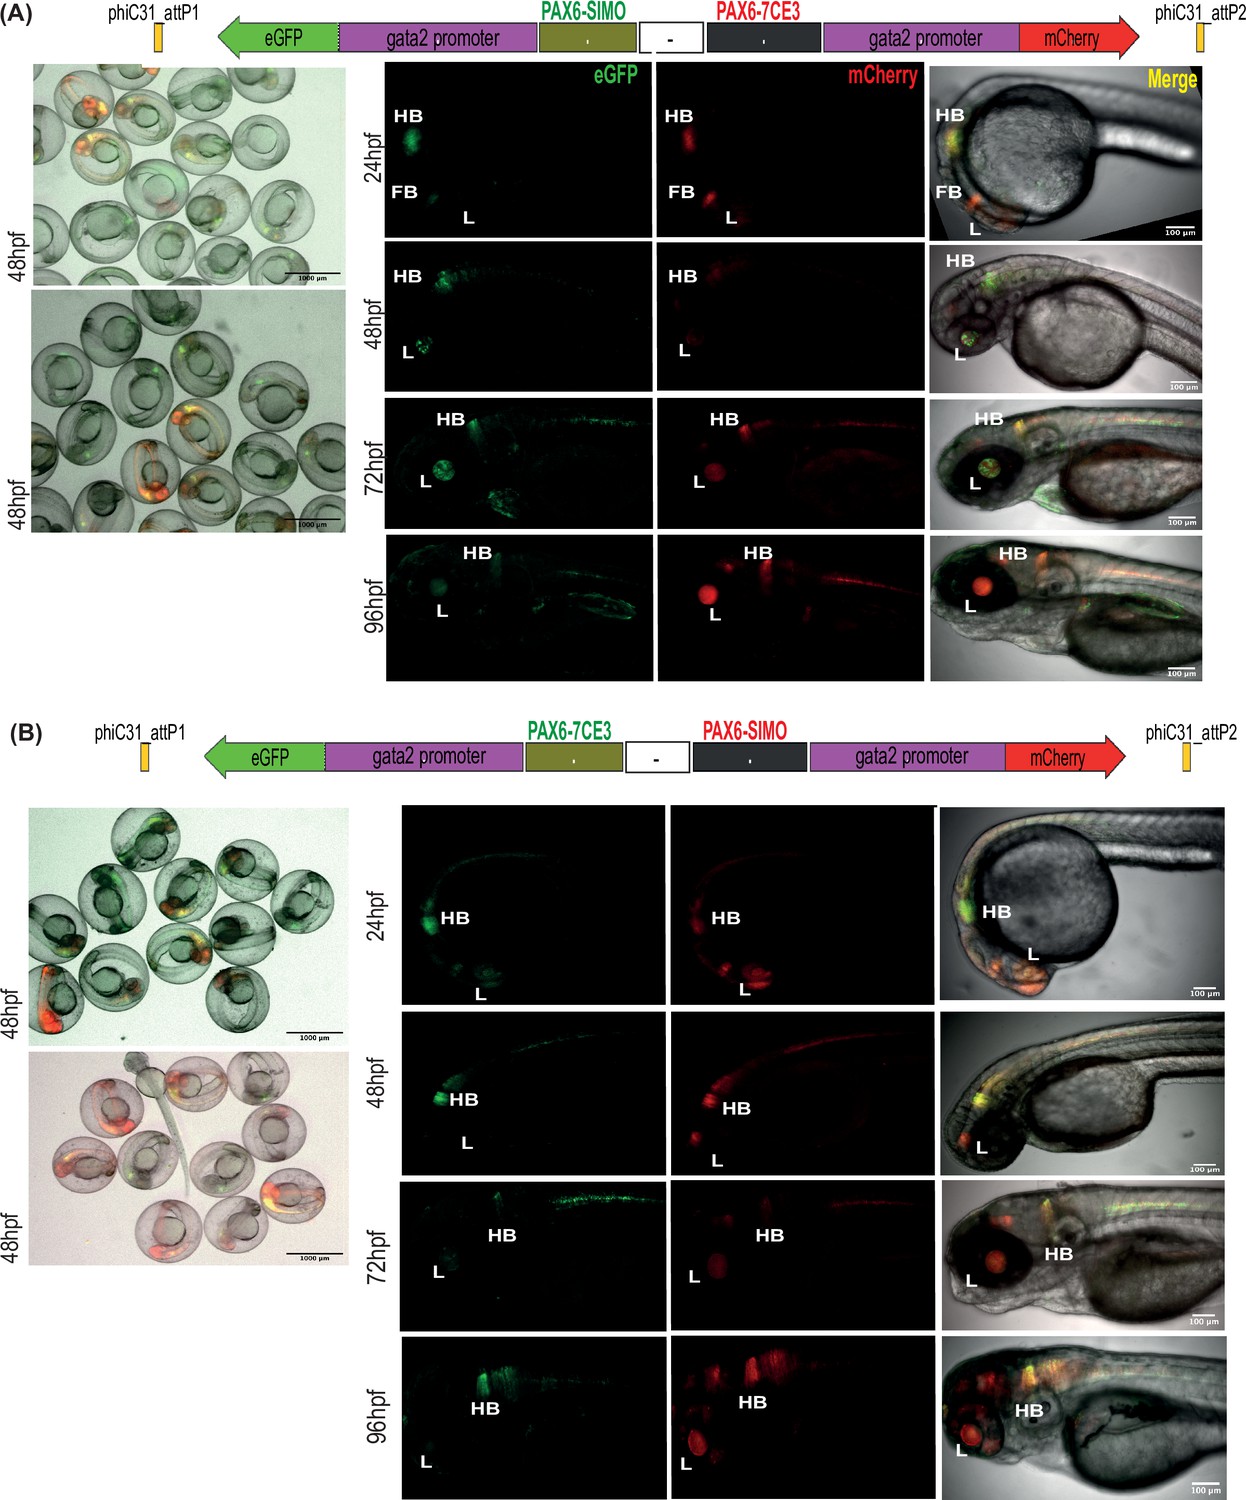
Assessment of tissue-specific cis-regulatory element (CRE) activity from dual-CRE dual-reporter constructs with neutral sequence between CREs.
Images shown for pool of F1 embryos (scale bar = 1000 μm) and individual embryos (scale bar = 100 μm) at different stages of embryonic development (24–96 hr post fertilisation) derived from founder lines injected with the replacement cassettes lacking insulator sequences (–) and containing previously well-characterised CREs from PAX6 locus (PAX6-7CE3, hindbrain enhancer, and PAX6-SIMO, lens enhancer). (A) PAX6-SIMO driving eGFP and PAX6-7CE3 driving mCherry. (B) Dye-swap experiment with PAX6-SIMO driving mCherry and PAX6-7CE3 driving eGFP. In both (A) and (B), eGFP and mCherry expression is observed in both lens and hindbrain, indicating complete crosstalk of activity between the two CREs consistent with the lack of insulation.
Figure 3—figure supplement 2
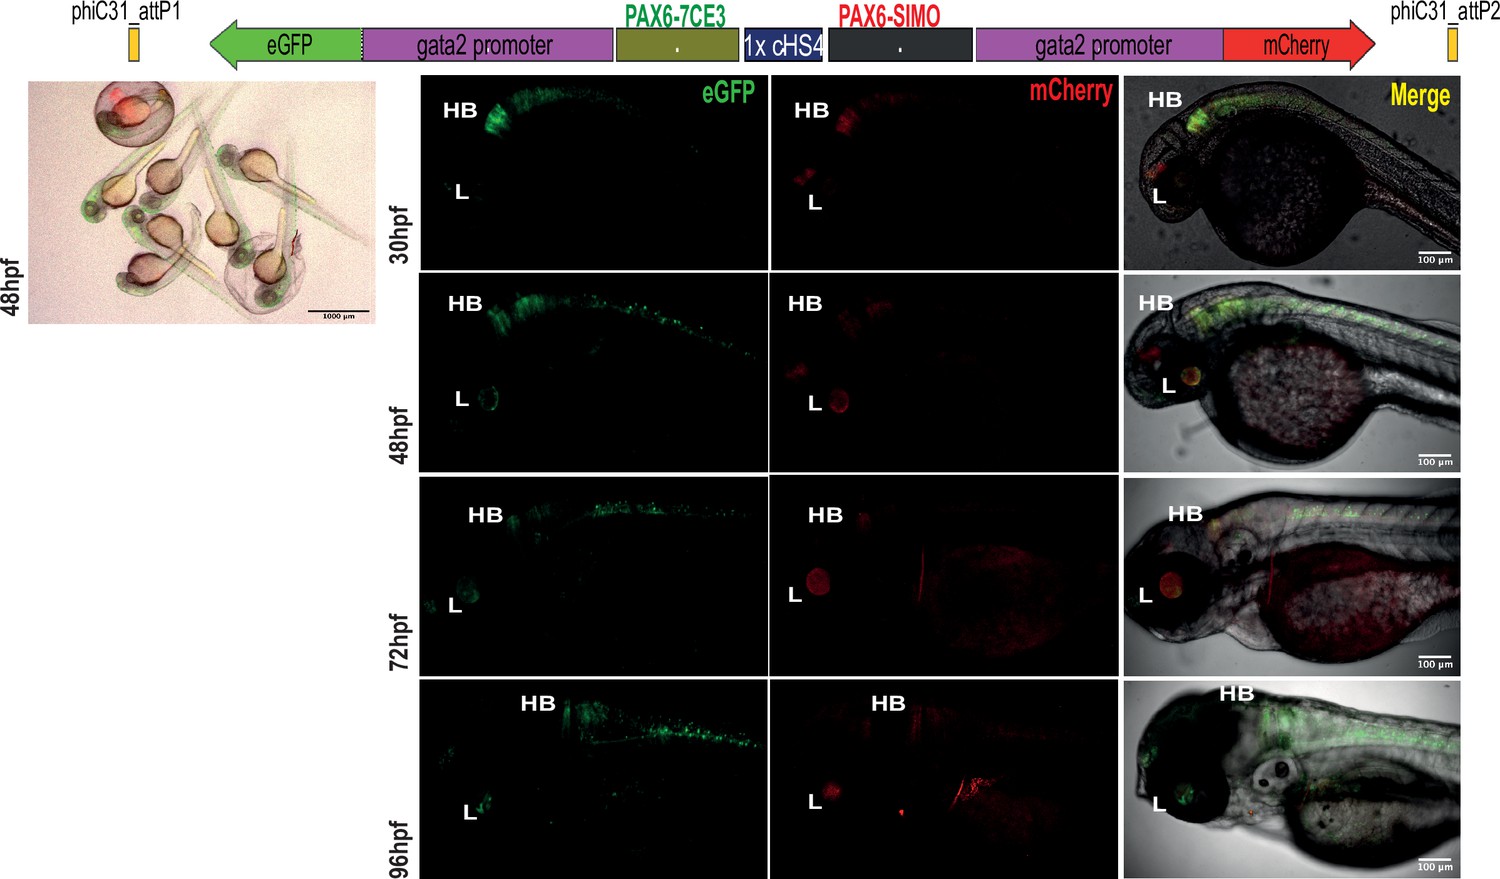
Assessment of tissue-specific cis-regulatory element (CRE) activity from the dual-CRE dual-reporter replacement construct with one copy of insulator sequence.
Replacement constructs designed with previously well-characterised enhancers from PAX6 locus (PAX6-7CE3, hindbrain enhancer, and PAX6-SIMO, lens enhancer). Images shown for pool of F1 embryos (scale bar = 1000 μm) and individual embryos (scale bar = 100 μm) at different stages of embryonic development (24–96 hr post fertilisation) derived from founder lines injected with the replacement cassettes bearing the enhancer-reporter cassettes separated by one copy of the insulator sequence (1XcHS4). eGFP and mCherry expression is observed in both lens (L) and hindbrain (HB), indicating a complete crosstalk of activity between the two CREs.
Figure 3—figure supplement 3
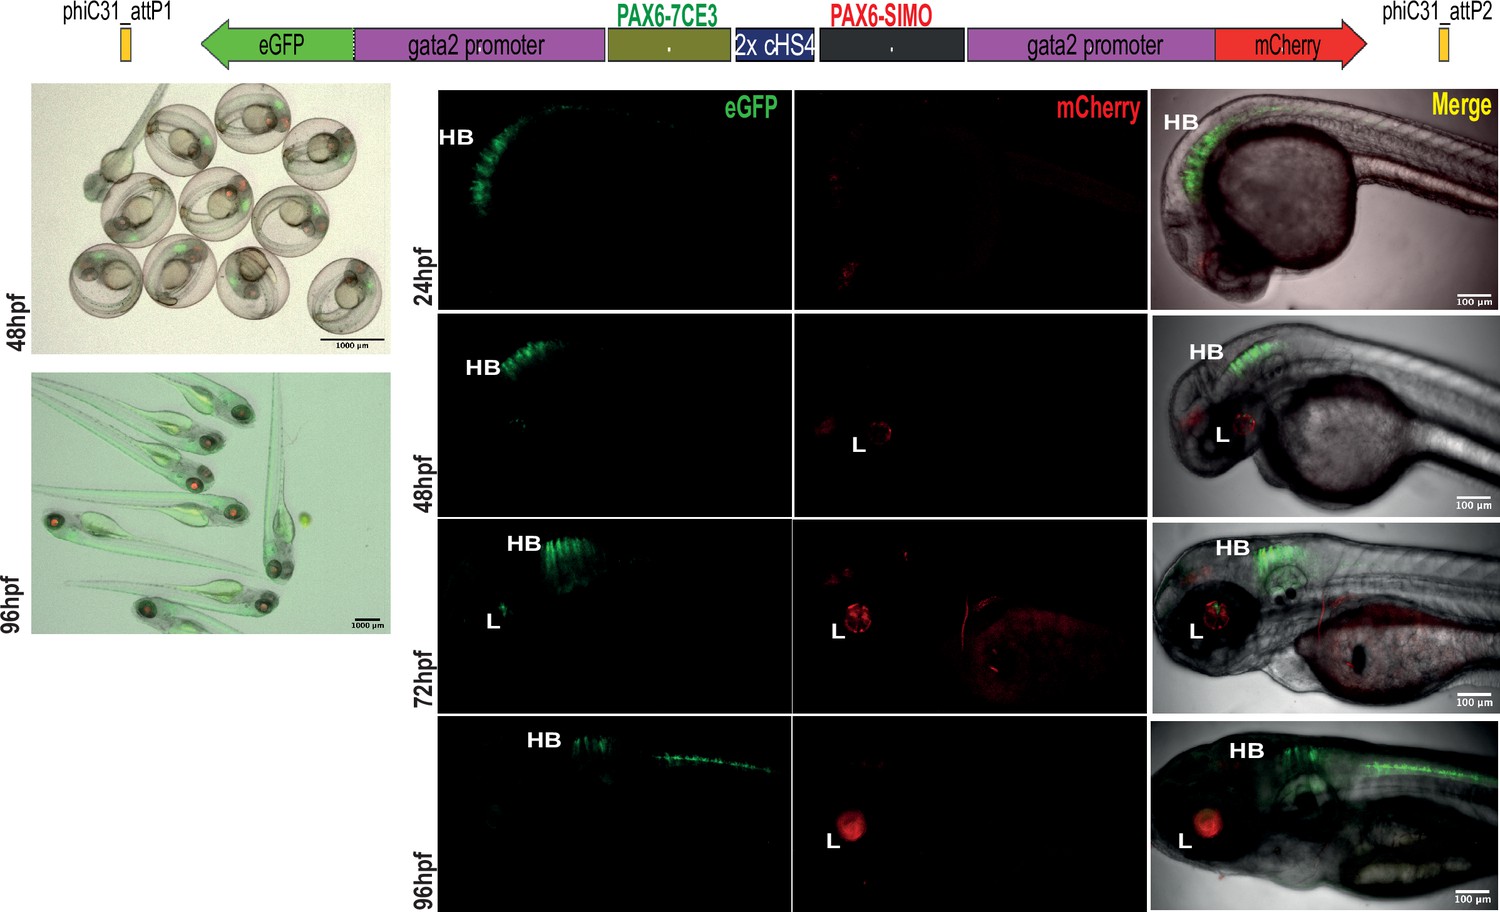
Assessment of tissue-specific cis-regulatory element (CRE) activity from the dual-CRE dual-reporter replacement construct with two copies of insulator sequence.
Replacement constructs designed with previously well-characterised CREs from PAX6 locus (PAX6-7CE3, hindbrain enhancer, and PAX6-SIMO, lens enhancer). Images shown for pool of F1 embryos (scale bar = 1000 μm) and individual embryos (scale bar = 100 μm) at different stages of embryonic development (24–96 hr post fertilisation) derived from founder lines injected with the replacement cassettes bearing the CRE-reporter cassettes separated by two copies of the insulator sequence (2XcHS4). eGFP and mCherry expression is observed largely restricted to either lens (L) or hindbrain (HB), indicating a blocking of crosstalk of activity between the two CREs by the presence of two copies of insulator sequence.
Figure 3—figure supplement 4
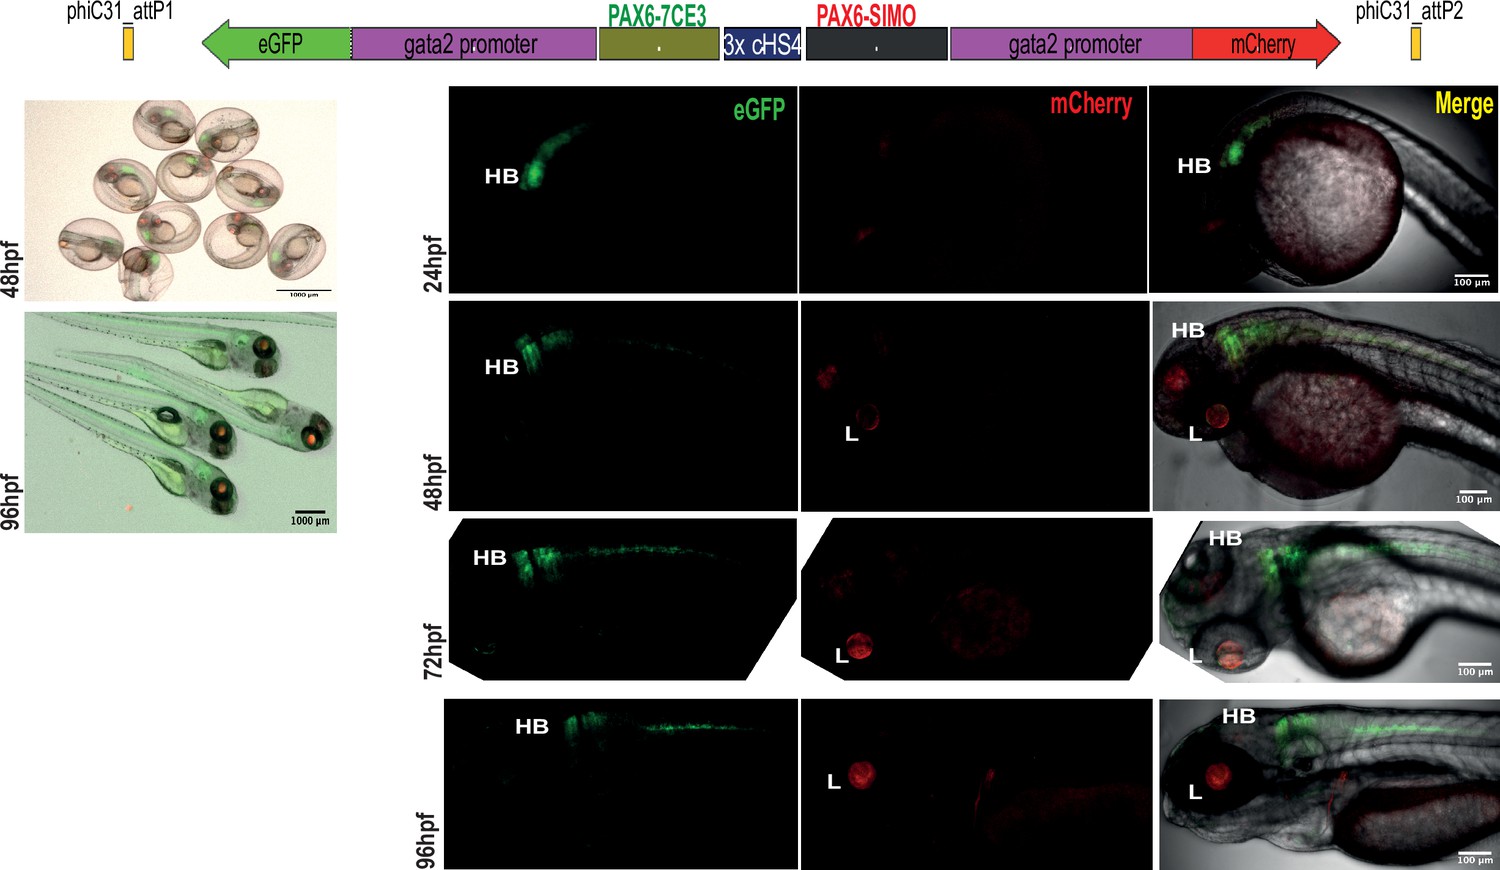
Assessment of tissue-specific cis-regulatory element (CRE) activity from the dual-CRE dual-reporter replacement construct with three copies of insulator sequence.
Replacement constructs designed with previously well-characterised CREs from PAX6 locus (PAX6-7CE3, hindbrain enhancer, and PAX6-SIMO, lens enhancer). Images shown for pool of F1 embryos (scale bar = 1000 μm) and individual embryos (scale bar = 100 μm) at different stages of embryonic development (24–96 hr post fertilisation) derived from founder lines injected with the replacement cassettes bearing the CRE-reporter cassettes separated by three copies of the insulator sequence (3XcHS4). eGFP and mCherry expression is observed completely restricted to either lens (L) or hindbrain (HB), indicating a complete insulation of crosstalk of activity between the two CREs by the presence of three copies of insulator sequence.
Figure 4 with 1 supplement

Live imaging of transgenic embryos to detect subtle differences in spatial and temporal enhancer activities.
(A) Top: schematic of assay construct with two enhancers from the mouse Shh locus active in developing forebrain (Shh-SBE2 and Shh-SBE4 driving eGFP and mCherry respectively). Below: snapshots of live imaging of F1 embryos derived from transgenic lines bearing the assay construct. Distinct as well as overlapping domains (marked by *) of activities are observed for the two cis-regulatory elements (CREs) in early stages of development, until about 54 hr post fertilisation (hpf). At later stages of embryonic development, the activities of the two forebrain CREs are observed in completely distinct domains. Scale bar = 100 μm. (B) As in (A) but with a dye-swap, that is, Shh-SBE2 driving mCherry and Shh-SBE4 driving eGFP.
Figure 4—figure supplement 1
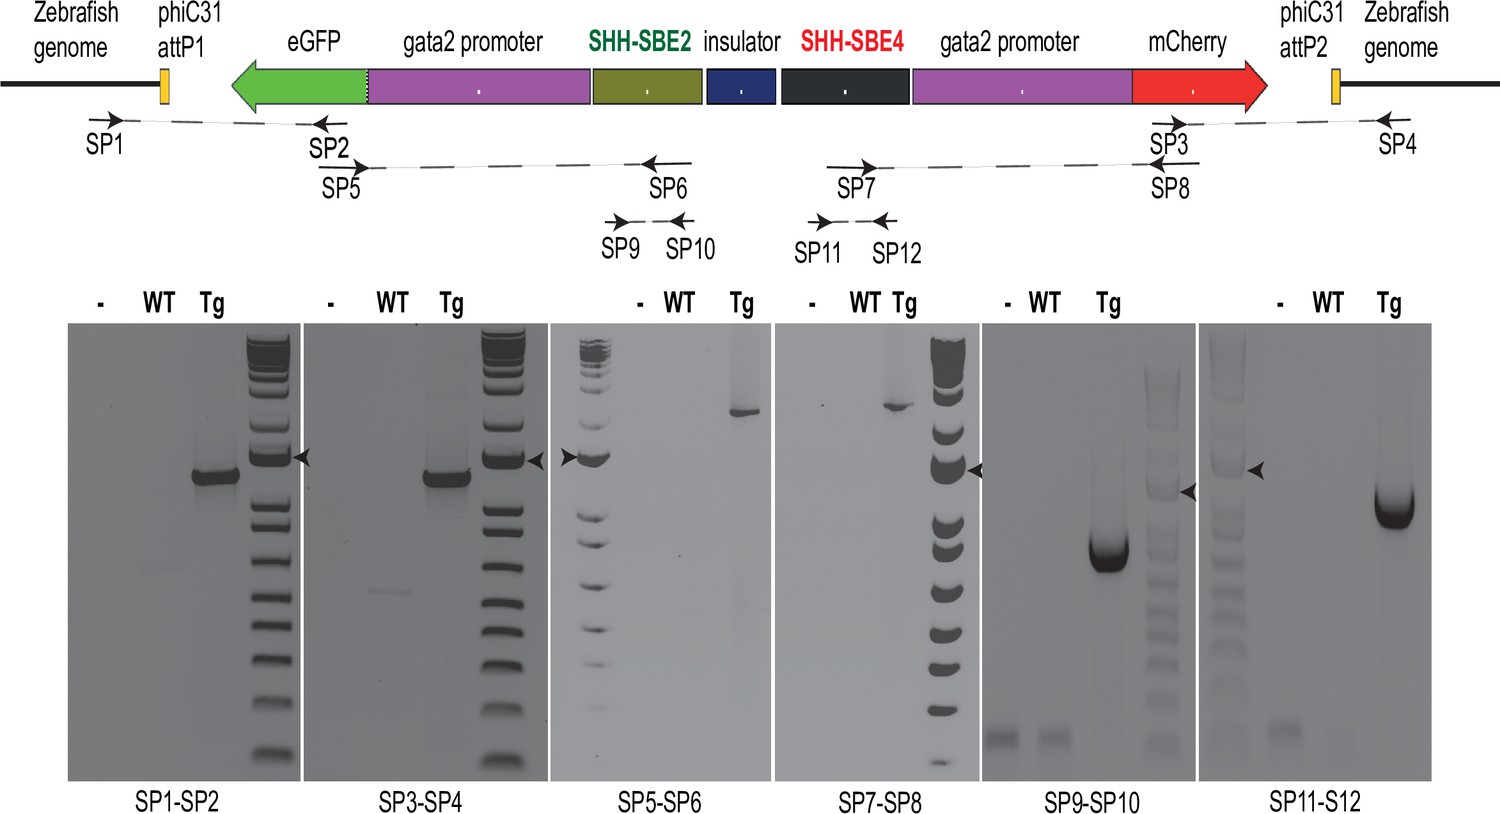
Genotyping assay for assessing successful integration of the replacement construct in the landing sites.
Top: position of the screening primers (SP1- 12) used for genotyping a replacement construct bearing SHH-SBE2 and SHH-SBE4 cis-regulatory elements (CREs). Bottom: PCR products obtained using the specified SP sets on genomic DNA derived from wild-type (Wt) embryos or embryos derived from transgenic (Tg) line. Details of the screening primer positions are listed in Supplementary file 1.
Figure 5
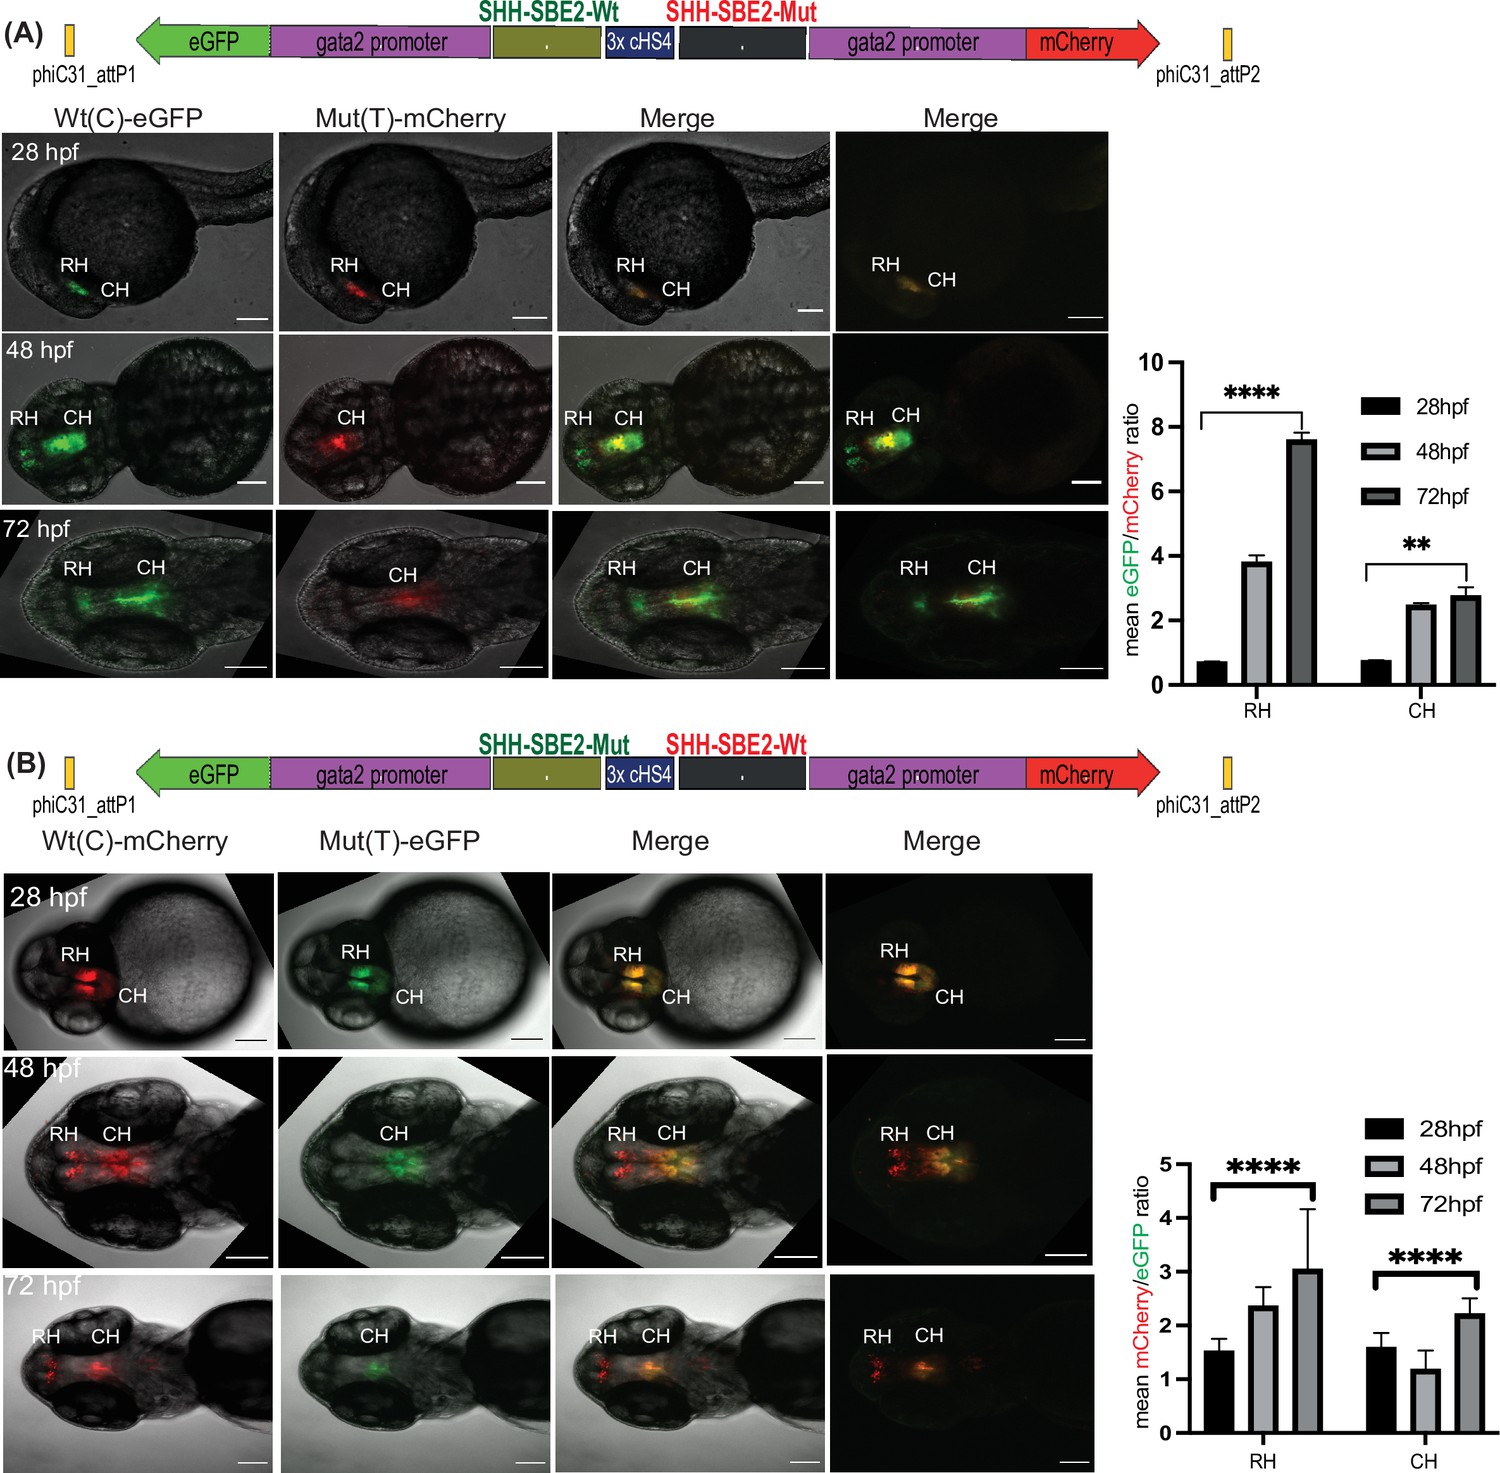
Quantitative assessment of altered CRE activity by disease-associated sequence variation.
Dye swap experiment with SHH-SBE2 enhancer wild-type Wt(C) allele and Mut(T) allele bearing a holoprosencepaly- associated mutation (A: Wt(C)-eGFP/ Mut(T)-mCherry; B: Wt(C)-mcherry/ Mut(T)-eGFP).Top: Schematic representation of the test construct indicating the reporter genes driven by the two alleles. Bottom: confocal images and histogram of average of mean fluorescence intensities ratio (A:eGFP/mCherry; B:mcherry/eGFP) in the rostral (RH) and caudal (CH) hypothalamus for F1 embryos derived from founder lines bearing the test construct described (n≥5, error bars indicate standard deviation). At earlier stages of development (28-36 hpf, no significant difference in activity was observed between the two alleles). However at later stages of development (48 hpf and 72h pf) the mutant allele failed to drive reporter gene expression in the RH, and had significantly weaker activity in the CH at 72 hpf. Raw data used for plotting the graphs is provided in Figure 5—source data 1. ****p<0.0001, **p<0.01 (computed by two-tail student t-test). Scale bar = 100 μm.
-
Figure 5—source data 1
Quantification data of eGFP and mCherry intensities in transgenic lines bearing the assay constructs described in Figure 5.
- https://cdn.elifesciences.org/articles/65601/elife-65601-fig5-data1-v1.xlsx
Videos
Video 1
Confocal imaging of 30 hr post fertilisation embryo derived from transgenic line bearing the Shh-SBE2gfp/3XcHS4/Shh-SBE4mCherry assay construct.
The distinct expression domains of SBE2 and SBE4 enhancers in the developing forebrain are seen in green and red, respectively, while the region where their activities overlap is depicted in yellow.
Video 2
Time-lapse video of embryo derived from transgenic line bearing the Shh-SBE2gfp/3XcHS4/Shh-SBE4mCherry assay construct.
Images were acquired from 54 to 69 hr post fertilisation, with a time interval of 1 hr. The distinct expression domains of SBE2 and SBE4 enhancers in the developing forebrain are seen in green and red, respectively.
Video 3
Time-lapse video of embryo derived from transgenic line bearing the SHH-SBE2-Wtgfp/3XcHS4/SHH-SBE2-Mut-mCherry assay construct.
Images were acquired from 40 to 60 hr post fertilisation, with a time interval of 2 hr.
Tables
Key resources table
| Reagent type (species) or resource | Designation | Source or reference | Identifiers | Additional information |
|---|---|---|---|---|
| Commercial assay or kit | Gateway recombination cloning system | Invitrogen | 12535-019 | |
| Commercial assay or kit | Phusion high fidelity polymerase | NEB | M0530S | |
| Commercial assay or kit | TOPO TA Cloning Kit | Thermo Fischer Scientific | 451641 | |
| Commercial assay or kit | Plasmid purification columns | QIAGEN | 12123 | |
| Commercial assay or kit | PCR purification columns | QIAGEN | 28115 | |
| Commercial assay or kit | SP6 mMessage mMachine kit | Ambion | AM1340 | |
| Commercial assay or kit | DNeasy blood and tissue kit | QIAGEN | 69504 | |
| Commercial assay or kit | T4 ligase | NEB | M020S | |
| Recombinant DNA reagent | pCS2-TP (plasmid) | Bischof et al., 2007 | ||
| Recombinant DNA reagent | pcDNA3.1 phiC31 (plasmid) | Addgene | Plasmid #68310 | |
| Recombinant DNA reagent | NlaIII(enzyme) | NEB | R0125S | |
| Recombinant DNA reagent | BfaI(enzyme) | NEB | R0568S | |
| Recombinant DNA reagent | DpnII(enzyme) | NEB | R0543S | |
| Chemical compound, drug | PTU (1-phenyl2-thio-urea) | Sigma-Aldrich | S515388 | |
| Chemical compound, drug | Low-melting point (LMP) agarose | Sigma-Aldrich | A9414 | |
| Chemical compound, drug | Tricaine | Sigma-Aldrich | MS222 | |
| Software, algorithm | Imaris | Bitplane, Oxford Instruments | RRID:SCR_007370 | |
| Software, algorithm | Fiji | RRID:SCR_002285 | ||
| Genetic reagent | Danio rerio | Strain AB | RRID: ZIRC_ZL1 |
Additional files
-
Supplementary file 1
Details of oligonucleotides used in the study for generation of landing pads and assay constructs, and mapping of site of integration of transgene in landing lines and test lines.
- https://cdn.elifesciences.org/articles/65601/elife-65601-supp1-v1.xlsx
-
Supplementary file 2
Overview of transgenic lines generated in the study.
- https://cdn.elifesciences.org/articles/65601/elife-65601-supp2-v1.xlsx
-
Transparent reporting form
- https://cdn.elifesciences.org/articles/65601/elife-65601-transrepform1-v1.docx
Download links
A two-part list of links to download the article, or parts of the article, in various formats.
Downloads (link to download the article as PDF)
Open citations (links to open the citations from this article in various online reference manager services)
Cite this article (links to download the citations from this article in formats compatible with various reference manager tools)
Quantitative spatial and temporal assessment of regulatory element activity in zebrafish
eLife 10:e65601.
https://doi.org/10.7554/eLife.65601


