CD8+ T cell self-tolerance permits responsiveness but limits tissue damage
- Center for Immunology, University of Minnesota, United States
- Minnesota Supercomputing Institute, University of Minnesota, United States
Figures
Figure 1 with 2 supplements

Trp2/Kb-specific CD8+ T cells in pre-immune wild-type (WT) and Dct-/- mice share a naïve phenotype while showing modest differences in frequency and tetramer staining.
(A) Tetramer enrichment was performed to enumerate Trp2/Kb-specific CD8+ T cells per mouse. Median tetramer fluorescence intensity (MFI) was used to estimate the avidity of enriched Trp2/Kb-specific (B) or B8R/Kb-specific cells (C). (D) CD44/CD122 expression of Trp2/Kb-specific cells. (E) CD69 expression of Trp2/Kb-specific cells. (F) PD-1, CTLA-4, LAG3, and TIM3 expression of Trp2/Kb-specific cells. (G) CD5 expression of Trp2/Kb-specific cells. Data are compiled from three independent experiments in A and D. Individual experiments are shown in B and C; results are representative of other experiments. The graphs in (E, F, and G) represent individual experiments with four mice per group. Squares indicate male animals. **p<0.01 by unpaired t test.
-
Figure 1—source data 1
Data file related to Figure 1.
- https://cdn.elifesciences.org/articles/65615/elife-65615-fig1-data1-v2.pzfx
-
Figure 1—source data 2
Primers used to screen prospective clones for homologous recombination of the Dct knockout construct.
- https://cdn.elifesciences.org/articles/65615/elife-65615-fig1-data2-v2.docx
-
Figure 1—source data 3
Primers used to screen mice to confirm deletion of the Dct gene.
- https://cdn.elifesciences.org/articles/65615/elife-65615-fig1-data3-v2.docx
Figure 1—figure supplement 1
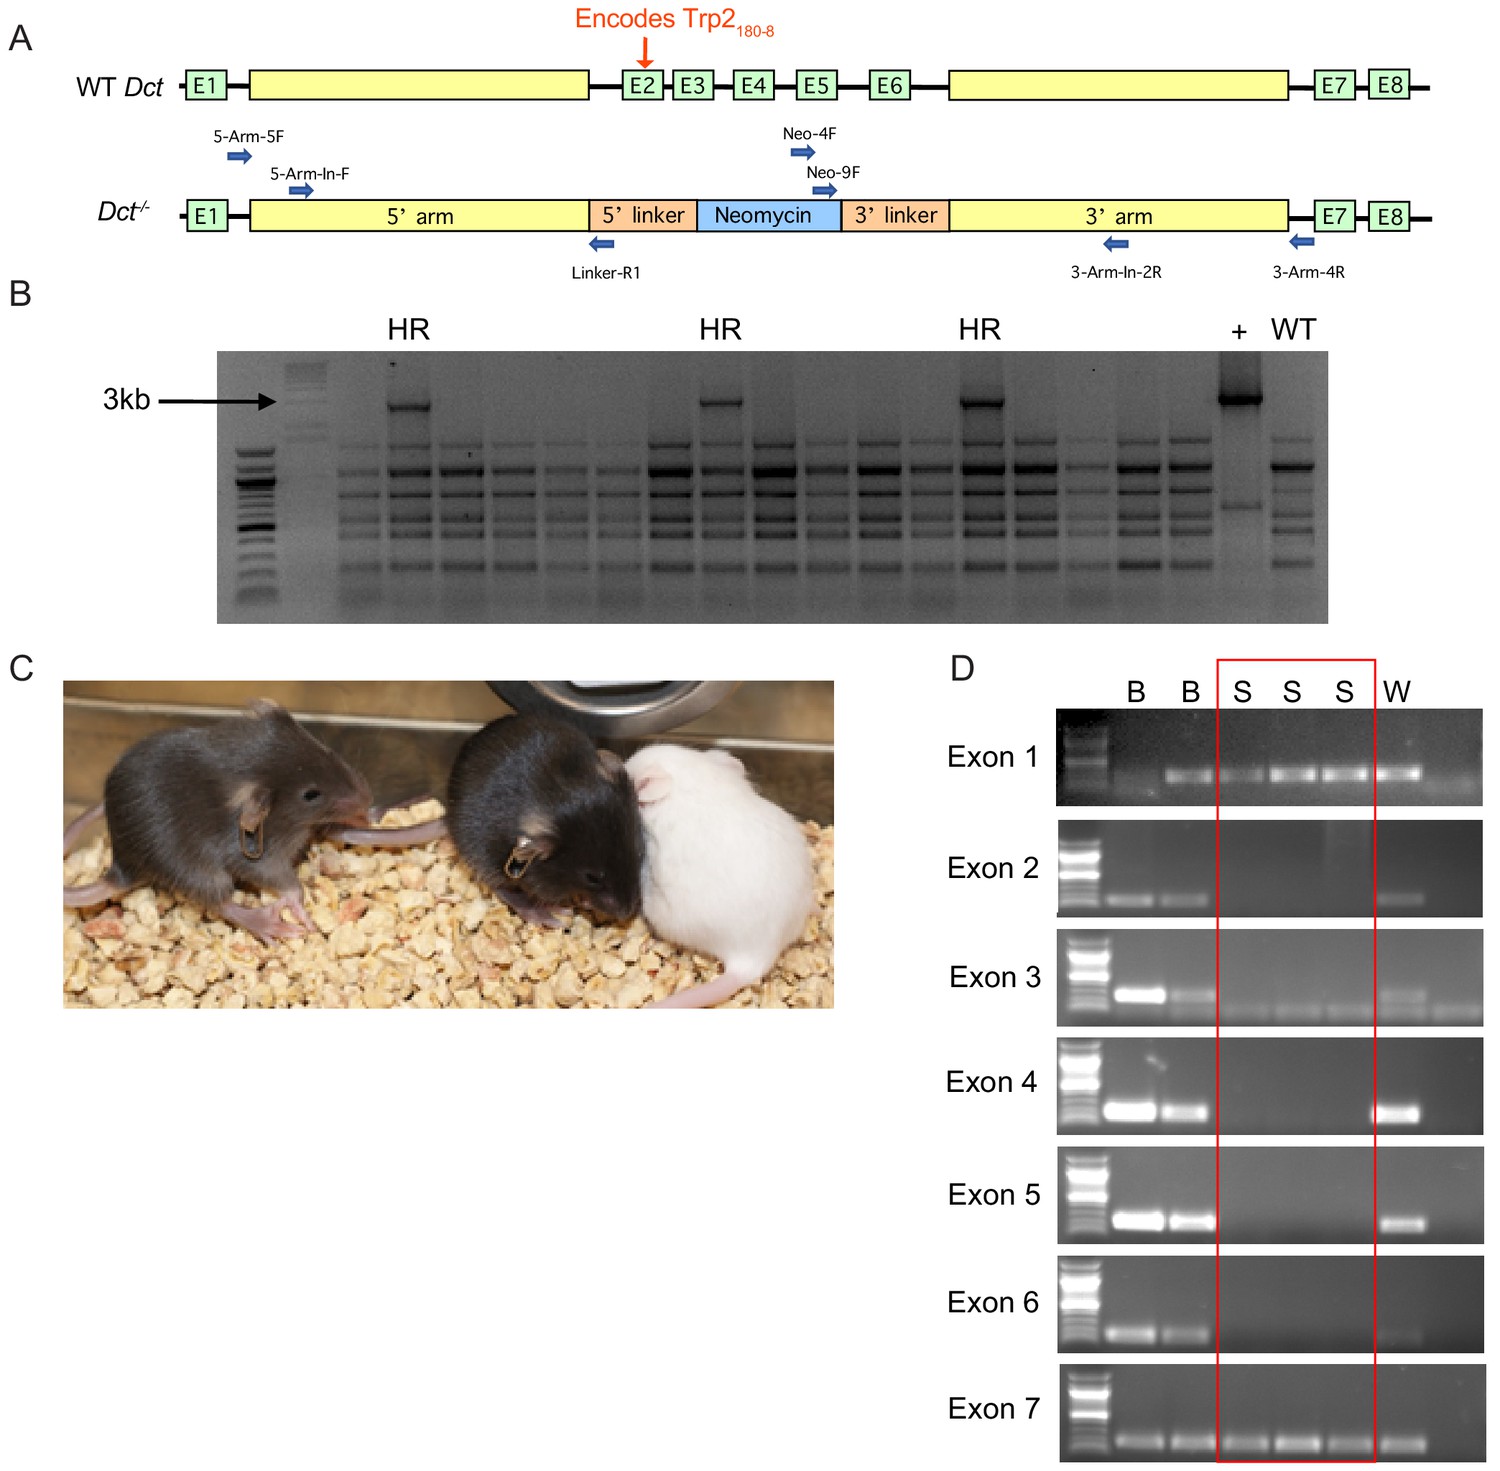
Generation of Dct-/- mouse model by deleting exons 2 through 6.
(A) The intact Dct gene is shown schematically with eight exons (E1–E8) in green and large intronic regions shown in yellow. The Hurwitz lab designed a new knockout model, which involved deleting exons 2 through 6 and inserting a neomycin gene. Primers used for screening prospective clones are represented by blue arrows. (B) Stained agarose gel showing the polymerase chain reaction (PCR) screening of candidate mouse embryonic stem cell (mESC) clones for homologous recombination events. In this example, the 5’ arm is being interrogated with primers 5-Arm-In-F and Linker-R1. ‘HR’ indicates a band of the appropriate size, 2907 bp, that is indicative of homologous recombination. ‘+’ is a positive control using the cloning construct. ‘WT’ is genomic deoxyribonucleic acid (DNA) from a wild-type mouse that is negative for homologous recombination. (C) Chimeric mice were generated and interbred, producing pups that were white (W), slate (S), or black (B). The slate phenotype is expected for Dct-/- mice. (D) Pups were screened by PCR for the presence of exons 1 through 7. Black pups retain all exons of Dct in their genome, whereas slate pups retain lack exons 2 through 6 and are knockouts for Dct. White pups are albino and are a byproduct of generating chimeric mice.
Figure 1—figure supplement 2
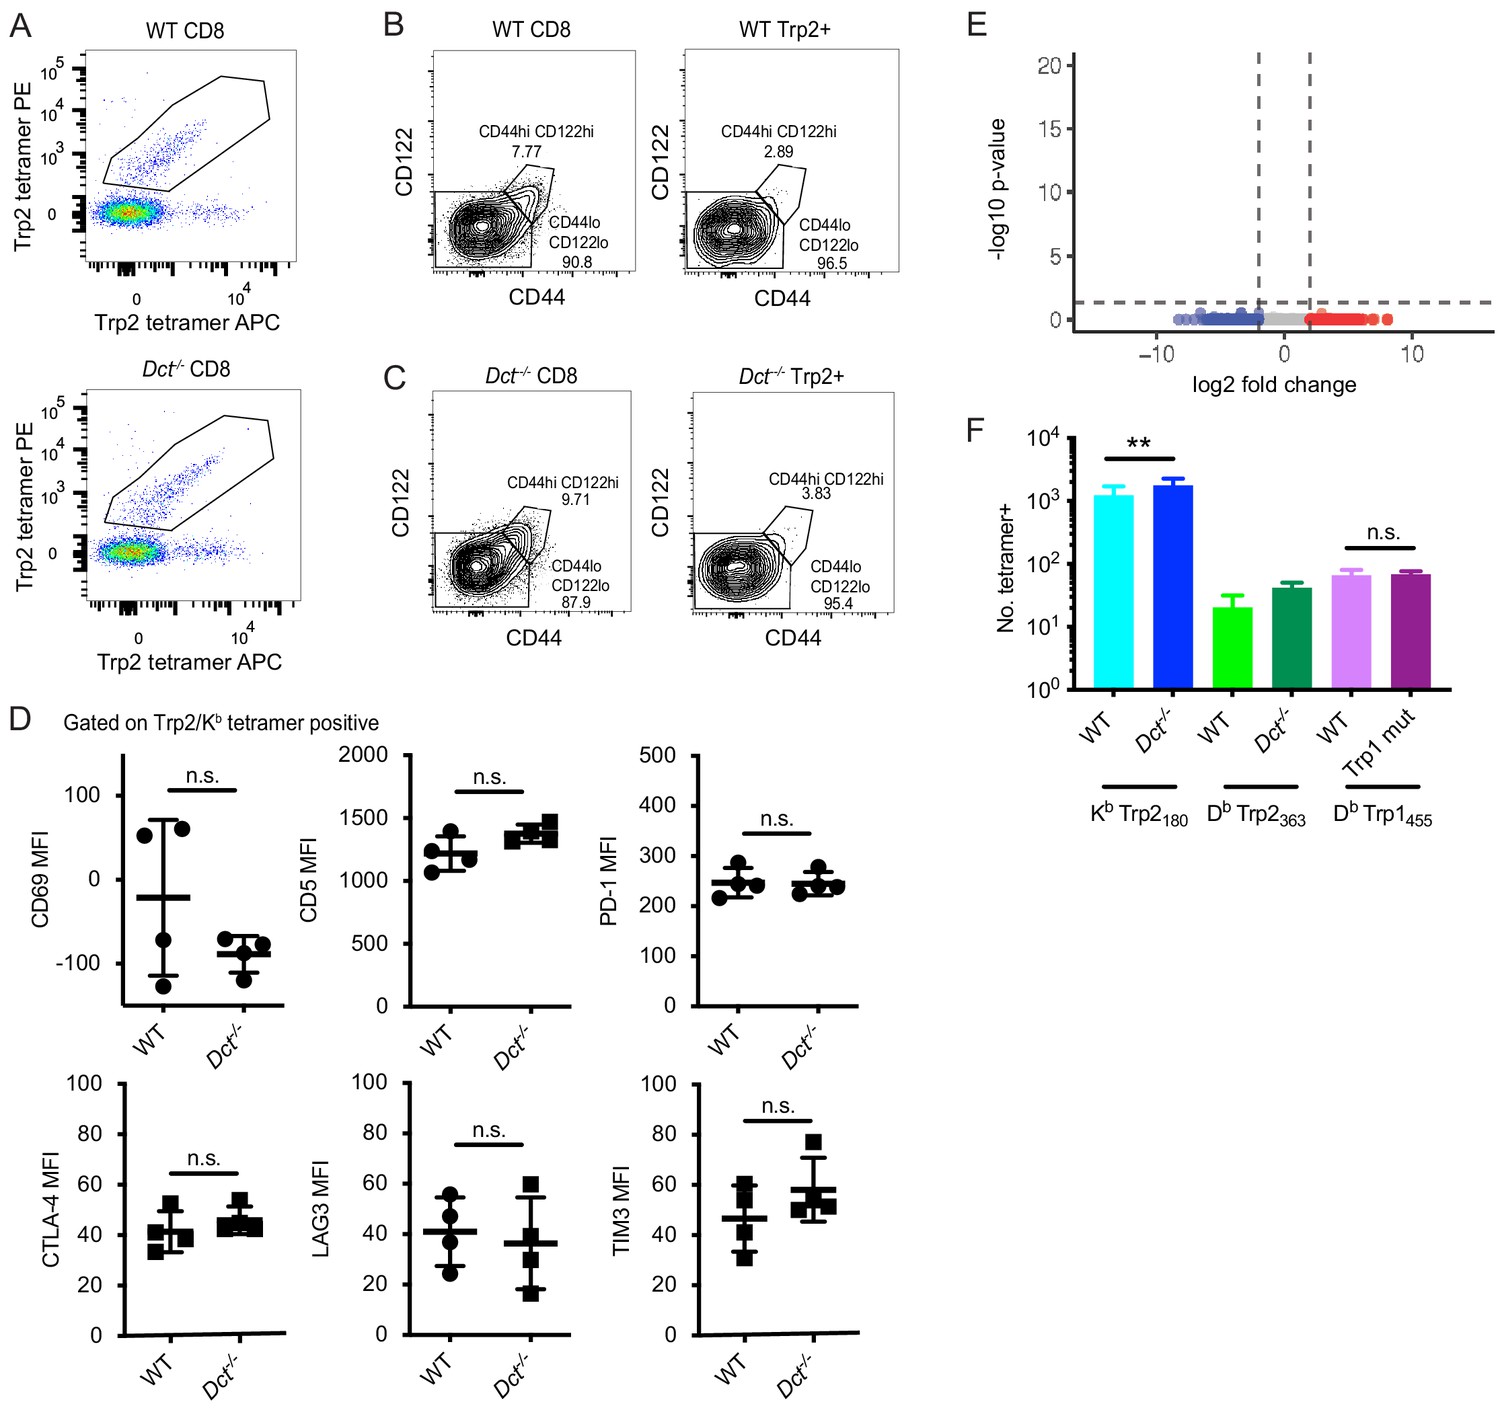
Additional analysis of the Trp2/Kb-specific population and cells specific for other melanocyte epitopes in pre-immune mice.
(A) Tetramer staining of pre-immune lymphocytes (enriched fraction, gated on live, dump-negative CD8+ T cells). Dual tetramer staining was used to facilitate more accurate gating on antigen-specific cells. CD44 and CD122 staining of pre-immune Trp2/Kb-specific cells from a wild-type (WT) mouse (B) and a Dct-/- mouse (C). (D) The median fluorescence intensity is plotted for the indicated markers in Trp2/Kb tetramer-positive cells; each graph represents an individual experiment. (E) Bulk RNA sequencing of Trp2/Kb-specific CD8+ T cells from pre-immune wild-type (WT) and Dct-/- mice was performed; differentially expressed genes were not identified between WT and Dct-/- samples as shown by the volcano plot. (F) Quantification of CD8+ T cells specific for a Db-restricted Trp2 epitope and an epitope from tyrosinase-related protein 1 (Trp1) in pre-immune mice reveals a similar or slightly lesser number of cells in mice expressing antigen (WT mice) relative to those that do not. Samples used for tetramer enrichment of Trp1/Db-specific cells were obtained from shipped samples; accordingly, these data likely underestimate the precursor frequency. Squares indicate male animals. PC, principal component. **p<0.01 by one-way ANOVA with Sidak’s multiple comparisons test.
Figure 2 with 3 supplements

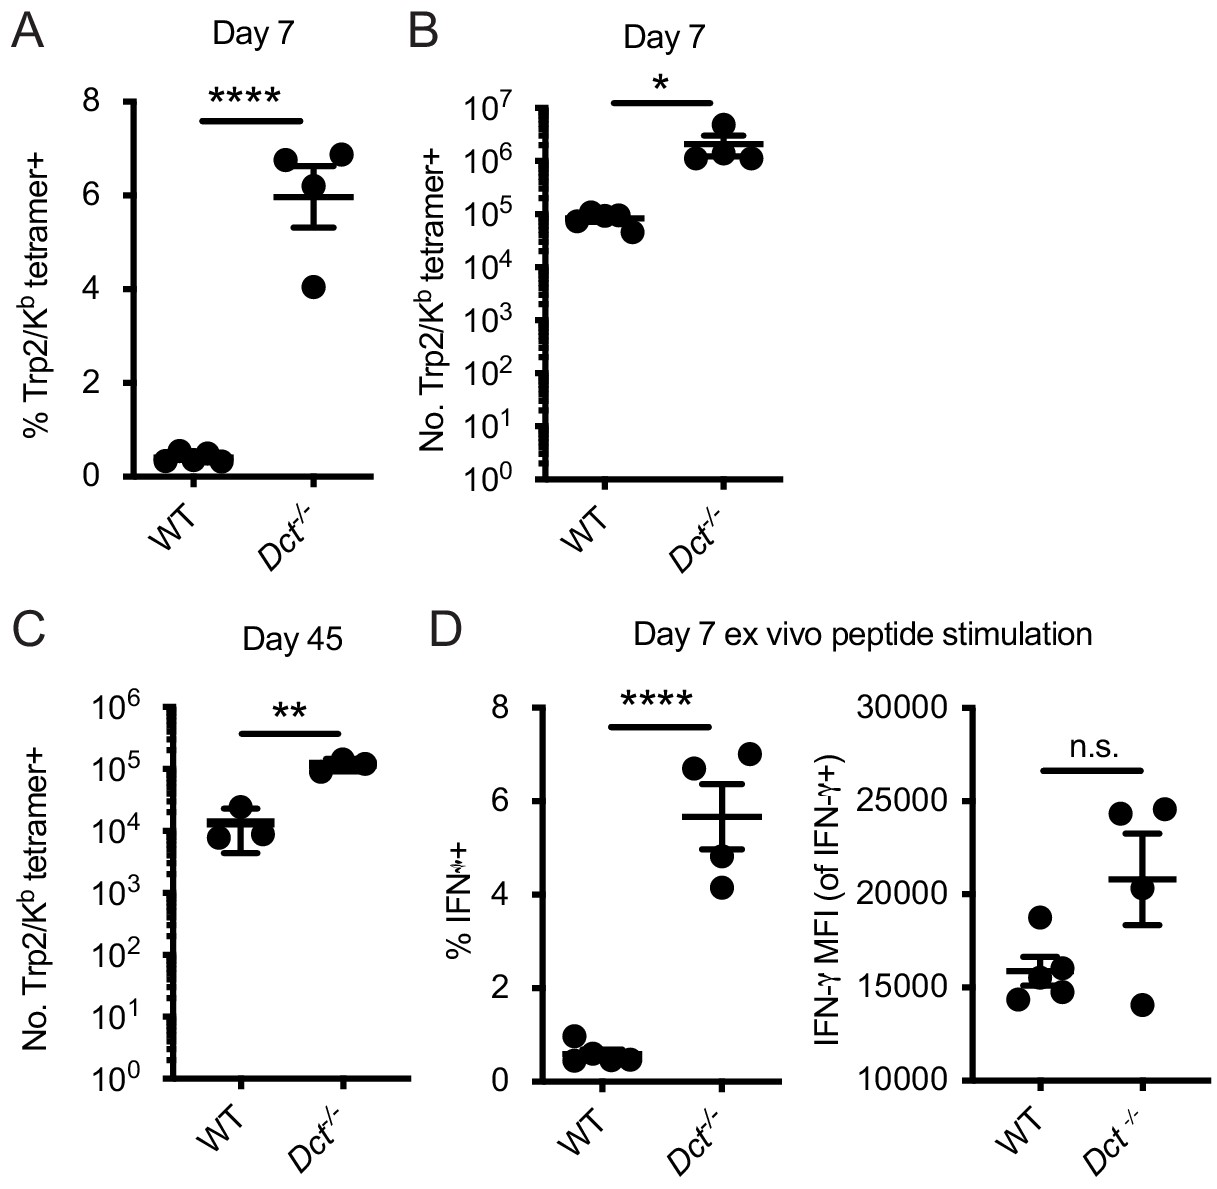
Differences in the magnitude of the response to Trp2 immunization in wild-type (WT) and Dct-/- mice.
Mice were primed with TriVax (50 μg each of Trp2 and B8R peptides; A–E). The number (A) or percent (B) of splenic Trp2/Kb or B8R/Kb-specific cells was assessed at day 7. (C, D) The tetramer fluorescence intensity of splenic Trp2/Kb-specific cells was compared. (E) Gating for dual Trp2/Kb tetramer-positive CD8+ (samples were not enriched for Trp2/Kb-specific cells). (F) The frequency of the indicated splenic population expressing PD-1 is shown. Data in A and B are compiled from more than three experiments. Data in C–F are representative of three or more similar experiments. Squares indicate male animals. *p<0.05, ****p<0.0001 by unpaired t test (C) or one-way ANOVA with Sidak’s multiple comparisons test (A, B, F).
-
Figure 2—source data 1
Data file related to Figure 2.
- https://cdn.elifesciences.org/articles/65615/elife-65615-fig2-data1-v2.pzfx
Figure 2—figure supplement 1
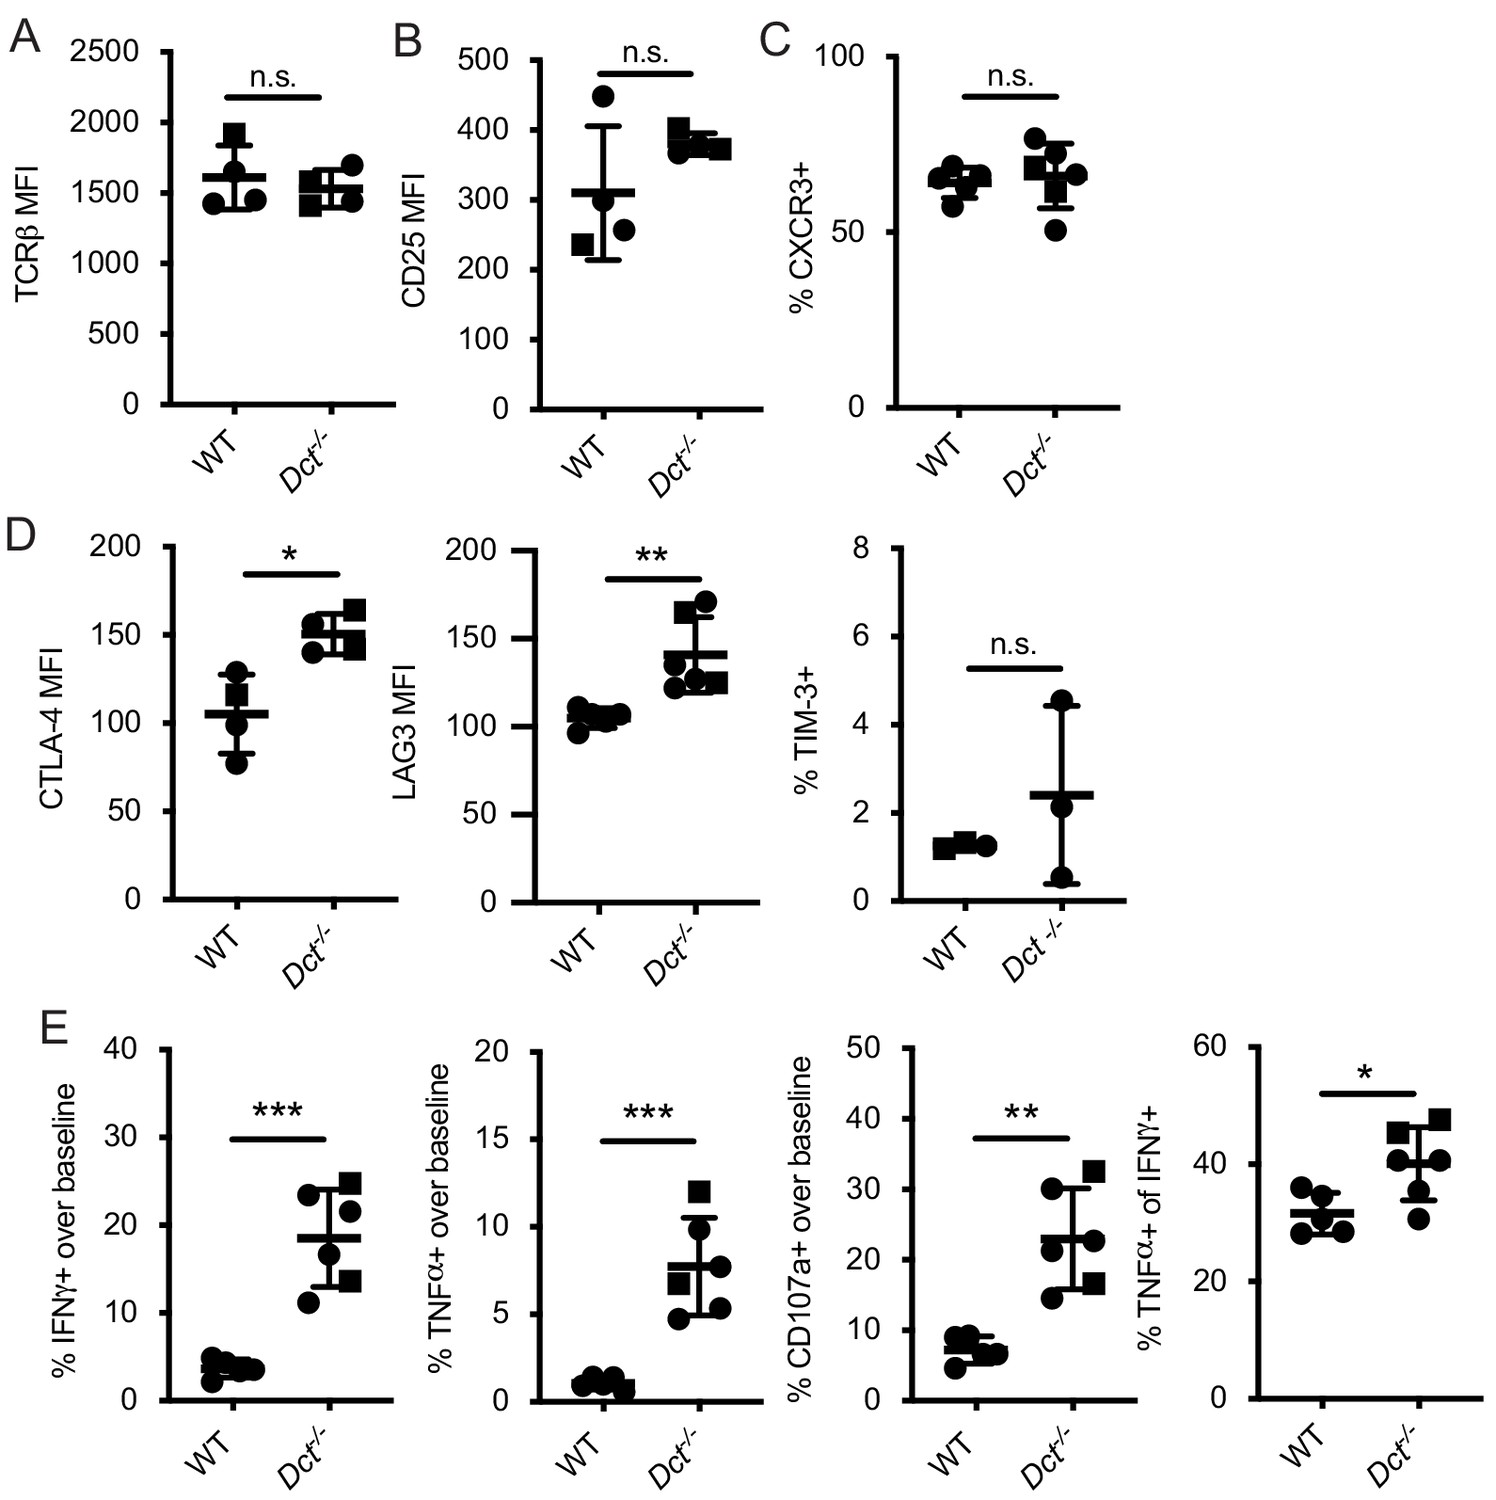
Additional phenotyping and functional analysis of Trp2/Kb-specific cells at day 7 after TriVax.
The median fluorescence intensity of (A, B, D) or frequency of cells expressing (C, D) the indicated marker are shown for Trp2/Kb tetramer-positive cells from the spleens of mice treated with TriVax (intravenous or intraperitoneal administration) containing Trp2 peptide 7 days prior. (E) Splenocytes harvested at this time point were stimulated for 6 hr with Trp2 peptide and stained for cytokine production (intracellular stains) and CD107a expression (antibody added prior to stimulation). Squares indicate male animals. Data represent individual experiments with three to six mice per group. *p<0.05, **p<0.01, ***p<0.001 by unpaired t test.
Figure 2—figure supplement 2
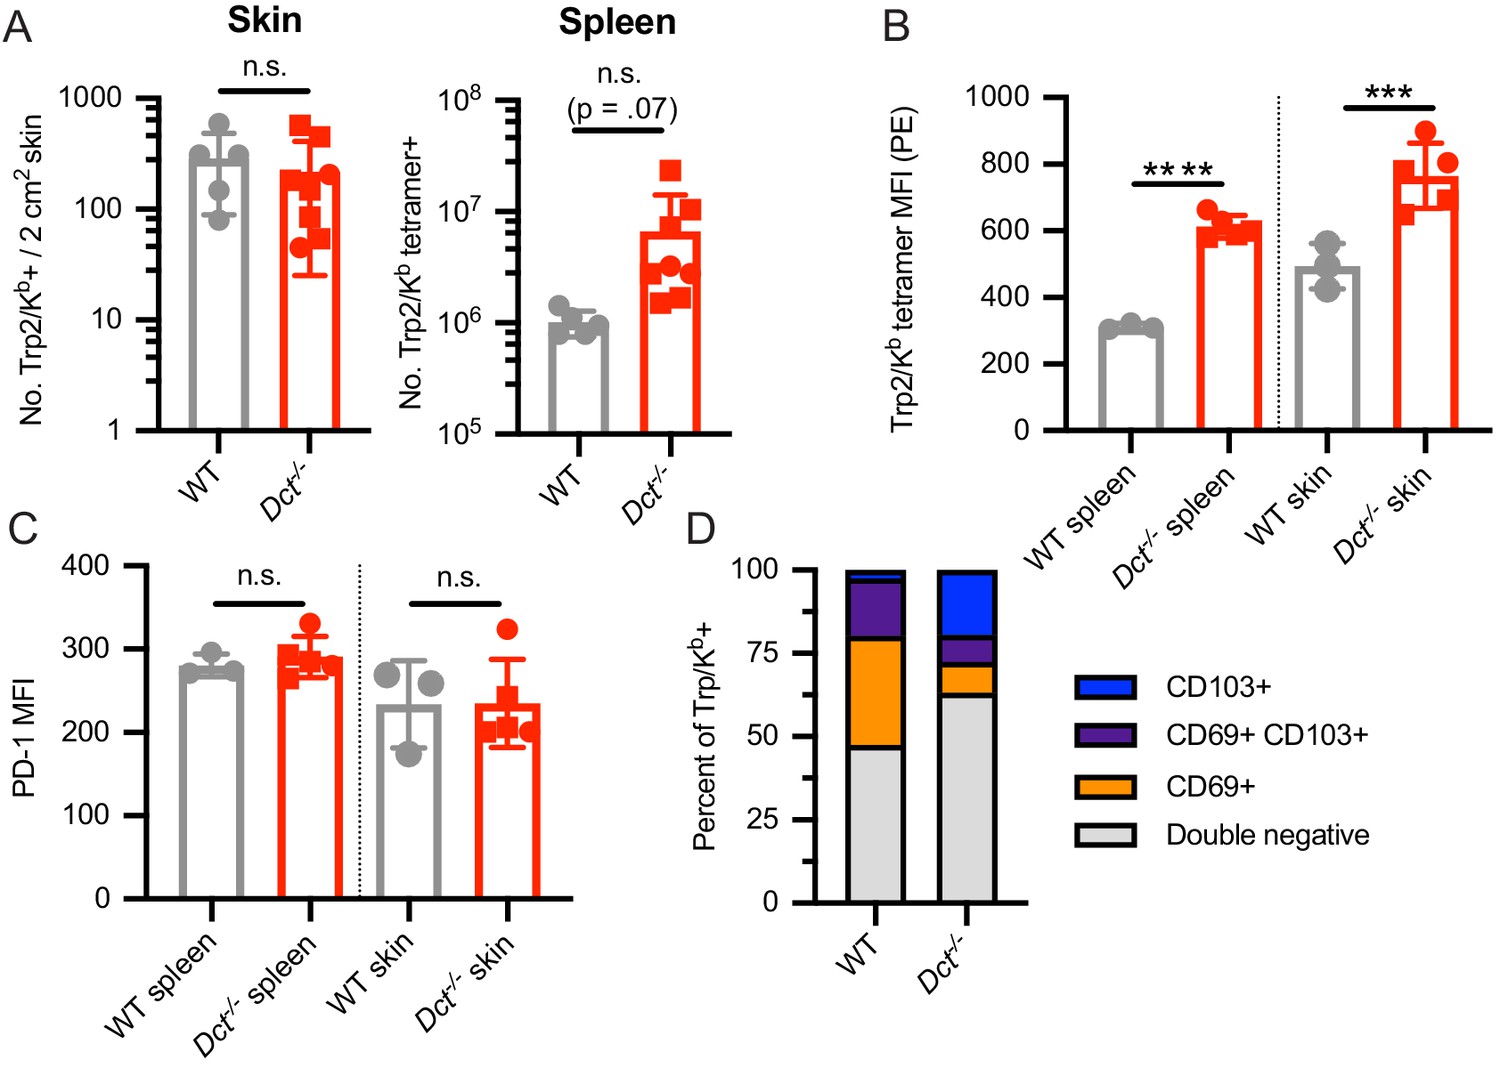
Analysis of Trp2/Kb-specific cells in the skin of wild-type (WT) and Dct-/- mice at day 7 after TriVax.
Mice were treated with TriVax containing Trp2 and B8R peptides (100 μg each) and sacrificed at day 7. An ~2 cm2 piece of skin from the flank of each mouse was shaved, collected, and processed to a single-cell suspension; spleens were also collected. (A) The number of Trp2/Kb-specific cells in the piece of skin (left) or spleen (right) are shown. For Trp2/Kb tetramer-positive cells, the tetramer median fluorescence intensity (MFI) (B), PD-1 MFI (C), or frequency of cells expressing CD69/CD103 (D) are displayed. Squares indicate male animals. Data represent two compiled experiments (A) or individual experiments (B–D). ***p<0.001, ****p<0.0001 by unpaired t test. Welch’s t test was used to compare the number of splenic Trp2/Kb-specific cells in A (p=0.07).
Figure 2—figure supplement 3
Response to infection with Listeria monocytogenes strain expressing Trp2 (LmTrp2).
Mice were infected with a recombinant LmTrp2. The percent (A) or number (B, C) of splenic Trp2/Kb-specific cells was assessed at the indicated day. (D) Day 7 splenocytes were stimulated for 4–6 hr with Trp2 peptide and intracellular staining was performed to assess cytokine production. Data in A, B, and D are representative of three similar experiments; data in C represent individual experiments with two to five mice per group. Squares indicate male animals. *p<0.05, **p<0.01, ***p<0.001, ****p<0.0001 by unpaired t test.
Figure 3 with 1 supplement
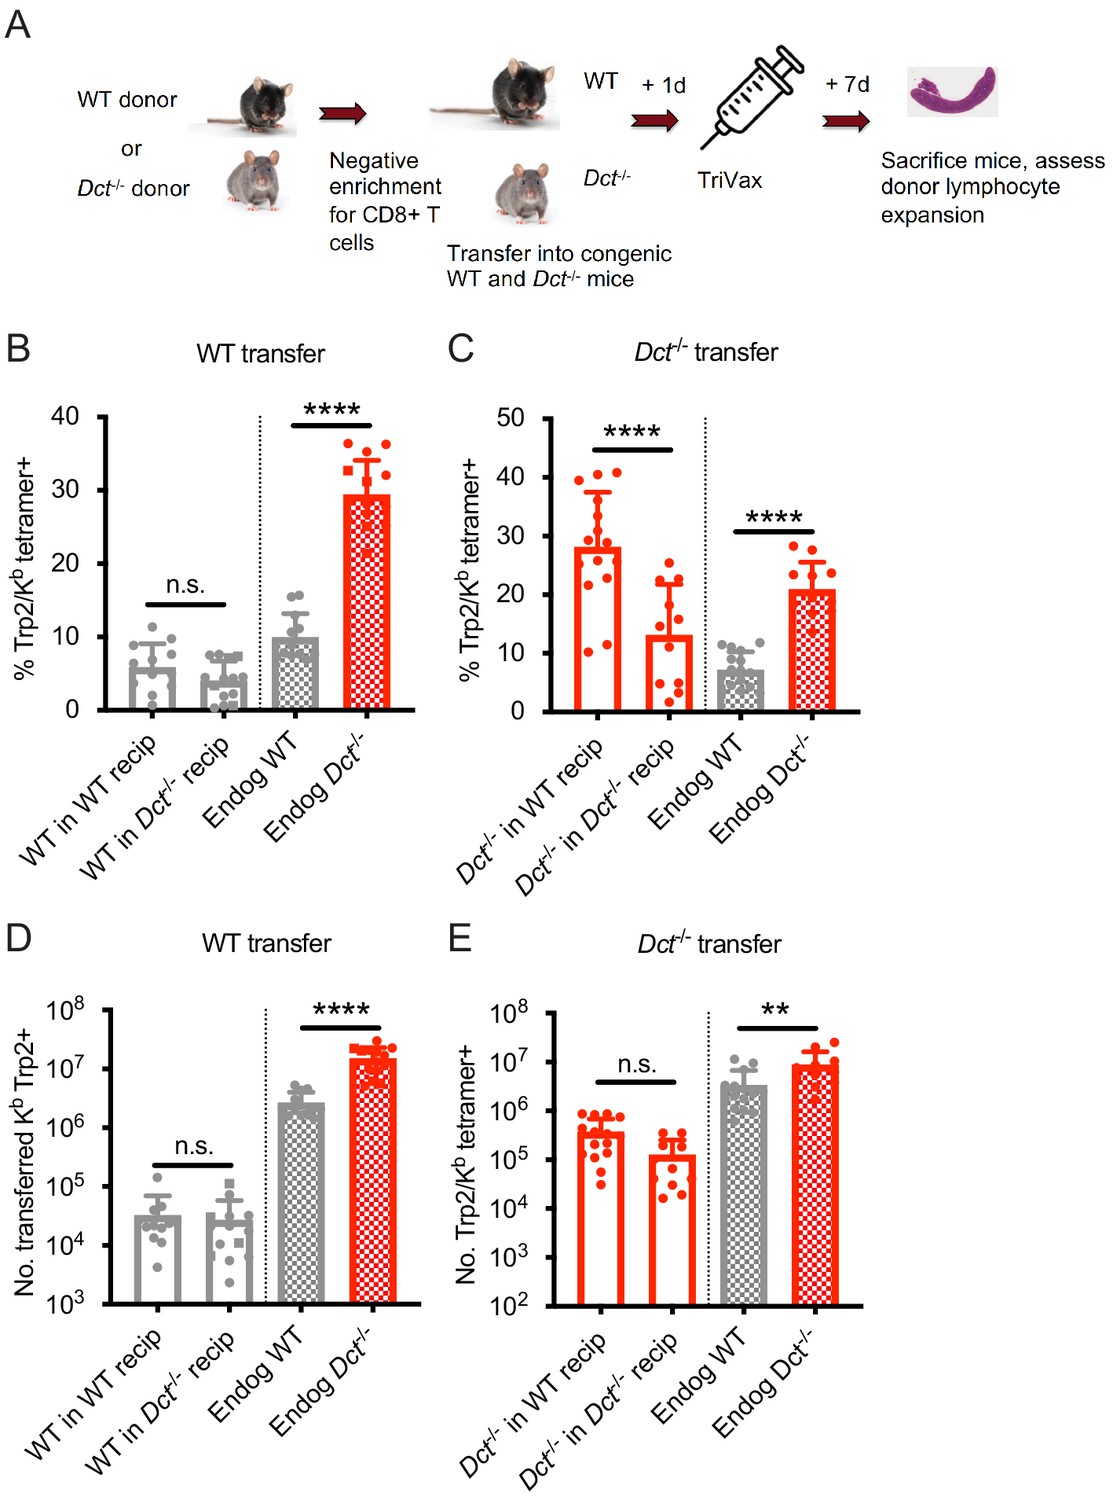
Wild-type (WT) Trp2/Kb-specific cells exhibit cell-intrinsic tolerance.
(A) We performed negative enrichment for CD8+ T cells from WT or Dct-/- donors and transferred bulk CD8+ T cells into congenically distinct WT or Dct-/- recipients. One day later, mice were immunized with TriVax (100 μg of Trp2 and B8R peptide). Donor and endogenous cells were collected from the spleens of recipient mice on day 7 following immunization and assessed for the percent (B, C) and number (D, E) of Trp2/Kb-binding cells. Data in B–E were compiled from three or more experiments. Squares indicate male animals. **p<0.05, ***p<0.001, ****p<0.0001 by one-way ANOVA with Sidak’s multiple comparisons test. Endog, endogenous; recip, recipients.
-
Figure 3—source data 1
Data file related to Figure 3.
- https://cdn.elifesciences.org/articles/65615/elife-65615-fig3-data1-v2.pzfx
Figure 3—figure supplement 1
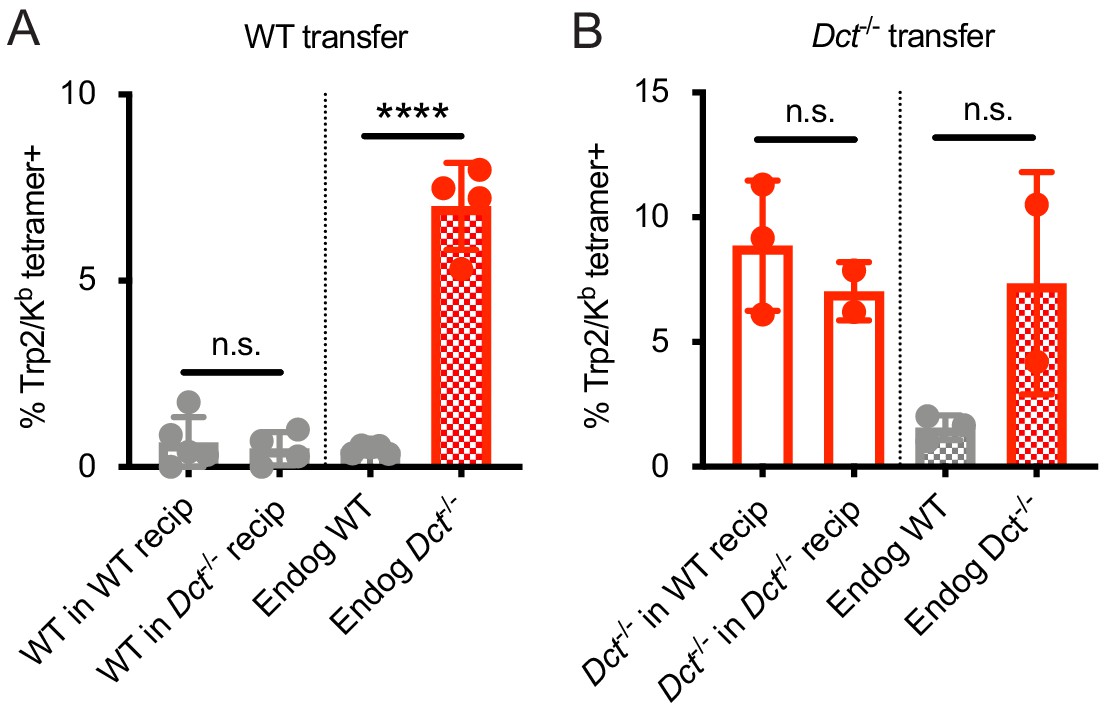
Response to infection with Listeria monocytogenes strain expressing Trp2 (LmTrp2) after adoptive transfer.
(A,B) CD8+ T cells from pre-immune wild-type (WT) (A) or Dct-/- (B) donors were negatively enriched and bulk CD8+ T cells were transferred into congenically distinct WT or Dct-/- recipients. One day later, mice were infected with LmTrp2. Donor and endogenous cells were collected from the blood of recipient mice on day 7 following infection and assessed for Trp2/Kb tetramer binding. Data represent individual experiments with two to five mice per group. ****p<0.0001 by one-way ANOVA with Sidak’s multiple comparisons test. Endog, endogenous; recip, recipients.
Figure 4 with 1 supplement
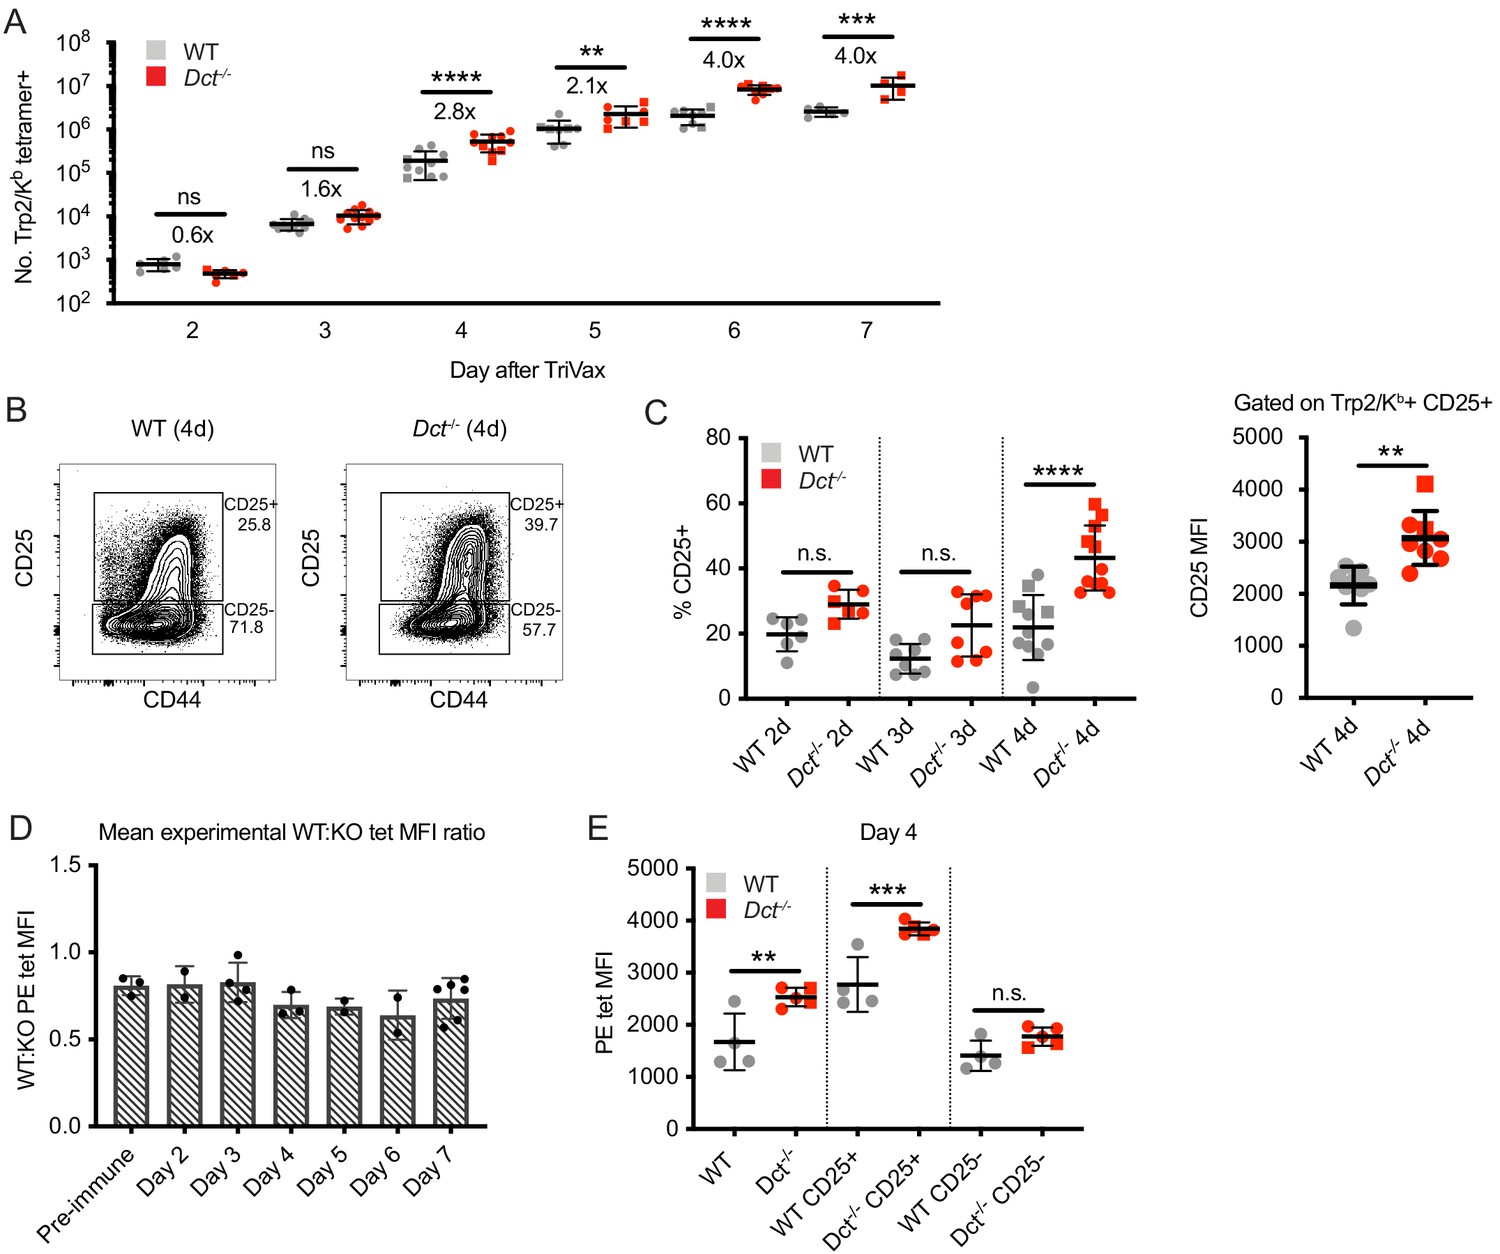
Wild-type (WT) Trp2/Kb-specific cells are capable of an initial response to Trp2 similar to that of Dct-/- cells.
WT and Dct-/- mice received intravenous injections of TriVax with 200 μg Trp2 peptide. Tetramer enrichment was used to enumerate Trp2/Kb-specific cells and assess their phenotype at the indicated time points following immunization (A–C, E). The ratio between the mean experimental PE median fluorescence intensity (MFI) of Trp2/Kb-specific cells in WT mice relative to Dct-/- mice is plotted in D, with each symbol representing one experiment comprising two to five individual mice. Data are compiled from three or more experiments in A, C, and D. Representative flow plots from 1 day four experiment are shown in B, and the same representative day four experiment is shown in E. Squares indicate male animals; the dotted line indicates the average naïve precursor frequency from the spleen and lymph nodes. *p<0.05, **p<0.01, ***p<0.001, ****p<0.0001 by one-way ANOVA with Sidak’s multiple comparisons test (performed on log-transformed data in [a]).
-
Figure 4—source data 1
Data file related to Figure 4.
- https://cdn.elifesciences.org/articles/65615/elife-65615-fig4-data1-v2.pzfx
Figure 4—figure supplement 1
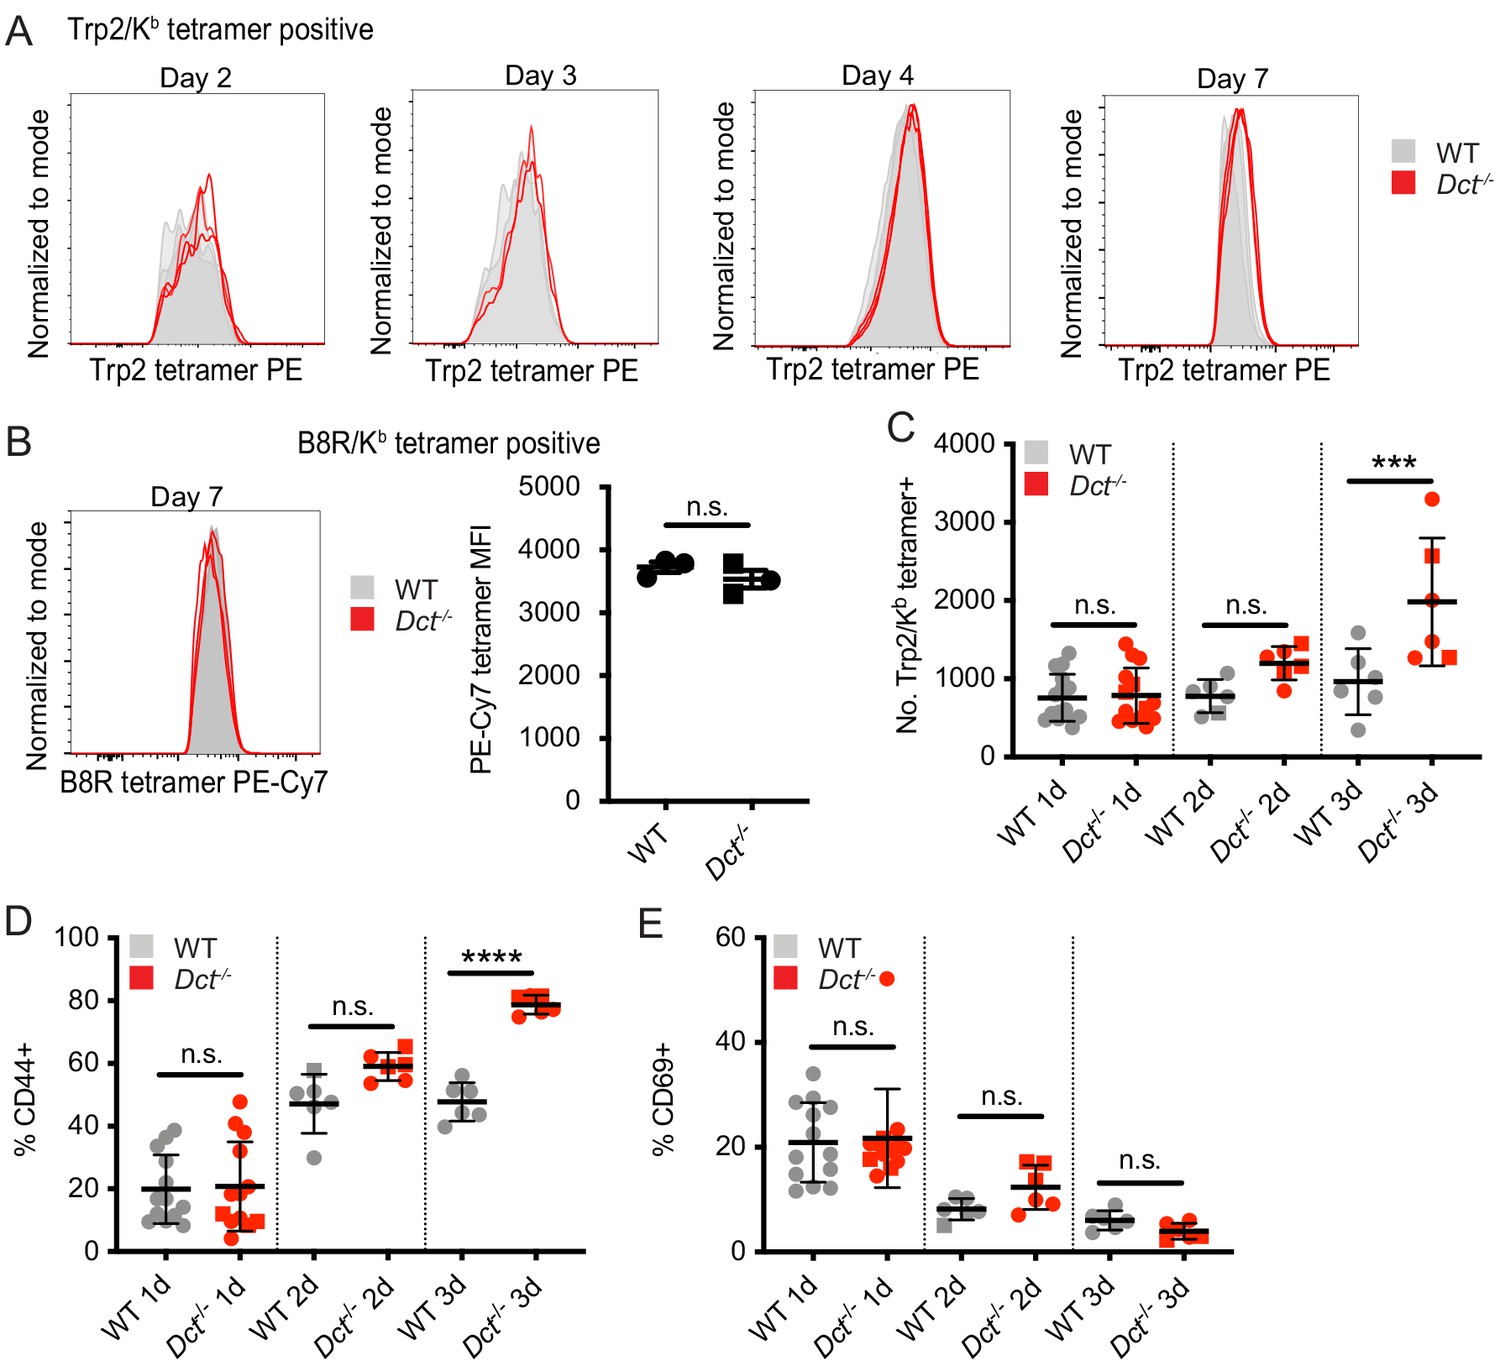
Tetramer staining kinetics and response to peptide immunization.
WT and Dct-/- mice received intravenous injections of 200 μg Trp2 peptide as part of TriVax (A) or alone (C–E). (A) Histograms of tetramer staining for Trp2/Kb-binding cells at the indicated day after TriVax. (B) Histogram and quantification of tetramer staining for B8R/Kb-binding cells at day 7 after TriVax with B8R peptide are shown as a control. (C–E) Tetramer enrichment was used to enumerate Trp2/Kb-specific cells and assess their phenotype at the indicated time points following peptide injection; males are indicated by square symbols. Data from representative experiments at each time point are shown in (A). Data in C–E are compiled from multiple experiments. ***p<0.001, ****p<0.0001 by one-way ANOVA with Sidak’s multiple comparisons test.
Figure 5 with 2 supplements
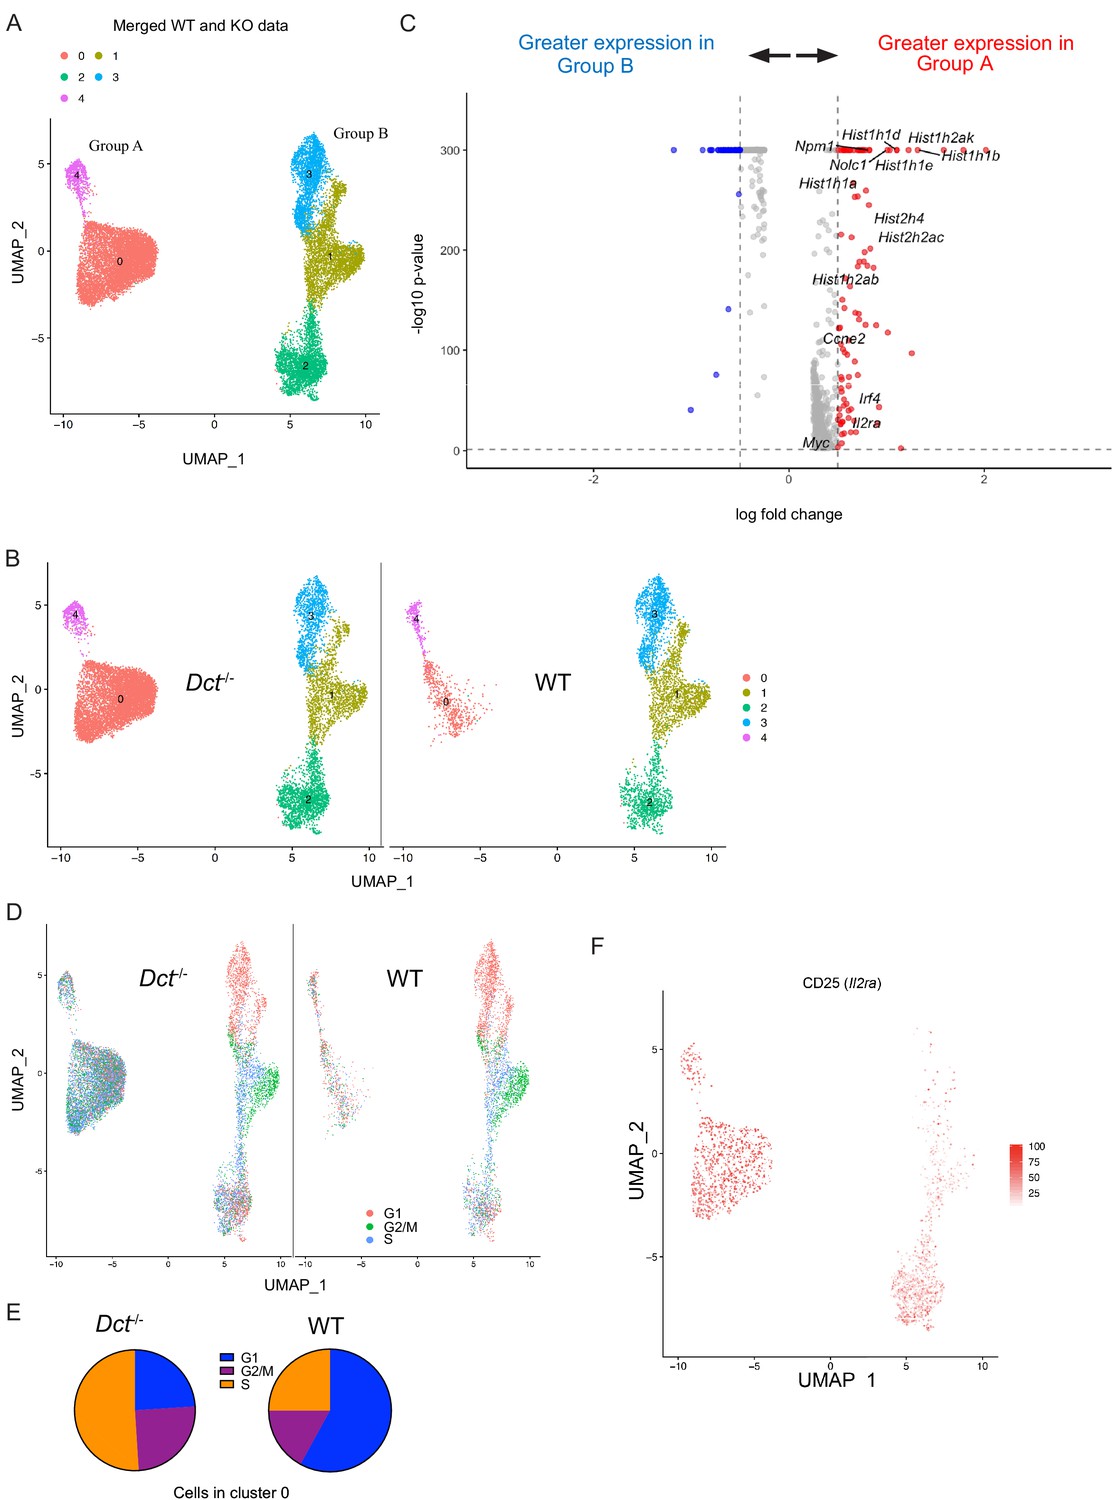
Wild-type (WT) Trp2/Kb-specific cells show proliferative defects in the early effector phase.
Trp2/Kb-specific CD8+ T cells were isolated from WT and Dct-/- mice on day 3 after TriVax and submitted for scRNA-seq. After initial processing, the WT and Dct-/- datasets were merged and further analyzed. (A) Uniform manifold approximation and projection (UMAP) representation of gene expression from merged datasets determined using Seurat; each dot represents one cell. Clusters are indicated by color. (B) Cells from the Dct-/- sample are shown on the left and cells from the WT sample on the right using the same UMAP (generated from merged data) shown in Figure 6A. (C) The most differentially expressed genes between Groups A and B (see Figure 6A); histone genes and other genes associated with proliferation are indicated. A positive average log-fold change value indicates higher expression in Group A. (D) Cell cycle analysis indicates the cell cycle phase for each cell on the UMAP plot (merged dataset). (E) Pie charts show the frequencies of cells within cluster 0 in each stage of the cell cycle (left: Dct-/- sample, right: WT sample). (F) Expression of CD25 (Il2ra) by cell is indicated on the clusters by color.
-
Figure 5—source data 1
Data file related to Figure 5.
- https://cdn.elifesciences.org/articles/65615/elife-65615-fig5-data1-v2.pzfx
Figure 5—figure supplement 1
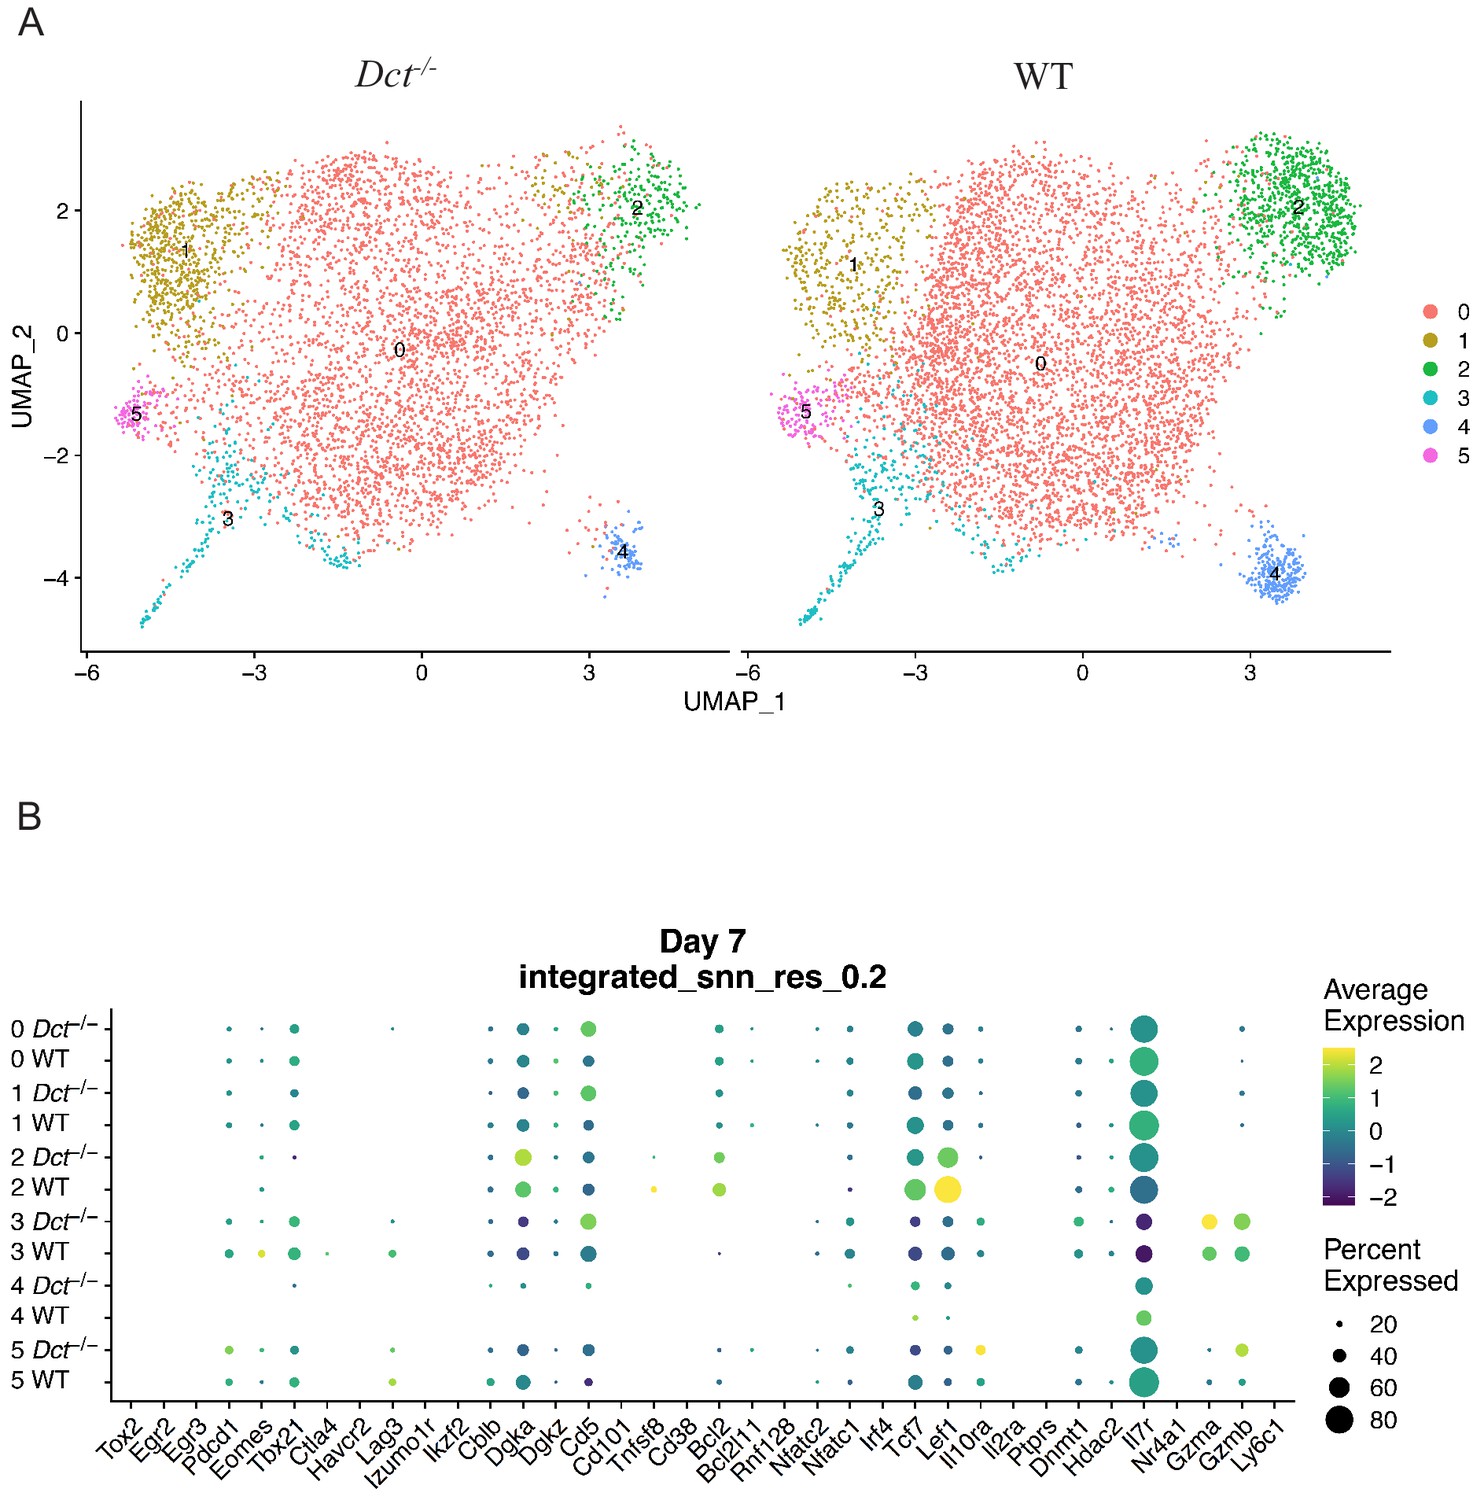
scRNAseq analysis of Trp2/Kb-specific cells at day 7 after TriVax.
Wild-type (WT) and Dct-/- mice were treated with TriVax (50 μg Trp2), and Trp2/Kb-specific cells were isolated at day 7 and submitted for scRNA-seq. After initial processing, the WT and Dct-/- datasets were merged and further analyzed. (A) Uniform manifold approximation and projection (UMAP) representation of gene expression from merged datasets determined using Seurat; each dot represents one cell. Clusters are indicated by color. Cells from the Dct-/- sample are shown on the left and cells from the WT sample on the right using the same UMAP projection (generated from merged data). (B) Dot plot showing the expression of genes associated with activation, functionality, anergy, or exhaustion by sample and cluster.
Figure 5—figure supplement 2
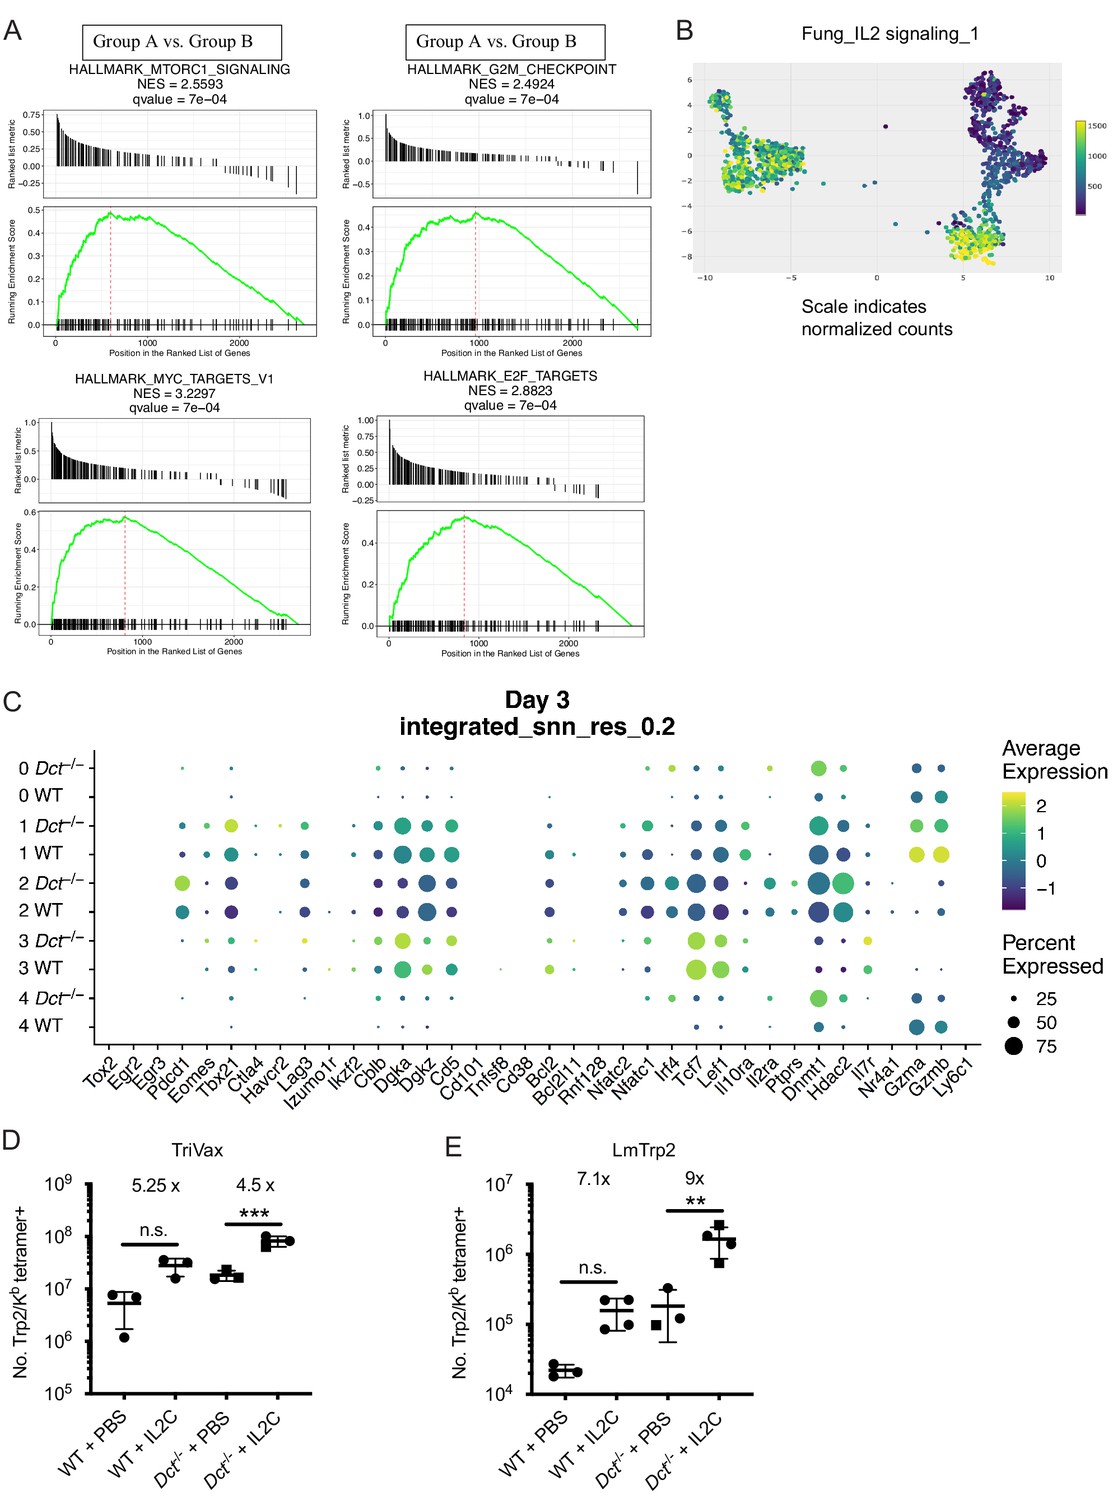
Gene set enrichment analysis (GSEA) of day 3 single-cell data and response of wild-type (WT) and Dct-/- Trp2/Kb-specific cells to IL-2C.
(A) GSEA plots show enrichment of the following gene sets in Group A: Myc targets, MTORC1 signaling, G2M checkpoint, E2F targets. (B) Enrichment between clusters and a dataset of genes involved in IL-2 signaling is indicated by color. (C) Dot plot showing the expression of genes associated with activation, functionality, anergy, or exhaustion by sample and cluster. (D, E) WT and Dct-/- mice were immunized with TriVax (D) or infected with Listeria monocytogenes strain expressing Trp2 (LmTrp2) (E) and treated with PBS or IL-2C on day 5. Trp2/Kb tetramer-positive splenocytes were enumerated on day 7 after priming/infection. Squares indicate male animals. **p<0.01, ***p<0.001 by one-way ANOVA with Tukey’s multiple comparisons test. IL-2C, IL-2 complex.
Figure 6 with 2 supplements
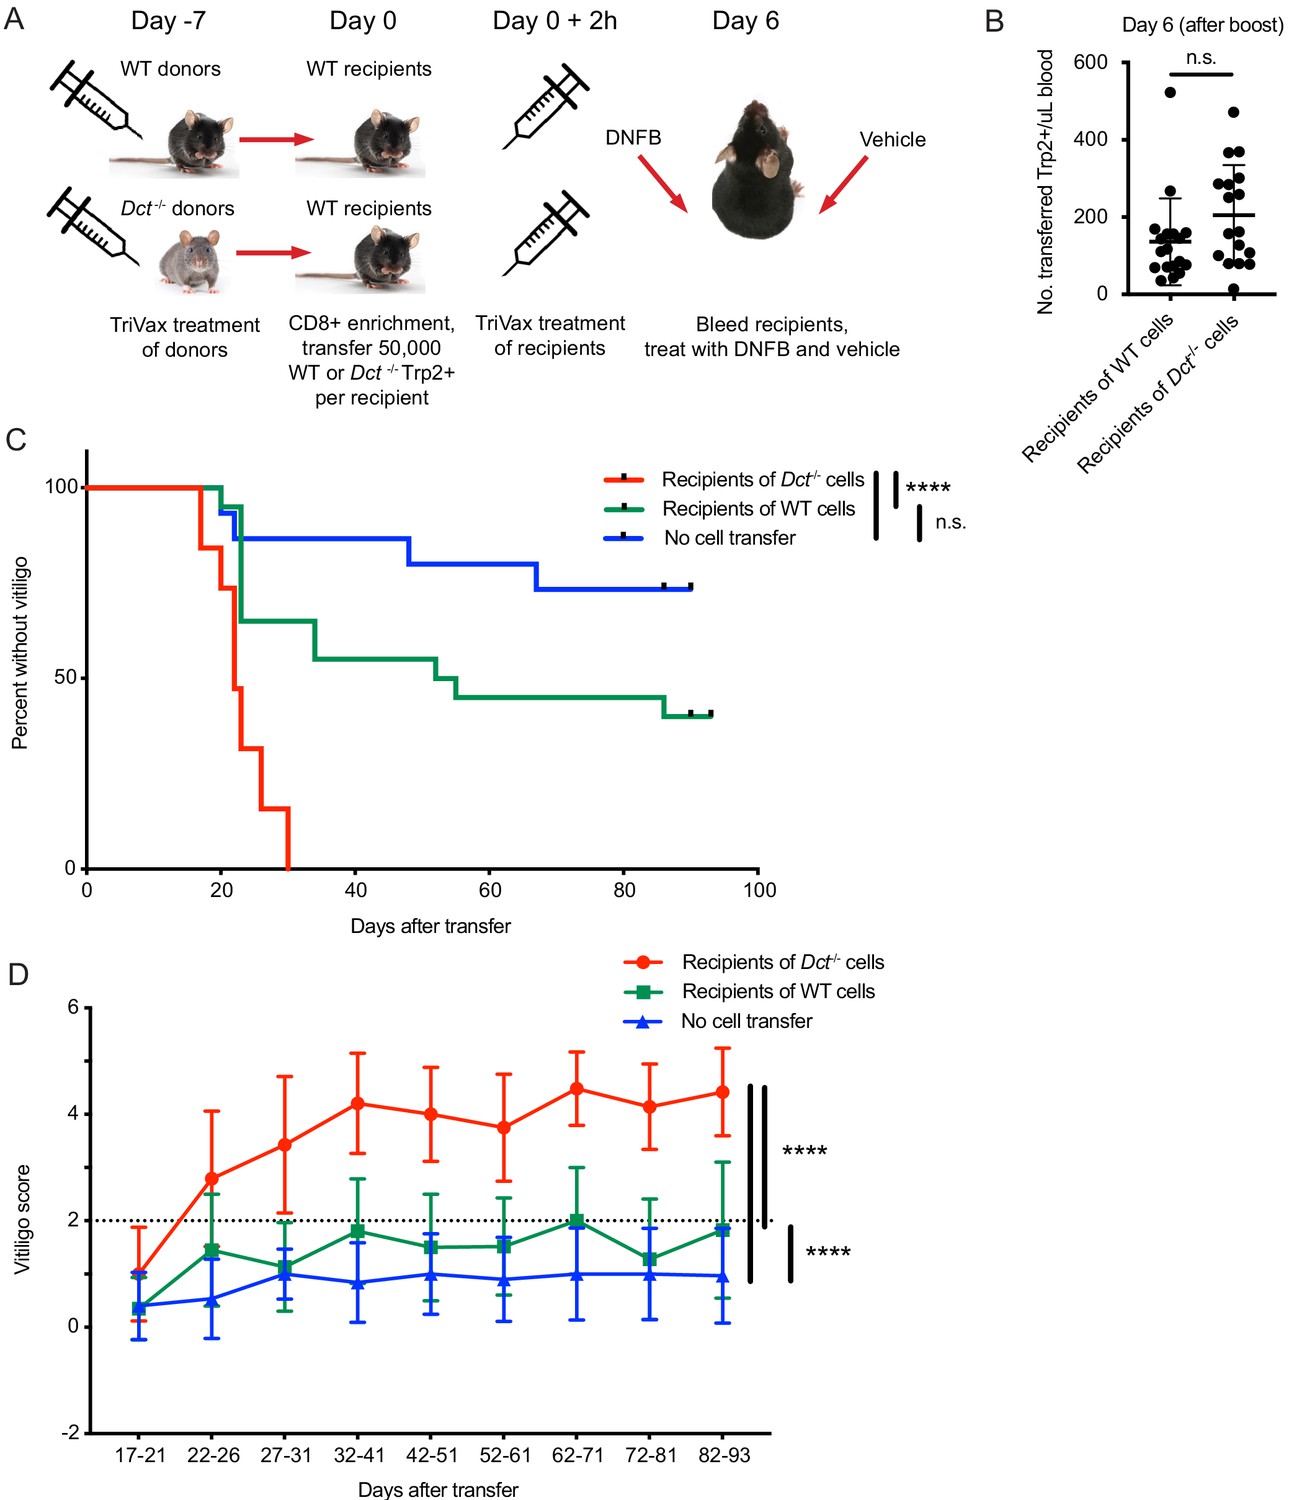
Wild-type (WT) Trp2/Kb-specific cells are unable to mediate efficient anti-melanocyte activity.
(A) WT mice were monitored for vitiligo after receiving 50,000 Trp2/Kb-specific cells from WT or Dct-/- donors primed with TriVax 7 days prior; recipient mice received TriVax (100 μg Trp2) on the day of transfer and were treated with dinitrofluorobenzene (DNFB) (left flank) 6 days later. No cell transfer controls (not shown in schematic) received TriVax and DNFB but no transferred cells. (B) Recipient mice were bled on day 6 after transfer and TriVax; the number of transferred Trp2/Kb-positive cells per μL blood is shown. (C) Kaplan-Meier curve of vitiligo development; mice were considered to have vitiligo when they first had a vitiligo score of two that was sustained. Mean group vitiligo scores over time are shown in (D), with a dotted line indicating definite vitiligo. Data in C and D are compiled from three experiments with 4–10 mice per group. Data in B are compiled from two experiments with 4–10 mice per group. ****p<0.0001 by unpaired t test (B), log-rank survival analysis (C), or two-way ANOVA followed by Tukey’s multiple comparisons test (D).
-
Figure 6—source data 1
Data file related to Figure 6.
- https://cdn.elifesciences.org/articles/65615/elife-65615-fig6-data1-v2.pzfx
Figure 6—figure supplement 1
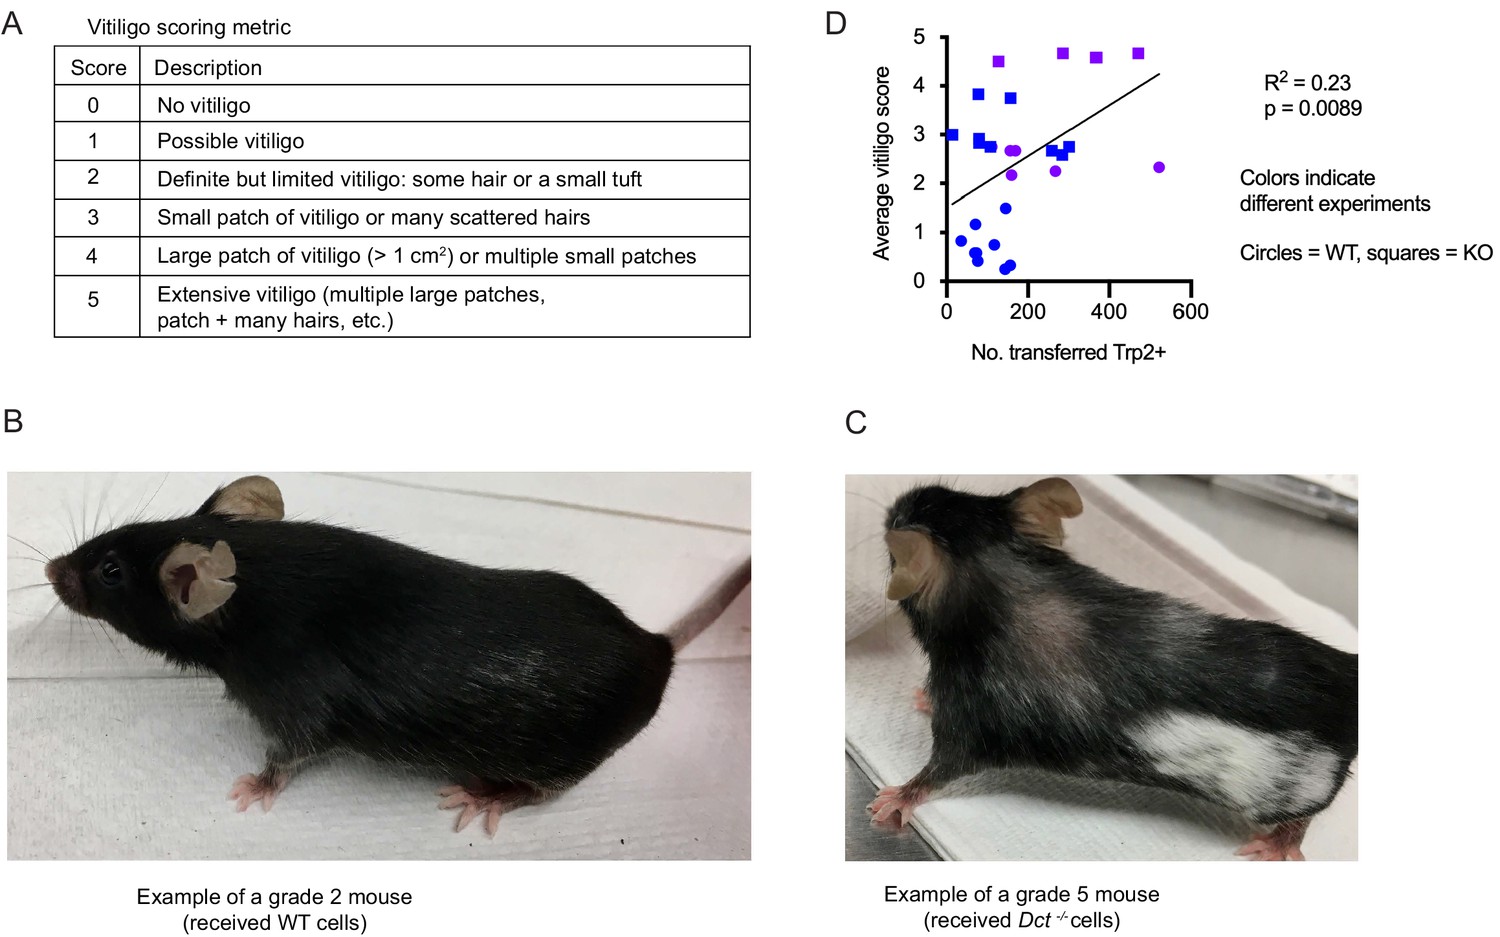
Vitiligo scoring metric and correlation between the average vitiligo score and the number of transferred Trp2/Kb-specific cells.
(A) Vitiligo scoring metric used to quantify the degree of vitiligo. (B, C) Examples of vitiligo. (D) Average vitiligo score per mouse (days 0–93) relative to the number of transferred Trp2/Kb tetramer-positive cells on day 6 after transfer and TriVax boost. Two compiled experiments are shown. Simple linear regression was used to fit a line and assign R2 and p-values.
Figure 6—figure supplement 2
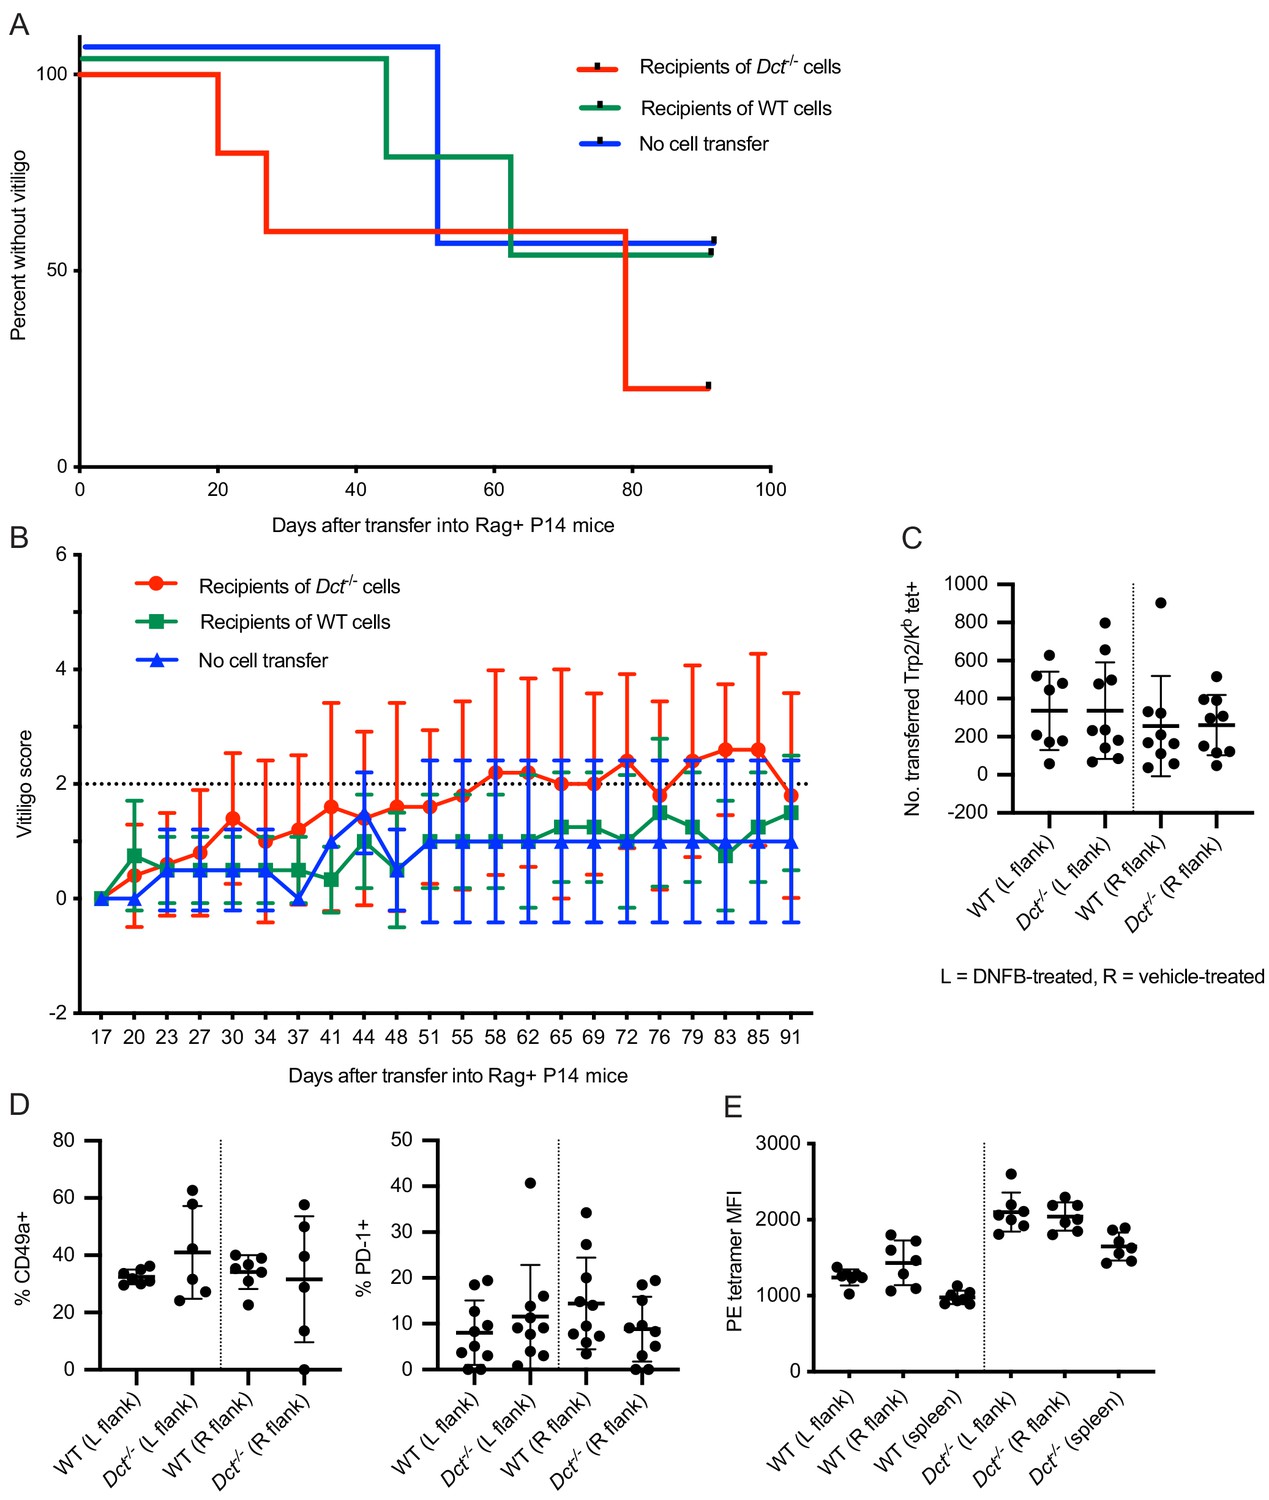
Vitiligo development and skin infiltration in P14 mice receiving cell transfers from wild-type (WT) or Dct-/- donors.
Rag-positive P14 T cell receptor (TCR) transgenic mice were monitored for vitiligo after receiving 50,000 Trp2/Kb-specific cells from WT or Dct-/- donors primed with TriVax 7 days prior; recipient mice received TriVax (100 μg Trp2) on the day of transfer and were treated with dinitrofluorobenzene (DNFB) (left flank) 6 days later. No cell transfer controls received TriVax and DNFB but no transferred cells—the low-grade vitiligo observed in those mice presumably coming from P14 T cells that also rearranged endogenous TCRs or tissue damage that did not require antigen-specific T cell responses. (A) Kaplan-Meier curve of vitiligo development; mice were considered to have vitiligo when they first had a vitiligo score of two that was sustained. Mean group vitiligo scores over time are shown in (B), with a dotted line indicating definite vitiligo. Flank skin (~2 cm2) previously treated with DNFB (left) or vehicle (right) was collected from mice sacrificed at day 11 or 12 after cell transfer and processed to a single-cell suspension. The number of transferred Trp2/Kb tetramer-binding cells is shown in (C). (D) The frequency of transferred Trp2/Kb tetramer-binding cells expressing CD49a and PD-1. The tetramer median fluorescence intensity (MFI) of transferred Trp2/Kb tetramer-positive cells in the skin and spleen is presented in E. Data in A and B represent one experiment with four to five mice in the WT and Dct-/- transfer groups and two mice in the no cell transfer group. Data in C and D represent two experiments with three to seven mice per group; data in E represent one experiment with seven mice per group.
Tables
Key resources table
| Reagent type (species) or resource | Designation | Source or reference | Identifiers | Additional information |
|---|---|---|---|---|
| Strain, strain background (Mus musculus) | Dct-/- (Exon 2–6-/-) | Dr. A. Andy Hurwitz, NCI | ||
| Strain, strain background (Mus musculus) | C57BL/6NCrl (C57BL/6) | NCI Charles River | Strain code: 556 | |
| Strain, strain background (Mus musculus) | B6.SJL-PtprcaPepcb/BoyCrCrl (CD45.1) | NCI Charles River | Strain code: 564 | |
| Strain, strain background (Mus musculus) | P14 | Dr. R. Ahmed, Emory University | ||
| Chemical compound, drug | Poly(I:C) | Invivogen | Cat. #: vac-pic | |
| Antibody | InVivoMAb anti-mouse CD40 | BioXCell | Cat. #: BE0016-2; RRID:AB_1107647 | Clone FGK4.5 |
| Peptide, recombinant protein | Trp2 peptide | New England Peptide | Trp2180-188 H2N-SVYDFFVWL-OH | |
| Chemical compound, drug | 1-Fluoro-2,4-dinitrobenzene (DNFB) | Sigma Aldrich | Cat. #: D-1529 | |
| Antibody | Anti-mouse CD8a FITC | Tonbo Biosciences | Cat. #: 35-0081; RRID:AB_2621671 | Clone 53-6.7 |
| Antibody | Anti-mouse CD8a vf450 | Tonbo Biosciences | Cat. #: 75-0081; RRID:AB_2621931 | Clone 53-6.7 |
| Antibody | Anti-mouse CD8a PerCP-Cy5.5 | Tonbo Biosciences | Cat. #: 65-0081; RRID:AB_2621882 | Clone 53-6.7 |
| Antibody | Anti-mouse CD8a APCef780 | eBioscience | Cat. #: 47-0081-80; RRID:AB_1272221 | Clone 53-6.7 |
| Antibody | Anti-mouse CD4 BV605 | BioLegend | Cat. #: 100548; RRID:AB_2563054 | Clone RM4-5 |
| Antibody | Anti-mouse CD4 PE-Cy7 | Tonbo Biosciences | Cat. #: 60-0042; RRID:AB_2621829 | Clone RM4-5 |
| Antibody | Anti-mouse CD44 BV786 | BD Biosciences | Cat. #: 563736; RRID:AB_2738395 | Clone IM7 |
| Antibody | Anti-mouse CD44 FITC | eBioscience | Cat. #: 11-0441-85; RRID:AB_465046 | Clone IM7 |
| Antibody | Anti-mouse CD44 rf710 | Tonbo Biosciences | Cat. #:80-0441; RRID:AB_2621985 | Clone IM7 |
| Antibody | Anti-mouse CD45.2 FITC | Tonbo Biosciences | Cat. #: 35-0454; RRID:AB_2621692 | Clone 104 |
| Antibody | Anti-mouse CD45.1 PE-Cy7 | Tonbo Biosciences | Cat. #: 60-0453; RRID:AB_2621850 | Clone A20 |
| Antibody | Anti-mouse CD90.1 ef450 | eBioscience | Cat. #: 48-0900-82; RRID:AB_1272254 | Clone HIS51 |
| Antibody | Anti-mouse CD90.2 PE-Cy7 | Tonbo Biosciences | Cat. #: 60-0903; RRID:AB_2621857 | Clone 30-H12 |
| Antibody | Anti-mouse MHC Class II (I-A/I-E) APC ef780 | Thermo Fisher Scientific | Cat. #: 47-5321-82; RRID:AB_1548783 | Clones M5/114.15.2 |
| Antibody | Anti-mouse MHC Class II (I-A/I-E) BV510 | BioLegend | Cat. #: 107635; RRID:AB_2561397 | Clones M5/114.15.2 |
| Antibody | Anti-mouse F4/80 BV510 | BioLegend | Cat. #: 123135; RRID:AB_2562622 | Clone BM8 |
| Antibody | Anti-mouse F4/80 APC ef780 | Thermo Fisher Scientific | Cat. #: 47-4801-82; RRID:AB_2735036 | Clone BM8 |
| Antibody | Anti-mouse CD122 BV421 | BD Biosciences | Cat. #: 562960; RRID:AB_2737918 | Clone TM-β1 |
| Antibody | Anti-human Granzyme B PE | Invitrogen/Thermo | Cat. #: GRB04; RRID:AB_2536538 | Clone GB11 |
| Antibody | Anti-mouse IFN-g PE-Cy7 | Tonbo Biosciences | Cat. #: 60-7311-U100; RRID:AB_2621871 | Clone XMG1.2 |
| Antibody | Anti-mouse TNFa APC | eBioscience | Cat. #: 17-7321-81; RRID:AB_469507 | Clone MP6-XT22 |
| Antibody | Anti-mouse CD107a APC | BioLegend | Cat. #: 121614; RRID:AB_2234505 | Clone ID4B |
| Antibody | Anti-mouse IL-2 APC | BioLegend | Cat. #: 503810; RRID:AB_315304 | Clone JES6-5H4 |
| Antibody | Anti-mouse CD62L BV510 | BD Biosciences | Cat. #: 563117; RRID:AB_2738013 | Clone MEL-14 |
| Antibody | Anti-mouse CD62L PerCP-Cy5.5 | Tonbo Biosciences | Cat. #: 65-0621 | Clone MEL-14 |
| Antibody | Anti-mouse KLRG1 PE-Cy7 | eBioscience/Thermo | Cat. #: 25-5893-82; RRID:AB_1518768 | Clone 2F1 |
| Antibody | Anti-mouse CD127 BV786 | BD Biosciences | Cat. #: 563748; RRID:AB_2738403 | Clone SB/199 |
| Antibody | Anti-mouse CD69 FITC | Tonbo Biosciences | Cat. #: 35-0691; RRID:AB_2621698 | Clone H1.2F3 |
| Antibody | Anti-mouse CD25 PE-Cy7 | Thermo Fisher | Cat. #: 25-0251-82; RRID:AB_469608 | Clone PC61.5 |
| Antibody | Anti-mouse CD103 BV510 | BD Biosciences | Cat. #: 563087; RRID:AB_2721775 | Clone M290 |
| Antibody | Anti-mouse PD-1 PerCP-Cy5.5 | BioLegend | Cat. #: 135208; RRID:AB_2159184 | Clone 29F.1A12 |
| Antibody | Anti-mouse PD-1 FITC | BioLegend | Cat. #: 135214; RRID:AB_10680238 | Clone 29F.1A12 |
| Antibody | Anti-mouse Tim-3 BV421 | BioLegend | Cat. #: 119723; RRID:AB_2616908 | Clone RMT3-23 |
| Antibody | Anti-mouse CTLA-4 PE-Cy7 | BioLegend | Cat. #: 106314; RRID:AB_2564238 | Clone UC10-4B9 |
| Antibody | Anti-mouse CD5 APCef780 | Thermo Fisher scientific | Cat. #: 47-0051-82; RRID:AB_2573940 | Clone 53-7.3 |
| Antibody | Anti-mouse TCRβ APCef780 | Thermo Fisher Scientific | Cat. #: 47-5961-82; RRID:AB_1272173 | Clone H57-597 |
| Antibody | Anti-mouse LAG3 PE-Cy7 | BioLegend | Cat. #: 125226; RRID:AB_2715764 | Clone C9B7W |
| Antibody | Anti-mouse CD49a BUV395 | BD Biosciences | Cat. #: 740262; RRID:AB_2740005 | Clone Ha31/8 |
| Antibody | Anti-mouse CXCR3 PerCP-Cy5.5 | BioLegend | Cat. #: 126514; RRID:AB_1186015 | Clone CXCR3-173 |
| Antibody | InVivoMab anti-mouse IL-2 antibody | BioXCell | Cat. #: BE0043-1; RRID:AB_1107705 | Clone S4B6 |
| Chemical compound, drug | Recombinant Mouse IL-2 Protein, CF | R&D Systems | Cat. #: 402-ML-500/CF | |
| Chemical compound, drug | Streptavidin, R-Phycoerythrin Conjugate, premium grade | Invivogen | Cat. #: S21388 | |
| Chemical compound, drug | Streptavidin, Allophycocyanin Conjugate, premium grade | Invivogen | Cat. #: S32362 | |
| Chemical compound, drug | H-2K(b) SVYDFFVWL Monomer | NIH Tetramer Core | Biotinylated Monomer | |
| Chemical compound, drug | Ghost Dye Red 780 Viability Dye | Tonbo Biosciences | Cat. #: 13-0865-T100 | |
| Chemical compound, drug | LIVE/DEAD Fixable Aqua Dead Cell Stain Kit | Thermo Fisher | Cat. #: L34966 | |
| Chemical compound, drug | Annexin V FITC Apoptosis Detection Kit | BD Biosciences | Cat no. 556570; RRID:AB_2869085 |
Additional files
Download links
A two-part list of links to download the article, or parts of the article, in various formats.
Downloads (link to download the article as PDF)
Open citations (links to open the citations from this article in various online reference manager services)
Cite this article (links to download the citations from this article in formats compatible with various reference manager tools)
CD8+ T cell self-tolerance permits responsiveness but limits tissue damage
eLife 10:e65615.
https://doi.org/10.7554/eLife.65615


