Complementary biosensors reveal different G-protein signaling modes triggered by GPCRs and non-receptor activators
- Department of Biochemistry, Boston University School of Medicine, United States
Figures
Figure 1 with 1 supplement
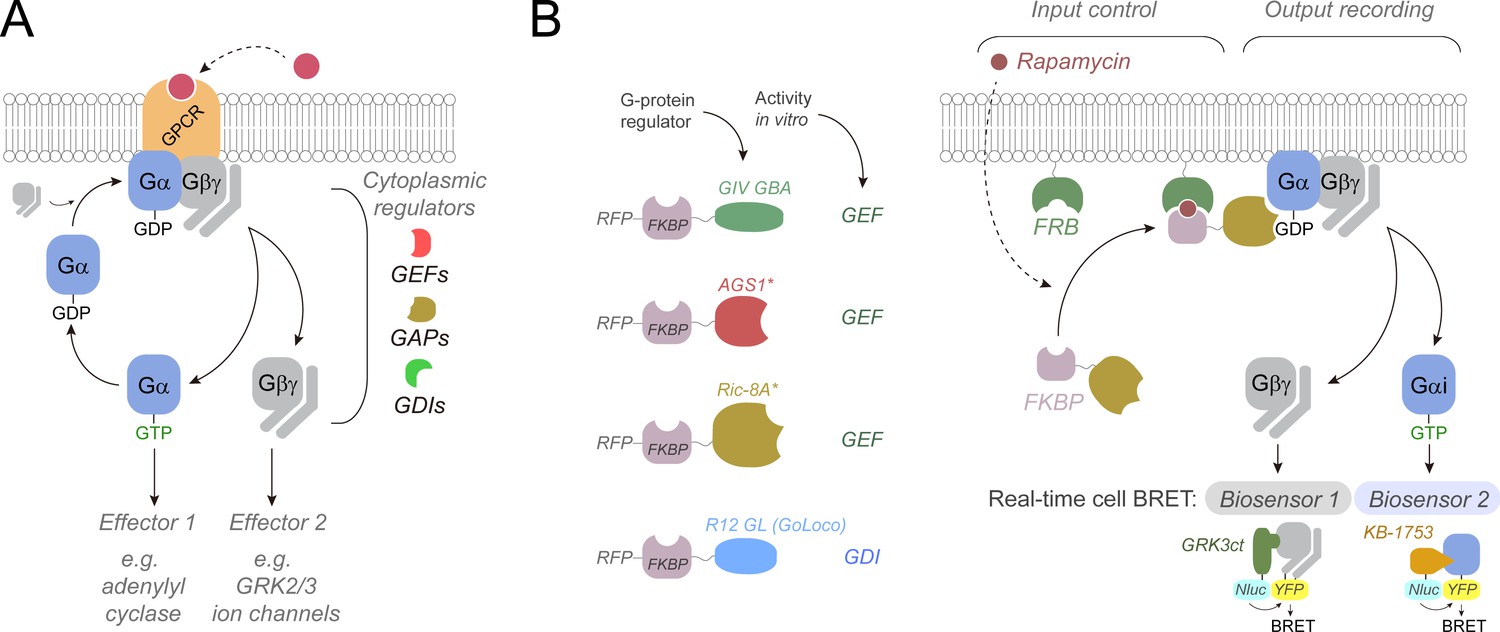
Approach to directly interrogate the regulation of G-protein activity by cytoplasmic proteins in cells.
(A) Diagram of the G-protein-coupled receptor (GPCR)/G-protein activation cycle and different types of cytoplasmic G-protein regulators. (B) Diagram of the experimental approach used to control the activating input for G-protein regulators and simultaneously monitor the G-protein activity output. Chemically induced recruitment of various G-protein regulators to the vicinity of G-proteins at the plasma membrane is achieved through rapamycin-mediated dimerization of FKBP and FRB domains, and G-protein activity is recorded using live-cell bioluminescence resonance energy transfer (BRET) biosensors for free Gβγ or Gαi-GTP. Gβγ tagged with a split YFP (Venus) binds to the C-terminal domain of GRK3 (GRK3ct) fused to nanoluciferase (Nluc) when dissociated from Gα, resulting in BRET from Nluc to YFP. Gαi3 internally tagged with a YFP (Citrine) at the αb/αc loop binds to the synthetic sequence KB-1753 fused to Nluc when bound to GTP, resulting in BRET from Nluc to YFP.
Figure 1—figure supplement 1
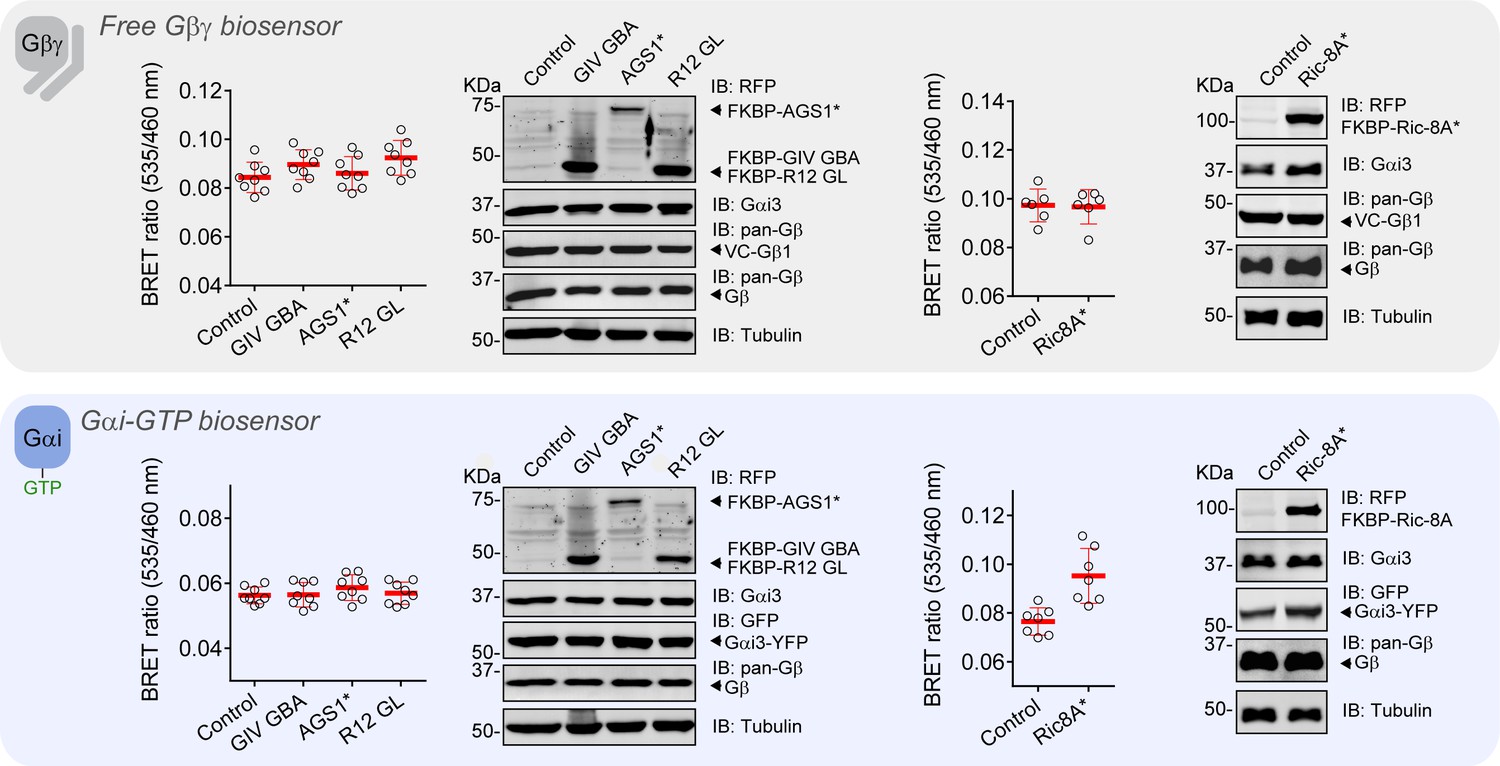
Expression of FKBP-fused G-protein regulators does not alter free Gβγ or Gαi-GTP levels under resting conditions.
Bioluminescence resonance energy transfer (BRET) ratios were determined in HEK293T cells expressing the components of the biosensor for free Gβγ (top) or Gαi-GTP (bottom), the membrane-anchored FRB construct, and the indicated FKBP-fused G-protein regulators (GIVGBA, AGS1*, Ric-8A*, or R12 GL) under resting conditions. Mean ± SD, n = 6–8. Representative immunoblots confirming the expression of FKBP-fused constructs and different G-proteins are shown. Some of the results with Ric-8A* using the Gαi-GTP biosensor have been previously shown in Maziarz et al., 2020 but are displayed here again for clarity (with permission from the publisher).
-
Figure 1—figure supplement 1—source data 1
Numerical data used for the graphs.
- https://cdn.elifesciences.org/articles/65620/elife-65620-fig1-figsupp1-data1-v2.xlsx
Figure 2 with 2 supplements
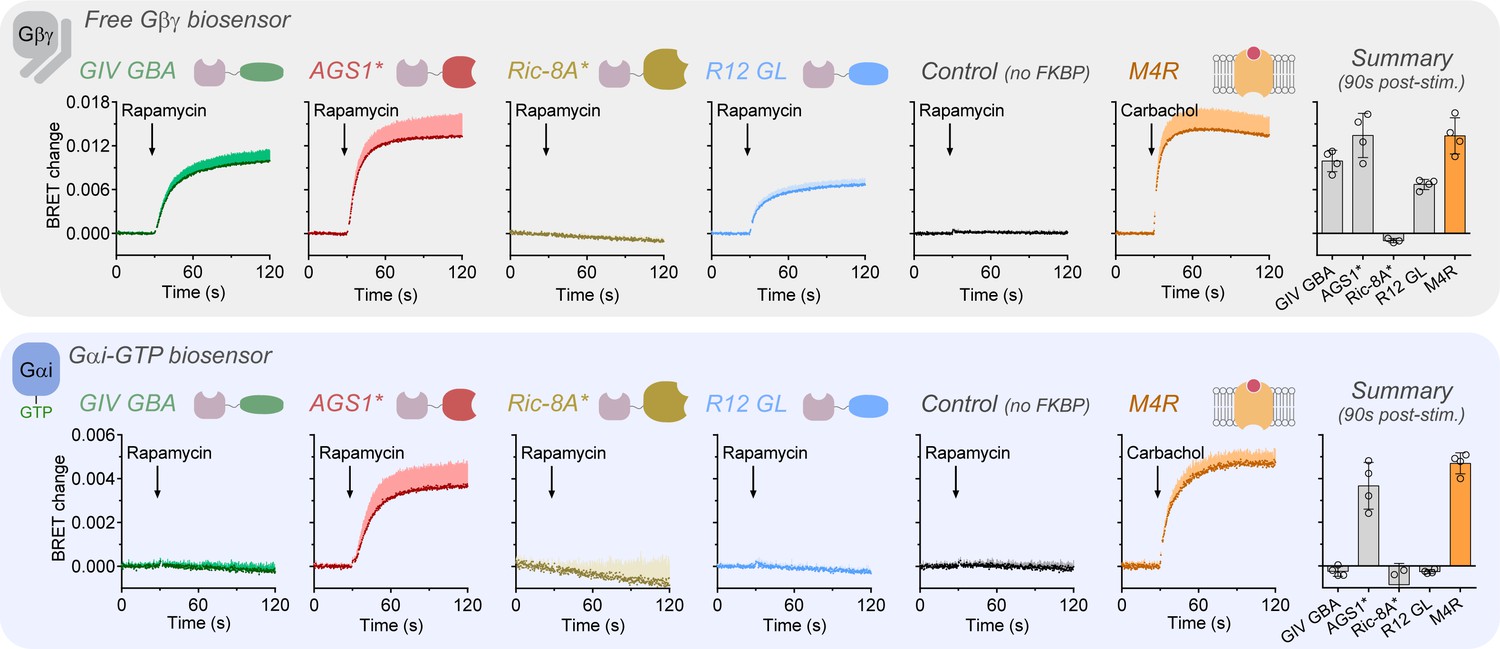
Non-receptor guanine nucleotide exchange factors (GEFs) display different abilities to promote Gα-GTP and/or free Gβγ formation.
HEK293T cells expressing the components of the bioluminescence resonance energy transfer (BRET) biosensor for free Gβγ (top) or Gαi-GTP (bottom), the membrane-anchored FRB construct, and the indicated FKBP-fused G-protein regulators GIV GBA, AGS1*, Ric-8A*, or R12 GL were stimulated with rapamycin (0.5 μM) at the indicated time during kinetic BRET measurements. Stimulation of ectopically expressed M4 muscarinic receptor (M4R) with carbachol (100 μM) was done as a reference condition, and rapamycin stimulation of cells not expressing FKBP-fused constructs was done as a negative control. Bar graphs on the right summarize the BRET changes 90 s after addition of rapamycin or carbachol. Mean ± SD, n = 3–4. In the kinetic traces, the SD is displayed as bars of lighter color tone than data points and only in the positive direction for clarity.
-
Figure 2—source data 1
Numerical data used for the upper panel (free Gβγ biosensor).
- https://cdn.elifesciences.org/articles/65620/elife-65620-fig2-data1-v2.xlsx
-
Figure 2—source data 2
Numerical data used for the lower panel (Gαi-GTP biosensor).
- https://cdn.elifesciences.org/articles/65620/elife-65620-fig2-data2-v2.xlsx
Figure 2—figure supplement 1
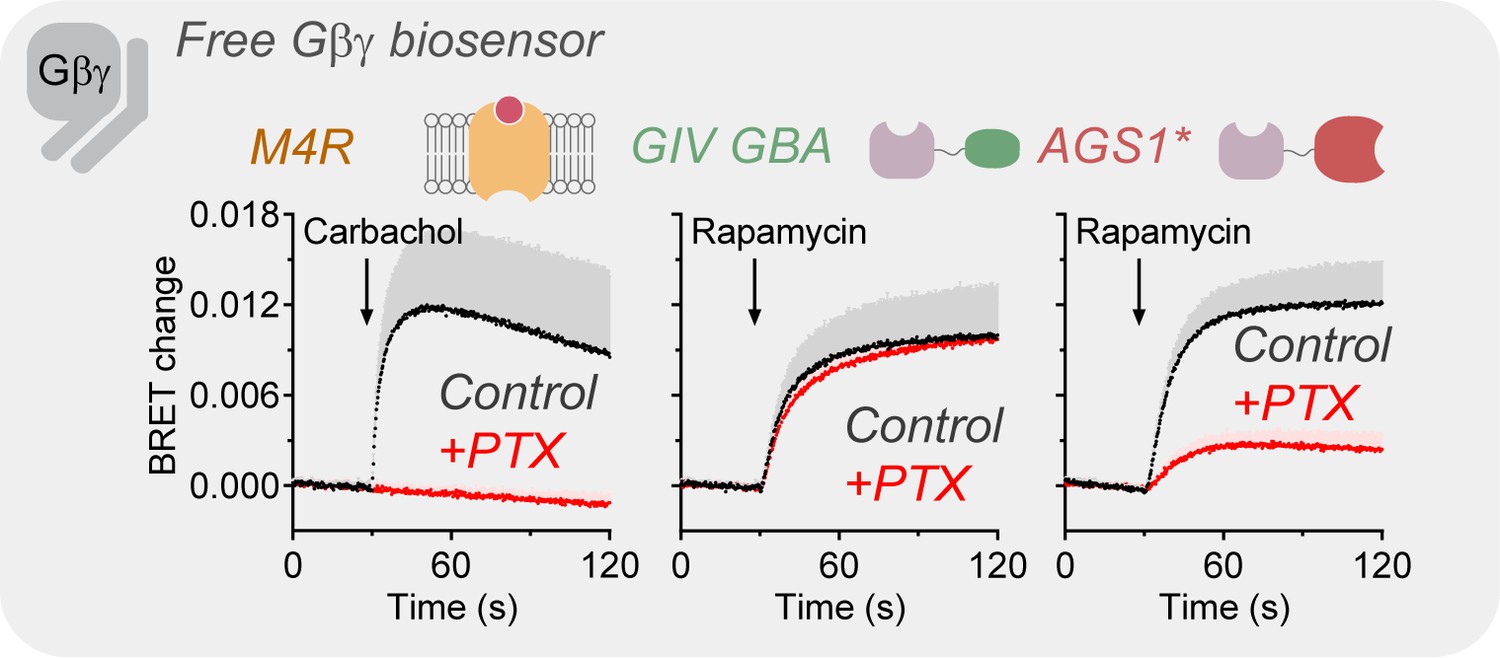
G-protein activation by a GPCR or by AGS1*, but not by GIV GBA, is inhibited by pertussis toxin (PTX).
HEK293T cells expressing the components of the BRET biosensor for free Gβγ, M4R, the membrane-anchored FRB construct, and FKBP-GIV GBA, or FKBP-AGS1* were pretreated (red) or not (black) with PTX. Cells were stimulated with carbachol (100 μM) or rapamycin (0.5 μM) during kinetic BRET measurements as indicated. Mean ± SD, n = 4. SD is displayed as bars of lighter color tone than data points and only in the positive direction for clarity.
-
Figure 2—figure supplement 1—source data 1
Numerical data used for the graphs.
- https://cdn.elifesciences.org/articles/65620/elife-65620-fig2-figsupp1-data1-v2.xlsx
Figure 2—figure supplement 2
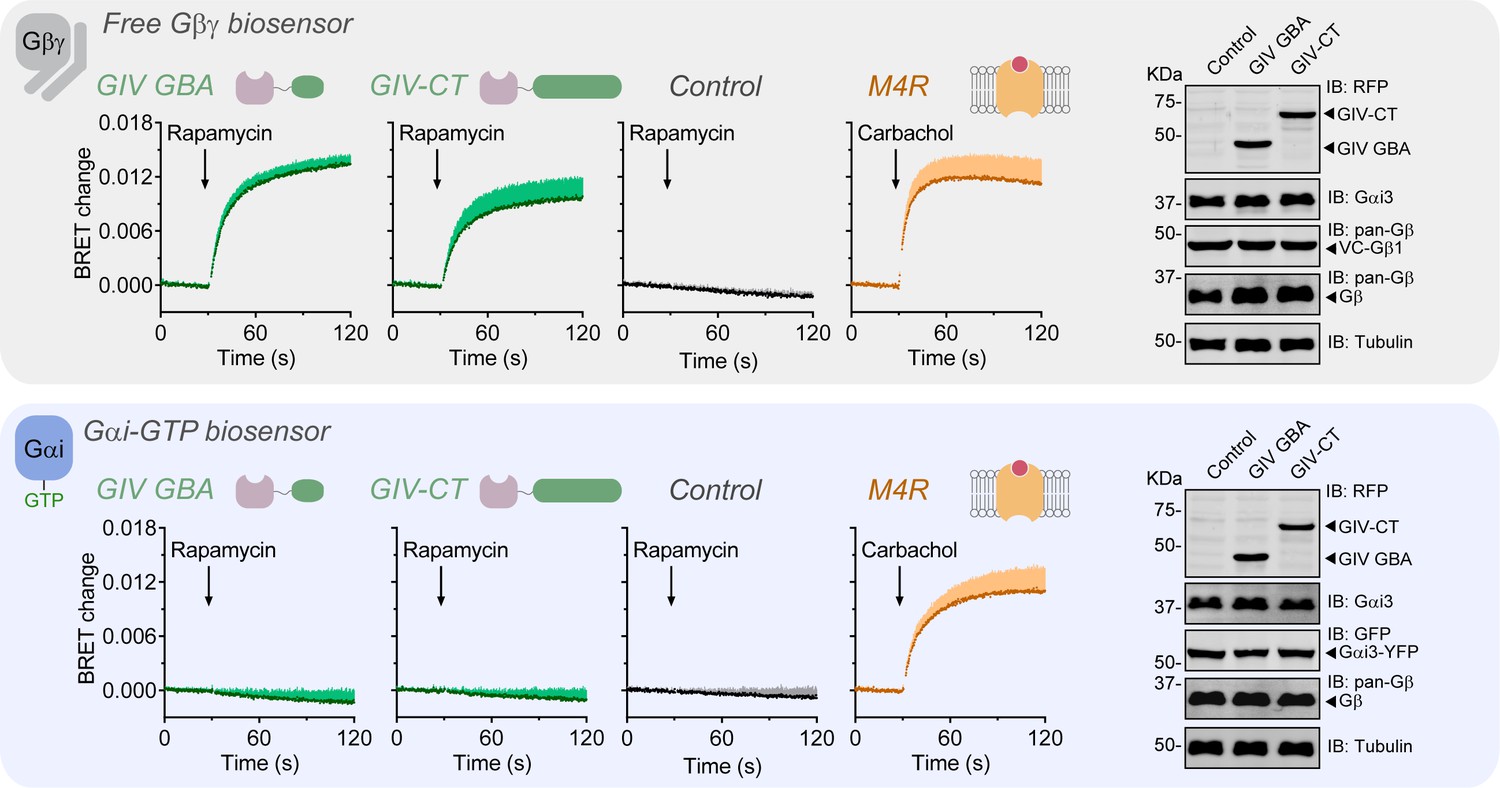
GIV-CT has the same G-protein activating properties as GIV GBA motif.
HEK293T cells expressing the components of the BRET biosensor for free Gβγ (top) or Gαi-GTP (bottom), the membrane-anchored FRB construct, and FKBP-fused GIV GBA or GIV-CT were stimulated with rapamycin (0.5 μM) at the indicated time during kinetic BRET measurements. Stimulation of ectopically expressed M4R with carbachol (100 μM) was done as a reference condition, and rapamycin stimulation of cells not expressing FKBP-fused constructs was done as a negative control. Mean ± SD, n = 3–4. SD is displayed as bars of lighter color tone than data points and only in the positive direction for clarity. Representative immunoblots confirming the expression of similar amounts of FKBP-fused GIV GBA and GIV-CT and different G-proteins are shown on the right.
-
Figure 2—figure supplement 2—source data 1
Numerical data used for the upper panel (free Gβγ biosensor).
- https://cdn.elifesciences.org/articles/65620/elife-65620-fig2-figsupp2-data1-v2.xlsx
-
Figure 2—figure supplement 2—source data 2
Numerical data used for the lower panel (Gαi-GTP biosensor).
- https://cdn.elifesciences.org/articles/65620/elife-65620-fig2-figsupp2-data2-v2.xlsx
Figure 3 with 1 supplement
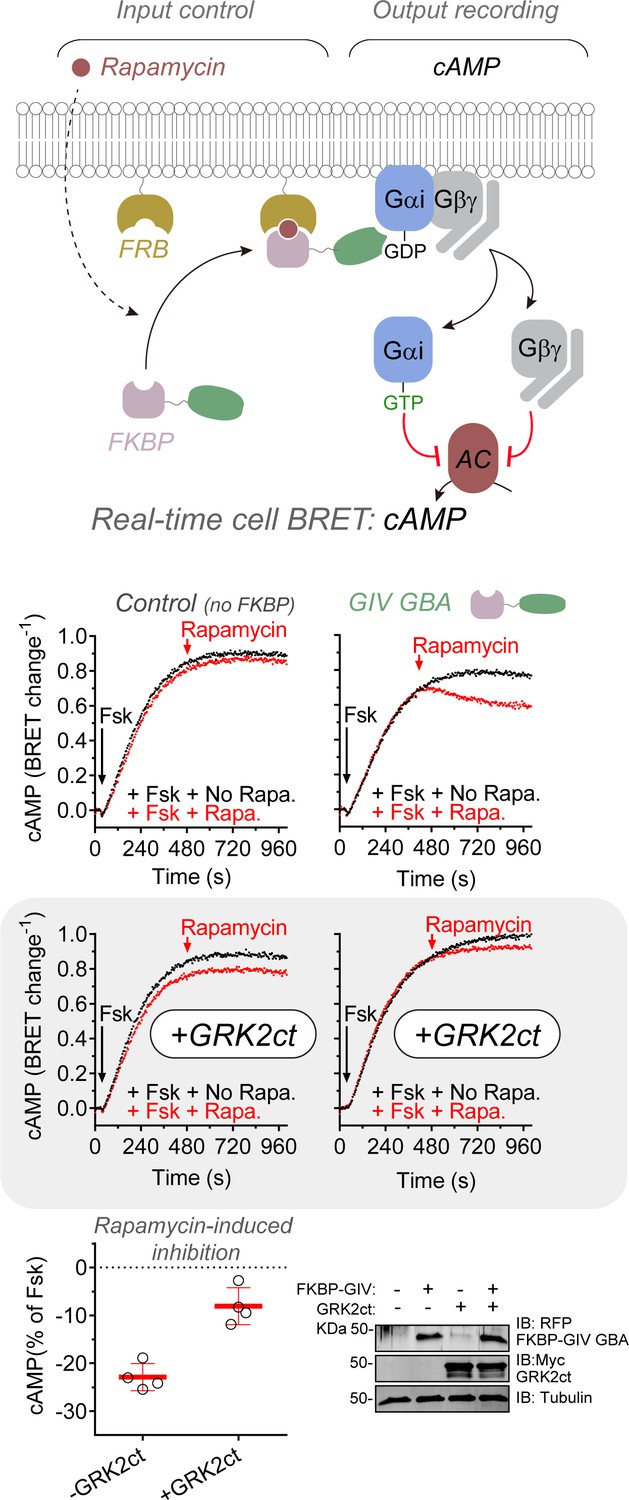
GIV-mediated cAMP dampening is prevented upon Gβγ scavenging.
HEK293T cells were transfected with plasmids for the expression of the cAMP sensor Nluc-EPAC-VV, the membrane-anchored FRB construct, and FKBP-fused GIV GBA or an empty plasmid in the presence or absence of GRK2ct as indicated. Cells were stimulated with forskolin (black) or sequentially with forskolin and rapamycin (red) at the indicated times during kinetic BRET measurements. Forkolin (Fsk) = 3 μM; rapamycin = 0.5 μM. Time traces are from one representative experiment, and the quantification of rapamycin-induced inhibition of the forskolin cAMP response shown presented in the scatter plot on the bottom left is the mean ± SD of four independent experiments. A representative immunoblot confirming the expression of GIV GBA and GRK2ct is shown on the bottom right.
-
Figure 3—source data 1
Numerical data used for the lower panel (Gαi-GTP biosensor).
- https://cdn.elifesciences.org/articles/65620/elife-65620-fig3-data1-v2.xlsx
Figure 3—figure supplement 1
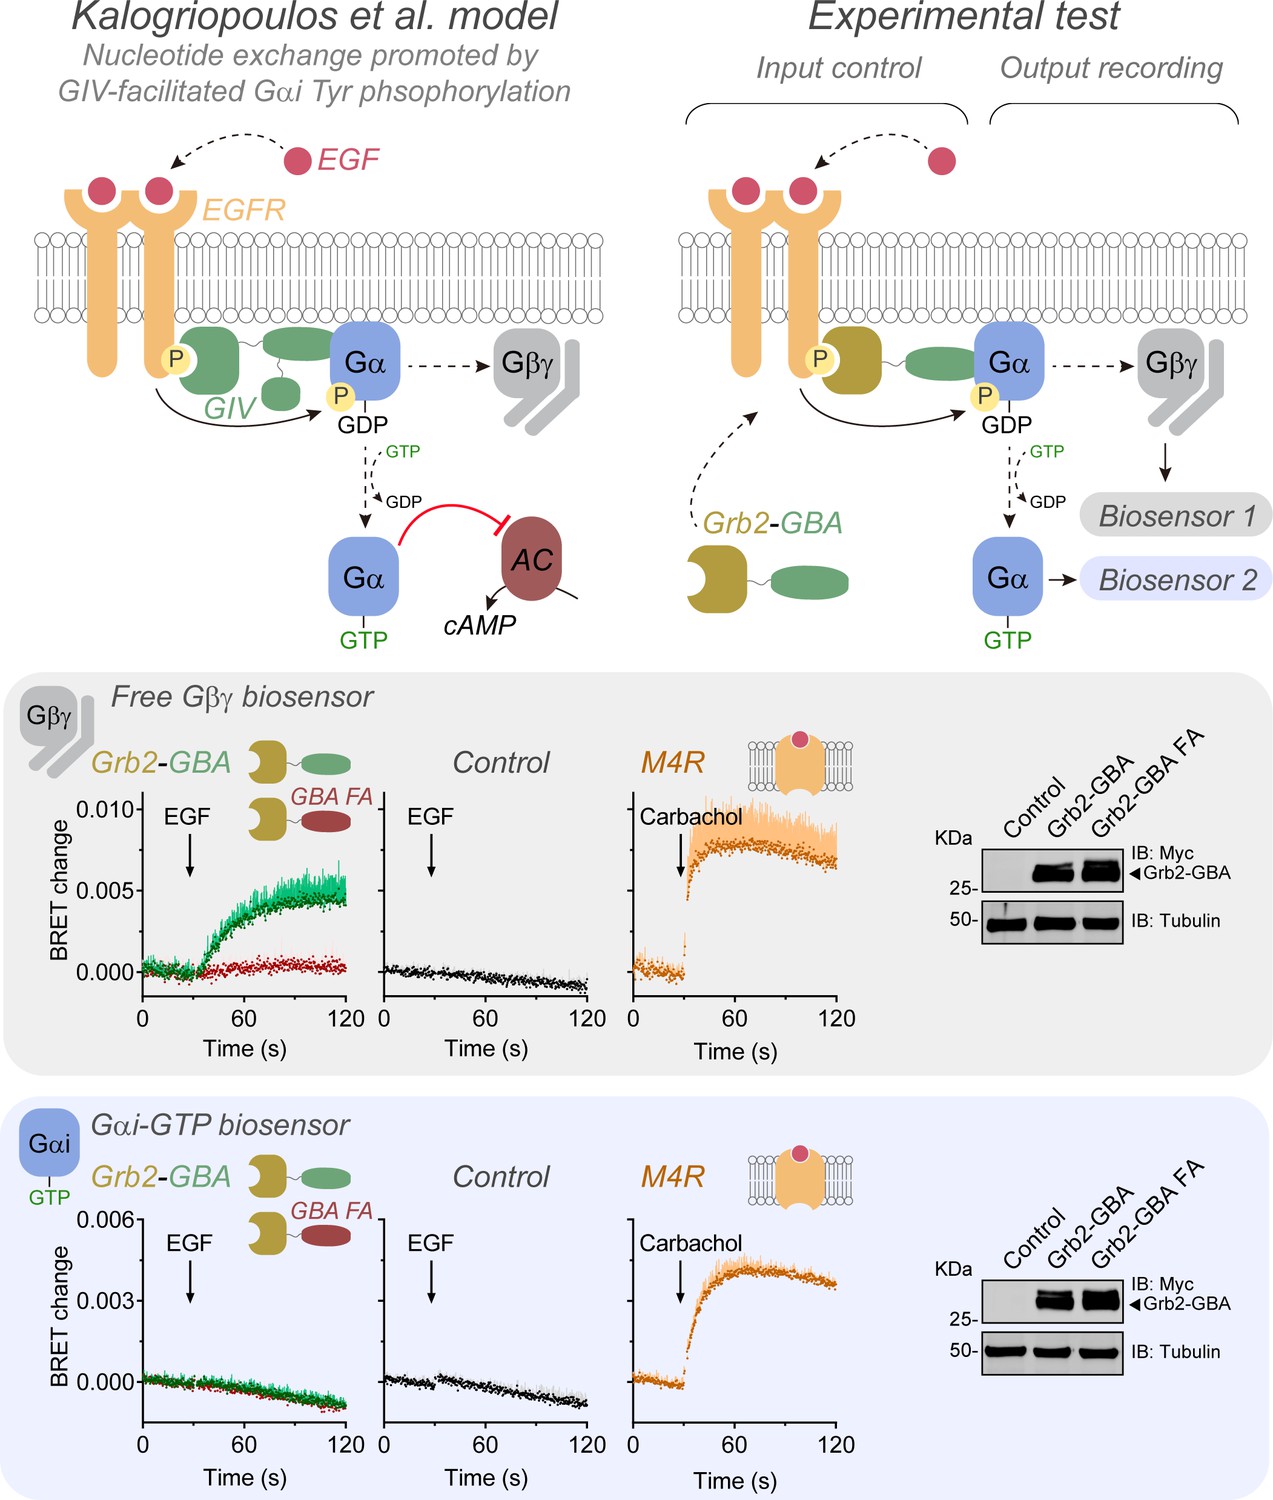
Recruitment of GIVGBA motif to RTKs promotes Gβγ release but not Gαi-GTP formation.
Top, diagram summarizing the model proposed by Kalogriopoulos et al., 2020 to explain the role of GIV in facilitating Gαi activation by RTK-mediated phosphorylation is shown on the left. The panel on the right displays a diagram of the experimental approach utilized to mimic the recruitment of GIV to RTKs and assess its direct consequences on Gαi-GTP or free Gβγ formation. Bottom, HEK293T cells expressing exogenous EGFR, the components of the BRET biosensor for free Gβγ (top) or Gαi-GTP (bottom), the membrane-anchored FRB construct, and Grb2-GBA WT (green) or Grb2-GBA FA mutant (red) constructs were stimulated with EGF (50 ng/μl) at the indicated time during kinetic BRET measurements. Stimulation of ectopically expressed M4R with carbachol (100 μM) was done as a reference condition, and EGF stimulation of cells not expressing Grb2-GBA constructs was done as a negative control. Mean ± SD, n = 2. SD is displayed as bars of lighter color tone than data points and only in the positive direction for clarity. Representative immunoblots confirming the expression of similar amounts of Grb2-GBA WT and Grb2-GBA FA are shown on the right.
-
Figure 3—figure supplement 1—source data 1
Numerical data used for the upper graphs (free Gβγ biosensor).
- https://cdn.elifesciences.org/articles/65620/elife-65620-fig3-figsupp1-data1-v2.xlsx
-
Figure 3—figure supplement 1—source data 2
Numerical data used for the lower graphs (Gαi-GTP biosensor).
- https://cdn.elifesciences.org/articles/65620/elife-65620-fig3-figsupp1-data2-v2.xlsx
Figure 4
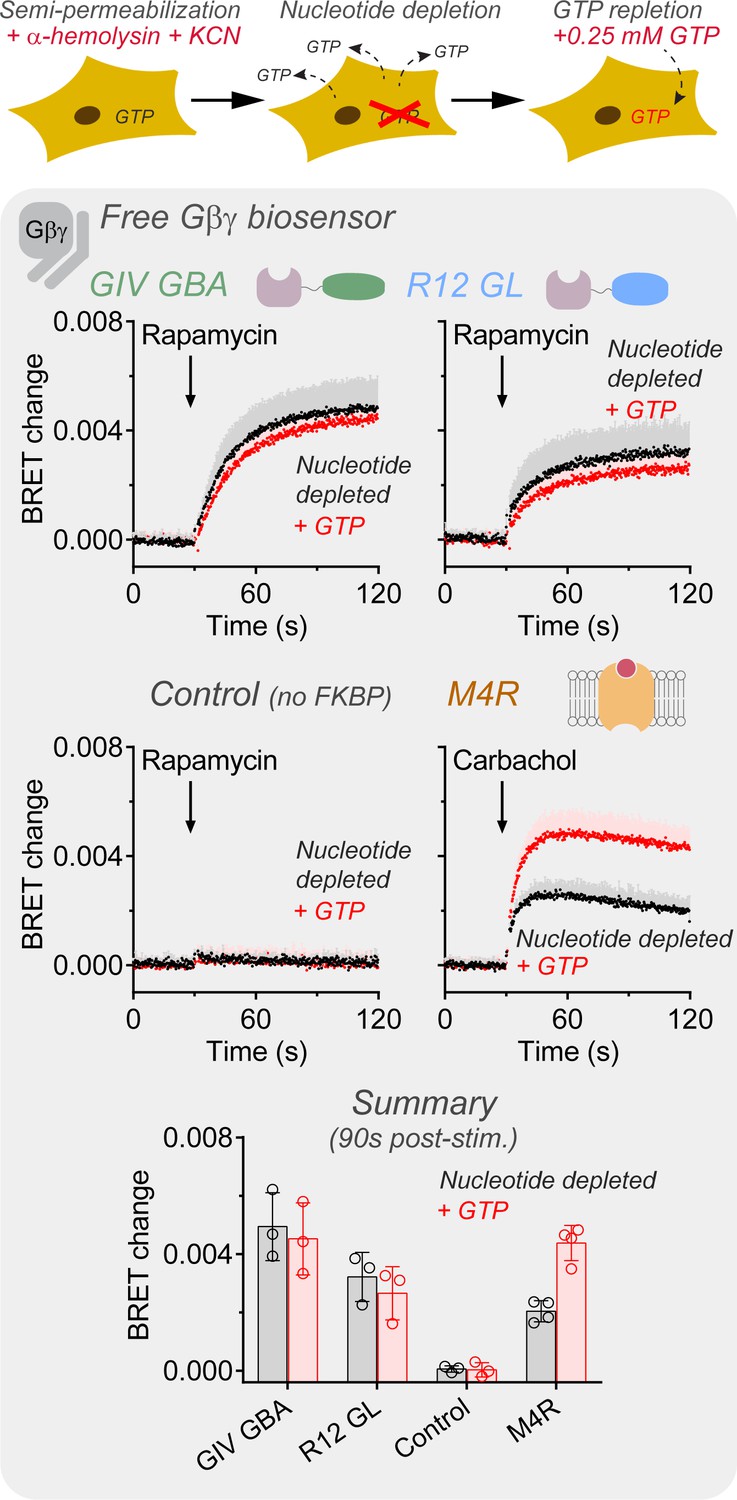
Gβγ release by GIV is insensitive to cellular GTP depletion.
HEK293T cells expressing the components of the BRET biosensor for free Gβγ, the membrane-anchored FRB construct, and FKBP-fused GIV GBA or R12 GL were depleted of nucleotides (black) or replenished with GTP (0.25 mM, red) as indicated in 'Materials and methods'. Cells were stimulated with rapamycin (0.5 μM) at the indicated time during kinetic BRET measurements. Stimulation of ectopically expressed M4R with carbachol (100 μM) was done as a reference condition, and rapamycin stimulation of cells not expressing FKBP-fused constructs was done as a negative control. The bar graph on the bottom summarizes the BRET changes 90 s after addition of rapamycin or carbachol. Mean ± SD, n = 3–4. In the kinetic traces, the SD is displayed as bars of lighter color tone than data points and only in the positive direction for clarity.
-
Figure 4—source data 1
Numerical data used for the graphs.
- https://cdn.elifesciences.org/articles/65620/elife-65620-fig4-data1-v2.xlsx
Figure 5
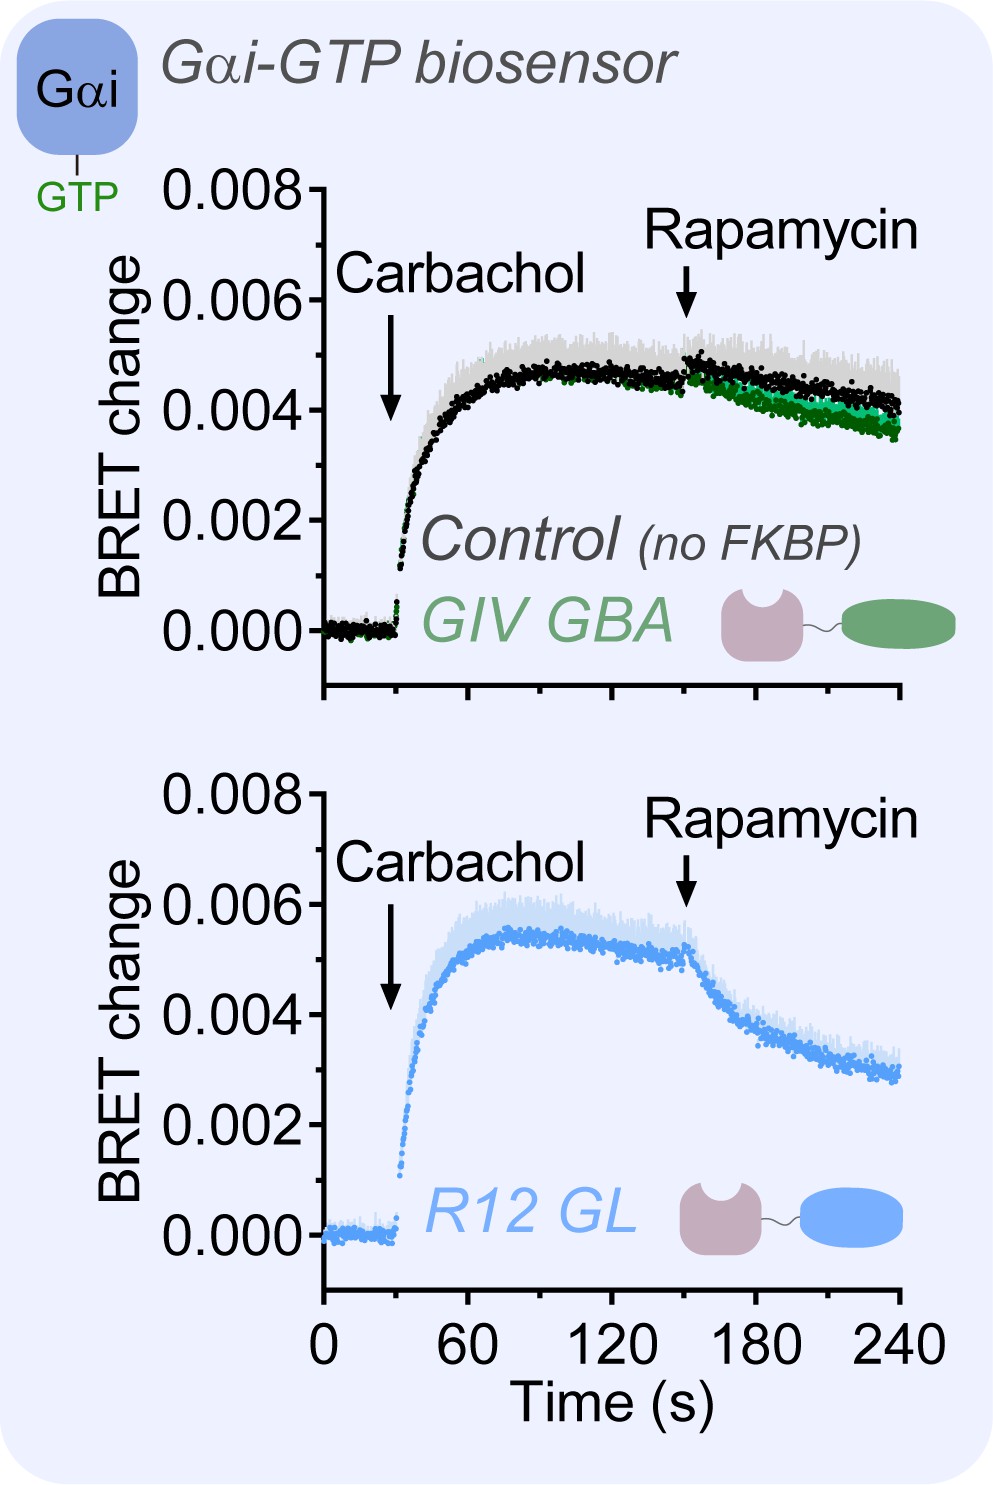
R12 GL, but not GIV GBA, suppresses GPCR-mediated Gα-GTP formation.
HEK293T cells expressing the components of the BRET biosensor for Gαi-GTP, the membrane-anchored FRB construct, M4R, and FKBP-fused GIV GBA or R12 GL were sequentially stimulated with carbachol (100 μM) and rapamycin (0.5 μM) at the indicated times during kinetic BRET measurements. Mean ± SD, n = 4. SD is displayed as bars of lighter color tone than data points and only in the positive direction for clarity.
-
Figure 5—source data 1
Numerical data used for the graphs.
- https://cdn.elifesciences.org/articles/65620/elife-65620-fig5-data1-v2.xlsx
Figure 6 with 1 supplement
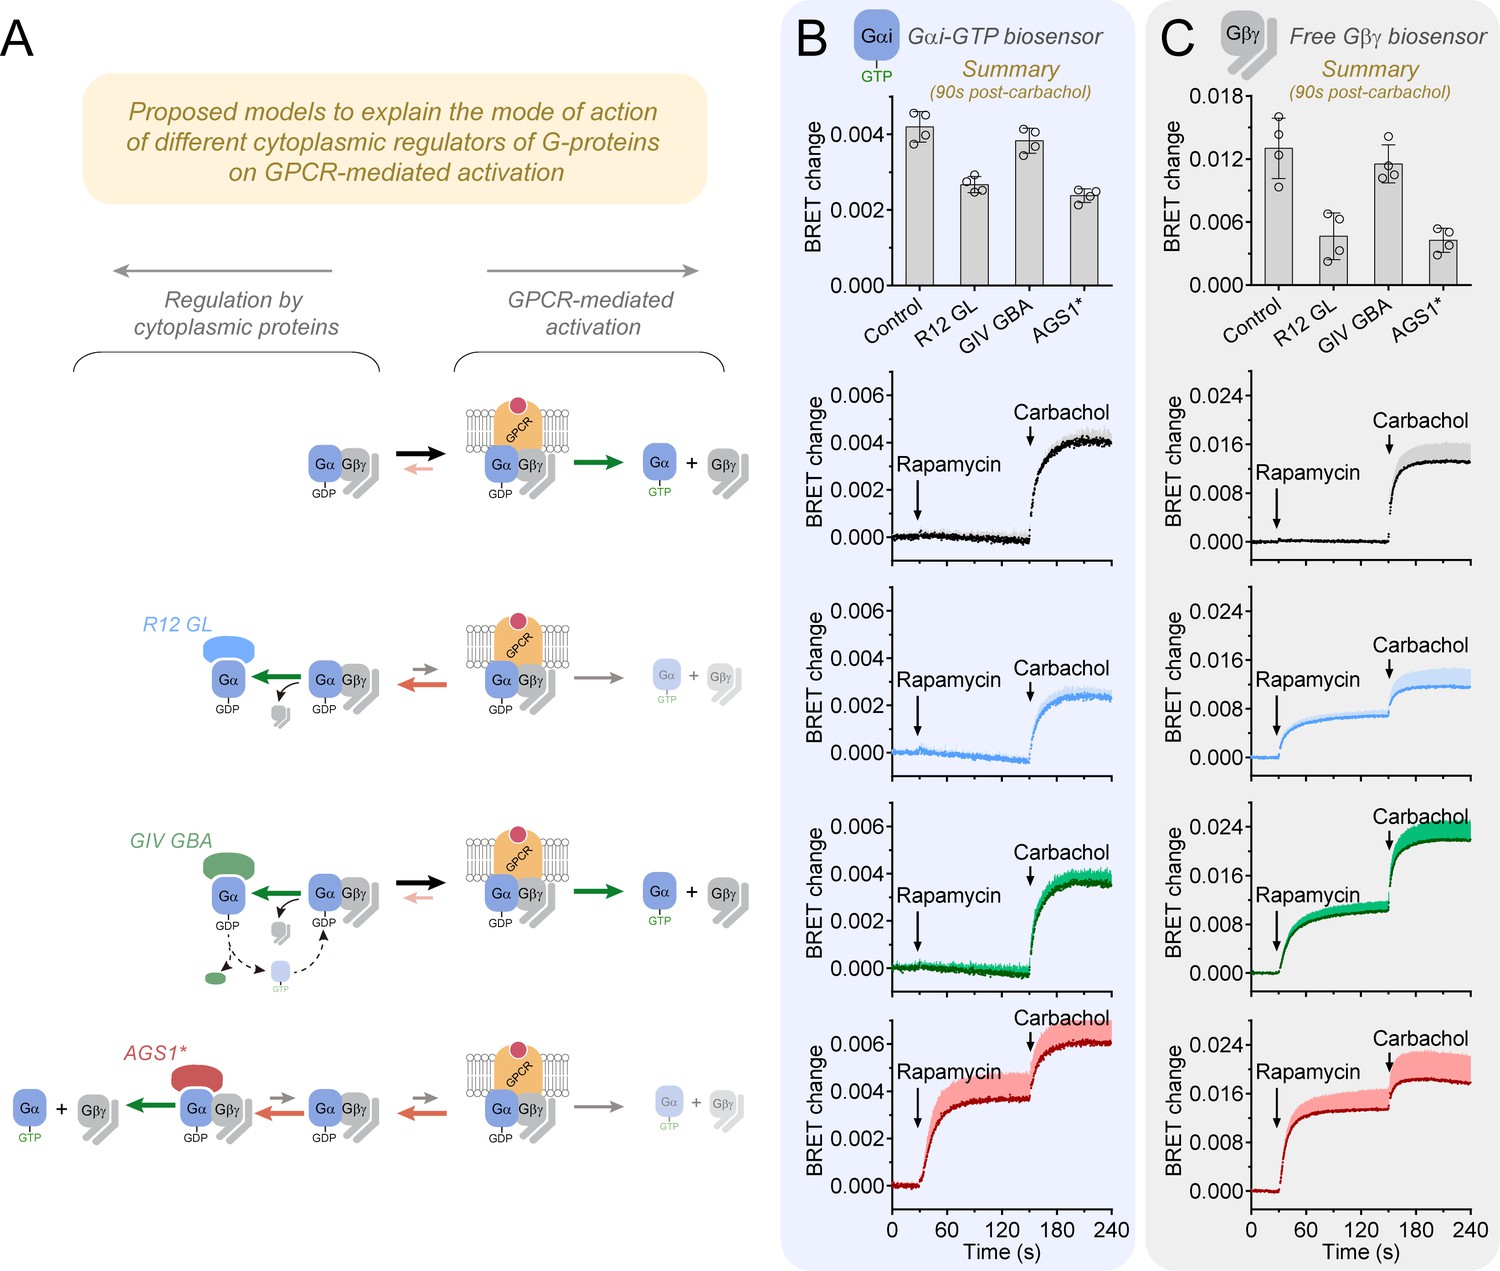
R12 GL and AGS1*, but not GIV GBA, hinder the activation of G-proteins by a GPCR.
(A) Proposed models to explain the mode of action of different cytoplasmic regulators of G-proteins on GPCR-mediated activation. (B, C) HEK293T cells expressing the components of the BRET biosensor for Gαi-GTP (B) or free Gβγ (C), M4R, the membrane-anchored FRB construct, and the indicated FKBP-fused G-protein regulators (R12 GL, GIV GBA, or AGS1*) were sequentially stimulated with rapamycin (0.5 μM) and carbachol at the indicated times during kinetic BRET measurements. Stimulation of cells not expressing FKBP-fused constructs with rapamycin was done as a control. Bar graphs on the top summarize the BRET changes 90 s after addition of carbachol. Mean ± SD, n = 4. In the kinetic traces, the SD is displayed as bars of lighter color tone than data points and only in the positive direction for clarity.
-
Figure 6—source data 1
Numerical data used for the graphs on the left (Gαi-GTP biosensor).
- https://cdn.elifesciences.org/articles/65620/elife-65620-fig6-data1-v2.xlsx
-
Figure 6—source data 2
Numerical data used for the graphs on the right (free Gβγ biosensor).
- https://cdn.elifesciences.org/articles/65620/elife-65620-fig6-data2-v2.xlsx
Figure 6—figure supplement 1
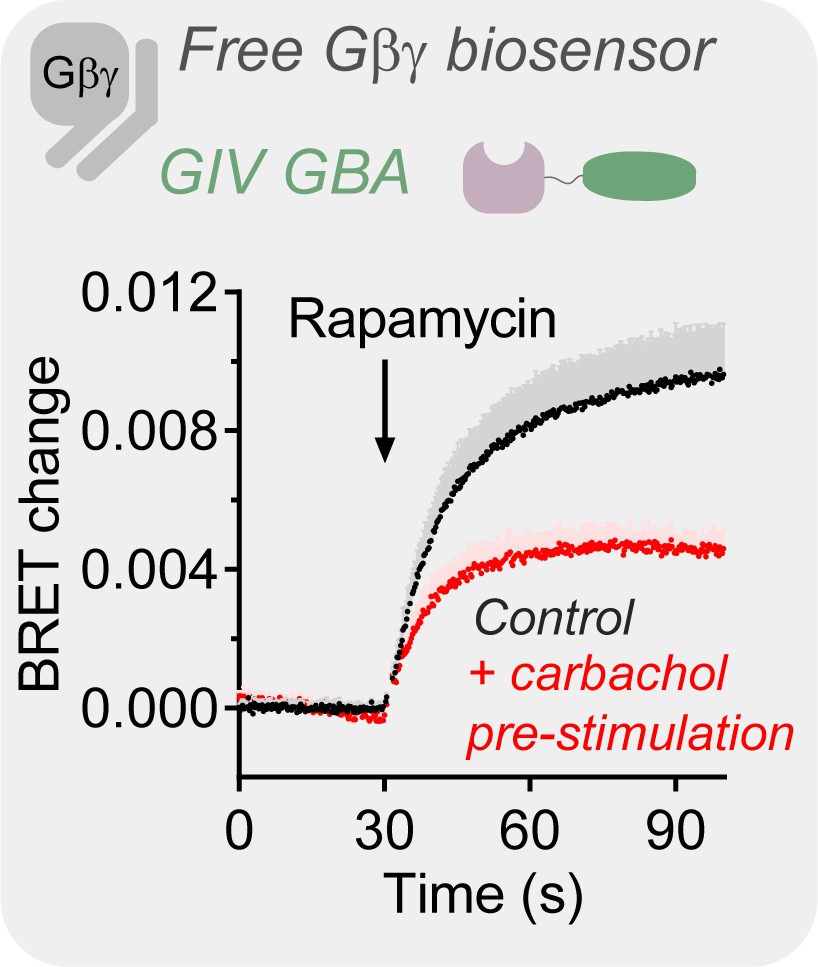
Pre-stimulation of a GPCR diminishes GIV-induced Gβγ release.
HEK293T cells expressing the components of the BRET biosensor for free Gβγ, M4R, the membrane-anchored FRB construct, and FKBP-GIV GBA were pretreated with carbachol (100 μM, red) or not (black) for 2 min before stimulation with rapamycin (0.5 μM) as indicated during kinetic BRET measurements. Mean ± SD, n = 4. The SD is displayed as bars of lighter color tone than data points and only in the positive direction for clarity.
-
Figure 6—figure supplement 1—source data 1
Numerical data used for the graph.
- https://cdn.elifesciences.org/articles/65620/elife-65620-fig6-figsupp1-data1-v2.xlsx
Tables
Key resources table
| Reagent type (species) or resource | Designation | Source or reference | Identifiers | Additional information |
|---|---|---|---|---|
| Cell line (Homo sapiens) | HEK293T cells | ATCC | CRL3216 | |
| Antibody | α-Tubulin (mouse monoclonal) | Sigma | T6074 | Immunoblotting dilution (1: 2500) |
| Antibody | RFP (rabbit polyclonal) | Rockland | 600-401-379 | Immunoblotting dilution (1: 1000) |
| Antibody | GFP (mouse monoclonal) | Clontech/Takara Bio | Cat# 632380 | Immunoblotting dilution (1: 1000) |
| Antibody | Hemagglutinin (HA) tag (clone 12CA5) (mouse monoclonal) | Roche | Cat# 11583816001 | Immunoblotting dilution (1: 1000) |
| Antibody | MYC tag (9B11) (mouse monoclonal) | Cell Signaling | Cat# 2276 | Immunoblotting dilution (1: 1000) |
| Antibody | Gαi3 (rabbit polyclonal) | Santa Cruz Biotechnology | Cat# sc-262 | Immunoblotting dilution (1:250) |
| Antibody | Pan-Gβ (rabbit polyclonal) | Santa Cruz Biotechnology | Cat# sc-261 | Immunoblotting dilution (1: 250) |
| Antibody | Goat anti-rabbit Alexa Fluor 680 (goat polyclonal) | Life Technologies | Cat# A21077 | Immunoblotting dilution (1:10,000) |
| Antibody | Goat anti-mouse IRDye 800 (goat polyclonal) | LiCor | Cat# 926–32210 | Immunoblotting dilution (1:10,000) |
| Recombinant DNA reagent | pmRFP-FKBP-pseudojanin (plasmid) | Addgene | Cat# 37999 | |
| Recombinant DNA reagent | pmRFP-FKBP-GIV GBA (plasmid) | Parag-Sharma et al., 2016 | Contains human GIV aa1660-1705 | |
| Recombinant DNA reagent | pmRFP-FKBP-AGS1* (plasmid) | This paper | Contains rat AGS1 with C278S mutation. See details in ‘Plasmids’ section of 'Materials and methods' | |
| Recombinant DNA reagent | pmRFP-FKBP-Ric-8A* (plasmid) | This paper | Contains rat Ric-8A aa12-492 See details in ‘Plasmids’ section of 'Materials and methods' | |
| Recombinant DNA reagent | pmRFP-FKBP-R12 GL (plasmid) | Maziarz et al., 2020 | Contains mouse RGS12 aa1185-1221 See details in ‘Plasmids’ section of 'Materials and methods' | |
| Recombinant DNA reagent | Lyn11-FRB (plasmid) | Parag-Sharma et al., 2016 | ||
| Recombinant DNA reagent | pcDNA3.1-Venus(155-239)-Gβ1 (plasmid) | Hollins et al., 2009 | For the mammalian expression of Gβ1 tagged with a fragment of Venus (VC-Gβ1). Provided by N. Lambert (Augusta University, Augusta, GA) | |
| Recombinant DNA reagent | pcDNA3.1-Venus(1-155)-Gγ2 (plasmid) | Hollins et al., 2009 | For the mammalian expression of Gγ2 tagged with a fragment of Venus (VN-Gγ2). Provided by N. Lambert (Augusta University, Augusta, GA) | |
| Recombinant DNA reagent | pcDNA3.1-Gβ1 (plasmid) | Hollins et al., 2009 | For the mammalian expression of untagged Gβ1. Provided by N. Lambert (Augusta University, Augusta, GA) | |
| Recombinant DNA reagent | pcDNA3.1-Gγ2 (plasmid) | Hollins et al., 2009 | For the mammalian expression of untagged Gγ2. Provided by N. Lambert (Augusta University, Augusta, GA) | |
| Recombinant DNA reagent | pcDNA3-Gαi3 (plasmid) | Garcia-Marcos et al., 2010 | For the mammalian expression of rat Gαi3 | |
| Recombinant DNA reagent | pcDNA3.1(-)-Gαi3-YFP | Marivin et al., 2016 | Citrine variant of YFP inserted in the αb/αc loop of Gαi3 | |
| Recombinant DNA reagent | pcDNA3.1-masGRK3ct-Nluc (plasmid) | Masuho et al., 2015 | Provided by K. Martemyanov (Scripps Research Institute, Jupiter, FL) | |
| Recombinant DNA reagent | pcDNA3.1-mas-KB-1753-Nluc (plasmid) | Maziarz et al., 2020 | ||
| Recombinant DNA reagent | pcDNA3.1-Nluc-EPAC-VV (plasmid) | Masuho et al., 2015 | Provided by K. Martemyanov (Scripps Research Institute, Jupiter, FL) | |
| Recombinant DNA reagent | pCS2+−6xMyc-GRK2ct-PM | This paper | Contains bovine GRK2 aa495-689 fused to human Rit aa185-247 See details in ‘Plasmids’ section of 'Materials and methods' | |
| Recombinant DNA reagent | pcDNA3.1-3xHA-M4R (plasmid) | cDNA Resource Center at Bloomsburg University | Cat# MAR040TN00 | |
| Recombinant DNA reagent | pcDNA6A-EGFR (plasmid) | Addgene | Cat# 42665 | |
| Recombinant DNA reagent | Grb2-GBA | Parag-Sharma et al., 2016 | Contains Grb2 fused to GIV aa1660-1705 | |
| Chemical compound, drug | NanoGlo Luciferase Assay System | Promega | Cat# N1120 | |
| Chemical compound, drug | Carbachol | Acros Organics | Cat# AC-10824 | |
| Chemical compound, drug | Ramapycin | Alfa Aesar | Cat# J62473 | |
| Chemical compound, drug | Forskolin | Trocis | Cat# 1099 | |
| Chemical compound, drug | Pertussis Toxin | List Biologicals | Cat#179A | |
| Chemical compound, drug | EGF | Gold Biotechnology | Cat# 1150-04-100 |
Additional files
Download links
A two-part list of links to download the article, or parts of the article, in various formats.
Downloads (link to download the article as PDF)
Open citations (links to open the citations from this article in various online reference manager services)
Cite this article (links to download the citations from this article in formats compatible with various reference manager tools)
Complementary biosensors reveal different G-protein signaling modes triggered by GPCRs and non-receptor activators
eLife 10:e65620.
https://doi.org/10.7554/eLife.65620


