The imprinted Zdbf2 gene finely tunes control of feeding and growth in neonates
- Institut Curie, PSL Research University, INSERM, CNRS, France
- Centre for Endocrinology, William Harvey Research Institute, Barts and the London School of Medicine and Dentistry, Queen Mary University of London, United Kingdom
- Institut Curie, PSL Research University, Animal Transgenesis Platform, France
Figures
Figure 1 with 1 supplement
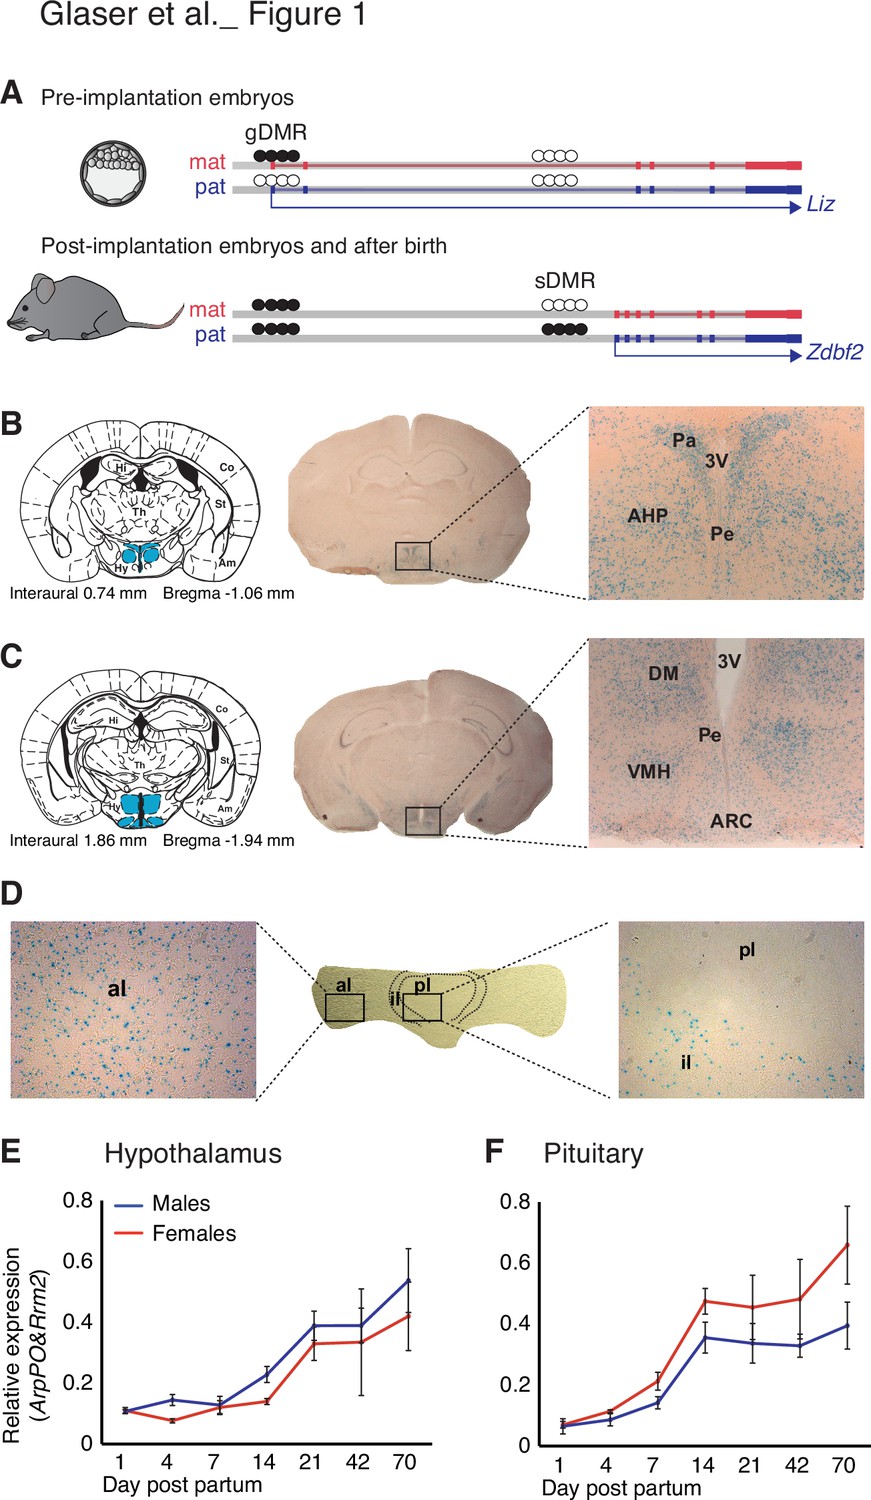
Zdbf2 expression localizes preferentially in the neuro-endocrine cells of the hypothalamo-pituitary axis in juvenile animals.
(A) Scheme of the Liz/Zdbf2 locus regulation during mouse development. In the pre implantation embryos, a maternally methylated gDMR allow the paternal-specific expression of the Long isoform of Zdbf2 (Liz). Liz expression triggers, in cis, DNA methylation at the sDMR which is localized 8 kb upstream of Zdbf2 canonical promoter. In the post-implantation embryos and for the rest of the life, the imprint at the locus is controlled by the paternal methylation at the sDMR and this allow de-repression of Zdbf2, leading to its paternal-specific expression in the postnatal brain. (B, C) X-gal staining on brain coronal sections from 2-week-old Zdbf2-lacZ transgenic males. The coronal diagram from the Mouse Brain Atlas (left panel) localizes the sections in zone 40 (B) and zone 47 (C) in stereotaxic coordinates, with the hypothalamus indicated in blue. Whole brain coronal sections (middle panel) show specific staining in the hypothalamus, due to several positive hypothalamic nuclei (right panel, 20 X magnificence). Hi, hippocampus; Co, cortex; Th, thalamus; Am, amygdala; St, striatum; Hy, hypothalamus; 3 V, third ventricule; Pa, paraventricular hypothalamic nucleus; Pe, periventricular hypothalamic nucleus; AH, anterior hypothalamic area; DM, dorsomedial hypothalamic nucleus; VMH, ventromedial hypothalamic nucleus; Arc, arcuate hypothalamic nucleus. (D) X-gal staining on pituitary horizontal sections. The posterior lobe of the pituitary shows no X-gal staining (right panel), while staining is evenly distributed in the anterior lobe (left panel). pl, posterior lobe; il, intermediate lobe; al, anterior lobe. (E, F) Zdbf2 expression measured by RT-qPCR in the hypothalamus (E) and the pituitary (F) from 1 to 70 days after birth. Data are shown as mean ± s.e.m. of n = 3 C57Bl6/J mice.
Figure 1—figure supplement 1
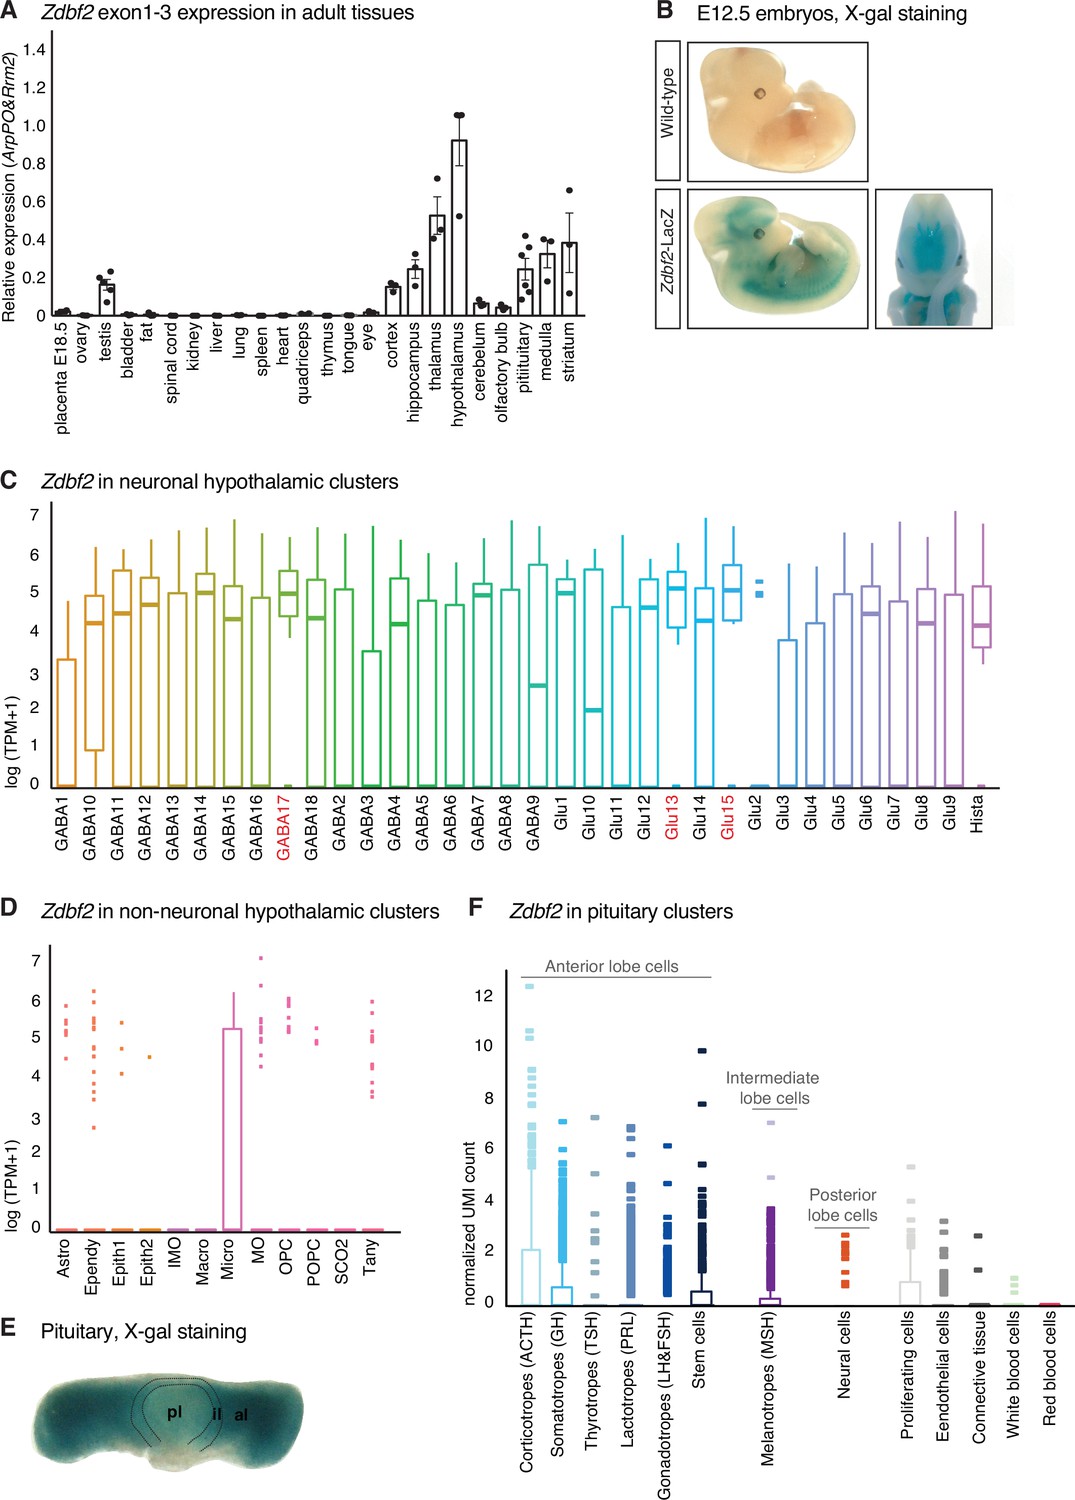
Zdbf2 expression from pituitary and hypothalamus.
(A) Expression of Zdbf2 measured by RT-qPCR in a bank of adult (6 weeks old) mouse tissues. Zdbf2 is preferentially expressed in the brain and hypothalamus is the tissue showing the highest level of expression. Data are shown as means ± s.e.m. This figure has been adapted from Greenberg et al., 2017. (B) Whole-mount E12.5 embryos from a WT and a Zdbf2-LacZ KI mutant stained with X-gal. Staining appears only in the Zdbf2-LacZ KI embryo, in brain regions and spinal cord. (C, D) Expression of Zdbf2 in hypothalamic neuronal (C) and non-neuronal (D) cell clusters. Clusters where Zdbf2 expression is the highest are highlighted in red. Single-cell RNA-seq datasets from the hypothalamus of 8- to 10-week-old B6D2F1 females from Chen et al., Cell Reports, 2017. (E) Whole-mount pituitary from a Zdbf2-LacZ KI mouse stained with X-gal. pl, posterior lobe; il, intermediate lobe; al, anterior lobe. (F) Expression of Zdbf2 in pituitary cell clusters. Zdbf2 expression is found predominantly in cluster of cells from the anterior and intermediate lobes. Single-cell RNA-seq datasets from pituitaries of 7-week-old C57BL/6 J males from Cheung et al., Endocrinology, 2018.
Figure 2 with 2 supplements
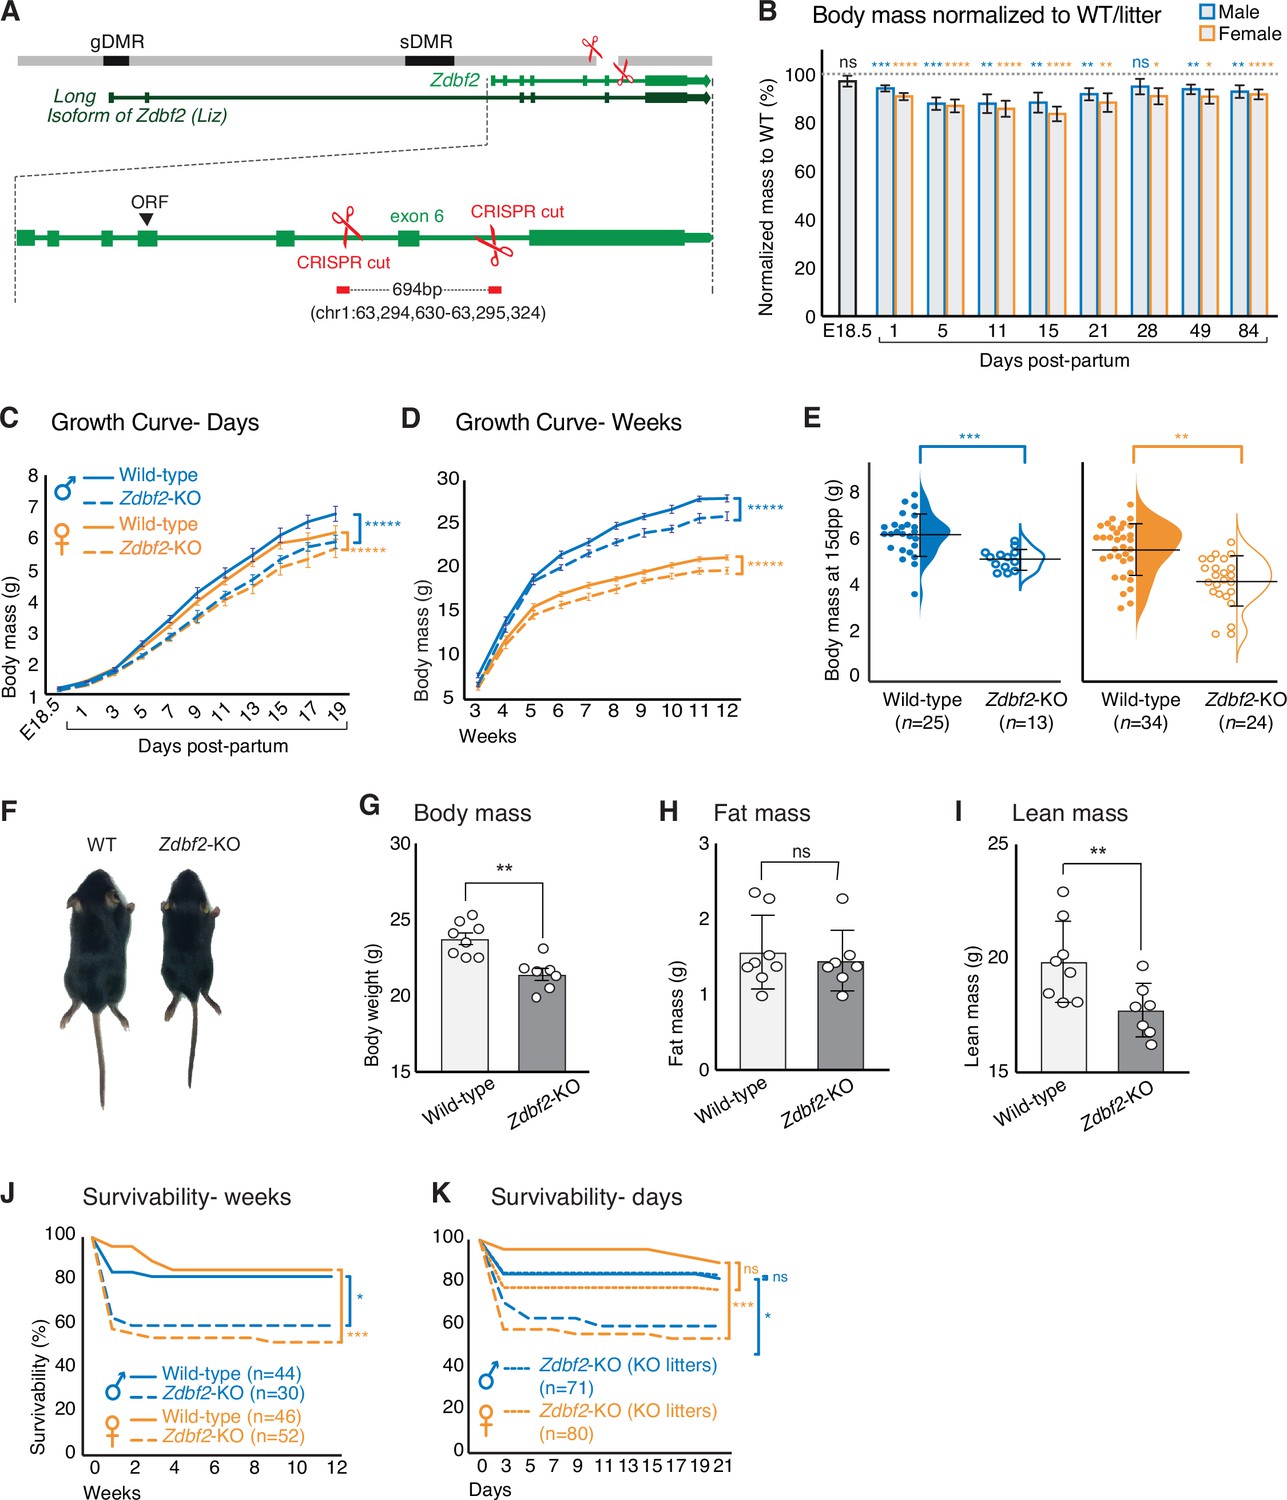
Zdbf2-KO mice exhibit growth reduction and partial postnatal lethality.
(A) Graphical model of the Zdbf2 deletion generated using two sgRNAs across exon 6. The two differentially methylated (DMR) regions of the locus are indicated (germline-gDMR, and somatic-sDMR), as well as the Long Isoform of Zdbf2 (Liz). The ORF (open-reading frame) of Zdbf2 starts in exon 4. Genomic coordinates of the deletion are indicated. (B) Body weight of Zdbf2-KO mice normalized to WT littermates (100%) followed from embryonic day E18.5–84 days post-partum. Data are shown as means ± s.e.m. from individuals from n = 27 litters. Statistical analyses were performed by a two-tailed, unpaired, non-parametric Mann Whitney t-test. **** p ≤ 0.0001, ***p ≤ 0.001,**p ≤ 0.01, *p ≤ 0.05. (C, D) Growth curve comparing the body weights of WT and Zdbf2-KO mice prior to weaning, from E18.5 to 19dpp (C) and over 3 months after birth (D). n = 15–50 mice were analyzed per genotype, depending on age and sex. Statistical analyses were performed by a two-way ANOVA test. **** p ≤ 0.0001. (E) Half dot plot- half violin plot showing the weight distribution in 2-week-old males (left) and females (right) of WT and Zdbf2-KO genotypes. Statistical analyses were performed by a two-tailed, unpaired, nonparametric Mann Whitney t test. ***p ≤ 0.001, **p ≤ 0.01. (F) Representative photography of a smaller 2 week-old Zdbf2-KO male compared to a WT littermate. (G–I) Dual-energy X-ray absorptiometry (DXA) analysis showing the calculation of body mass (G), fat mass (H) and lean mass (I) in WT and Zdbf2-KO males at 7 weeks. Data are shown as means ± s.e.m. from n = 8 WT and n = 7 Zdbf2-KO males. Statistical analyses were performed by a two-tailed, unpaired, nonparametric Mann Whitney t test. **p ≤ 0.01. (J–K) Kaplan-Meier curves of the survivability from birth to 12 weeks of age comparing WT (plain lines) and Zdbf2-KO (dotted lines) littermates from WT x Zdbf2 KO/WT backcrosses (J). Impaired survivability occurs specifically from the first day to 2 weeks of age. Kaplan-Meier curves of the survivability from 1 to 21 dpp comparing Zdbf2-KO pups generated from WT x Zdbf2 KO/KO intercrosses, with Zdbf2-KO and their WT littermates generated from WT x Zdbf2 KO/WT backcrosses as in J (K). Zdbf2-KO pups are more prone to die only when they are in competition with WT littermates (small dotted lines), while Zdbf2-KO pups have a normal survivability when they are not with WT littermates (large dotted lines). Statistical analyses were performed by a two-tailed, Chi2 test on the last time point for each curves (12 weeks for (J) and 21 days for (K)). ***p ≤ 0.001, *p ≤ 0.05.
-
Figure 2—source data 1
Survivability counts from different transmission of the Zdbf2-KO allele.
(A) Number of living pups followed every two days from 1 to 21dpp and every week from 21 to 84dpp from 24 litters coming from [female WT x male Zdbf2 KO/WT] crosses (Zdbf2-KO paternal transmission). These 24 litters come from four different crosses including 8 females and 4 males. Day one corresponds to the day of birth (1dpp). We can observe that the number of living Zdbf2-KO (males and females) starts decreasing from 3dpp onwards. (B) Number of living pups followed every two days from 1 to 21dpp and every week from 21 to 84dpp from 21 litters coming from [female WT x male Liz-LOF] crosses (Liz-LOF paternal transmission). These 21 litters come from five different crosses including 10 females and 5 males. Day one corresponds to the day of birth (1dpp). We can observe that the number of living Liz-LOF (males and females) starts decreasing from 3dpp onwards. (C) Number of living pups followed every week from 1 to 84dpp from 11 litters coming from [female Zdbf2 KO/WT x male WT] crosses (Zdbf2-Δexon6, maternal transmission, silent mutation). These 11 litters come from two different crosses including 4 females and 2 males. We did not observe any survivability bias within those litters. (D) Number of living pups followed every two days from 1 to 21dpp and every week from 21 to 84dpp from 11 litters coming from [female LizΔgDMR x male WT] crosses (LizΔgDMR, maternal transmission). These 11 litters come from two different crosses including 4 females and 2 males. Day one corresponds to the day of birth (1dpp). We did not observe any survivability bias within those litters. (E) Number of living pups followed every day from 1 to 21dpp from 19 litters coming from [female WT x male Zdbf2 KO/KO] crosses (Zdbf2-KO, homozygote transmission). These 19 litters come from five different crosses including 10 females and 5 males. All pups from these crosses inherited a mutated allele from their dad and are thus Zdbf2-KO. We did not observe any survivability bias within those litters.
- https://cdn.elifesciences.org/articles/65641/elife-65641-fig2-data1-v2.xlsx
Figure 2—figure supplement 1
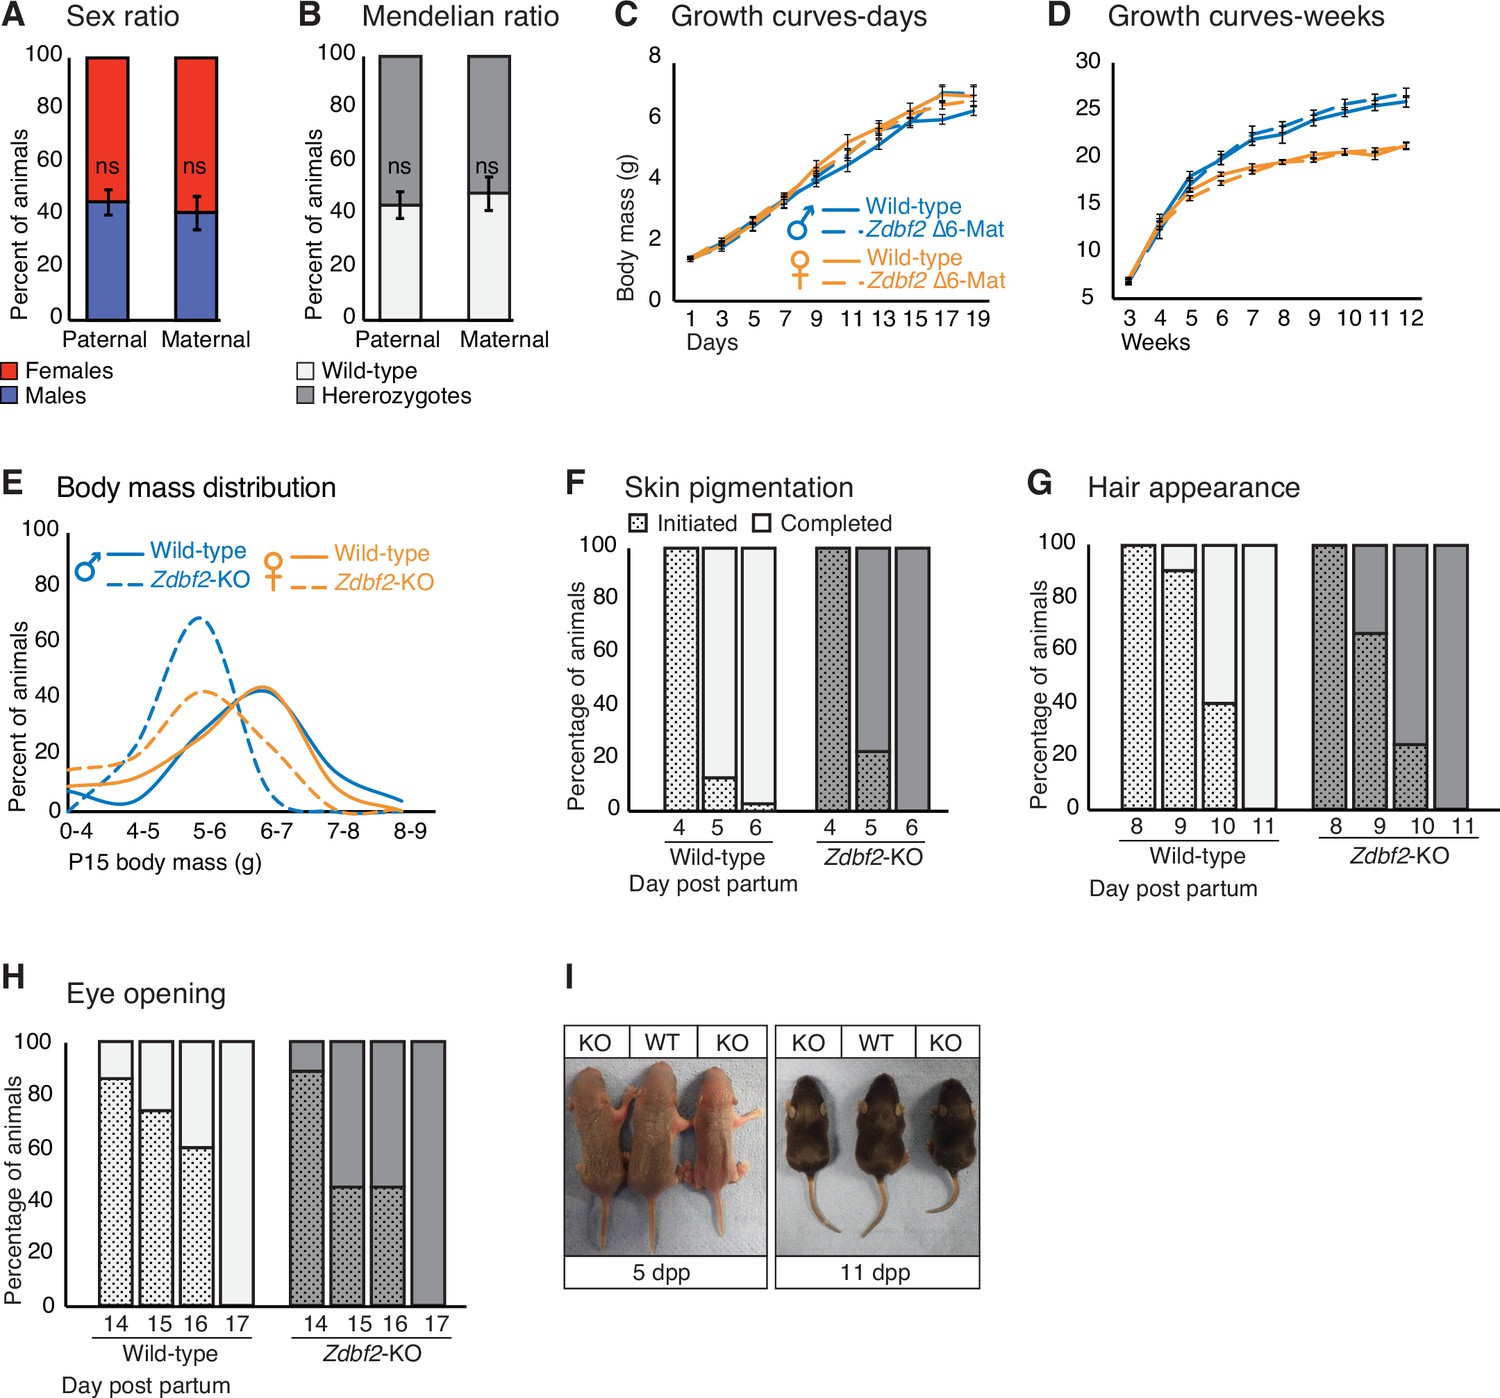
Zdbf2-KO pups acquire normal hallmarks of postnatal development.
(A, B) Sex ratio (A) and genotype ratio (B) observed at birth (1dpp) among Zdbf2 heterozygotes from paternal and maternal transmission of the deletion after three backcrosses. Data are shown as means ± s.e.m. from individuals from n = 32 and 12 litters from paternal and maternal transmission respectively. Statistical analyses were performed by a two-tailed, Chi2 test. (C, D) Growth curves as in Figure 2C and D, respectively, but comparing mutants with a maternal transmission of the Zdbf2 deletion with their WT littermates. (E) Body mass distribution of 2 week-old Zdbf2-KO mice grouped into bins. The weight reduction phenotype appears to be highly penetrant in both males and females. (F–H) Graphical representation of the timing of three typical hallmarks of postnatal development: skin pigmentation (F), hair appearance (G) and eye opening (H) between WT and Zdbf2-KO littermates. Data are shown from n = 18 wild-type and n = 10 Zdbf2-KO animals. (I) Representative photography of WT and Zdbf2-KO female littermates at 5dpp (left) and 11dpp (right).
Figure 2—figure supplement 2
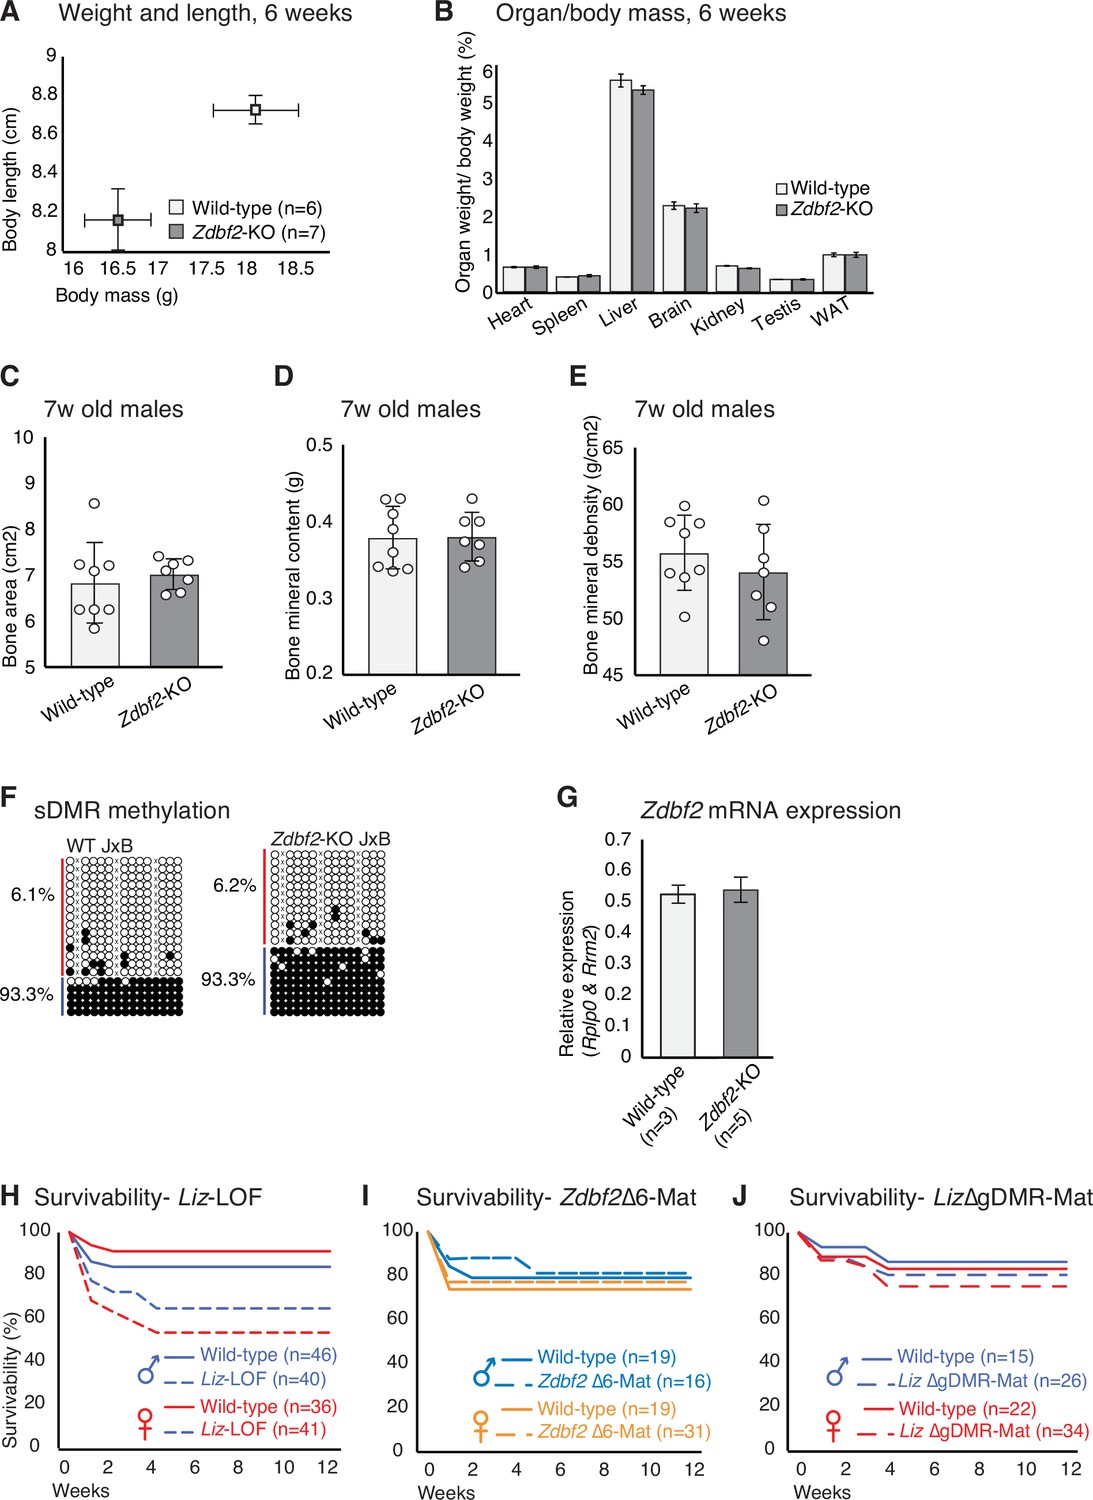
Phenotypic and molecular characterization of Zdbf2 mutants.
(A) Average body length and weight of n WT and Zdbf2-KO mice at 6 weeks. (B) Individual organ weight plotted as percentage of total body weight in Zdbf2-KO mice and WT littermates at 6 weeks. (C–E) Dual-energy X-ray absorptiometry (DXA) showing calculation of bone area (C), bone mineral content (D) and bone mineral density (E). Data are shown as means ± s.e.m from n = 8 WT and 7 Zdbf2-KO males. (F) Bisulfite cloning and sequencing of the sDMR from hypothalamus DNA of 3 week-old hybrid WT (top) and Zdbf2-KO (bottom) mice (JF1 x Zdbf2-KO cross) reveals that the deposition of DNA methylation at the sDMR is not affected by Zdbf2 deletion. Red, maternal alleles; blue, paternal alleles. cross, informative JF1 SNP. (G) RT-qPCR measuring Zdbf2 expression from exon 1–3 in 3-week-old hypothalamus reveals that Zdbf2 transcriptional output is not affected by the deletion of the exon 6. Statistical analyses were performed by a two-tailed, unpaired, nonparametric Mann Whitney t test. **p ≤ 0.01. (H–J) Kaplan-Meier curves of the survivability as in Figure 2I but comparing WT and Liz-LOF males and females (I), WT and Zdbf2-∆exon6 males and females upon maternal transmission of the deletion (J) and WT and Liz-∆gDMR males and females upon maternal transmission of the deletion (K).
Figure 3 with 2 supplements
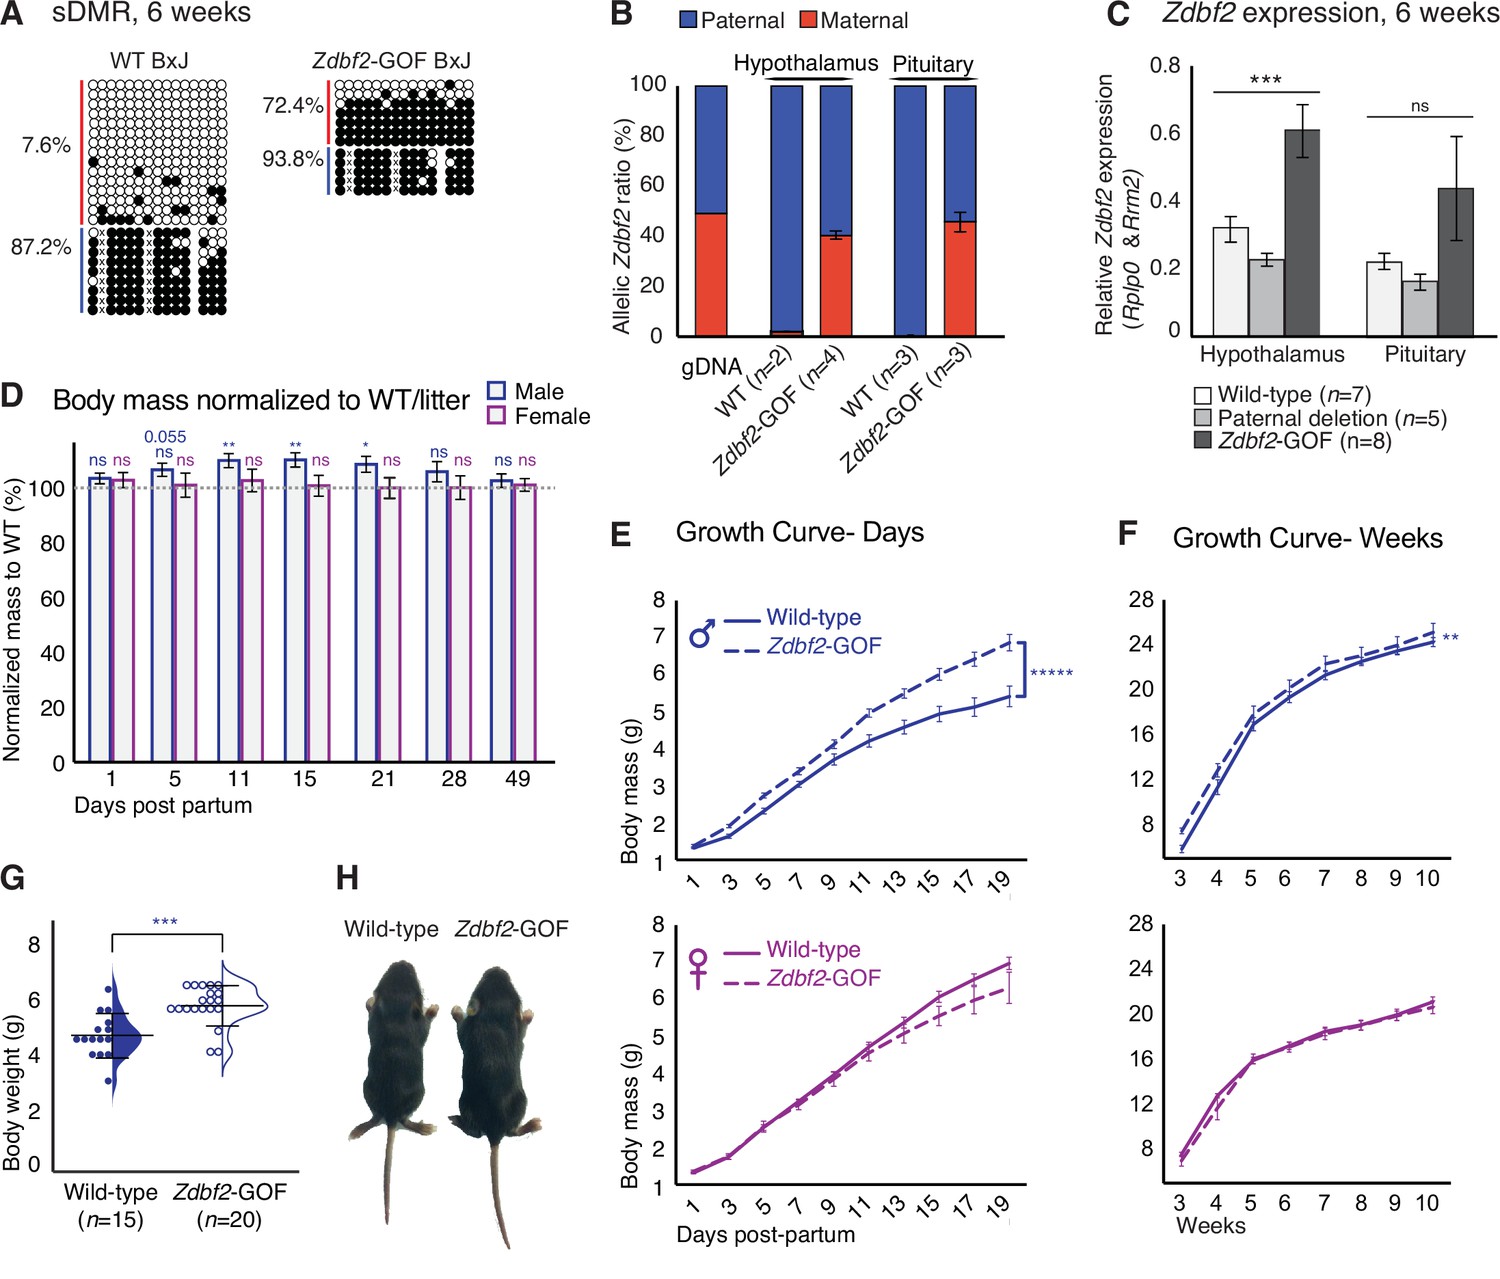
Zdbf2 influences postnatal growth in a dose-dependent manner.
(A) Bisulfite cloning and sequencing showing CpG methylation levels at the sDMR locus of hypothalamus DNA from 6-week-old hybrid WT (left) and Zdbf2-GOF (right) mice (Zdbf2-GOF±x JF1 cross). Red, maternal alleles; blue, paternal alleles. cross, informative JF1 SNP. (B) Allelic expression of Zdbf2 in hypothalamus and pituitary gland from 3-week-old mice, measured by RT-pyrosequencing. Genomic DNA extracted from a C57Bl/6 x JF1 hybrid cross was used as a control for pyrosequencing bias. (C) RT-qPCR measurement reveals a ~ 1.7-fold-increase of Zdbf2 expression in the hypothalamus and pituitary gland of 3-week-old mice with a maternal transmission of the deletion. Expression of Zdbf2 in mice carrying the deletion on the paternal allele is similar to WT. Statistical analyses were performed by a one-way ANOVA test. ***p ≤ 0.001. (D) Normalized body growth of Zdbf2-GOF mice to their WT littermates (100%) followed at different ages (1–84 days) from n = 14 litters. The overgrowth is seen specifically in males, from 5 to 28 days. Statistical analyses were performed by a two-tailed, unpaired, non-parametric Mann Whitney t-test. **p ≤ 0.01, *p ≤ 0.05. The number on top of the data at 5dpp indicate a non-significant but close to be p-value. (E, F) Growth curves of female and male mice, comparing the body weights of WT and Zdbf2-GOF, through the three first weeks of life (D) and through 10 weeks (E). n = 10–30 mice were analyzed per genotype, depending on age and sex. Statistical analyses were performed by a two-way ANOVA test. **** p ≤ 0.0001, **p ≤ 0.01. (G) Half dot- half violin plots showing the weight distribution at 2 weeks of age between WT and Zdbf2-GOF males. Data are shown as means ± s.e.m. from n individuals. Statistical analyses were performed by a two-tailed, unpaired, nonparametric Mann Whitney t test. *** p ≤ 0.005. (H) Representative photography of a bigger Zdbf2-GOF male as compared to a WT littermate at 2 weeks.
Figure 3—figure supplement 1
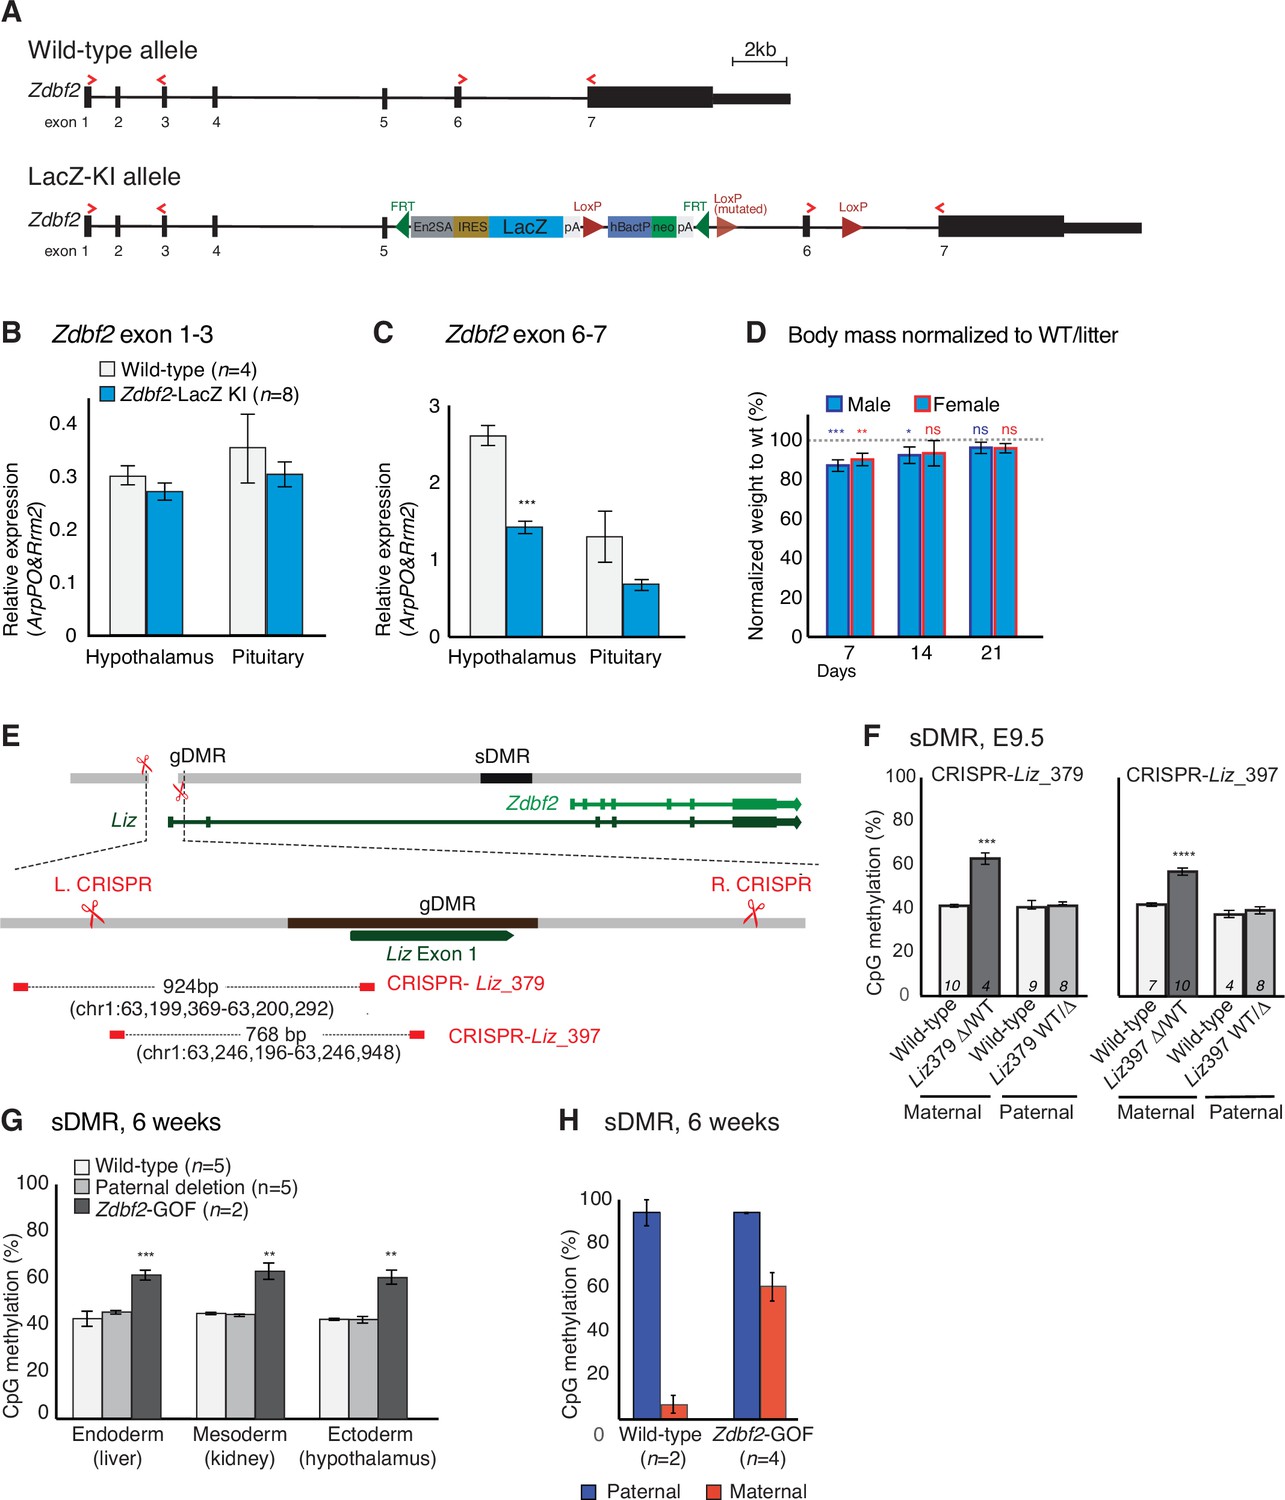
Characterization of partial Zdbf2-LOF and Zdbf2-GOF mouse lines.
(A) Scheme of the wild-type and LacZ-KI Zdbf2 alleles. The seven exons of the Zdbf2 transcript are represented by black boxes and the primers used for the RT-qPCR in (B,C) are labeled as red arrows. The LacZ-KI allele contains an insertion of: a trapping cassette (En2SA-IRES-LacZ-pA), a Neo cassette under the human beta-actin promoter (hbactP-Neo-pA), FRT sites to delete the two cassettes and LoxP sites to delete the Zdbf2 exon 6. However, we found the middle LoxP site to be non-functional because of a point mutation in the original EUCOMM-provided ES cells. (B, C) Zdbf2 expression measured by RT-qPCR from exon 1–3 (B) and exon 6–7 (C) in hypothalamus and pituitary of WT and Zdbf2-LacZ KI individuals. The beta-galactosidase insertion leads to a ~ 2 fold decrease in Zdbf2 expression at exon 6–7, probably due to exon skipping. Data are shown as means ± s.e.m. from n individuals. Statistical analyses were performed by a two-tailed, unpaired, nonparametric Mann Whitney t test. ***p ≤ 0.001. (D) Normalized body growth of Zdbf2-LacZ KI mice to their WT littermates (100%) followed at 1, 2, and 3 weeks shows a slight decrease in weight of both males and females. Data are shown as means ± s.e.m. from eight litters. Statistical analyses were performed by a two-tailed, unpaired, nonparametric Mann Whitney t test. * p ≤ 0.05, ** p ≤ 0.01, ***p ≤ 0.005. (E) Graphic model of the ΔgDMR CRISPR deletion leading to the generation of the Liz_379 founder line (Zdbf2-GOF). Deletion is the results of a single cut by Cas9 at the left sgRNA position, followed by NHEJ. (F) Bisulfite-pyrosequencing from post-implantation embryos at E9.5 shows increase of sDMR CpG methylation only upon maternal transmission of the deletion, both in Liz_379 (left) and Liz_397 (right) CRISPR lines. (G) Bisulfite-pyrosequencing shows increased sDMR methylation in tissues from 6-week-old mice when the deletion is maternally transmitted. The paternal transmission of the deletion behaves as silent. (H) Quantification of allelic sDMR CpG methylation measured by bisulfite cloning and sequencing from n WT and Zdbf2-GOF adult tissues. The gain of sDMR methylation from the maternal allele in the mutant compared to their WT littermates is about 65%.
Figure 3—figure supplement 2
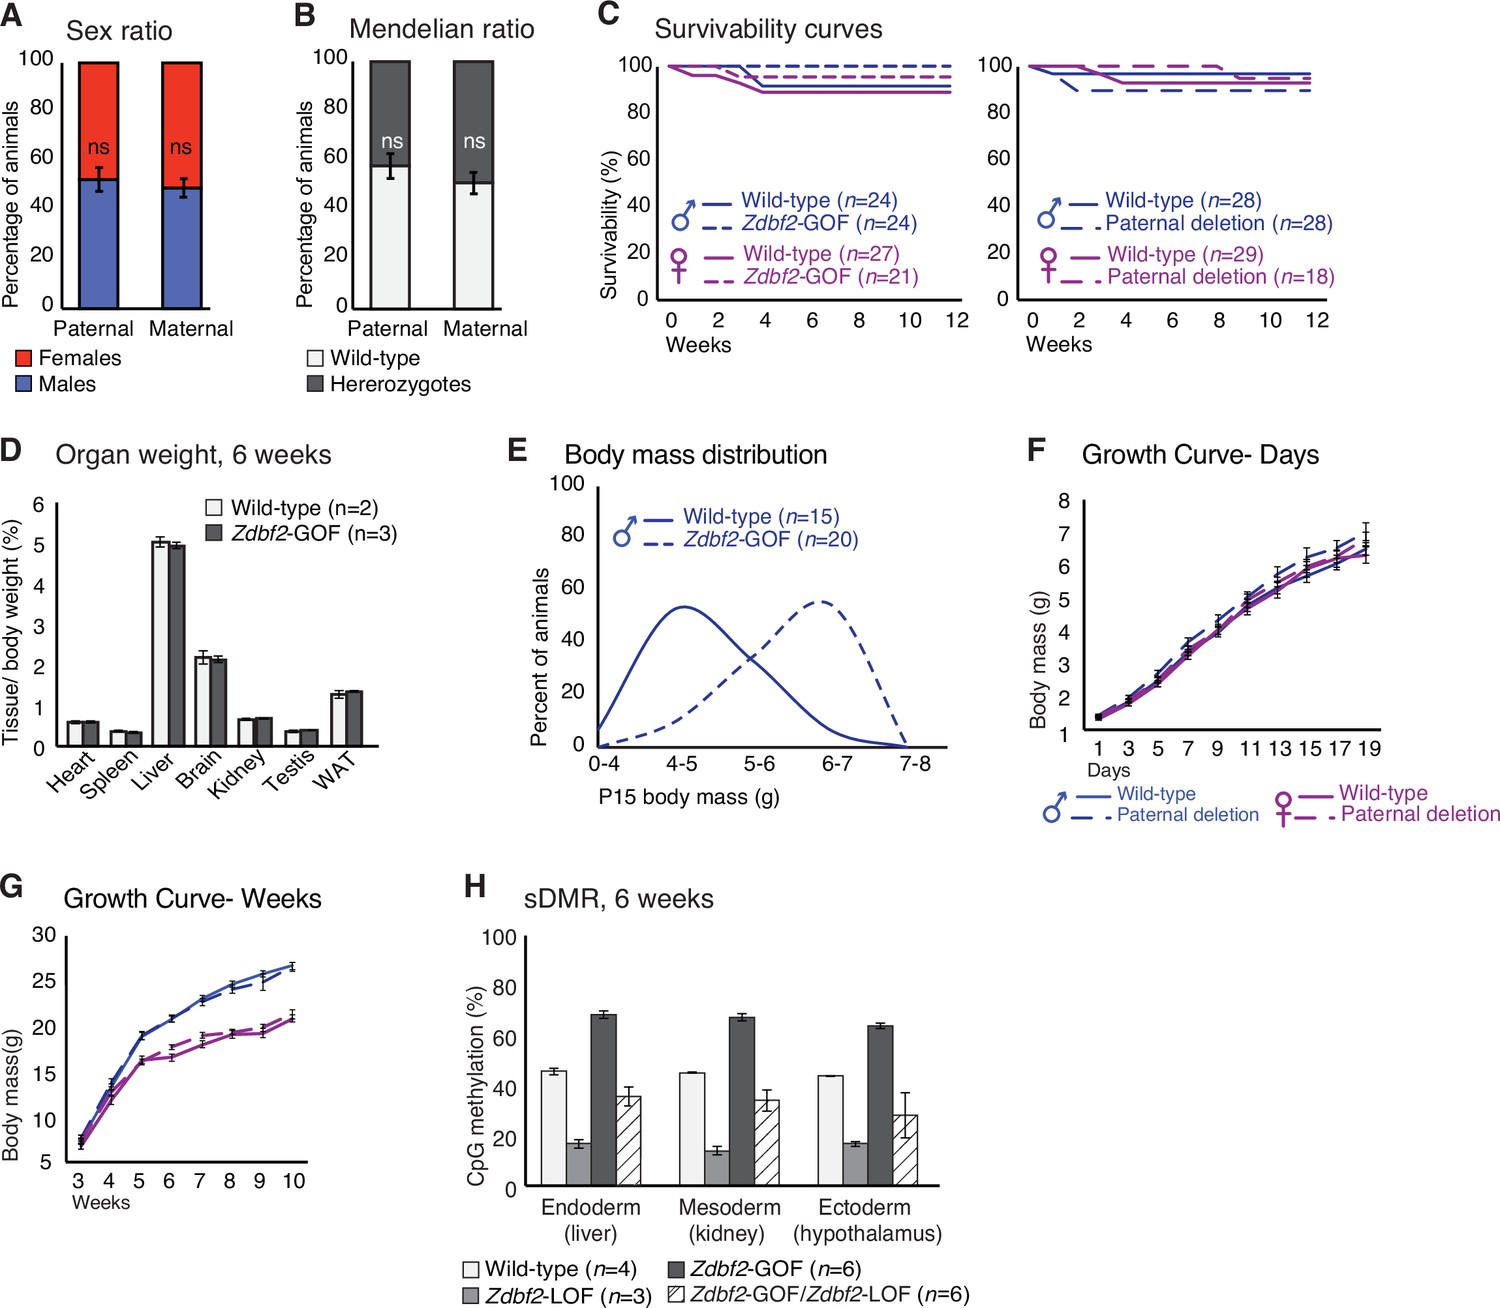
Phenotypic characterization of Zdbf2-GOF mutants.
(A, B) Sex ratio (A) and genotype ratio (B) observed at birth among heterozygotes upon paternal and maternal transmission of the Zdbf2-GOF mutation after three backcrosses of the Liz_379 line. Data are shown as means ± s.e.m. from individuals from n = 15 and 20 litters from paternal and maternal transmission respectively. Statistical analyses were performed by a two-tailed, Chi2 test. (C) Kaplan-Meier curves of the survivability from birth to 12 weeks showing no lethality phenotype upon maternal (left) and paternal (right) transmission of the deletion, both in males and females. Data are shown as means ± s.e.m. from n individuals. (D) Individual organ weight plotted as percentage of total body weight in Zdbf2-GOF mice and WT littermates at 6 weeks. (E) Body mass distribution of 2-week-old Zdbf2-GOF males grouped into bins. The male specific overgrowth phenotype appears to be penetrant. (F, G) Growth curves as in Figure 5D and E, but comparing the mutants with a paternal transmission of the deletion with their WT littermates. The paternal deletion behaves as a silent mutation with no growth-related phenotype in the progenies. n = 10–25 mice were analyzed per genotype, depending on age and sex. (H) Bisulfite-pyrosequencing shows an almost complete rescue of the Zdbf2-LOF defects of sDMR methylation in tissues of Zdbf2-GOF /Zdbf2-LOF mice at 6 weeks. Data are shown as means ± s.e.m. from n individuals. Statistical analyses were performed by a two-tailed, unpaired, nonparametric Mann Whitney t test. *p ≤ 0.05
Figure 4
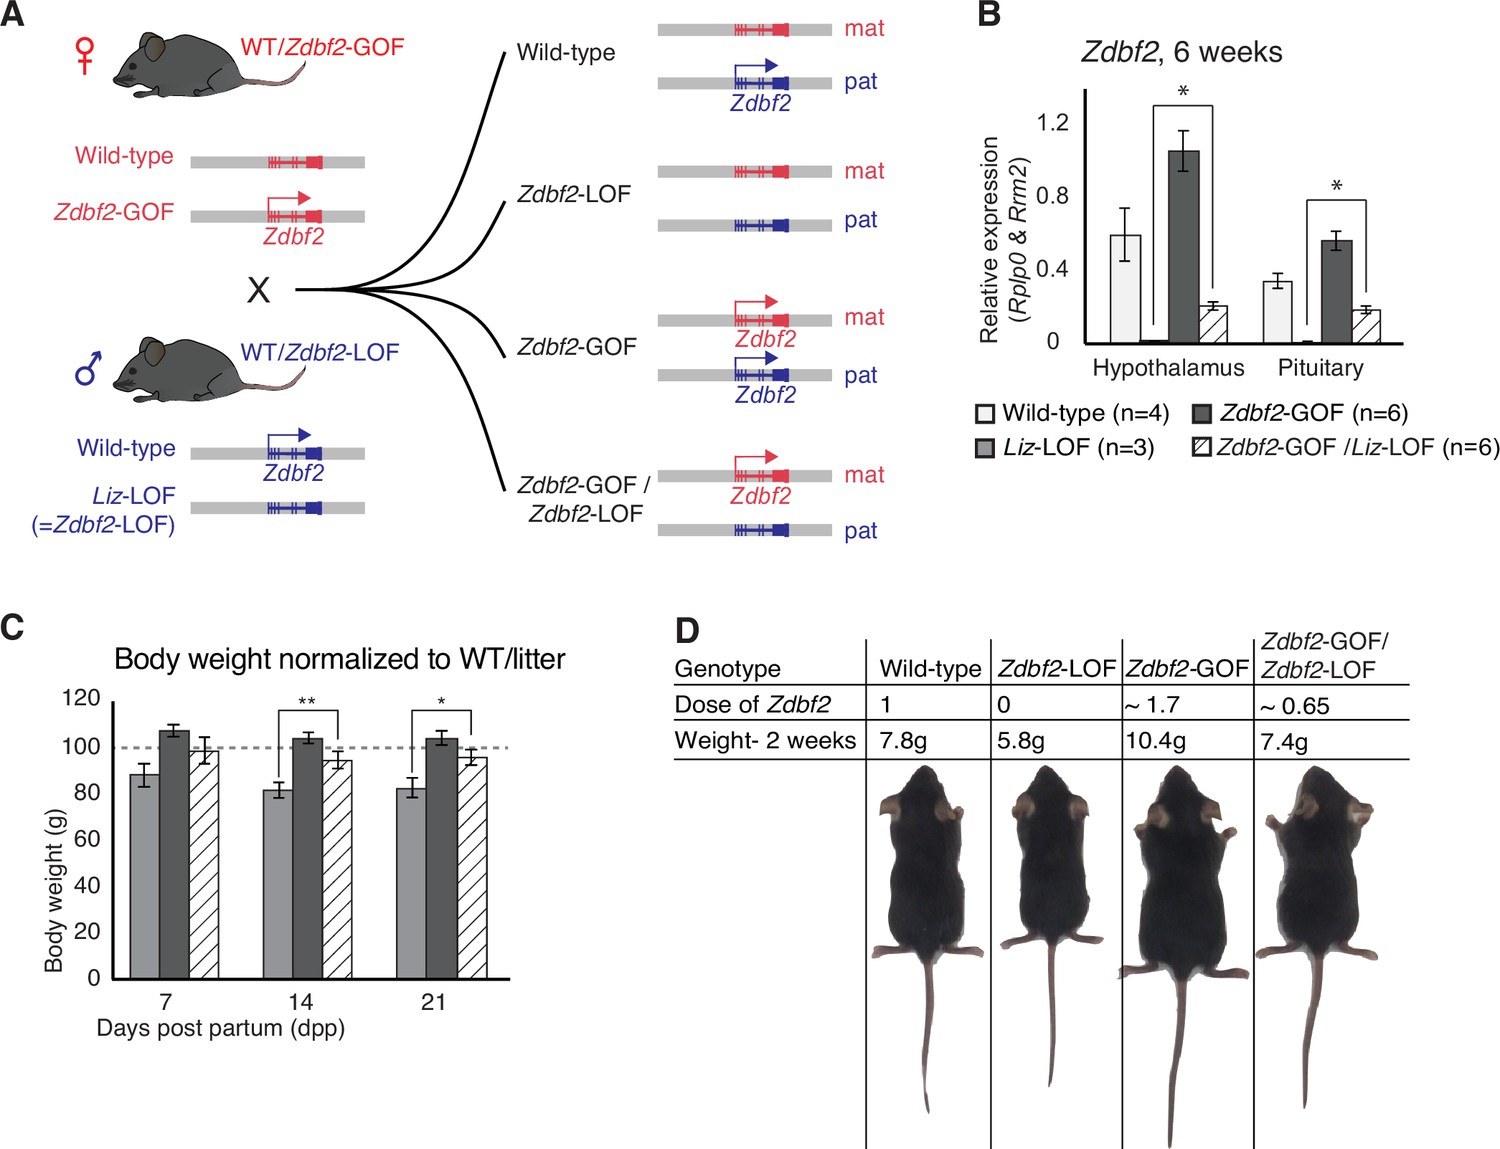
Zdbf2 influences postnatal growth in a parent-of-origin-independent manner.
(A) Scheme of the cross made to obtain embryos with an inversion of the parental origin of Zdbf2 expression. Zdbf2-GOF heterozygote females were crossed with heterozygote males for the Liz-LOF deletion–which we demonstrated as equivalent to a Zdbf2-LOF allele–(left) to obtain one quarter of embryos expressing one dose of Zdbf2 from the maternal allele (right, bottom). (B) Zdbf2 expression in the hypothalamus and the pituitary gland is shown in males for each of the four possible genotypes. The level of Zdbf2 in Zdbf2-GOF /Zdbf2-LOF mice almost completely rescues the defect seen in Zdbf2-LOF and Zdbf2-GOF mutants. Data are shown as means ± s.e.m. from n individuals. Statistical analyses were performed by a two-tailed, unpaired, nonparametric Mann Whitney t test. * p ≤ 0.05. (C) Normalized body growth of Zdbf2-LOF, Zdbf2-GOF and Zdbf2-GOF /Zdbf2-LOF males to their WT littermates (100%) followed at 7, 14, and 21 days after birth. Zdbf2-GOF /Zdbf2-LOF adult mice exhibit a body weight similar to the WT showing a partial rescue of the growth reduction and overgrowth phenotype due to respectively the lack of Zdbf2 and the gain of Zdbf2 expression in the brain. Data are shown as means ± s.e.m. from individuals from n = 17 litters. Statistical analyses were performed by a two-tailed, unpaired, nonparametric Mann Whitney t test. * p ≤ 0.05; ** p ≤ 0.01. (D) Representative photography of four males littermates from a Zdbf2-GOF x Zdbf2-LOF cross (as shown in A) at 2 weeks of age. For each animal, genotype, dose of Zdbf2 expression and weight are indicated.
Figure 5 with 2 supplements
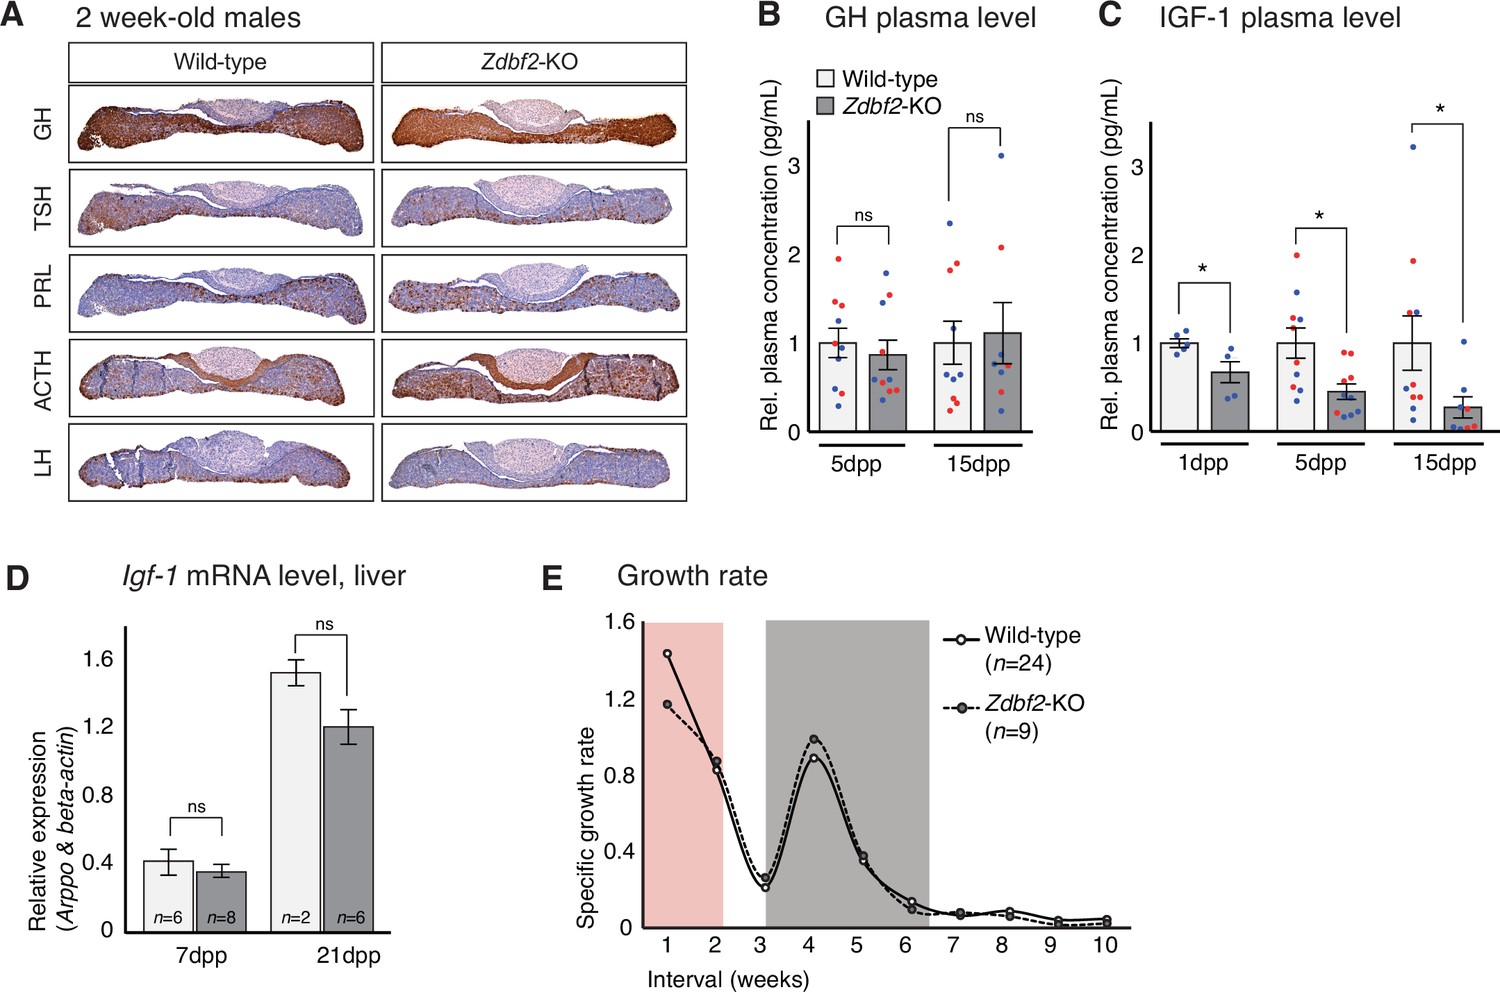
Zdbf2-KO phenotype is linked to defective IGF-1 signaling immediately after birth.
(A) Pituitary hormone production is globally normal in Zdbf2-KO mice, as assessed by immunohistochemistry on 15dpp pituitary sections. (B, C) Circulating levels of GH at 5 and 15dpp (B) and of IGF-1 at 1, 5, and 15 dpp (C) in the plasma of WT and Zdbf2-KO mice. Data are shown as means ± s.e.m. of the relative expression to WT values from n replicates. Red and blue dots: females and males data points, respectively. Statistical analyses were performed by a two-tailed, unpaired, nonparametric Mann Whitney t test. *p ≤ 0.05. (D) RT-qPCR from postnatal liver measuring the level of Igf-1 mRNAs between WT and Zdbf2-KO mice at 7 and 21dpp. Data are shown as means ± s.e.m from n WT and Zdbf2-KO animals. (E) Specific growth rate calculated from body weight of WT and Zdbf2-KO males from 1 to 10 weeks of age using the following equation: [(weight t2 - weight t1)/ weight t1]. Pink area: reduced growth rate in Zdbf2-KO pups compared to WT littermates; Grey area: growth rate of Zdbf2-KO mice exceeds the WT growth rate.
Figure 5—figure supplement 1
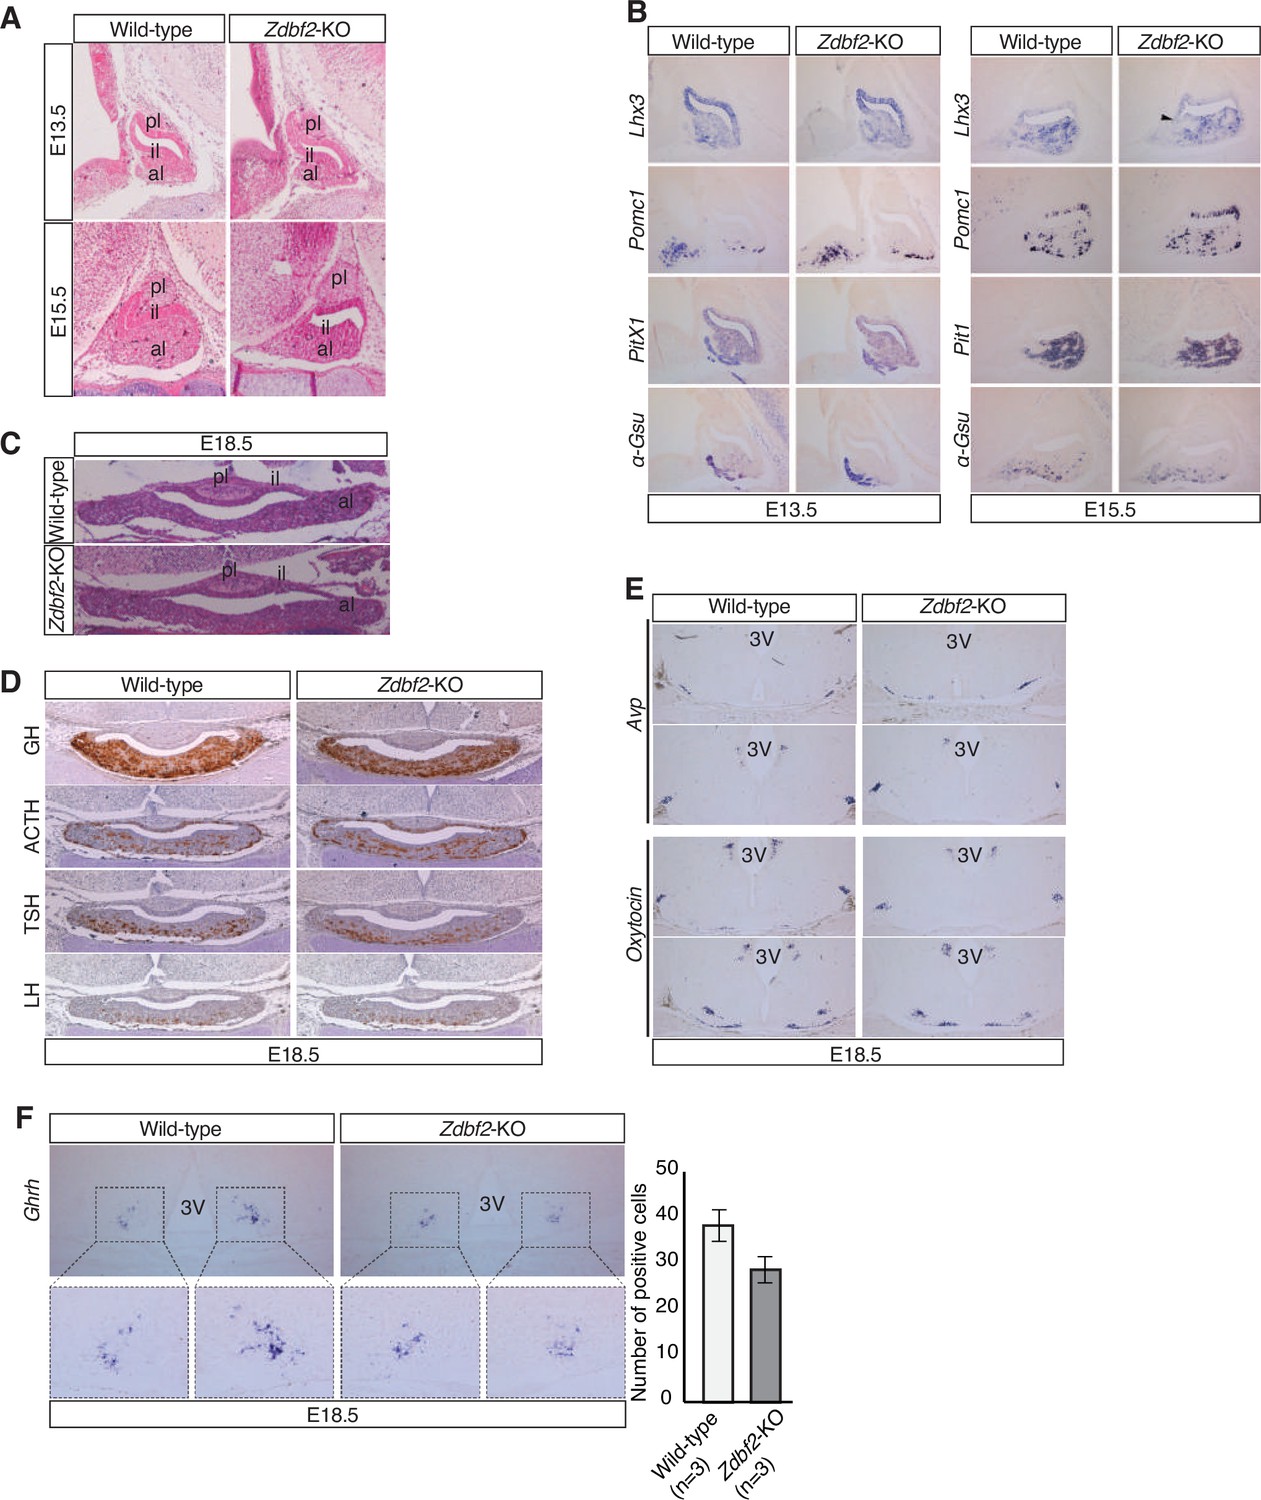
Normal development of the hypothalamo-pituitary axis in Zdbf2-KO mice.
(A) Hematoxylin-Eosin (H&E) staining reveals normal development of the pituitary at embryonic day (E) 13.5 and E15.5 embryonic days. (B) RNA in situ hybridization for pituitary lineage-specific genes reveals normal mRNA expression of cell specification markers in the pituitary of the Zdbf2-KO embryos at E13.5 and E15.5. (C) Morphological assessment of the mature E18.5 pituitary gland by H&E staining shows no phenotype in the pituitary gland before birth. (D) Immunohistochemistry analysis of four pituitary hormones (GH, ACTH, TSL, LH) at E18.5 suggests no obvious defect in hormone-producing cells in the anterior lobe of the pituitary before birth. (E) In situ hybridization for two hypothalamic neuropeptides, arginine vasopressin (AVP) (top) and oxytocin (bottom), in the developing E18.5 hypothalamus suggests no apparent differences in AVP and oxytocin transcripts. (F) RNA in situ hybridization for Ghrh on E18.5 hypothalamus shows trend towards decreased expression of Ghrh in mutant embryos compared to controls, although difference is not statistical significant. Quantification (right panel) represents the means ± s.e.m of the number of Ghrh-positive cells over n = 3 independent experiments. Overall, results in A-F are congruent with the observation of normal weight distribution in Zdbf2-KO E18.5 embryos (Figure 2B). pl, posterior lobe; il, intermediate lobe; al, anterior lobe; 3 V, third ventricle of the hypothalamus.
Figure 5—figure supplement 2
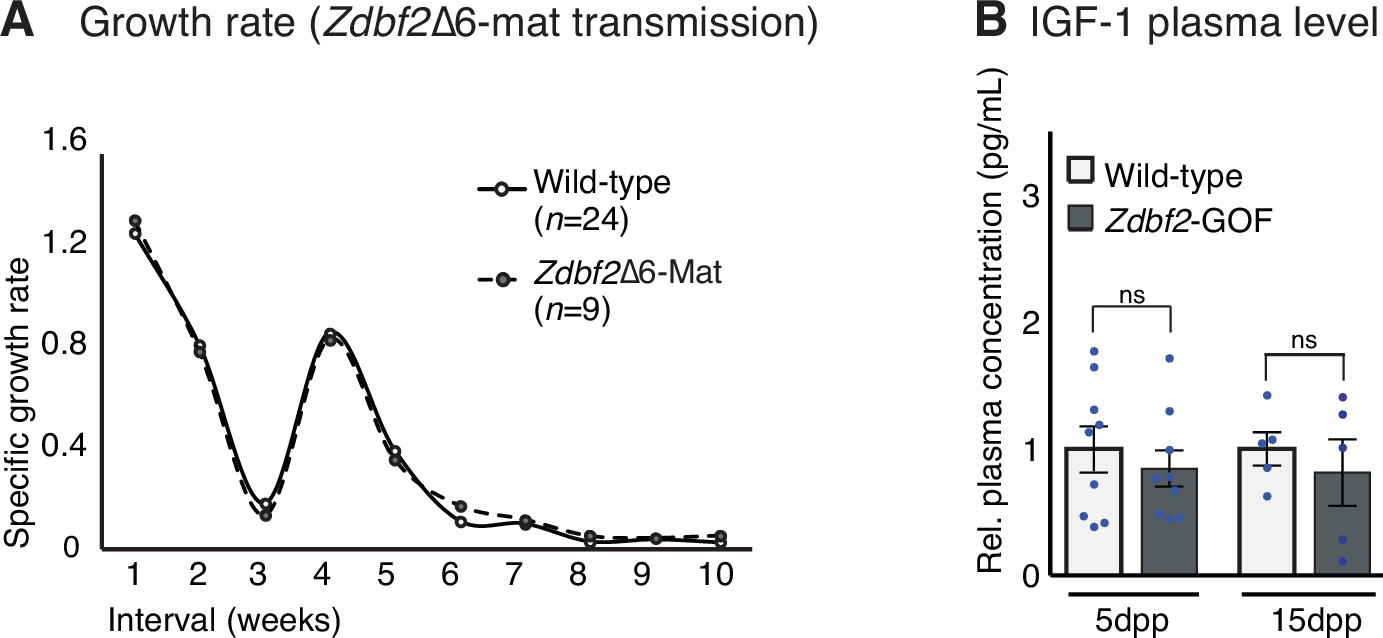
Specific growth rate in Zdbf2-Δexon6 and circulating IGF-1 in Zdbf2-GOF.
(A) Specific growth rate calculated from body weight of WT and Zdbf2-Δexon6 (maternal transmission) males from 1 to 10 weeks of age using the following equation: [(weight t2 - weight t1)/ weight t1]. No difference in growth rate were detected between the WT and the maternal silent mutation compare to the difference we observed when comparing WT and Zdbf2-KO animals (Figure 5E). (B) Circulating plasmatic IGF-1 levels in WT and Zdbf2-GOF males at 5 and 15dpp. Data are shown as means ± s.e.m. of the relative expression to WT values from n replicates with each blue dots representing one male data point. Statistical analyses were performed by a two-tailed, unpaired, nonparametric Mann Whitney t test.
Figure 6 with 1 supplement
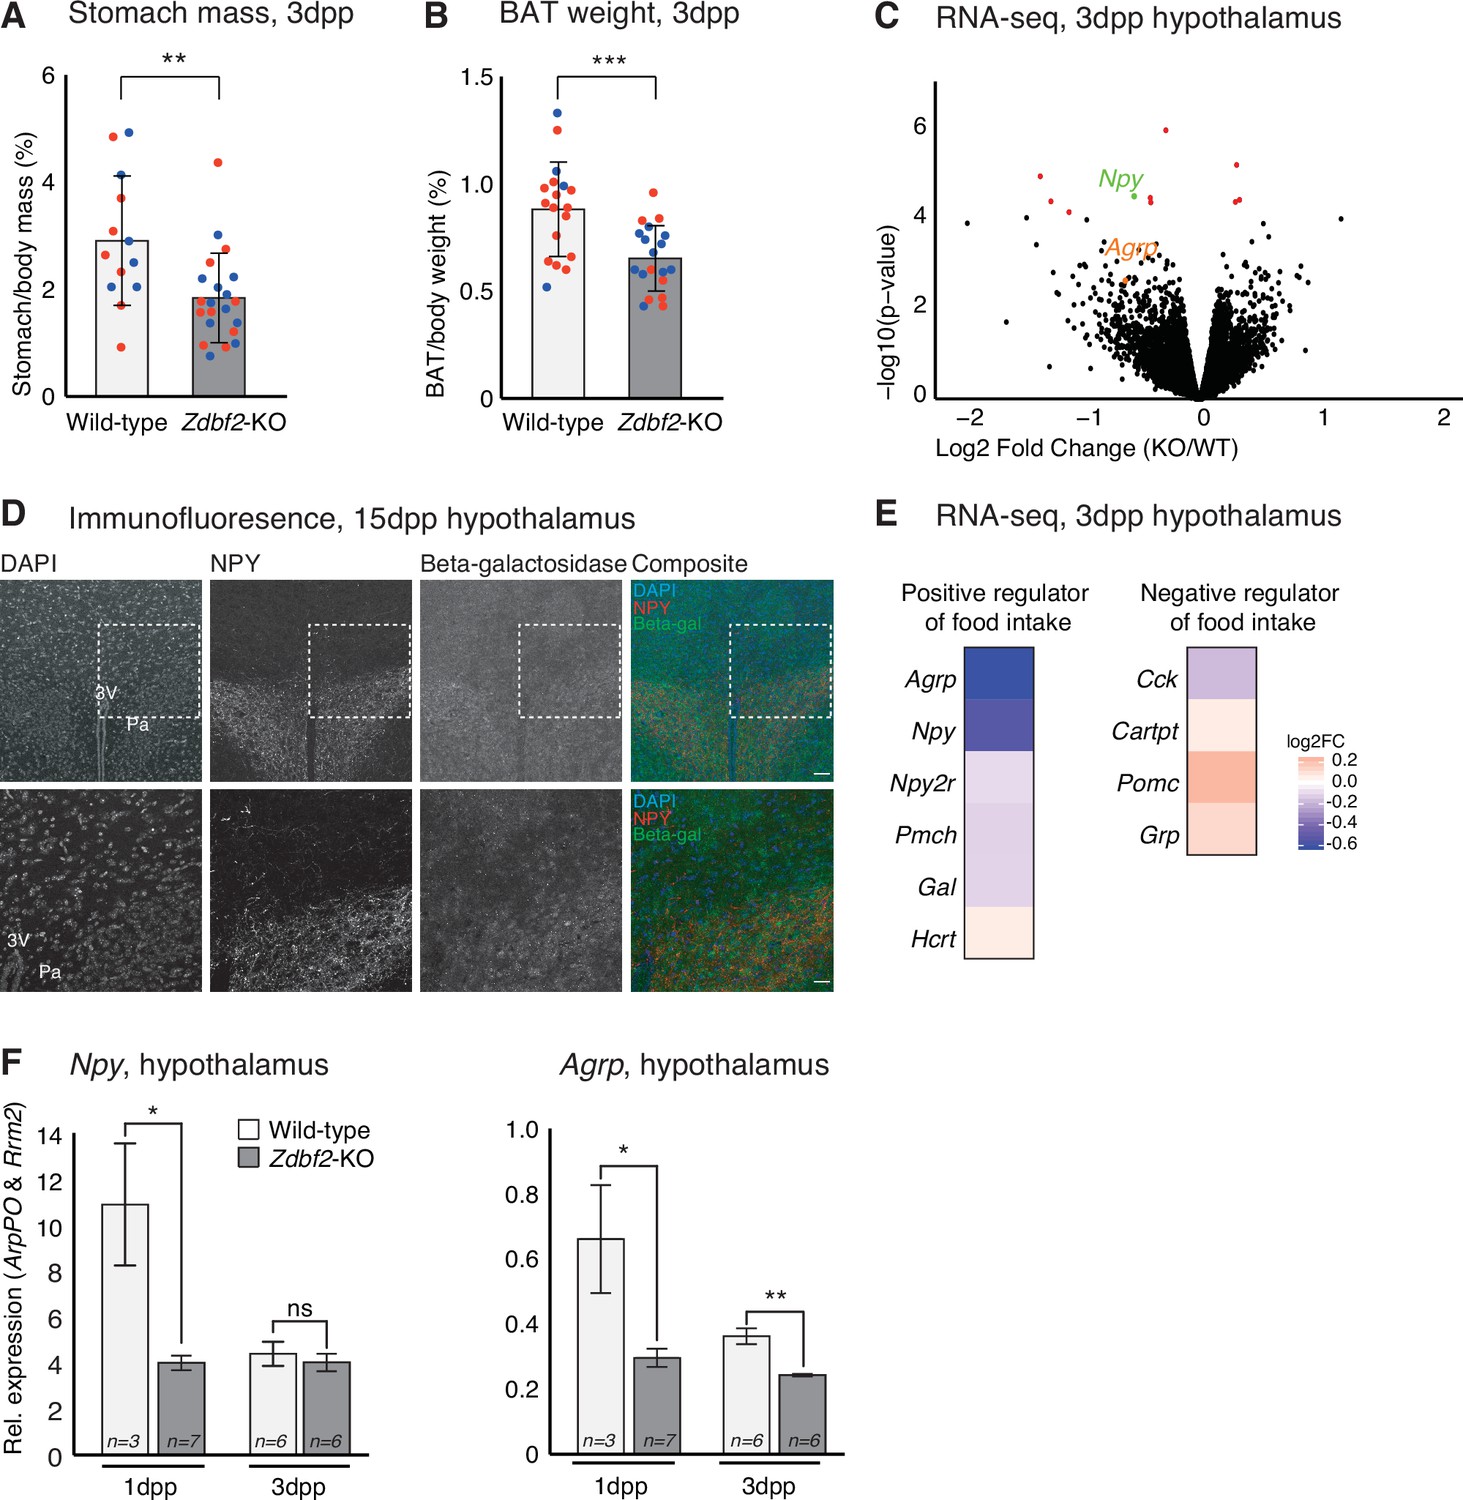
Zdbf2-KO neonates display a feeding defect.
(A, B) Stomach (A) and brown adipocyte tissue (BAT) (B) mass normalized to the body mass for WT and Zdbf2-KO at 3dpp. Red dots: females; blue dots: males. Data are shown as means ± s.e.m. from n replicates. Statistical analyses were performed by a two-tailed, unpaired, nonparametric Mann Whitney t test.** p ≤ 0.01, ***p ≤ 0.005. (C) Volcano plot representation of RNA-seq of 3dpp hypothalamus of Zdbf2-KO versus WT littermates. n = 3 replicates for each genotype. Red dots: differentially expressed genes with a threshold of FDR < 10%. Npy (FDR 6%) is highlighted in green and Agrp in orange. (D) Representative image of immunofluorescence from brain sections, focused on hypothalamic region in Zdbf2:LacZ animals at 15dpp. Black and white images are shown for DAPI, NPY and Beta-galactosidase and composite images depict them in blue, red and green, respectively. Dotted square (top panel) represent the focused region in the bottom panel. Scale bar: 100 µm. 3 V, third ventricule; Pa, paraventricular hypothalamic nucleus. (E) Heatmap showing the log2 fold change of genes encoding hypothalamic regulators of food intake (RNA-seq data from C). (F) RT-qPCR from hypothalamus of 1 and 3dpp males animals measuring Npy (left panel) and Agrp (right panel) mRNA levels. Data are shown as means ± s.e.m. from n replicates. Statistical analyses were performed by a two-tailed, unpaired, nonparametric Mann Whitney t test. *p ≤ 0.05, **p ≤ 0.01.
-
Figure 6—source data 1
List of differentially expressed genes in the hypothalamus of Zdbf2-KO versus WT males at 3dpp and 10dpp.
Raw data for the RNA-seq on hypothalamus at 3dpp and 10dpp. Tables are showing the rpkm value, FDR and logFC for the 11 differentially expressed genes between WT and Zdbf2-KO.
- https://cdn.elifesciences.org/articles/65641/elife-65641-fig6-data1-v2.xlsx
Figure 6—figure supplement 1
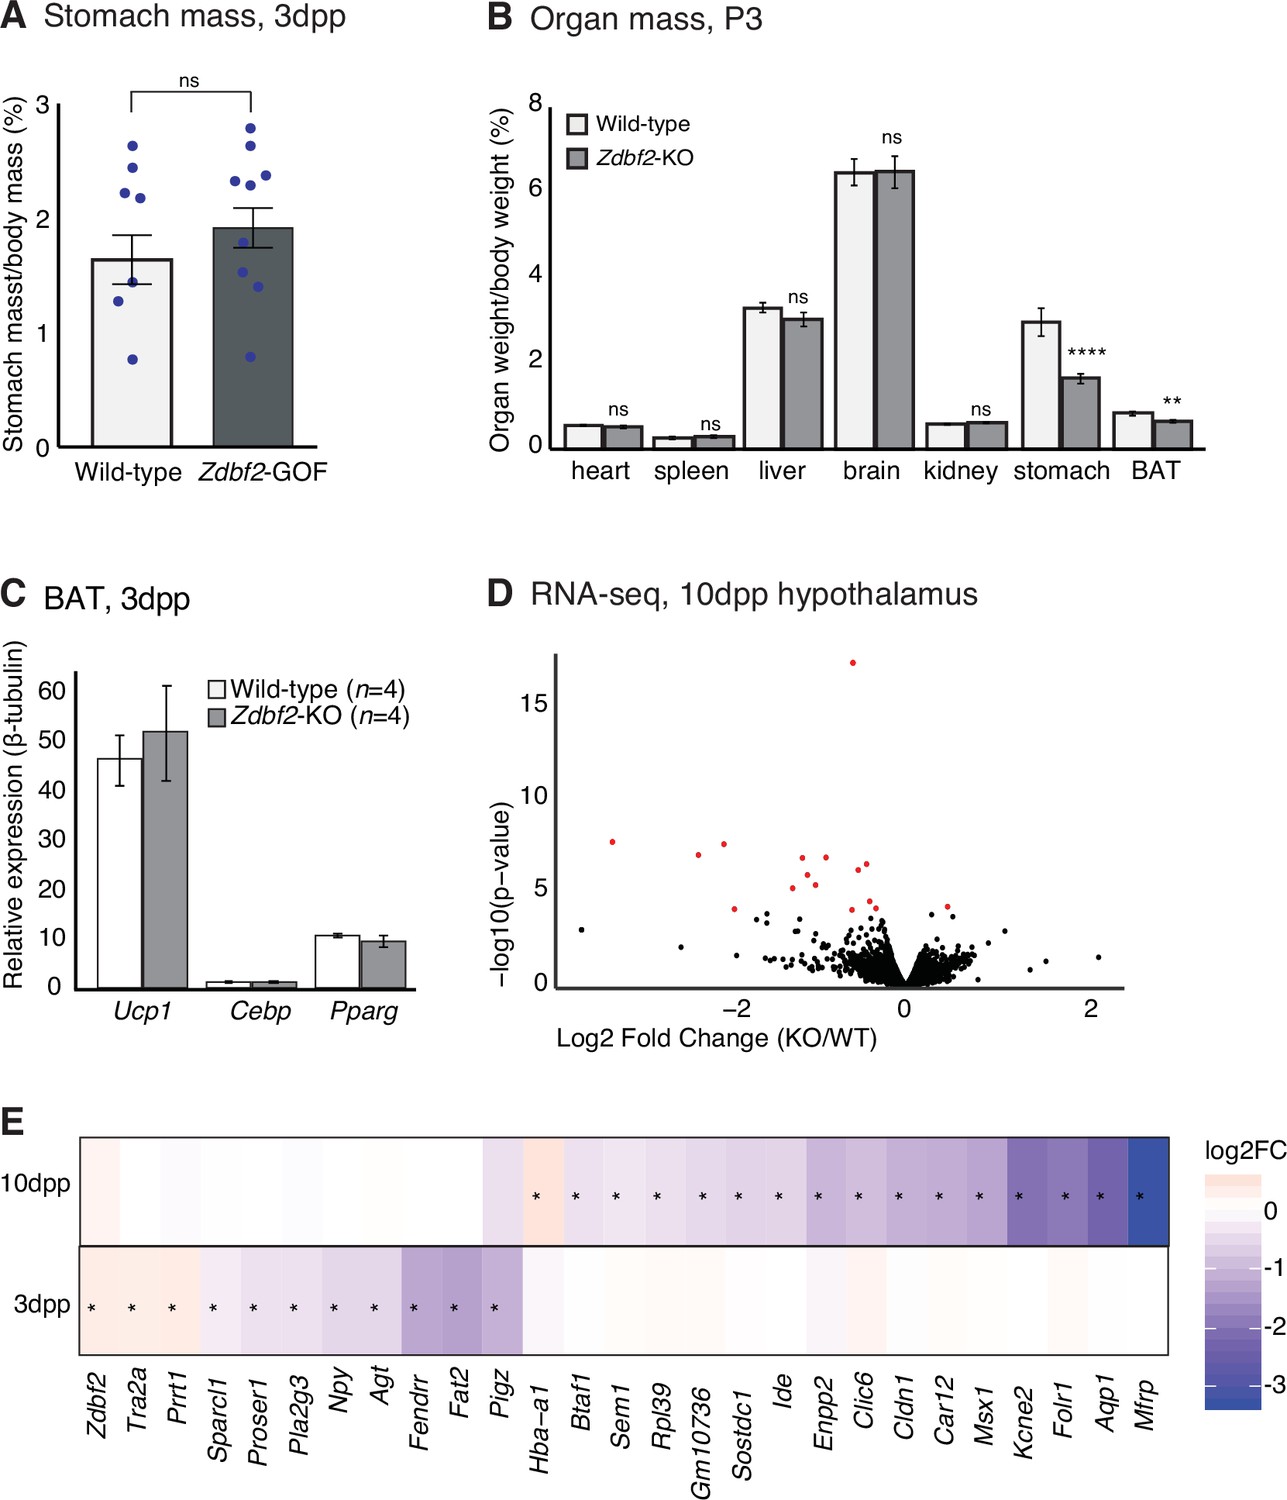
Characterization of the early postnatal feeding behavior in Zdbf2-KO pups.
(A) Stomach weight normalized to the body mass for WT and Zdbf2-GOF males at 3dpp. Data are shown as means ± s.e.m. from n replicates. Statistical analyses were performed by a two-tailed, unpaired, nonparametric Mann Whitney t test. (B) Individual organ weight plotted as percentage of total body weight in Zdbf2-KO mice and WT littermates at 3dpp. (C) RT-qPCR from BAT measuring the mRNAs level of three markers of BAT activity (Ucp-1, Cebp, and Pparg) between WT and Zdbf2-KO at 3dpp. (D) Volcano plot representation of RNA-seq of 10dpp hypothalamus of Zdbf2-KO versus WT littermates. n = 2 replicates per genotype. Red dots: differentially expressed genes with a threshold of FDR < 10%. (E) Heatmap showing the log2 fold change of expression of the differentially expressed genes (DEGs) in the hypothalamus of Zdbf2-KO pups at 3 and 10dpp. There is no overlap between the DEGs at 3 and 10dpp. Stars represent significant change of expression (FDR < 10%).
Author response image 1
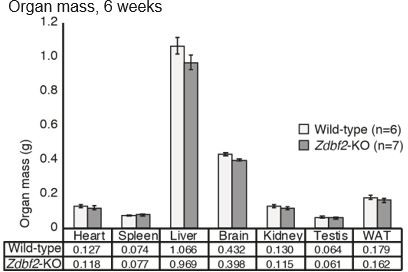
Comparison of organ mass for wild-type and Zdbf2-KO males at 6 weeks-old.
Author response image 2
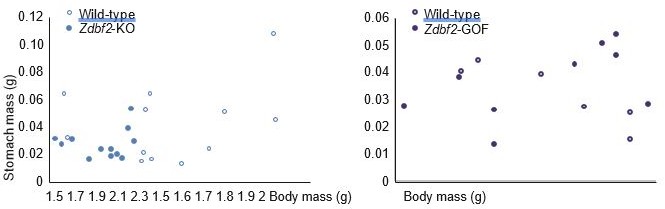
Correlation between body mass and stomach mass at 3dpp for Zdbf2-KO males (left panel) and Zdbf2-GOF males (right panel).
Tables
Key resources table
| Reagent type (species) or resource | Designation | Source or reference | Identifiers | Additional information |
|---|---|---|---|---|
| Genetic reagent (Mus. Musculus) | Zdbf2-KO | This study | CRISPR/Cas9 generated mutant, sgRNA oligos are listed in Supplementary file 1 | |
| Genetic reagent (Mus. Musculus) | Zdbf2-GOF | Bourc’his lab | Greenberg et al., 2017 | |
| Genetic reagent (Mus. Musculus) | Zdbf2-LacZ reporter line | Bourc’his lab | EUCOMM Project Number: Zdbf2_82543 | Greenberg et al., 2017 |
| Genetic reagent (Mus. Musculus) | Liz-LOF | Bourc’his lab | Greenberg et al., 2017 | |
| Antibody | Anti-ACTH, mouse monoclonal | Fitzgerald | RRID:AB_1282437 | Ref. 10C-CR1096M1, 1:1,000 |
| Antibody | Anti-GH, rabbit polyclonal | National Hormone and Peptide Program (NHPP) | Ref. AFP-5641801, 1:1,000 | |
| Antibody | Anti-TSH, rabbit polyclonal | National Hormone and Peptide Program (NHPP) | Ref. AFP-1274789, 1:1,000 | |
| Antibody | Anti-PRL, rabbit polyclonal | National Hormone and Peptide Program (NHPP) | Ref. AFP-425-10-91, 1:1,000 | |
| Antibody | Anti-LH, rabbit polyclonal | National Hormone and Peptide Program (NHPP) | Ref. AFP-C697071P, 1:500 | |
| Antibody | Anti-NPY, rabbit polyclonal | Cell Signaling Technology | RRID:AB_2716286 | Ref. # 11976, 1:1,000 |
| Antibody | Anti-beta-galactosidase, chicken polyclonal | Abcam | Ref. # ab9361, 1:1,000 | |
| Antibody | Goat anti-rabbit Alexa-fluorophore 594 | Invitrogen | RRID:AB_2762824 | Ref. #A32740, 1:1,000 |
| Antibody | Gao anti-chicken Alexa-fluorophore 488 | Invitrogen | RRID:AB_2534096 | Ref. # A11039, 1:1,000 |
| Commercial assay or kit | Mouse Magnetic Luminex Assay for IGF-1 | R&D System | ||
| Commercial assay or kit | Milliplex Mouse Pituitary Magnetic Assay for GH | Merck | ||
| Software, algorithm | STAR_2.6.1 a | Dobin et al., 2013 |
Additional files
-
Transparent reporting form
- https://cdn.elifesciences.org/articles/65641/elife-65641-transrepform1-v2.docx
-
Supplementary file 1
List of primers used in this study.
- https://cdn.elifesciences.org/articles/65641/elife-65641-supp1-v2.xlsx
Download links
A two-part list of links to download the article, or parts of the article, in various formats.
Downloads (link to download the article as PDF)
Open citations (links to open the citations from this article in various online reference manager services)
Cite this article (links to download the citations from this article in formats compatible with various reference manager tools)
The imprinted Zdbf2 gene finely tunes control of feeding and growth in neonates
eLife 11:e65641.
https://doi.org/10.7554/eLife.65641


