Quantitative control of noise in mammalian gene expression by dynamic histone regulation
- School of Life Sciences, Southern University of Science and Technology, China
- Department of Chemistry, The Hong Kong University of Science and Technology, China
- Shenzhen Key Laboratory of Gene Regulation and Systems Biology, School of Life Sciences, Southern University of Science and Technology, China
- Core Research Facilities, Southern University of Science and Technology, China
- Department of Biomedical Engineering, Southern University of Science and Technology, China
Figures
Figure 1 with 5 supplements
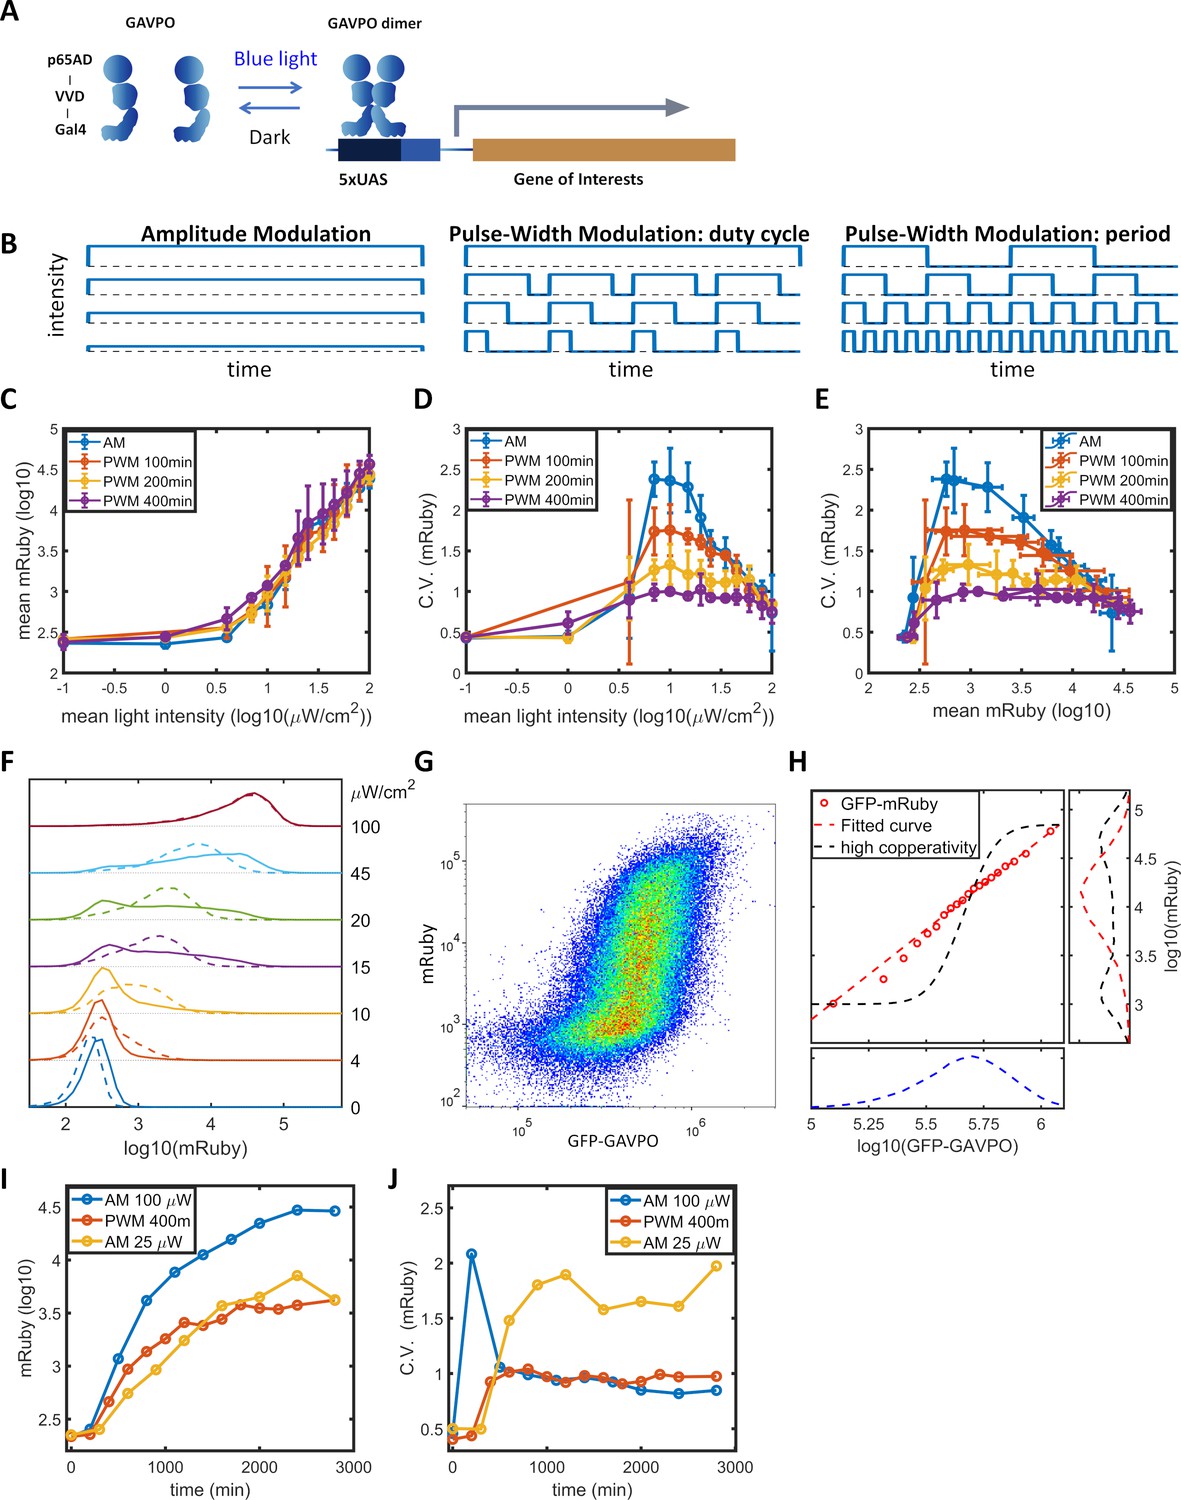
Gene expression and noise of the LightOn-mRuby expression system in HeLa-AB1 cells during light induction with amplitude modulation (AM) or pulse-width modulation (PWM).
(A) Schematic representation of the LightOn expression system. (B) Illustration of AM and PWM light modulations. (C) The response curves of mean mRuby expression relative to mean light intensity for AM (blue) and PWM with a period of 100 min (red), 200 min (yellow), and 400 min (purple). (D–E) The correlation curves of the CV of mRuby expression versus mean light intensity (D) and mean mRuby expression (E) for AM (blue) and PWM with a period of 100 min (red), 200 min (yellow), and 400 min (purple). The error bars represent standard deviations from 2–4 independent experiments. (F) Analysis of AM-induced mRuby expression distribution (solid lines) and PWM-induced mRuby expression distribution (dashed lines, with a period of 400 min) for various mean light intensities, as marked on the right axis. (G) Density plot of mRuby against GFP-GAVPO expression under AM with 25 μW/cm2. (H) In the large panel, a computed GAVPO-GFP versus mRuby response curve is shown with the cells from (G) divided into 20 equal populations in ascending order of GFP intensity; mean mRuby is plotted against mean GFP-GAVPO (both as common logarithms) (red open circles) and fitted to a Hill function (red dashed line) with a Hill coefficient of 1.87. A hypothetical highly cooperative curve is illustrated by the black dashed line. The lower panel shows the distribution of GFP-GAVPO expression. The predicted mRuby distributions based on the experimentally determined and hypothetical response curves are shown as the red and black dashed lines, respectively, in the right panel. All measurements were performed 48 hr after light induction. (I–J) The mean and CV of mRuby protein at different time points for AM with intensity of 100 μW/cm2 (blue), for PWM with a maximum intensity of 100 μW/cm2, a period of 400 min, and an on-fraction of 0.25 (red), and for AM with intensity of 25 μW/cm2 (yellow).
-
Figure 1—source data 1
Source data for Figure 1.
- https://cdn.elifesciences.org/articles/65654/elife-65654-fig1-data1-v2.xlsx
Figure 1—figure supplement 1
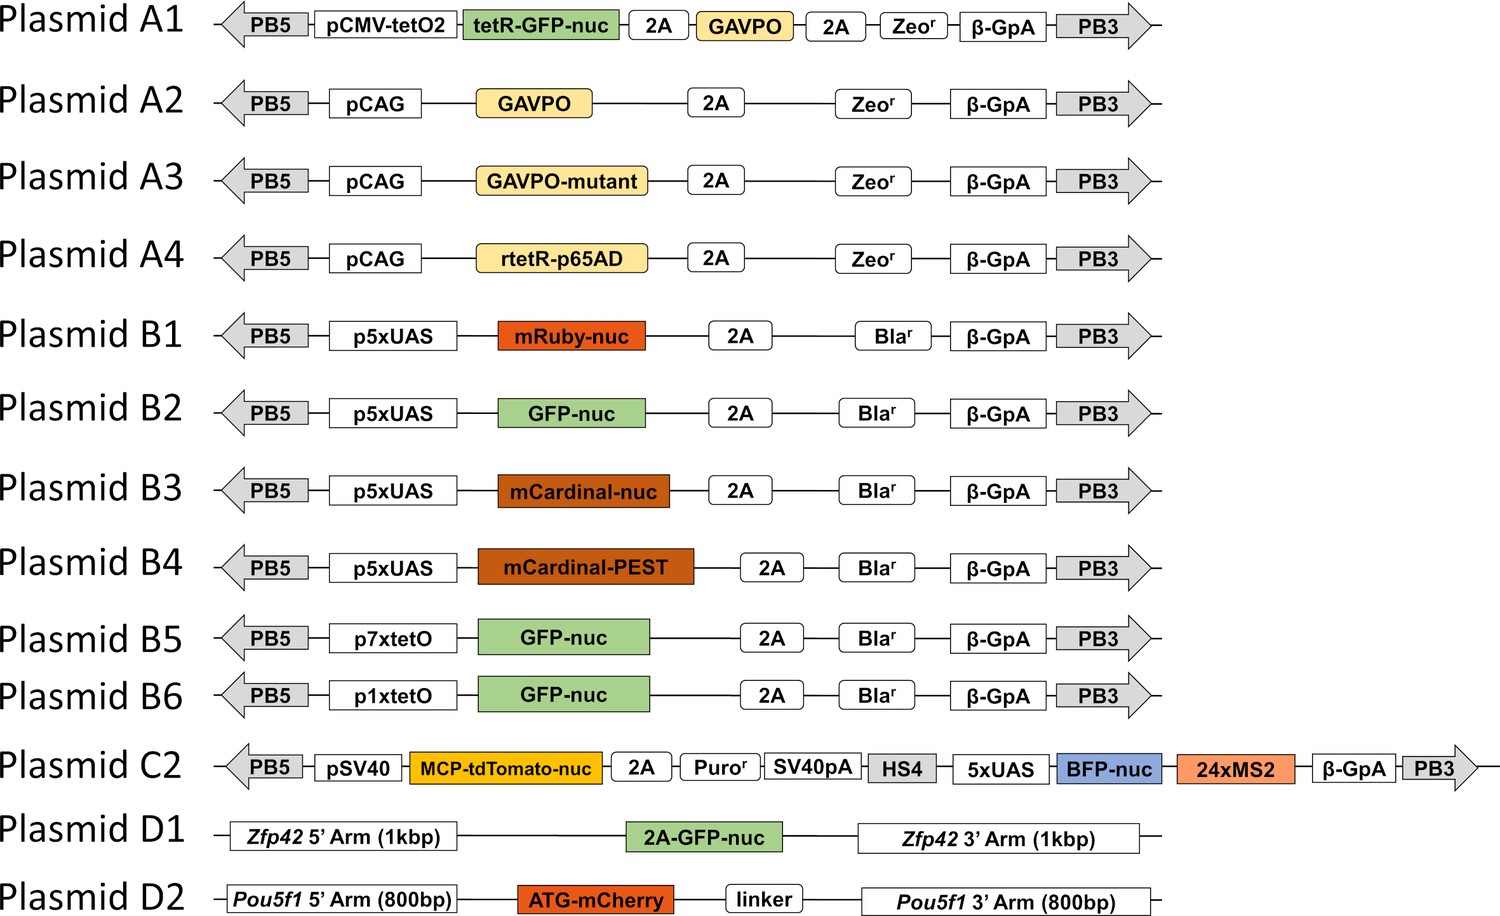
Schematic of plasmids for the LightOn expression circuits.
PB5 and PB3 are the two terminal repeats for the PiggyBac transposon; pCMV-tetO2 is the engineered pCMV promoter with two tetO sequences sandwiched in the TATA box; tetR-GFP-nuc is the fusion protein of the tet repressor, EGFP, and three repeats of SV40 nuclear localization sequence; pCAG is the CAG promoter; pSV40 is the SV40 promoter. All other symbols are described in detail in the 'Materials and methods' section.
Figure 1—figure supplement 2
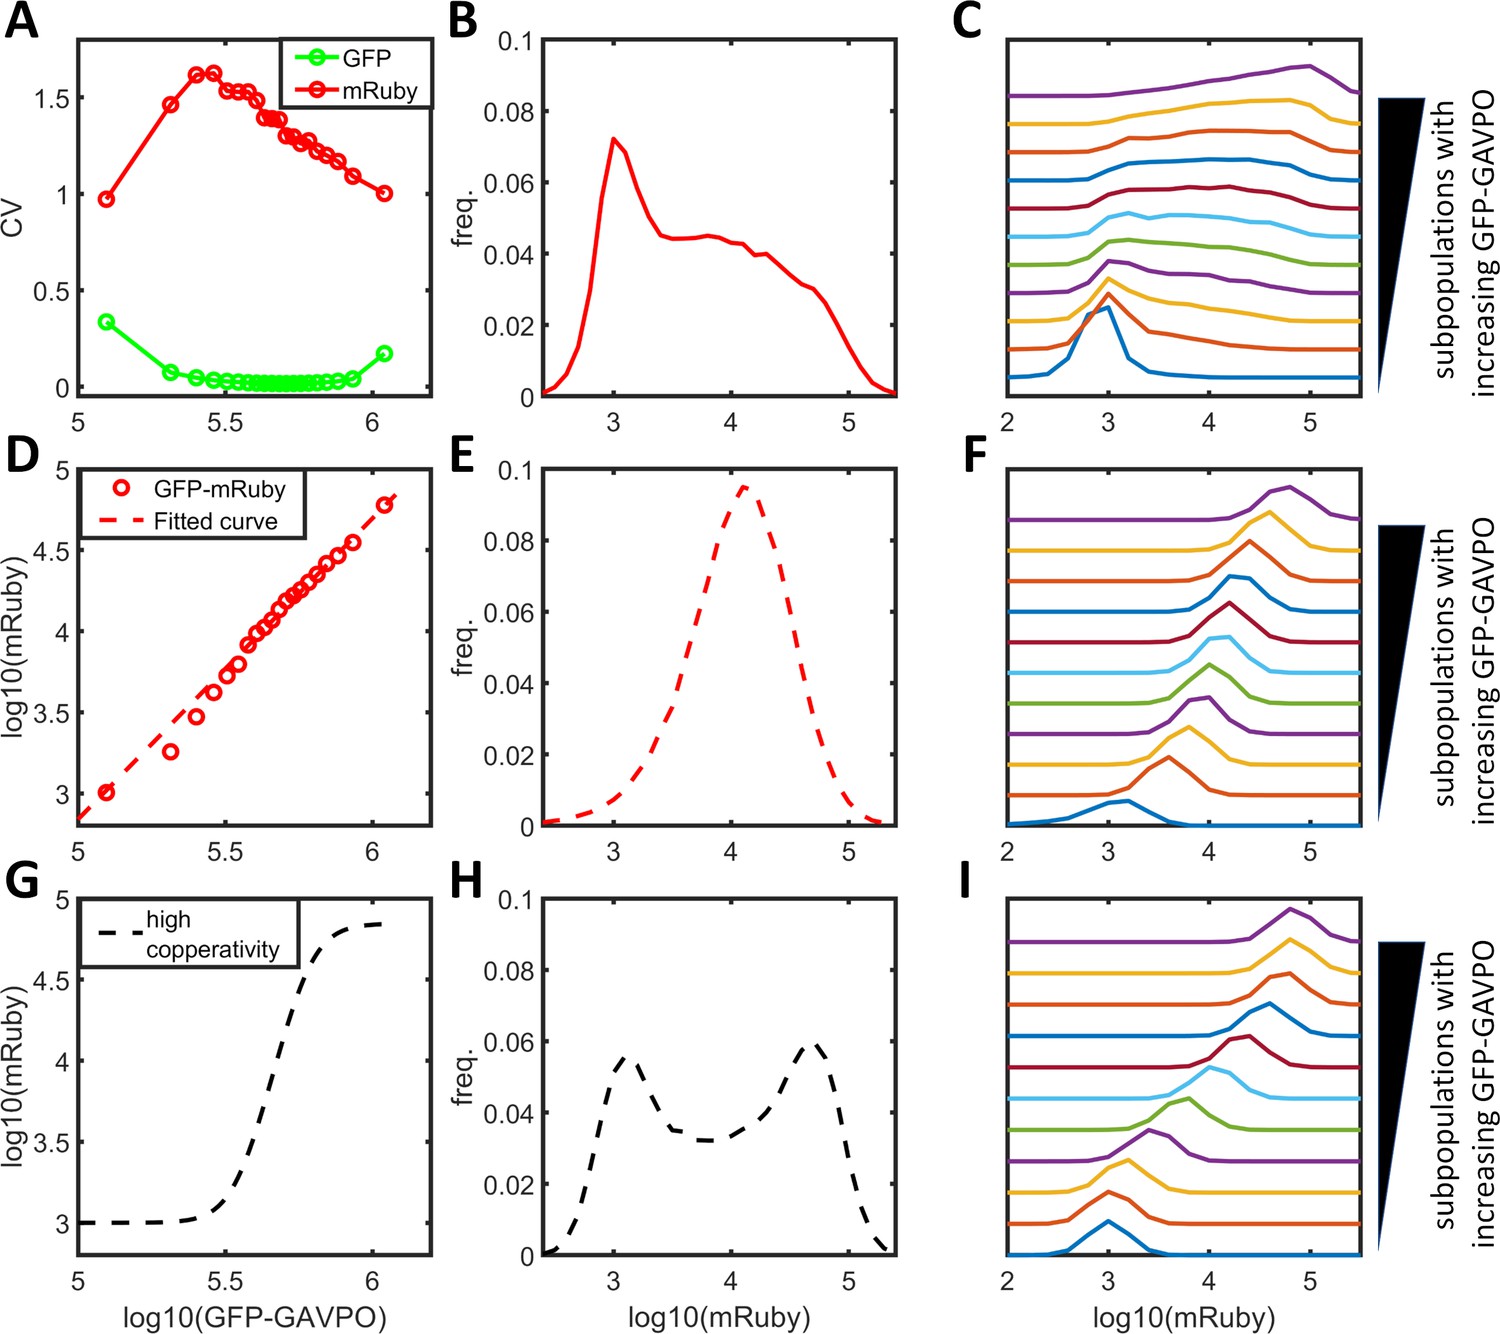
Comparison between experimental mRuby distributions and predictions of single-valued GAVPO-mRuby functions.
(A) The coefficients of variation of GFP-GAVPO (green) and mRuby for subpopulations of cells with incremental and narrow GFP distributions from cells exposed to 25 μW/cm2 AM light induction (Figure 1G). (B) Frequency distribution of mRuby expression calculated from experimental data in (A). (C) Cells with a narrow range of GFP-GAVPO exhibit a bimodal or multimodal mRuby distribution. Cells from (A) were divided into 20 equal populations in ascending order of GFP intensities, and graphs of mRuby distribution were calculated from subpopulations 1, 3, 5, 7, 9, 11, 13, 15, 17, 19, and 20 (from bottom to top). (D) Experimental mean mRuby versus mean GFP-GAVPO plotted for the 20 subpopulations (open red circles) closely corresponded to a shallow Hill function (dashed red line) with a Hill coefficient of 1.87 and an ‘EC50’ greater than 108. (E–F) The empirical function (D) predicted a unimodal mRuby distribution for the entire cell population (E) or for subpopulations with narrow GFP-GAVPO ranges (F). (G–I) Hypothetical high cooperativity (G) predicted a bimodal mRuby distribution for the entire cell population (H), but unimodal distributions for subpopulations with narrow GFP-GAVPO ranges (I).
-
Figure 1—figure supplement 2—source data 1
Source data for Figure 1—figure supplement 2.
- https://cdn.elifesciences.org/articles/65654/elife-65654-fig1-figsupp2-data1-v2.xlsx
Figure 1—figure supplement 3
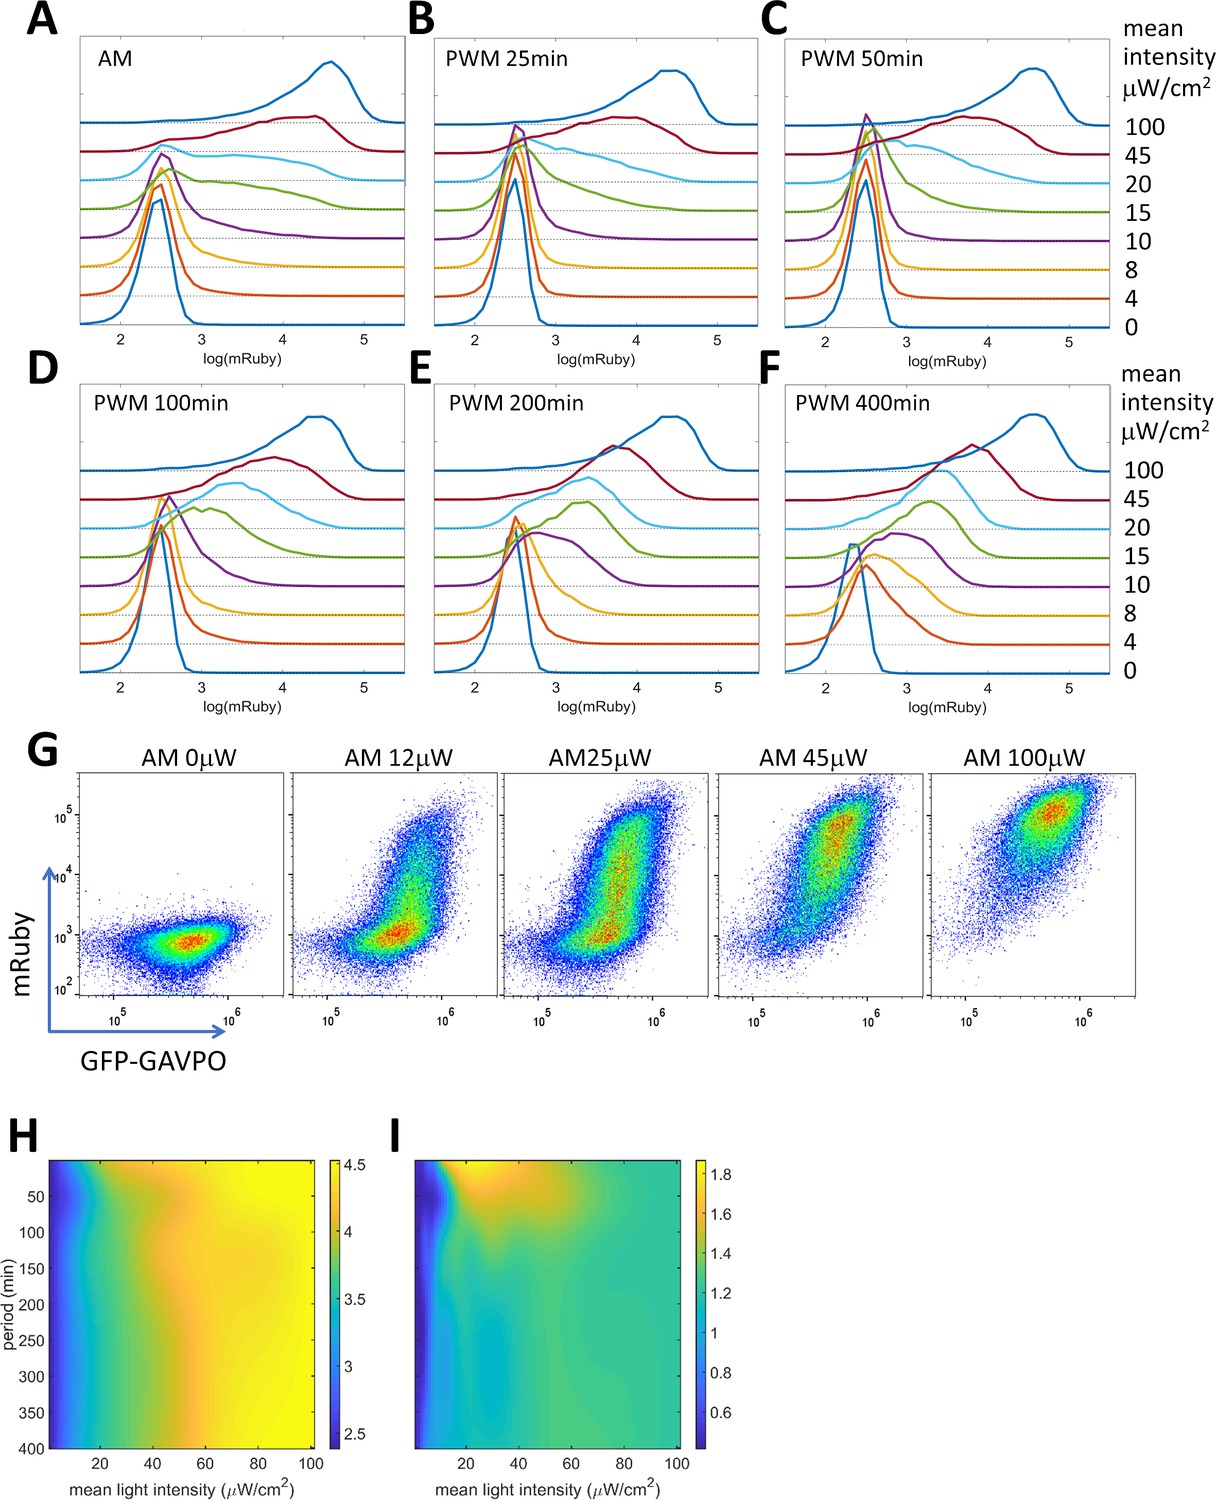
PWM modulation of distribution dispersion in HeLa-AB1 cells.
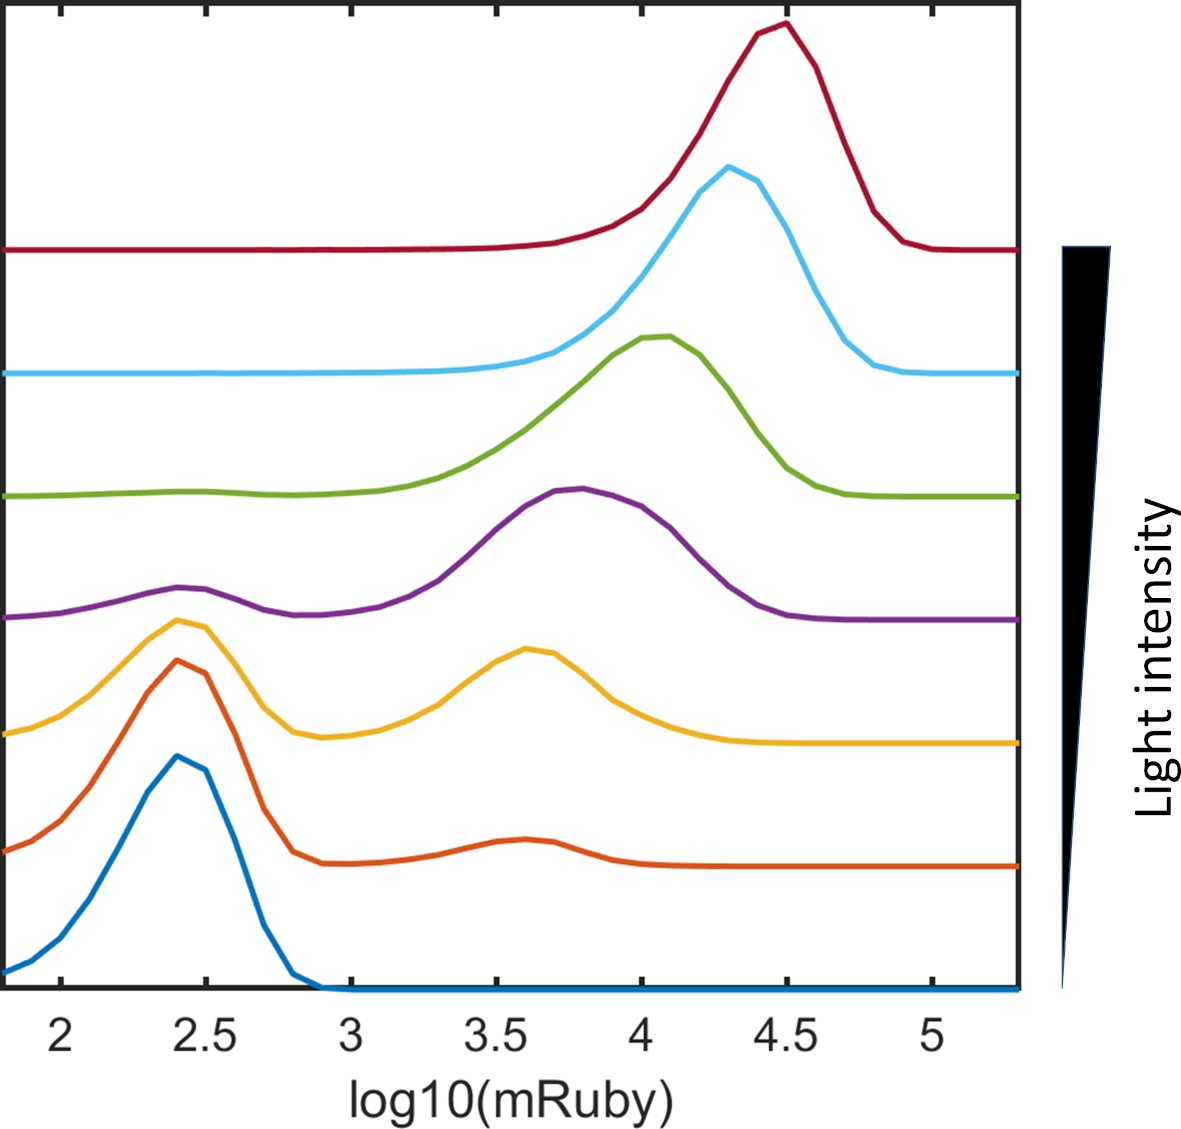
(A–F) mRuby expression distribution of HeLa-AB1 cells under AM light (A), and under PWM light with periods of 25 min (B), 50 min (C), 100 min (D), 200 min (E), and 400 min (F). The light intensities (AM) or duty (on-fraction) are labeled to the right of the plots. (G) mRuby-GFP-GAVPO density plots for HeLa cell populations under AM light with intensities of 0, 12, 25, 45 and 100 μW/cm2. (H) Surface response plot of mean mRuby expression relative to period and mean light intensity of PWM induction. (I) Surface response plot of mRuby distribution spreading (ratio of of the 90th percentile to the 10th percentile of mRuby intensity) relative to the period and mean light intensity of PWM induction. (H–I) Data were fitted using a cubic smoothing spline function, and plotted as common logarithms. Each sample contains 10,000–50,000 cells.
-
Figure 1—figure supplement 3—source data 1
Source data for Figure 1—figure supplement 3.
- https://cdn.elifesciences.org/articles/65654/elife-65654-fig1-figsupp3-data1-v2.xlsx
Figure 1—figure supplement 4
Noise modulation in HeLa-AB2 and F9-AB2 cells.
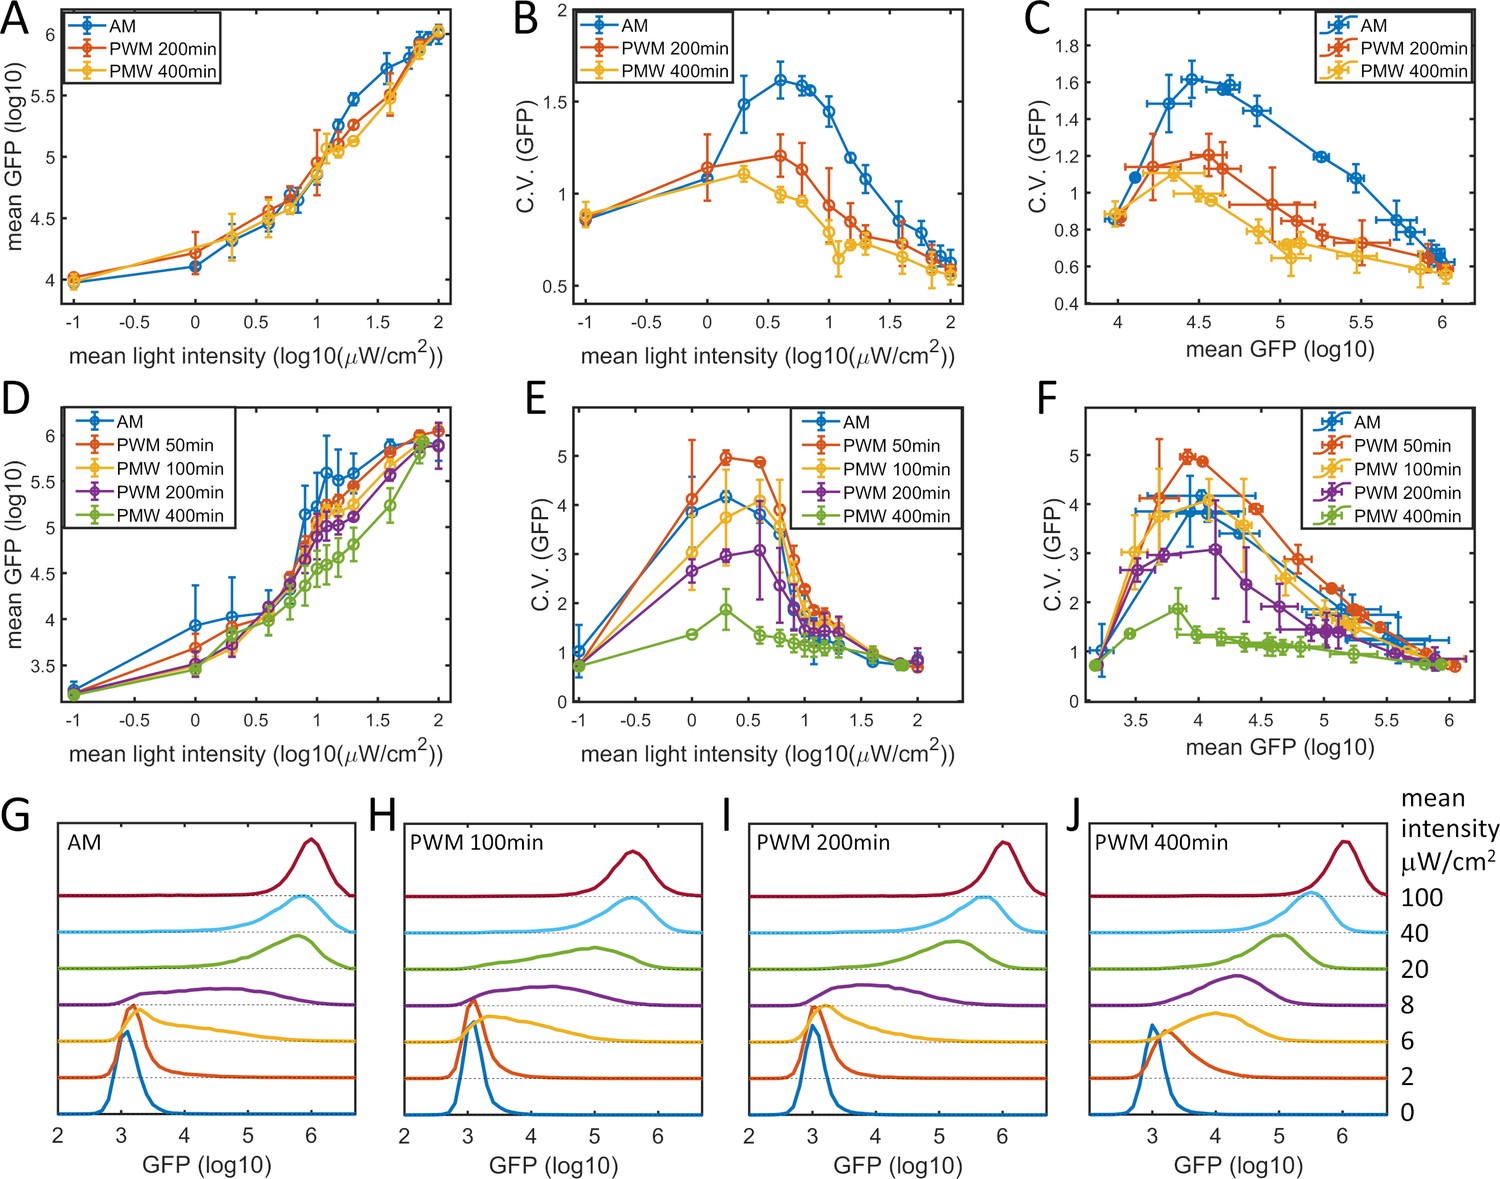
Plots of (A) mean GFP versus mean light intensity, (B) CV of GFP versus mean light intensity, and (C) CV of GFP versus mean GFP for the HeLa-AB2 clone under AM light (blue) and PWM light with periods of 200 min (red) and 400 min (yellow). Plots of (D) mean GFP versus mean light intensity, (E) CV of GFP versus mean light intensity, and (F) CV of GFP versus mean GFP for the F9-AB2 clone under AM light (blue), and PWM light with periods of 50 min (red), 100 min (yellow), 200 min (purple) and 400 min (green). Error bars represent standard deviations from at least two independent experiments. (G–J) Plots of GFP expression distribution for F9-AB2 cells induced with AM light (G) and with PWM light with periods of 100 min (H), 200 min (I), and 400 min (J). The mean light intensities are shown on the right axis. Each sample contains 10,000–50,000 cells.
-
Figure 1—figure supplement 4—source data 1
Source data for Figure 1—figure supplement 4.
- https://cdn.elifesciences.org/articles/65654/elife-65654-fig1-figsupp4-data1-v2.xlsx
Figure 1—figure supplement 5
Noise modulation in HeLa-A1B1B3, HeLa-A4B5, and HeLa-A4B6 cells.
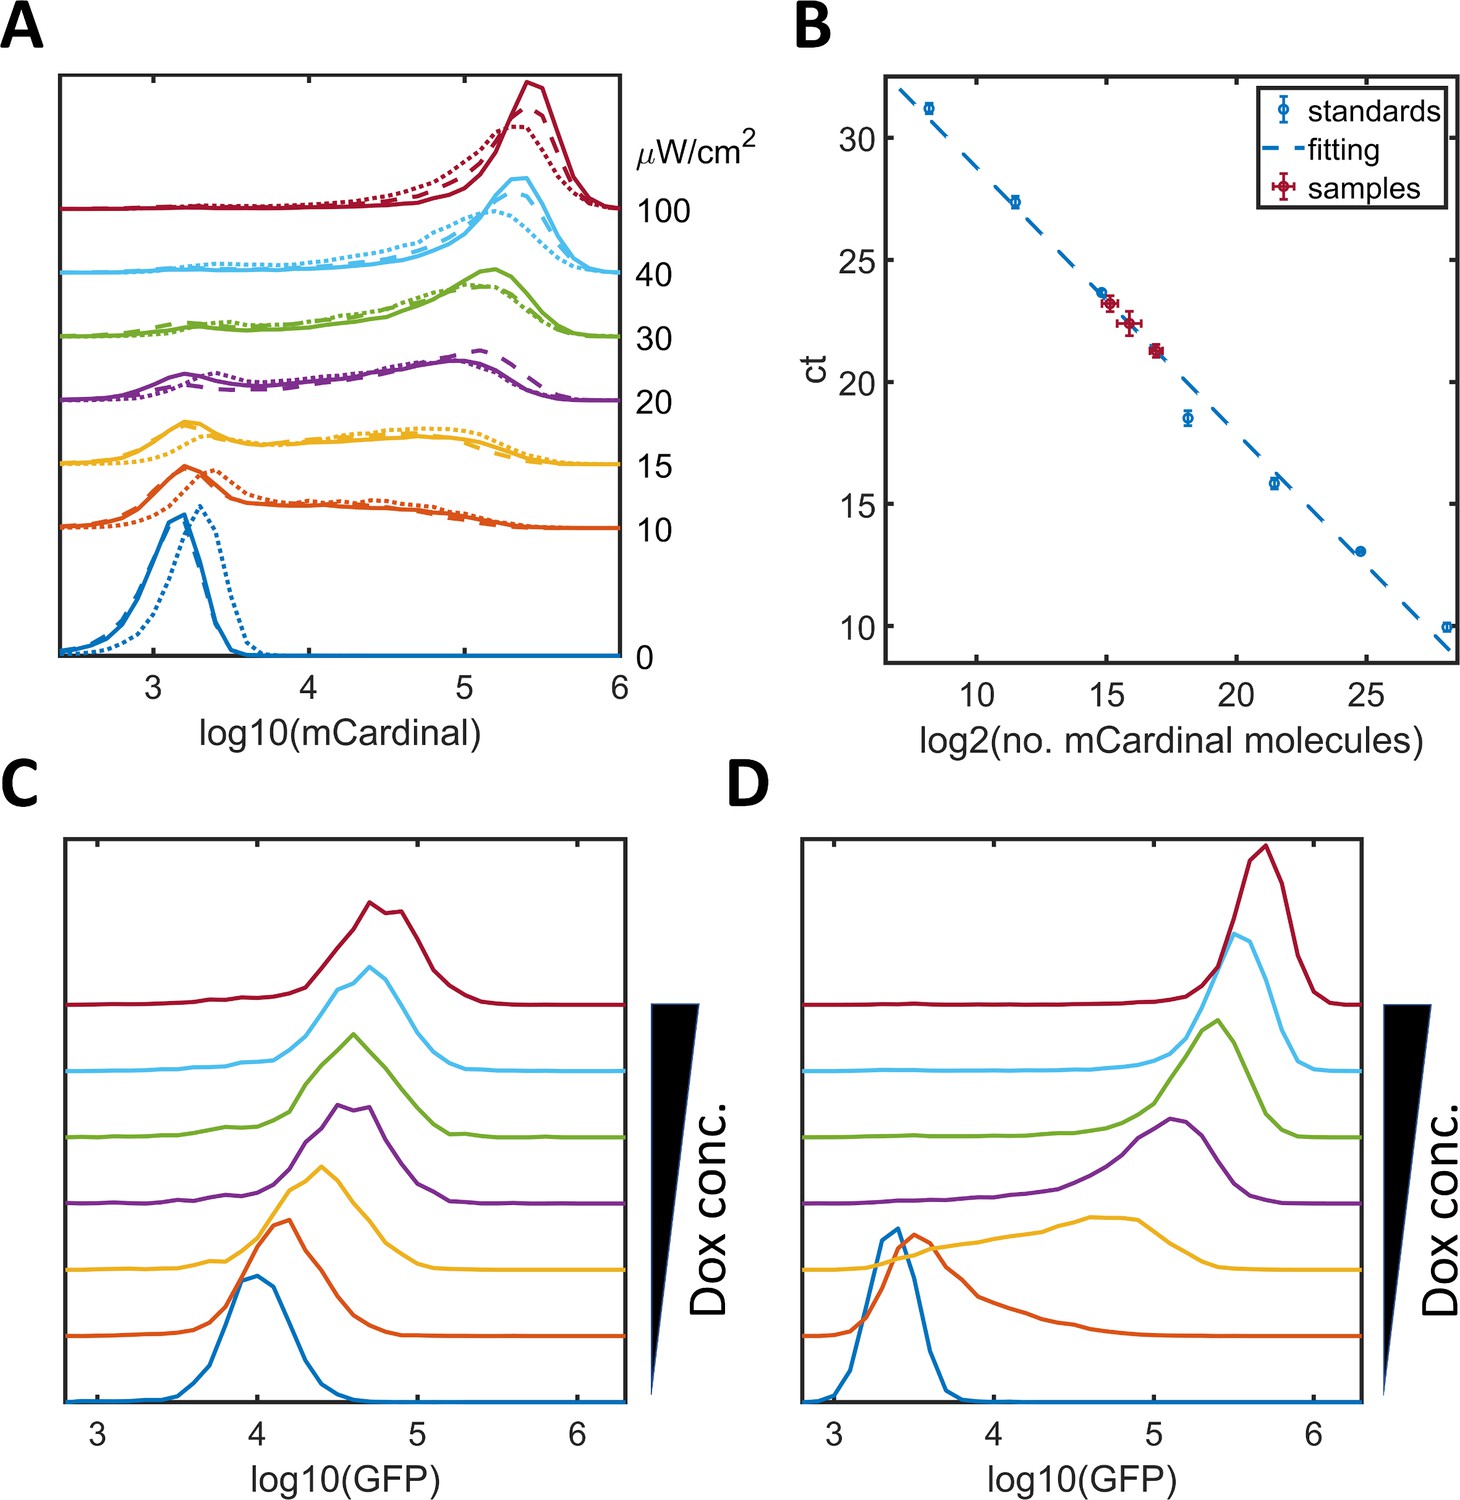
(A) Plots of mCardinal expression distribution for HeLa-A1B1B3 clones 1 (solid), 2 (dashed), and 3 (dotted) induced with AM lights of different intensities. (B) qPCR quantification of the copy numbers of 5xUAS-mCardinal genome insertions for these clones (1 – 3.1 ± 0.7; 2 – 10.6 ± 1.9; 3 – 5.1 ± 1.9). The standard curve was obtained with mCardinal plasmid diluted with the same amount of wild type HeLa genome DNA and fitted with a linear function (y = −0.921*log2(x) + 36.5). (C–D) Graphs of GFP expression distribution for HeLa-A4B5 (C, with one tetOs) or for HeLa-A4B6 (D, with seven tetO) induced with increasing concentrations of doxycycline.
-
Figure 1—figure supplement 5—source data 1
Source data for Figure 1—figure supplement 5.
- https://cdn.elifesciences.org/articles/65654/elife-65654-fig1-figsupp5-data1-v2.xlsx
Figure 2 with 4 supplements
Model of light-induced gene expression and epigenetic bistability.
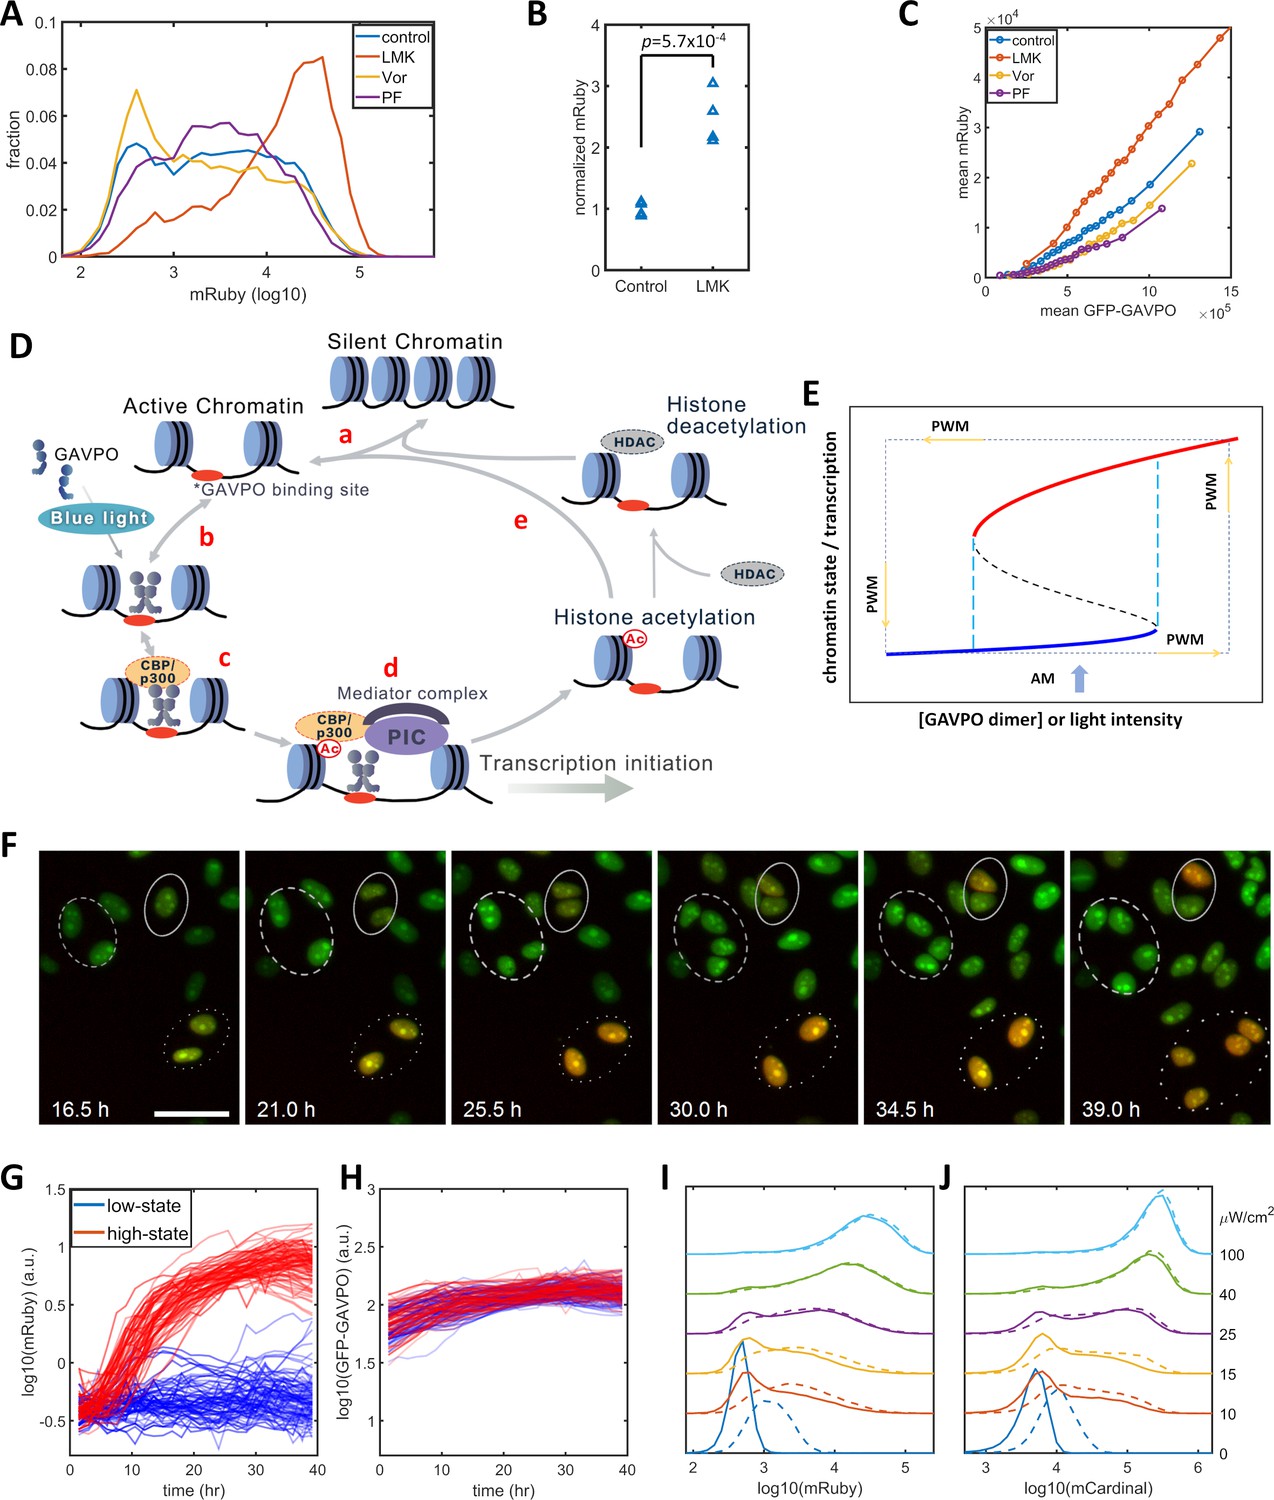
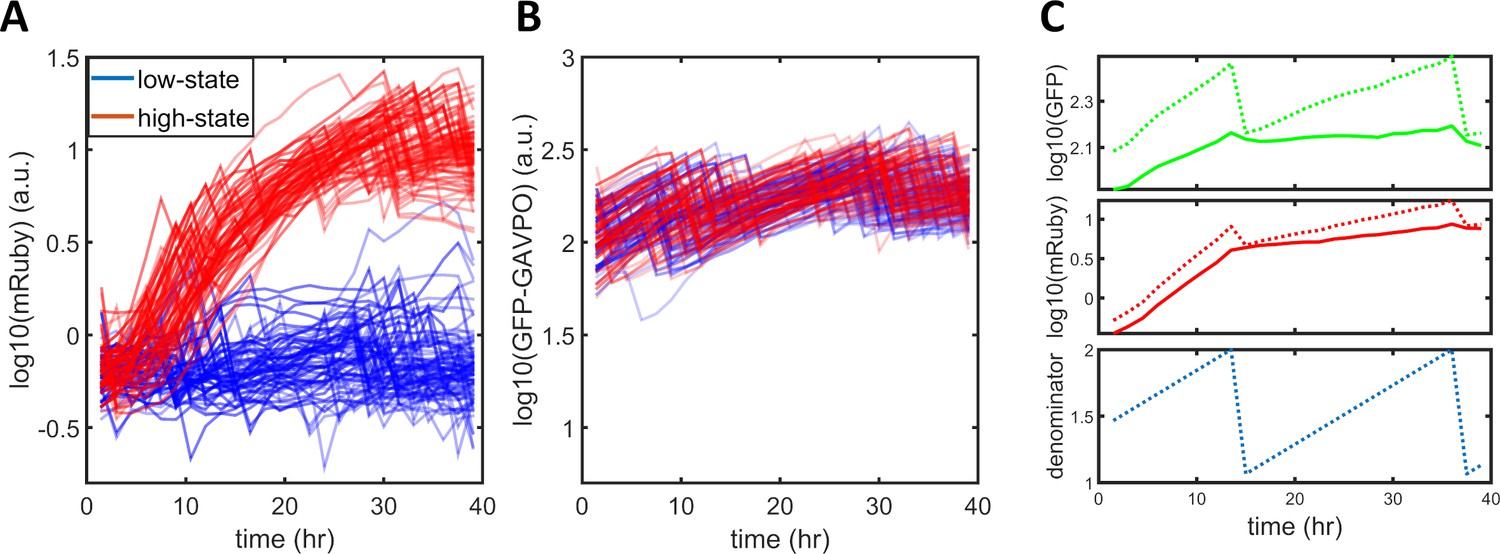
(A) mRuby expression distribution of HeLa-AB1 cells under AM with 25 μW/cm2 and treated with inhibitors of various epigenetic regulators. LMK, LMK-235 (a selective HDAC4/5 inhibitor); Vor, Vorinostat (SAHA) (a broad-spectrum inhibitor of HDACs); PF, PF-06726304 (a selective inhibitor for the EZH2 component of the Polycomb Repressive Complex 2 (PRC2)). The concentration of the three inhibitors was 0.333 μM. (B) Unpaired t-test for normalized mRuby expression comparing control and LMK-235-treated HeLa-AB1 cells. Data represent four independent experiments. (C) Response curves of population average mRuby expression versus population mean GFP-GAVPO expression after treatment with inhibitors of various epigenetic regulators. (D) Proposed mechanism underlying transcription and epigenetic regulation events involved in the expression of the LightOn system. 'HDAC' represents HDAC4/5 and possibly other HDACs; PIC, transcriptional preinitiation complex; Ac, histone acetylation. (E) Schematic view of the induction of bistability by a positive feedback loop, illustrating the induction of high noise levels by AM and the reduction of noise by PWM. The black dashed line represents the boundary that separates the high and low states, also known as the unstable steady state. The cyan dashed lines represent the thresholds between the low monostable state (blue) and bistable states (blue and red) and between the bistable states (blue and red) and the high monostable state (red). The blue arrow indicates an AM of intermediate intensity located at the bistability region. The PWM cycle (represented by the dashed rectangle) alternates cells between high and low monostable states. (F) Time-lapse images of single-cell mRuby expression dynamics for HeLa-A1B1 cells with 25 μW/cm2 AM light induction. The green and red colors represent the intensities of nuclear-localized GFP-GAVPO and mRuby, respectively. Single nuclei were segmented and tracked with customized scripts and used to quantify single-cell expression of GFP-GAVPO and mRuby. The scale bar represents 50 μm. (G–H) Tracking and quantification of the single-cell dynamics of mRuby (G) or GFP-GAVPO (H) expression in HeLa-A1B1 cells under 25 μW/cm2 AM light induction. Red and blue lines represent 100 cells in ‘high’ or ‘low’ states, respectively, after 24 hr. (I–J) Plots of mRuby (I) and mCardinal (J) expression distribution for HeLa-A1B1B4 cells with AM of increasing light intensity. Solid and dashed lines represent cells without or with prior 8 hr of 100 μW/cm2 light inductions, respectively. Each sample contains 10,000–50,000 cells.
-
Figure 2—source data 1
Source data for Figure 2.
- https://cdn.elifesciences.org/articles/65654/elife-65654-fig2-data1-v2.xlsx
Figure 2—figure supplement 1
Inhibition of HDAC4/5 in F9-AB2 and HeLa-Tet-On cells.
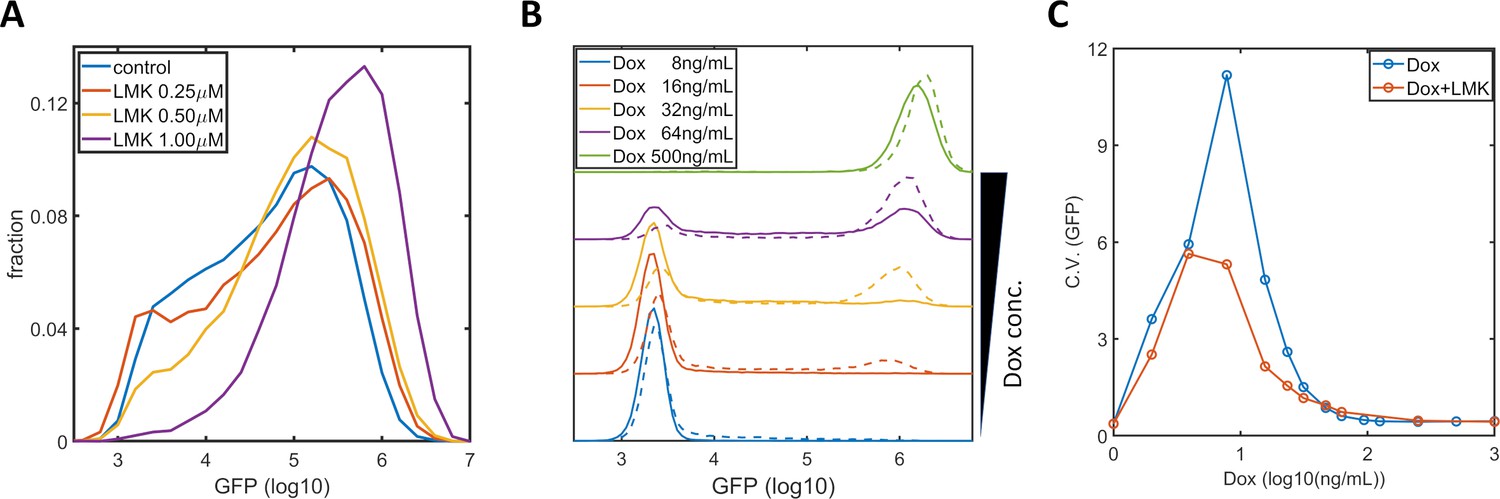
(A) GFP expression distribution of F9-AB2 cells with AM light (10 μW/cm2) alone (blue), and with AM light plus 0.25 μM (red), 0.5 μM (yellow), and 1 μM (purple) LMK-235. (B) GFP expression distribution of HeLa-Tet-On cells (stably transfected with the Tet-On-GFP expression circuit Lu and Huang, 2014) with doxycycline alone (solid lines), and with doxycycline plus 0.333 μM LMK-235 (dashed line). The doxycycline concentrations are shown in the legend. (C) CVs of GFP expression for HeLa-Tet-On cells with doxycycline alone (blue circles) and with doxycycline plus 0.333 μM LMK-235 (red circles). Each sample contains 10,000–50,000 cells.
-
Figure 2—figure supplement 1—source data 1
Source data for Figure 2—figure supplement 1.
- https://cdn.elifesciences.org/articles/65654/elife-65654-fig2-figsupp1-data1-v2.xlsx
Figure 2—figure supplement 2
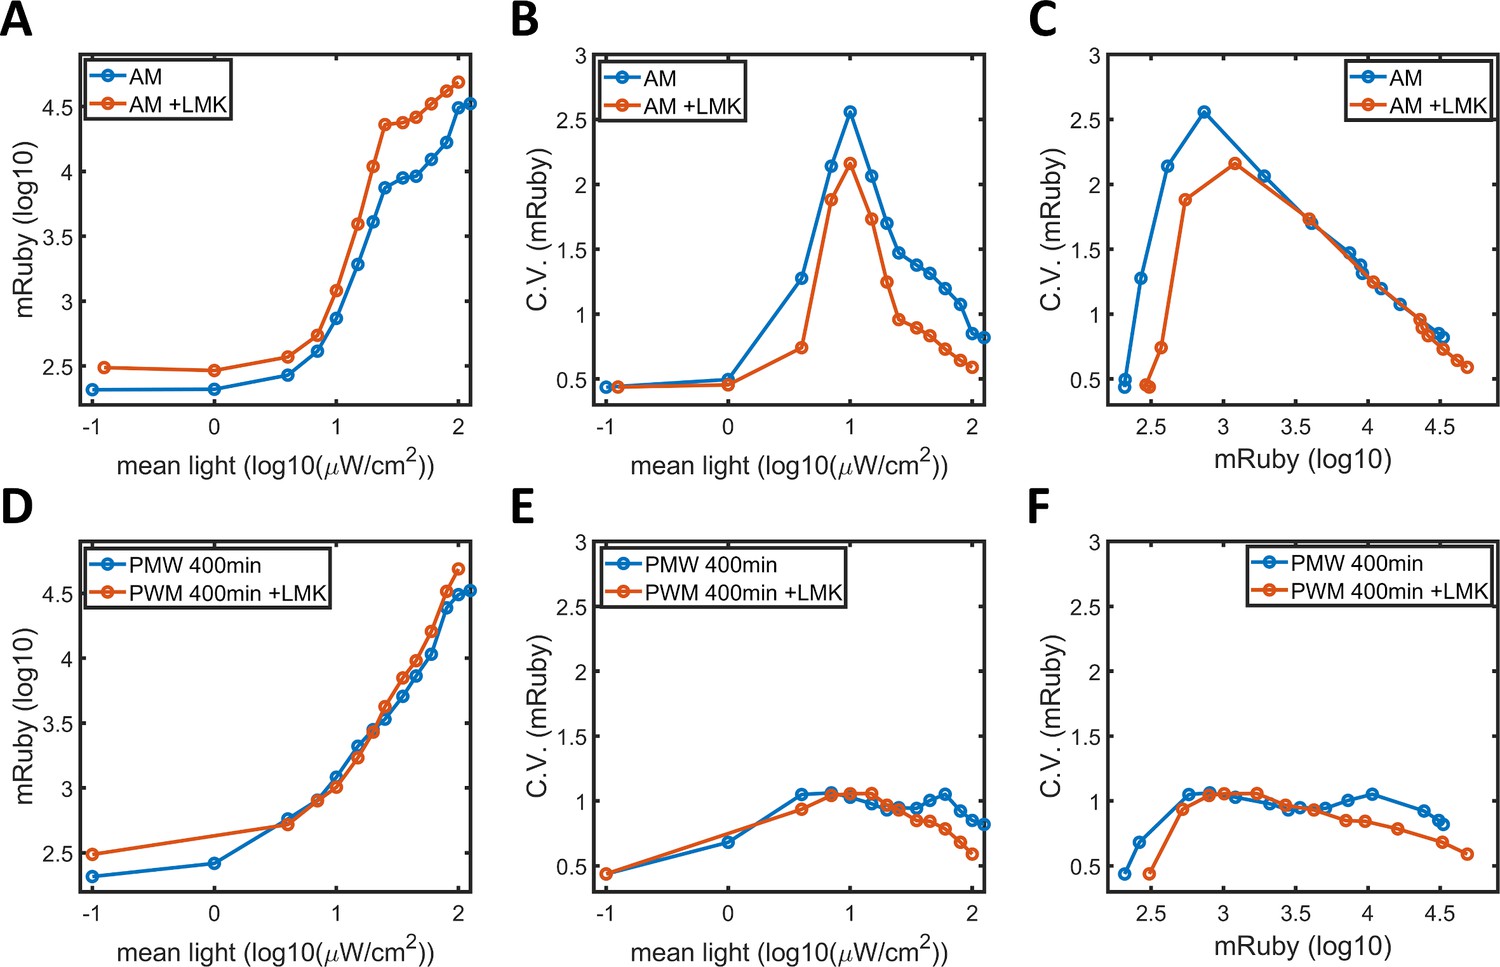
HDAC4/5 inhibition in HeLa-AB1 cells.
(A) Plot of mean mRuby expression against mean light intensities. (B) CV of mRuby emission plotted against mean light intensity. (C) CV of mRuby expression plotted against mean mRuby expression for HeLa-AB1 cells under AM light, without LMK-235 (blue line) and with 0.333 μM LMK-235 (red line) for two days. (D) Plot of mean mRuby expression against mean light intensity. (E) CV of mRuby expression plotted against mean light intensity and (F) CV of mRuby expression plotted against mean mRuby expression for HeLa-AB1 cells under PWM light with a period of 400 min, either without LMK-235 (blue line) or with 0.333 μM LMK-235 (red line) for two days.
-
Figure 2—figure supplement 2—source data 1
Source data for Figure 2—figure supplement 2.
- https://cdn.elifesciences.org/articles/65654/elife-65654-fig2-figsupp2-data1-v2.xlsx
Figure 2—figure supplement 3
Normalization of single-cell expression dynamics.
(A) Raw traces of single-cell mRuby dynamics. The blue and red traces represent cells designated as being in a low or high state, respectively, after around 24 hr. (B) Raw traces of single-cell GFP-GAVPO dynamics. (C) A raw trace of GFP fluorescence (dotted green line) was used to calculate a denominator curve (dotted blue line) that shows the cell cycle of each cell. The sharp drop in single-cell GFP indicates a cell division event, with the denominator values immediately before and after it set to 2 and 1, and connected with linear functions. Raw GFP (dotted green line) or mRuby (dotted red line) signals were converted to normalized GFP (solid green line) or normalized mRuby (solid red line) by dividing by the denominator (dotted blue line).
-
Figure 2—figure supplement 3—source data 1
Source data for Figure 2—figure supplement 3.
- https://cdn.elifesciences.org/articles/65654/elife-65654-fig2-figsupp3-data1-v2.xlsx
Figure 2—video 1
Single-cell mRuby-expression dynamics.
The nuclear-localized mRuby channel is shown overlaying the nuclear-localized GFP-2A-GAVPO channel. Cells in the low mRuby expression state are shown in green. Cells in the high mRuby expression state are shown in orange. The video shows that the mRuby expression state is mostly inherent in both daughter cells after each division. An example in which two daughter cells took different states is shown near the top at around 30 hr.
Figure 3 with 2 supplements
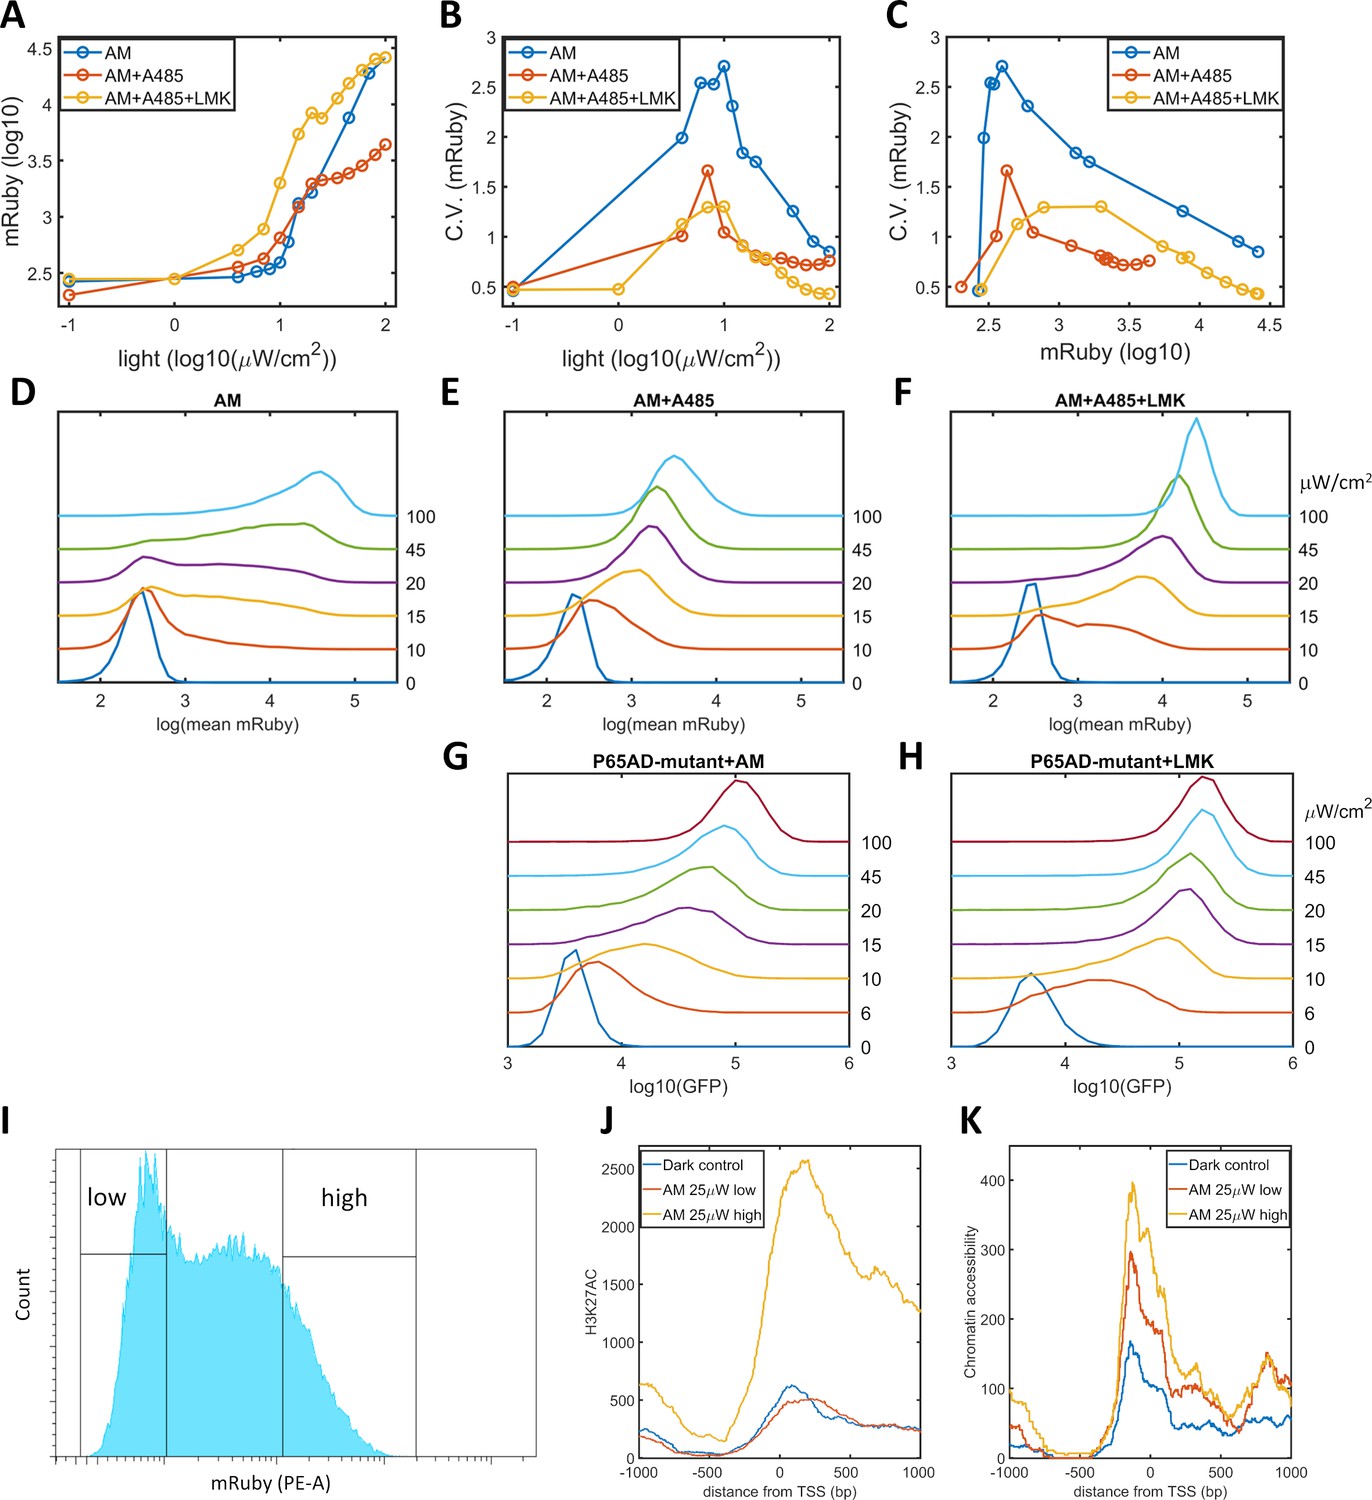
Validation of the epigenetic bistability of HeLa-AB1 cells in CBP/p300 inhibitor, H3K27ac, and ATAC-seq analyses.
(A–C) Dose-response curve of mean mRuby expression versus light intensity (A), CV of mRuby expression versus light intensity (B) or versus mean mRuby expression(C). The experimental conditions include AM modulation alone (blue), AM with 1 μM A-485 (red), and AM with 1 μM A-485 and 0.333 μM LMK-235 (yellow). (D–F) mRuby expression distribution under increasing light intensities for AM alone (D), AM with 1 μM A-485 (E) and AM with 1 μM A-485 and 0.333 μM LMK-235 (F). The light intensities are specified to the right of each line. (G–H) GFP fluorescence distribution of HeLa-A3B2 cells at increasing light intensities for AM alone (G) and AM with 0.333 μM LMK-235 (H). (I) HeLa-AB1 cells treated with one day of AM light of 25 μW/cm2intensity were sorted into low- and high-mRuby-expression populations for further ChIP-seq and ATAC-seq analysis. (J–K) H3K27ac ChIP-seq (J) and ATAC-seq (K) analyses for the inserted 5xUAS promoter, aligned at the transcription start site (TSS), for the dark control (blue), a low-mRuby-expression population induced by AM 25μW/cm2 (red), and a high-mRuby-expression population induced by AM 25μW/cm2 (yellow). The dark control was measured in cells kept in the dark. Each sample contains 10,000–50,000 cells.
-
Figure 3—source data 1
Source data for Figure 3.
- https://cdn.elifesciences.org/articles/65654/elife-65654-fig3-data1-v2.xlsx
Figure 3—figure supplement 1
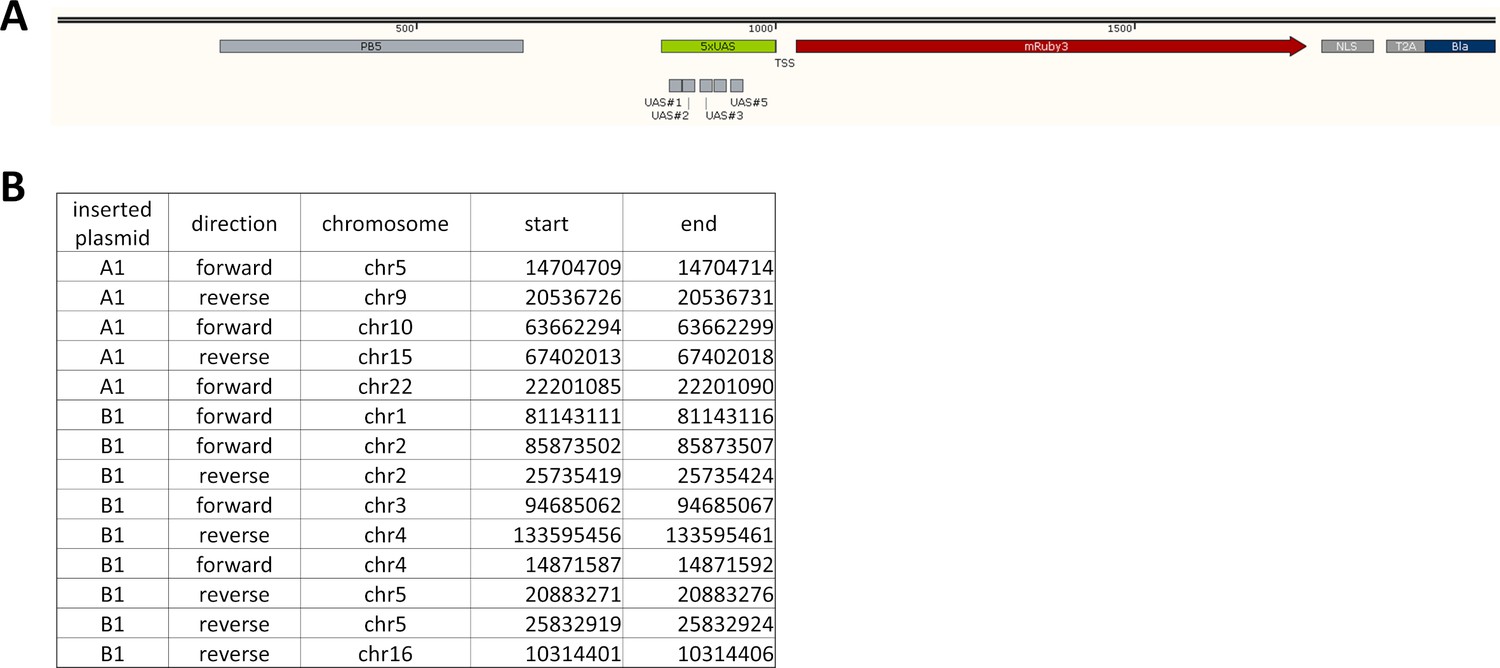
Insertion sites for LightOn cassettes.
(A) Part of the inserted sections of the LightOn cassette (plasmid B1), with the transcription start site (TSS) aligned at 1000 bp. The inserted sequences are between PB5 and PB3 (not shown in the diagram). (B) The insertion sites for plasmids A1 and B1 in HeLa-AB1 cells, based on 50X whole genome sequencing and PCR/Sanger sequencing confirmation.
Figure 3—figure supplement 2
Emulation of combinations of ‘high’ states at multiple sites.
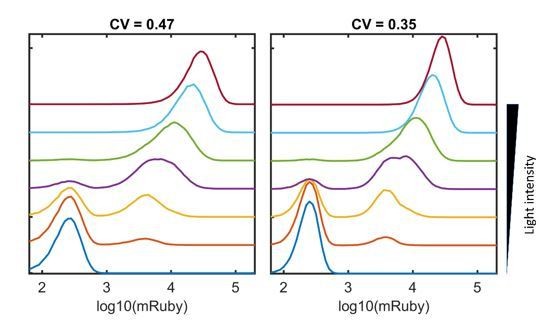
Emulated combinations of ‘high’ states at nine sites of 5xUAS-mRuby insertion at incremental light intensities. The emulated combinations were generated using the following steps: (1) we assume that the means and distributions of mRuby expression are identical for each site for the sake of simplification; (2) the mRuby distribution of the ‘high’ state of a single site was mimicked with the mRuby distribution with lowest CV (0.47) and 1/9th of the highest mean expression (300,000); (3) the mRuby distribution of the ‘low’ state of a single site was mimicked with the mRuby distribution of the dark control; (4) each of the inserted sites was randomly designated as ‘high’ or ‘low’ state for 100,000 cells, with the probabilities correlated with light intensities; (5) the combined mRuby distribution was emulated by random sampling of the ‘high’ or ‘low’ states of nine sites for 100,000 cells per light intensity. Cells that were between the ‘high’ and ‘low’ states were not considered in this emulation.
-
Figure 3—figure supplement 2—source data 1
Source data for Figure 3—figure supplement 2.
- https://cdn.elifesciences.org/articles/65654/elife-65654-fig3-figsupp2-data1-v2.xlsx
Figure 4
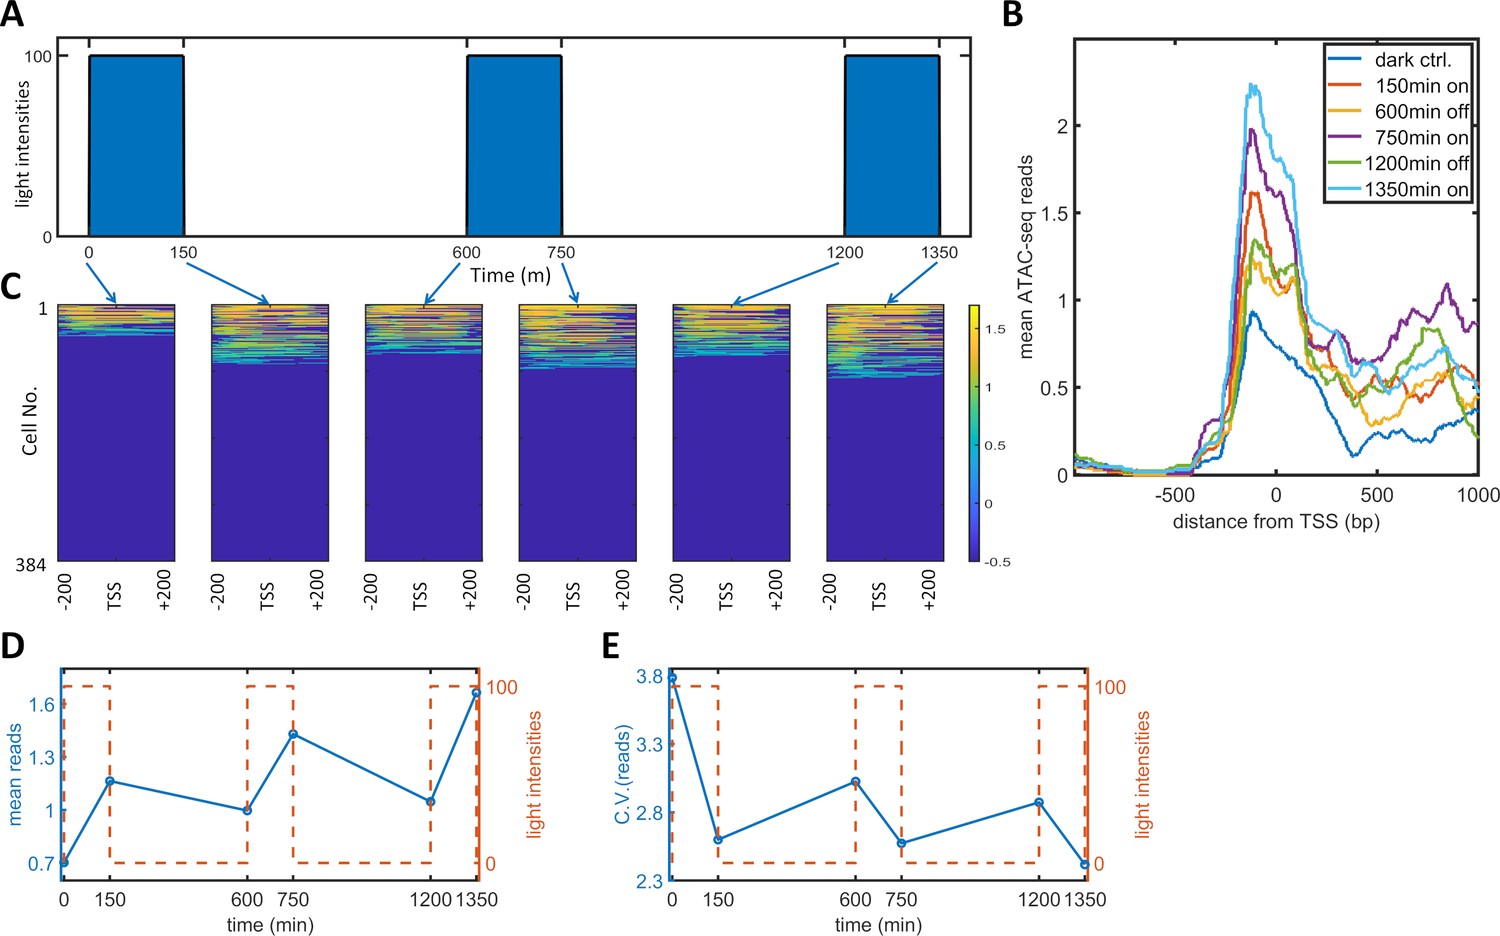
Single-cell ATAC-seq analysis of dynamic noise reductions for HeLa-AB1 cells with PWM.
(A) A dynamic PWM induction program was used to generate cells for single-cell ATAC-seq. As indicated with blue arrows, six cell populations were collected: first at dark control (0 min), and then after one light-on cycle (150 min), after one light-on-off cycle (600 min), after one light-on-off cycle and one light-on cycle (750 min), after two light-on-off cycles (1200 min), and after two light-on-off cycles and one light-on cycle (1350 min). (B) The average number of ATAC-seq reads from a single cell plotted against distance from the transcription start site (TSS) of the 5xUAS promoter for the six populations. (C) Heatmap plots of single-cell ATAC-seq reads from −200 to 200 bp around the TSS of the 5xUAS promoter. Reads are displayed in common logarithms. The counts were added to 0.1 before the logarithm conversion. The x-axis represents the distance from the TSS. The y-axis represents the cell index. Color represents the common logarithm of the reads. There are 384 cells for each time point. (D–E) For each cell, a read was further defined as the average over the 400 bp sequence. The mean reads (D) and CV of reads (E) over 384 cells plotted against time. Red dashed lines represent the dynamics of the PWM light induction.
-
Figure 4—source data 1
Source data for Figure 4.
- https://cdn.elifesciences.org/articles/65654/elife-65654-fig4-data1-v2.xlsx
Figure 5 with 2 supplements
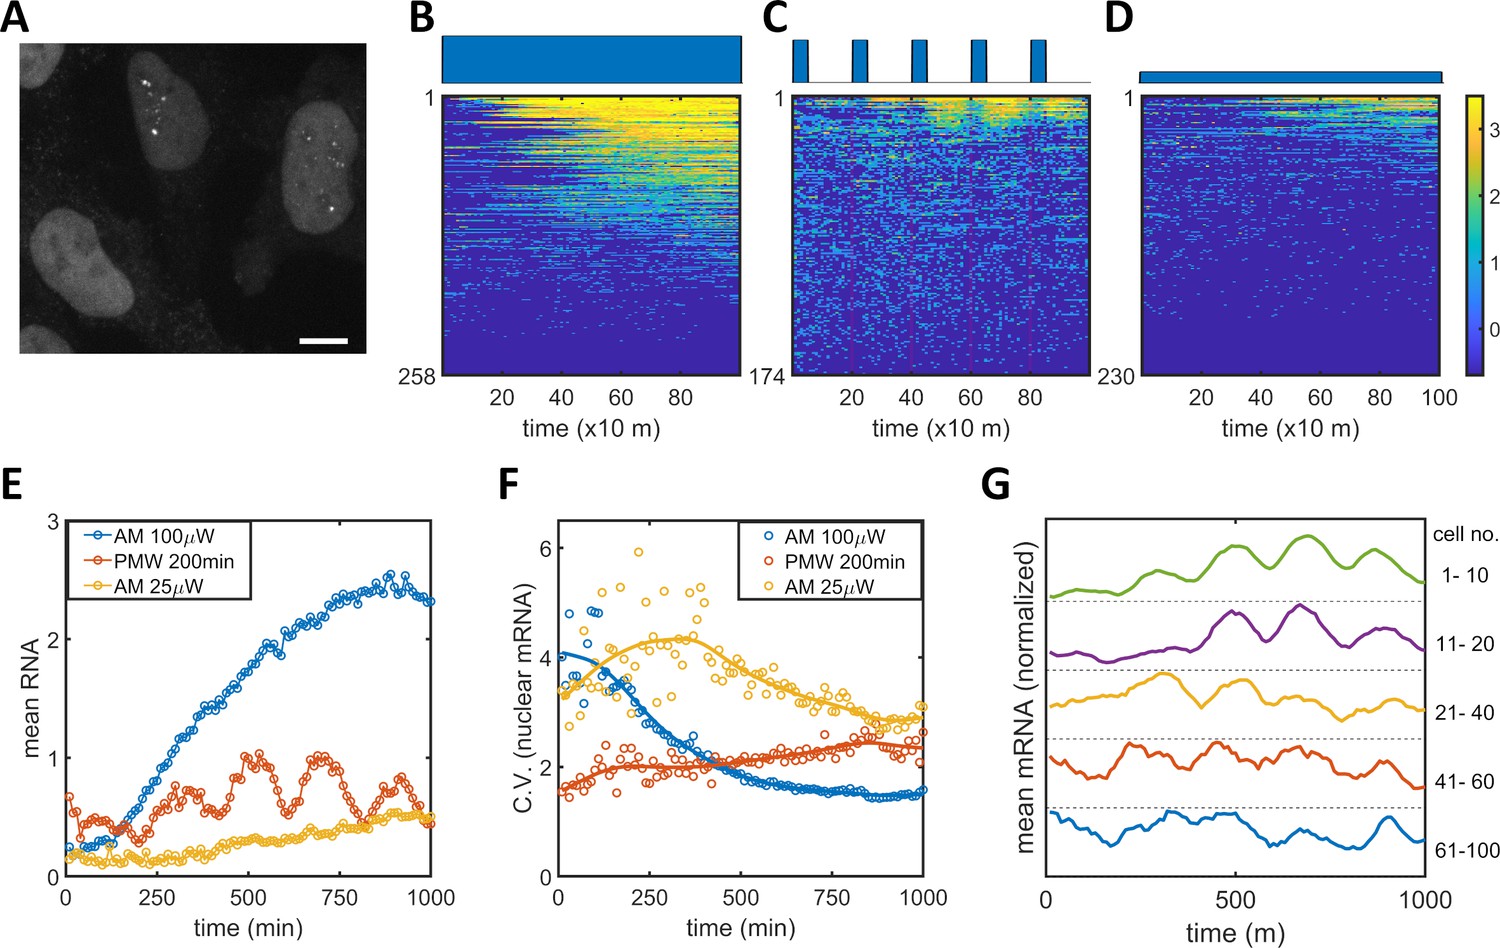
Single mRNA live-cell imaging for HeLa-ABC2 cells with AM and PWM.
(A) A representative z-projection image at a specific time. The bright shapes with diameter around 10 μm represent the nuclei. The small brighter puncta (approximately 500 nm in diameter) in the nuclei represent nuclear mRNA molecules. The darker fluorescent signals are cytosolic fluorescent signals that are neglected in this analysis. The scale bar represents 10 μm. (B–D) The single-cell mRNA counts over time are detected and shown as heatmaps for AM with 100 μW/cm2(B), for PWM with a maximum of 100 μW/cm2, on-fraction of 0.25, and a period of 200 min (C), and for AM with 25 μW/cm2 (D). The x-axis represents time with a unit of 10 min. The y-axis represents the cell index. The filled dark blue plots on top of the heatmap images represent the light induction schemes. Reads are displayed in natural logarithms. The counts were added to 0.5 before the logarithmic conversion. The percentages of cells without mRNA detection were 8%(B), 0.6%(C), and 20% (D). (E–F) The mean and CV for single-cell nuclear mRNA counts plotted against time for AM with 100 μW/cm2 (blue), PWM with a period of 200 min and an on-fraction of 0.25 (red), and AM with 25 μW/cm2 (yellow). (G) The means of single-cell mRNA counts for the PWM experiments in (C) over five subpopulations as indicated at the right of the plot. Each plot was normalized to its maximum. For each cell, a moving average of 60 min was applied before computing the average over subpopulations.
-
Figure 5—source data 1
Source data for Figure 5.
- https://cdn.elifesciences.org/articles/65654/elife-65654-fig5-data1-v2.xlsx
Figure 5—figure supplement 1
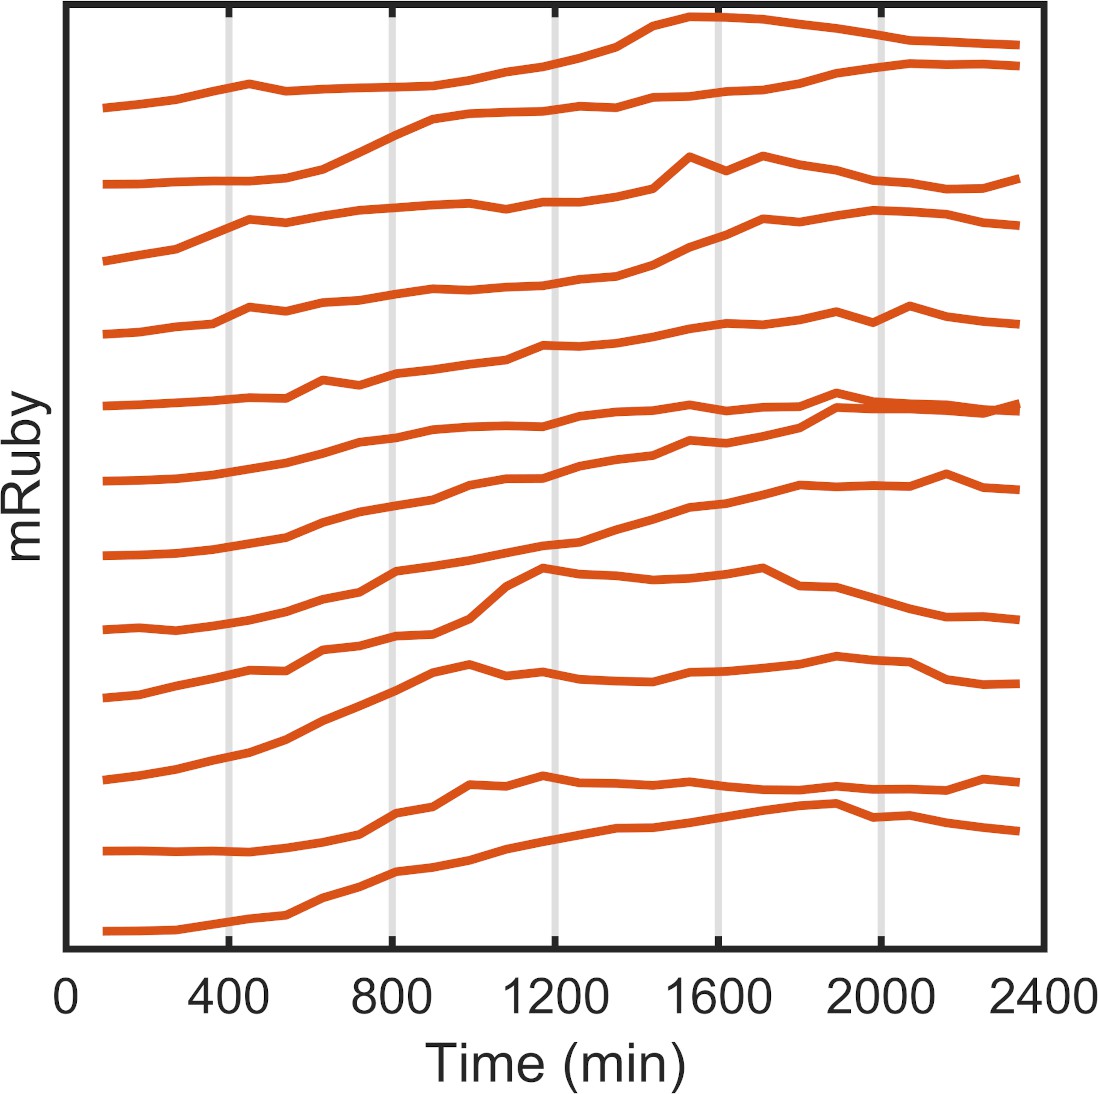
Single-cell mRuby dynamics with PWM.
Tracking and quantification of the single-cell dynamics of the mRuby expression of representative cells plotted on a linear scale. The HeLa-A1B1 cells were under PWM with 100 μW/cm2 maximum intensity, and a duty cycle of 25% and period of 400 min, normalized to cell-cycle stages as shown in Figure 2—figure supplement 3 .
-
Figure 5—figure supplement 1—source data 1
Source data for Figure 5—figure supplement 1.
- https://cdn.elifesciences.org/articles/65654/elife-65654-fig5-figsupp1-data1-v2.xlsx
Figure 5—figure supplement 2
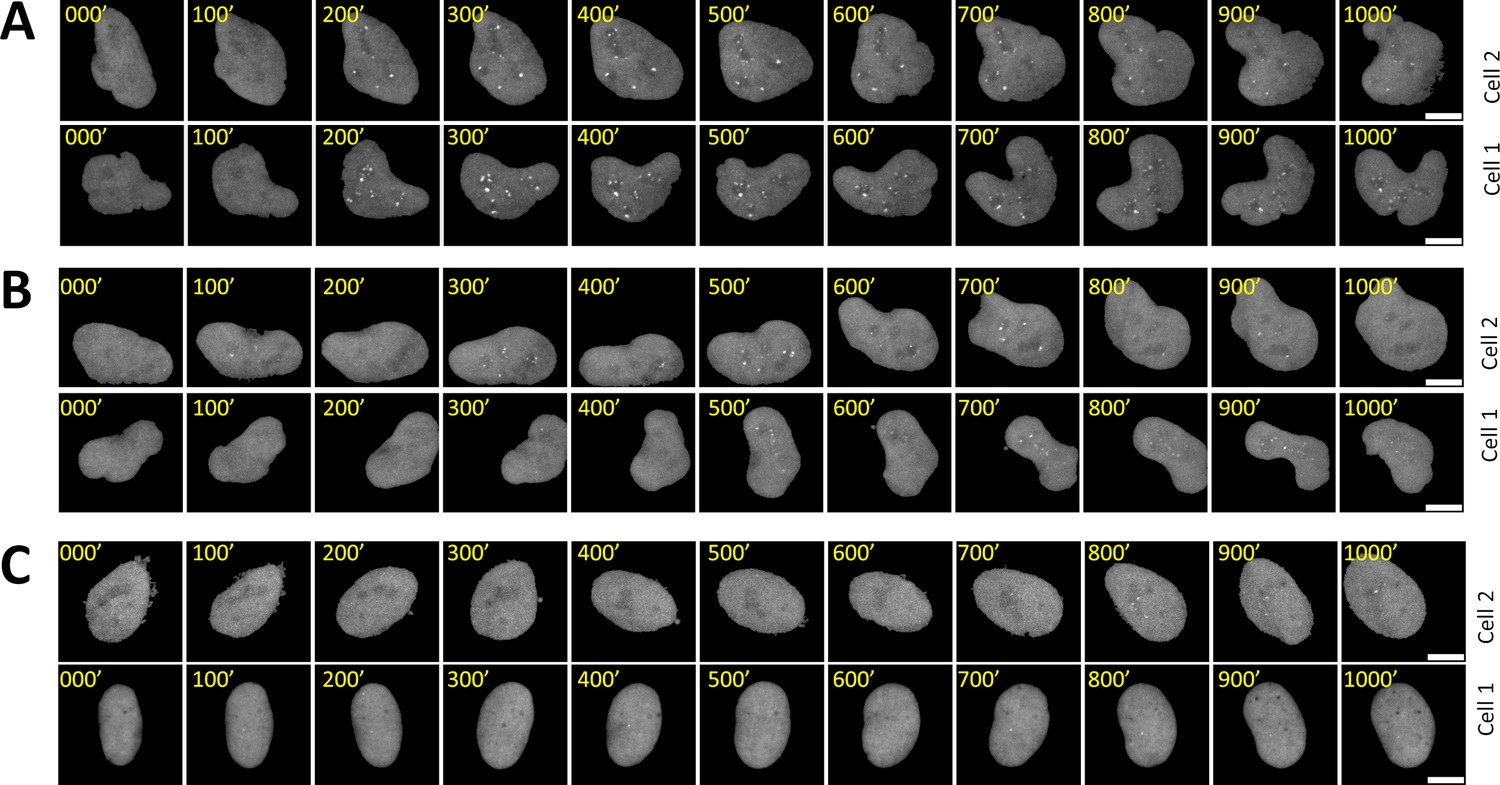
Time-lapse images of representative nuclei.
(A–C) z-projection images of two representative cell nuclei over 1000 min each are displayed for AM with 100 μW/cm2(A), PWM with 100 μW/cm2 and a period of 200 min (B), and AM with 25 μW/cm2(C). The nucleus was segmented, tracked, isolated, and re-centered as described in the Materials and methods section. The scale bars represent 10 μm.
Figure 6 with 1 supplement
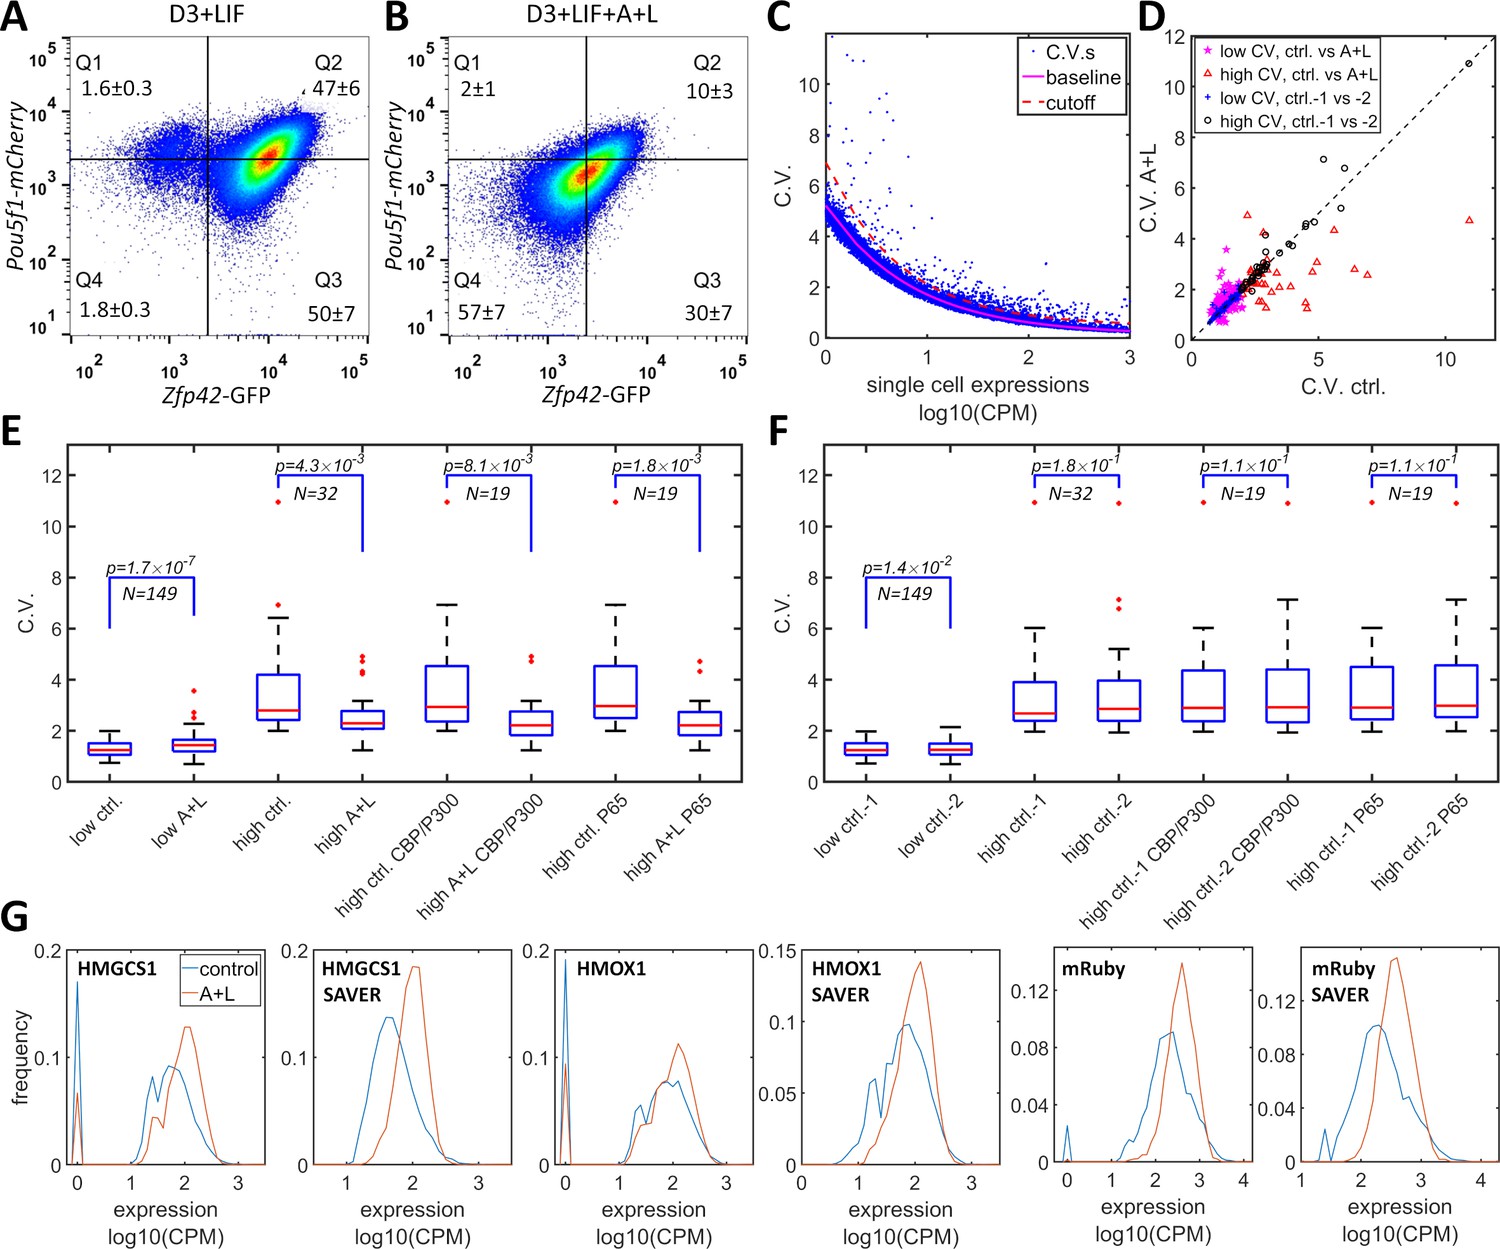
Simultaneous inhibition of CBP/p300 and HDAC4/5 reduces heterogeneity in endogenous gene expression in mES D3 and HeLa cells.
(A, B) The density plots of Oct4-mCherry versus Rex1-GFP for a mouse ES D3 double knock-in cell line in regular mESC medium (A) or with the addition of 0.5 μM LMK-235 and 1 μM A-485 for two days (B). The mean +s.d. for the percentages of cells in Q1–Q4 were calculated from three (A) and six (B) biological repeats. (C) CV versus mean expression plot with scRNA-seq data from HeLa cells with or without 0.333 μM LMK and 1 μM A-485. The solid magenta line represents the fitted power function for all of the genes, which has an exponent of −0.48. The red dashed line represents the 3-sigma cutoff for noisy outlier genes. (D) The genes with CV versus gene expression above the cutoff (red line in C) and mean reads >5 CPM were selected for a plot comparing CV between HeLa cells with A485 +LMK-235 and control cells. Magenta stars and red triangles represent genes with low (<2.0) and high CV (≥2.0), respectively. Blue asterisks and black circles represent the CVs of the same gene sets from two biological replicates of control cells. (E) Statistical analysis of the CV of genes in cells treated with A485 +LMK-235 and in controls, comparing groups of genes with low CV, high CV, high CV, and positive for CBP/p300 or p65 ChIP. The boxes show the lower and upper quartiles; the whiskers show the minimum and maximal values excluding outliers; the line inside the box indicates the median; outliers (red dots) were calculated as values greater or lower than 1.5 times the interquartile range. The p-values shown in the figure were calculated using paired student t-tests. (F) Similar statistical analysis of CV between two biological control replicates for the same sets of genes. (G) Expression distributionof HMGCS1, HMOX1 and exogenous mRuby genes in control (blue) and A485 + LMK-235 groups (red), calculated from normalized data without or with the SAVER denoising algorithm. The peaks at ‘0’ in the plots represent cells with zero reads.
-
Figure 6—source data 1
Source data for Figure 6.
- https://cdn.elifesciences.org/articles/65654/elife-65654-fig6-data1-v2.xlsx
Figure 6—figure supplement 1
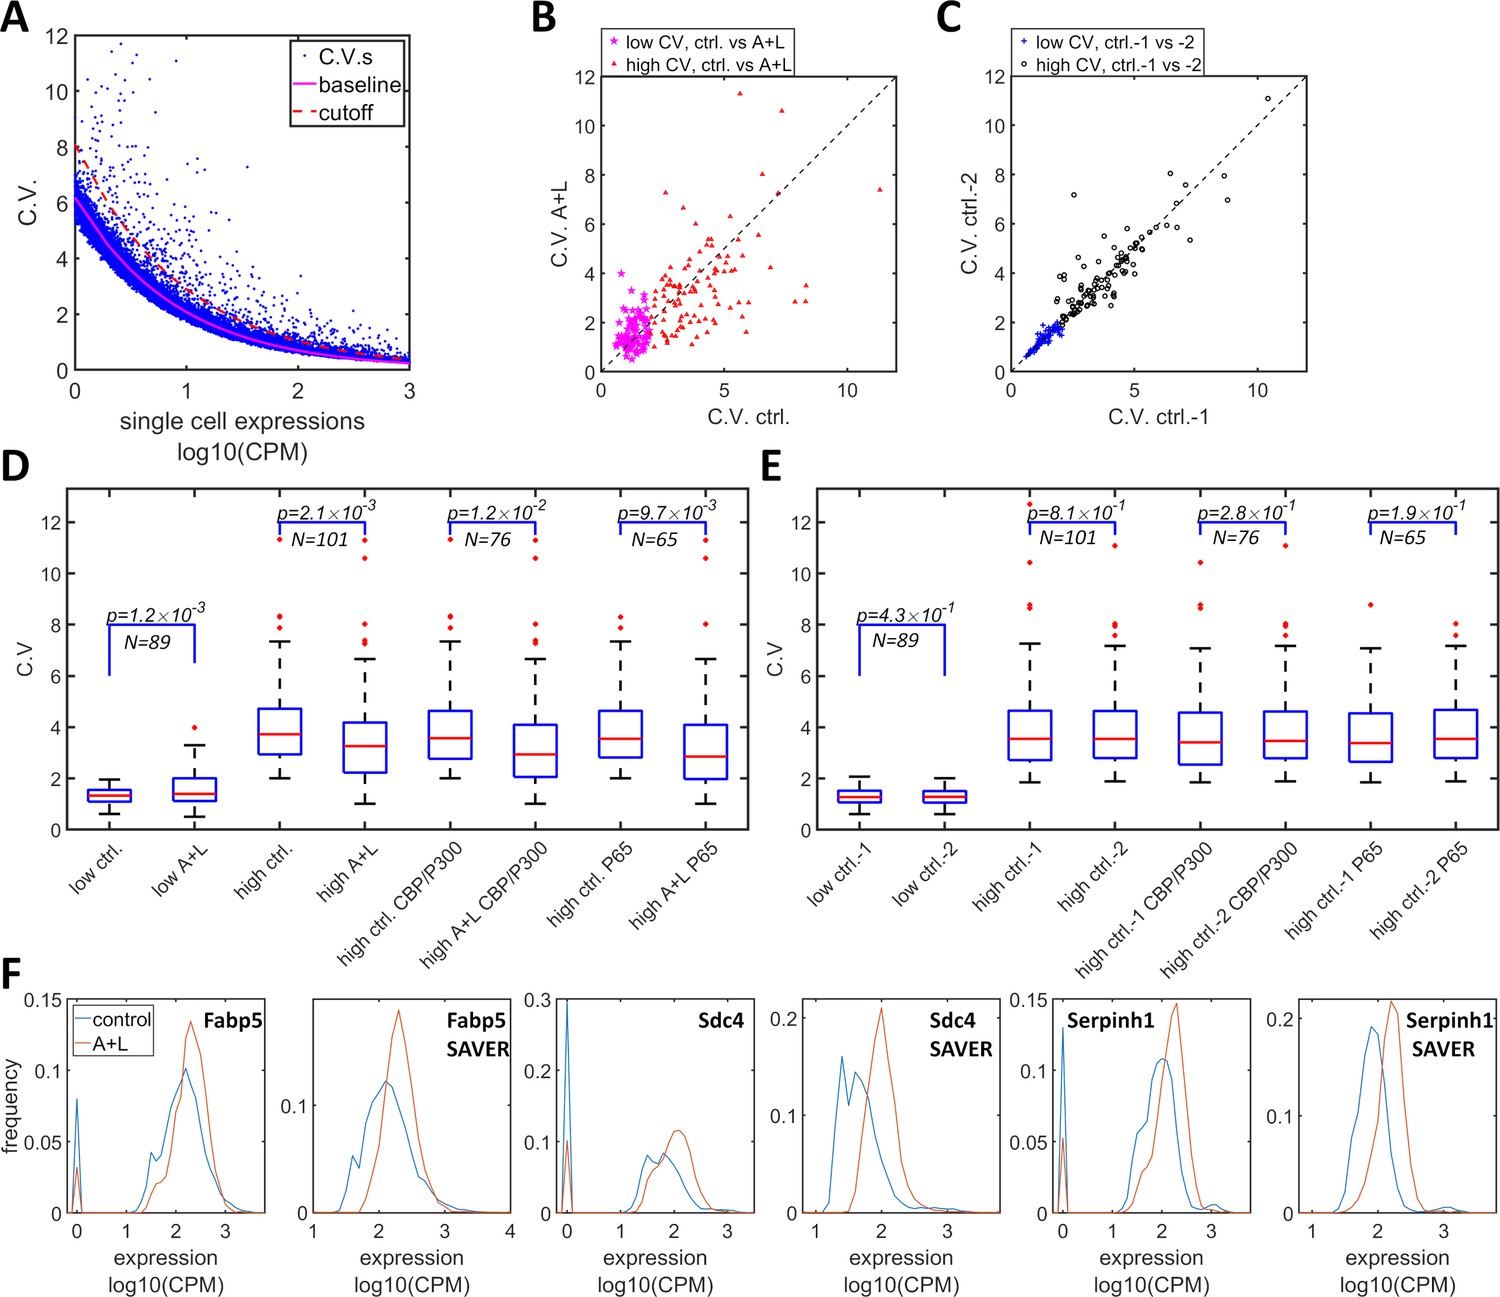
Simultaneous inhibition of CBP/p300 and HDAC4/5 reduces heterogeneity in endogenous gene expression in F9 cells.
(A) CV versus mean expressions plot of scRNA-seq data from F9 cells cultured with or without 1 μM LMK and 1 μM A-485. The solid magenta line represents the fitted power function for all of the genes, which has an exponent of −0.47. The red dashed line represents the 3-sigma cutoff for noisy outlier genes. (B) The genes with CV versus gene expression above the cutoff (red line in C) and mean reads >5 CPM were selected, and their CV was plotted for F9 cells grown with A485 + LMK-235 and for the control condition. Magenta stars and red triangles represent the genes with low (<2.0) and high CV (≥2.0), respectively. (C) Blue asterisks and black circles represent the CVs of the same gene sets from two biological replicates of control cells. (D) Statistical analysis of the CV of genes comparing A485 +LMK-235 and control, with genes sorted into the following groups: low CV, high CV, high CV, and positive for CBP/p300 or p65 ChIP. The boxes show the lower and upper quartiles; the whiskers show the minimum and maximal values excluding outliers; the line inside the box indicates the median; outliers (red dots) were calculated as values greater or lower than 1.5 times the interquartile range. The p-values shown in the figure were calculated using paired student t-tests. (E) Similar statistical analysis of CV for the same sets of genes comparing two biological control replicates. (F) Expression distribution of the Fabp5, Sdc4 and Serphinh1 genes in control (blue) and A485 + LMK-235 cells (red), calculated from normalized data without or with the SAVER denoising algorithm. The peaks at ‘0’ in the plots represent cells with zero reads.
-
Figure 6—figure supplement 1—source data 1
Source data for Figure 6—figure supplement 1.
- https://cdn.elifesciences.org/articles/65654/elife-65654-fig6-figsupp1-data1-v2.xlsx
Appendix 1—figure 1
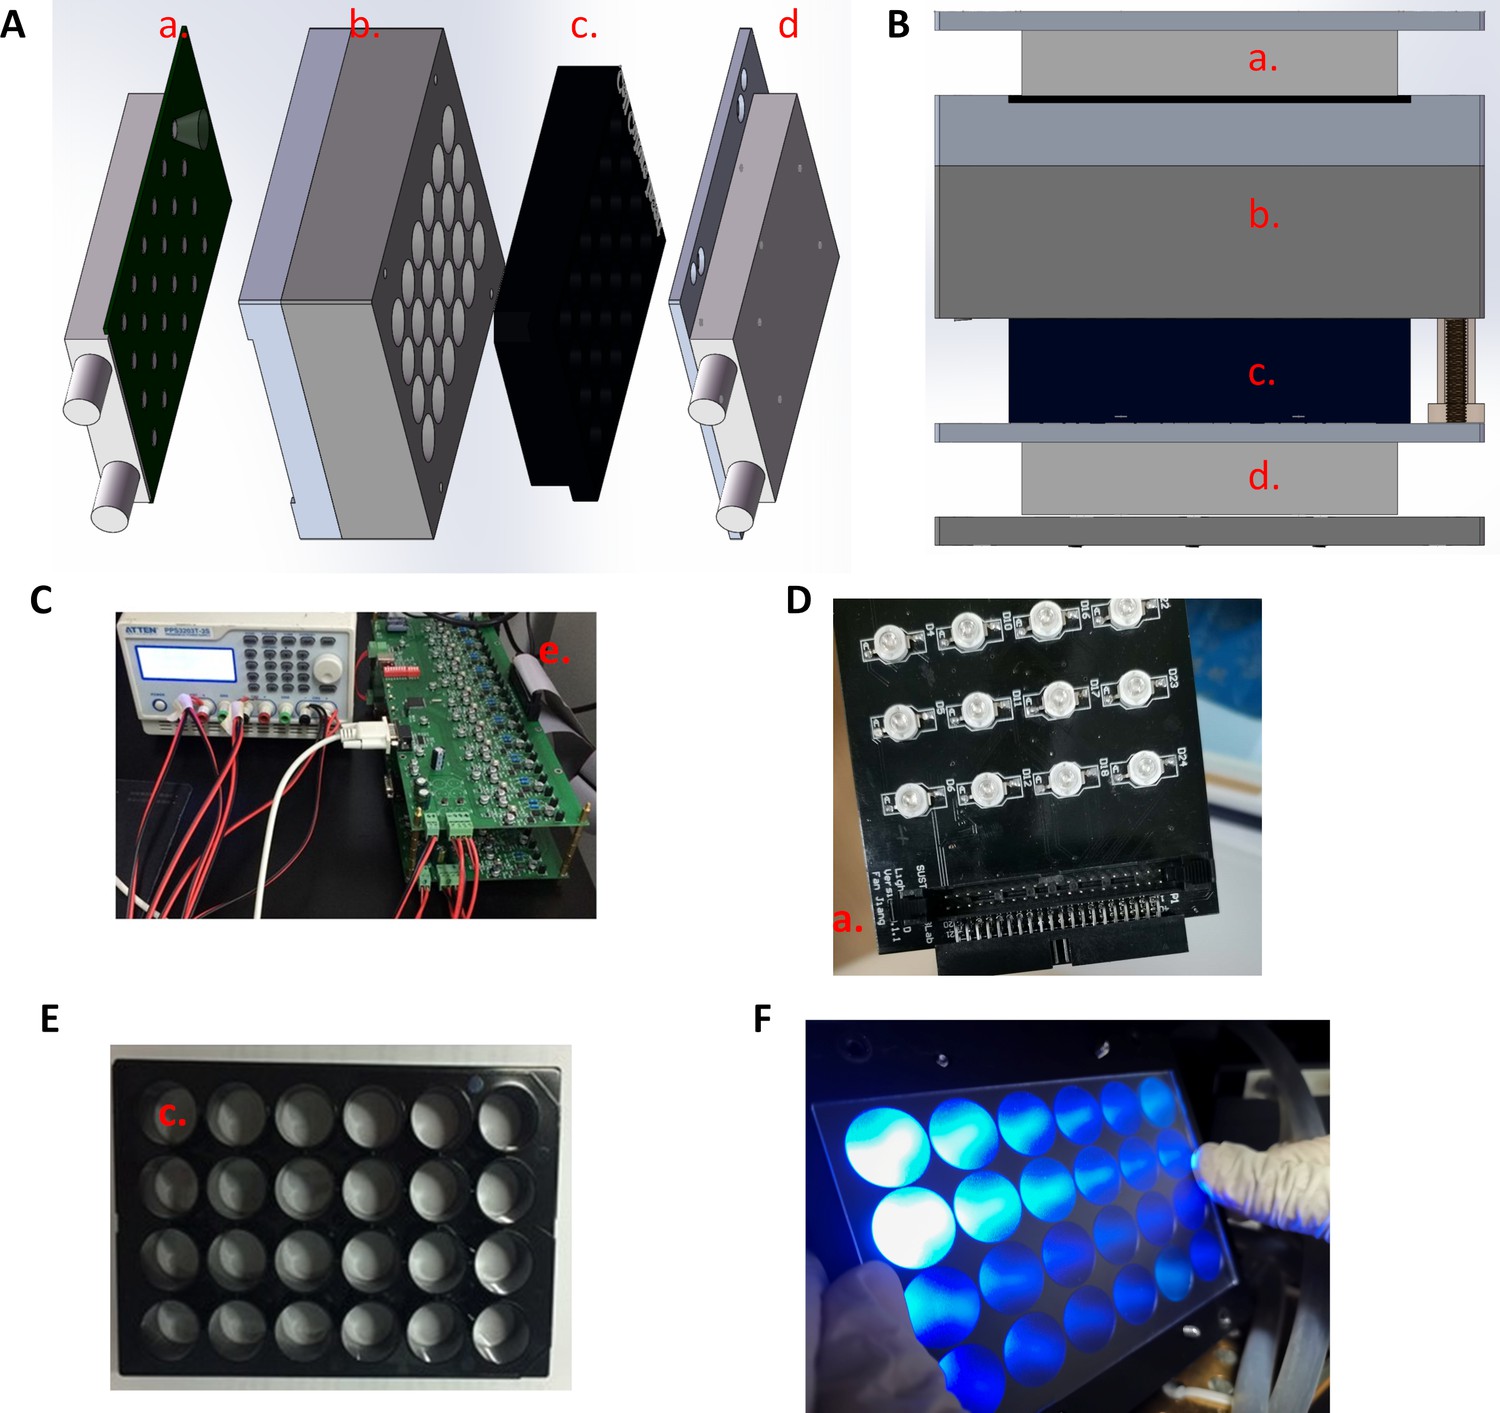
The design and construction of a 24-channel light illumination apparatus.
(A) The assembly includes (a) a 24-channel blue LED board with lens and top water-cooling plate, (b) a matching 24-channel light guide plate to prevent cross-interferences between wells, (c) the ibidi 24-well μ-plate, and (d) a bottom water-cooling plate. (B) View of a fully assembled illumination apparatus. (C) The 24-channel programable constant current board and connected power supply. (D) The 24-channel blue LED board. (E) The ibidi 24-well μ-plate. (F) The 24-channel blue lights were visualized with a frosted glass plate.
Appendix 1—figure 2
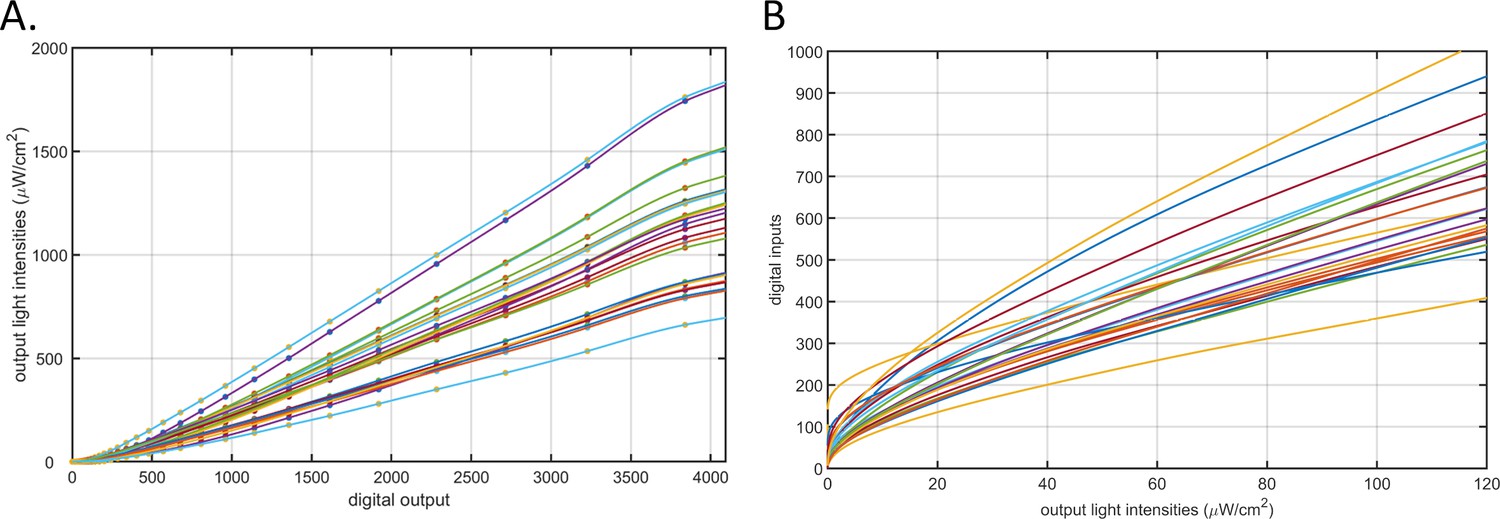
Calibration of the 24-channel light illumination apparatus.
(A) Light intensity – digital input curves for the 24-channel LED board. The circles represent measurements made using a laser power meter. The lines are cubic smooth spline fitted curves. Each line represents a channel. (B) The lookup curves used to find digital input values (y-axis) for target light intensities (x-axis) for any of the 24 LEDs. Each line represents a channel.
Appendix 1—figure 3
The six-channel light illumination apparatus used for live-cell imaging.
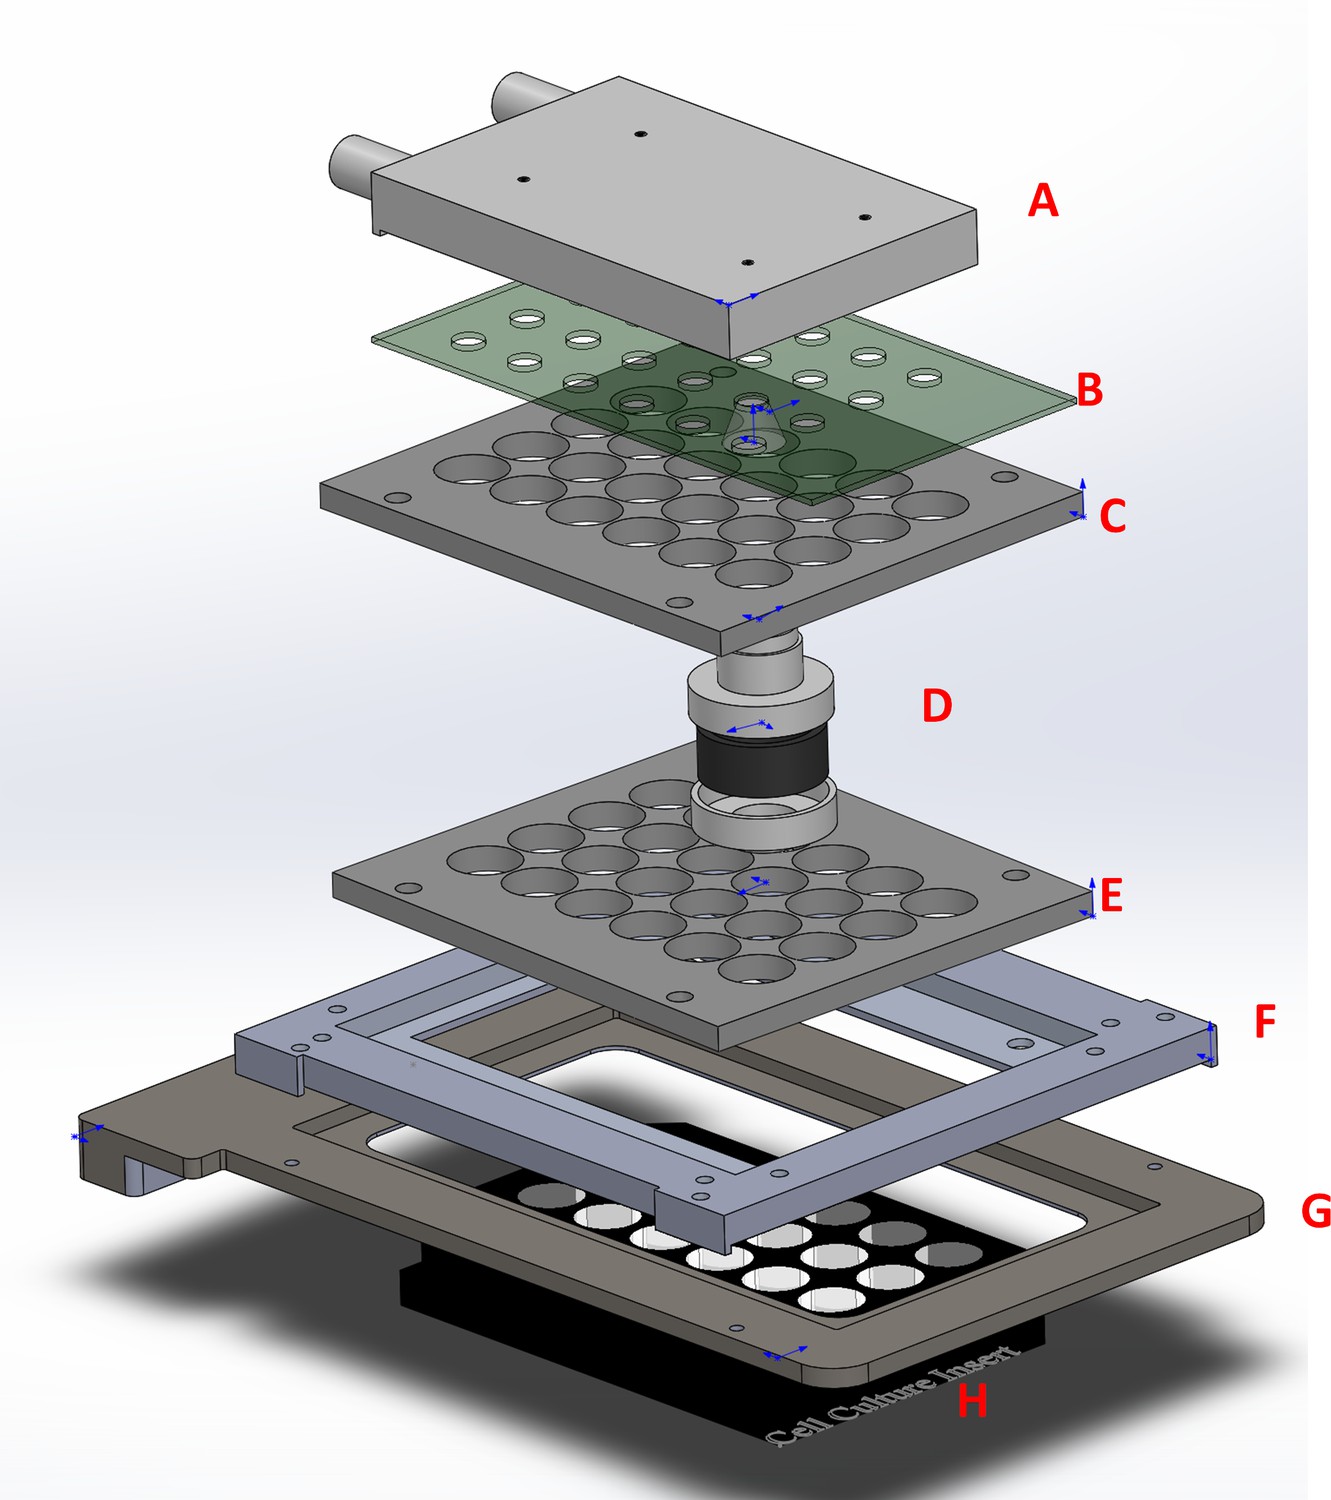
The entire assembly consists of a water-cooling block (A), a 6-channel blue LED board with projection lens (B), matching 24-channel light guide plates (C, E), six bandpass filters (465/40) with holders (D), an adapter (F) for the cover of the environment chamber (G), and an ibidi 24-well μ-plate (H).
Author response image 1
Emulation of combinations of ‘high’ states at multiple sites.
Tables
Appendix 3—key resources table
| Reagent type (species) or resource | Designation | Source or reference | Identifiers | Additional information |
|---|---|---|---|---|
| Cell line (Homo-sapiens) | HeLa | Type Culture Collection of the Chinese Academy of Sciences, Shanghai | ATCC Cat# CCL-2; RRID:CVCL_0030 | |
| Cell line (Mus musculus) | F9 | Type Culture Collection of the Chinese Academy of Sciences, Shanghai | ATCC Cat# CRL-1720; RRID:CVCL_0259 | |
| Cell line (M. musculus) | D3 | American Type Culture Collection | ATCC Cat# CRL-1934; RRID:CVCL_4378 | |
| Cell line (Homo-sapiens) | HeLa-AB1 | This paper* | See ‘Construction of cell lines’ in ‘Materials and methods’ | |
| Cell line (H.-sapiens) | HeLa-AB2 | This paper* | See ‘Construction of cell lines’ in ‘Materials and methods’ | |
| Cell line (H.-sapiens) | HeLa-ABC2 | This paper* | See ‘Construction of cell lines’ in ‘Materials and methods’ | |
| Cell line (H.-sapiens) | HeLa-A1B1B3 | This paper* | See ‘Construction of cell lines’ in ‘Materials and methods’ | |
| Cell line (H.-sapiens) | HeLa-A1B1B4 | This paper* | See ‘Construction of cell lines’ in ‘Materials and methods’ | |
| Cell line (H.-sapiens) | HeLa-A3B2 | This paper* | See ‘Construction of cell lines’ in ‘Materials and methods’ | |
| Cell line (H.-sapiens) | HeLa-A4B5 | This paper* | See ‘Construction of cell lines’ in ‘Materials and methods’ | |
| Cell line (H.-sapiens) | HeLa-A4B6 | This paper* | See ‘onstruction of cell lines’ in ‘Materials and methods’ | |
| Cell line (M. musculus) | F9-AB2 | This paper* | See ‘onstruction of cell lines’ in ‘Materials and methods’ | |
| Cell line (M. musculus) | ES-D3 Rex1-GFP + Oct4-mCherry | This paper* | See ‘Evidence of dual-functional CBP/p300-induced heterogeneity in the regulation of endogenous genes’ in ‘Results’ | |
| Antibody | Anti-H3K9AC (rabbit, monoclonal) | Cell Signaling Technology | Cat# 9649; RRID:AB_823528 | ChIP-seq (1:50) |
| Antibody | Anti-H3K27me3 (rabbit, monoclonal) | Cell Signaling Technology | Cat#9733; RRID:AB_2616029 | ChIP-seq (1:50) |
| Antibody | Anti-H3K27AC(rabbit, polyclonal) | Abcam | Cat#ab4729; RRID:AB_2118291 | ChIP-seq (1:200) |
| Recombinant DNA reagent | GAVPO and 5xUAS promoter (plasmid) | Wang et al., 2012 | ||
| Recombinant DNA reagent | mRuby3 (plasmid) | Bajar et al., 2016 | ||
| Recombinant DNA reagent | mCardinal (plasmid) | Chu et al., 2014 | ||
| Recombinant DNA reagent | pBX-CMVO2-TetRmCherryNLS (plasmid) | Prof. Jiandong Huang, HKU | See ‘Plasmid construction’ in ‘Materials and methods’ and Figure 1—figure supplement 1 | |
| Recombinant DNA reagent | pX330 (plasmid) | Addgene | Cat# 42230; RRID:Addgene_42230 | |
| Recombinant DNA reagent | pBX-090 (plasmid) | Lu and Huang, 2014 | pGK-piggyBac-transposase | |
| Recombinant DNA reagent | pBX-083 (plasmid) | Lu and Huang, 2014 | PB5-EF1a-GFP-nuc-PB3 | |
| Recombinant DNA reagent | pBX-097 (plasmid) | Lu and Huang, 2014 | PB5-CAG-tdTomato-nuc-PB3 | |
| Recombinant DNA reagent | pBX-123 (plasmid) | Lu and Huang, 2014 | PB5-SV40-puro-2A-rtTA-HS4-pTet-EGFPnuc-PB3 | |
| Recombinant DNA reagent | Plasmid A1 (plasmid) | This paper* | See ‘Plasmid construction’ in ‘Materials and methods’ and Figure 1—figure supplement 1 | |
| Recombinant DNA reagent | Plasmid A2 (plasmid) | This paper* | See ‘Plasmid construction’ in ‘Materials and methods’ and Figure 1—figure supplement 1 | |
| Recombinant DNA reagent | Plasmid A3 (plasmid) | This paper* | See ‘Plasmid construction’ in ‘Materials and methods’ and Figure 1—figure supplement 1 | |
| Recombinant DNA reagent | Plasmid A4 (plasmid) | This paper* | See ‘Plasmid construction’ in ‘Materials and methods’ and Figure 1—figure supplement 1 | |
| Recombinant DNA reagent | Plasmid B1 (plasmid) | This paper* | See ‘Plasmid constructions’ in ‘Materials and methods’ and Figure 1—figure supplement 1 | |
| Recombinant DNA reagent | Plasmid B2 (plasmid) | This paper* | See ‘Plasmid construction’ in ‘Materials and methods’ and Figure 1—figure supplement 1 | |
| Recombinant DNA reagent | Plasmid B3 (plasmid) | This paper* | See ‘Plasmid constructions’ in ‘Materials and methods’ and Figure 1—figure supplement 1 | |
| Recombinant DNA reagent | Plasmid B4 (plasmid) | This paper* | See ‘Plasmid construction’ in ‘Materials and methods’ and Figure 1—figure supplement 1 | |
| Recombinant DNA reagent | Plasmid B5 (plasmid) | This paper* | See ‘Plasmid construction’ in ‘Materials and methods’ and Figure 1—figure supplement 1 | |
| Recombinant DNA reagent | Plasmid B6 (plasmid) | This paper* | See ‘Plasmid construction’ in ‘Materials and methods’ and Figure 1—figure supplement 1 | |
| Recombinant DNA reagent | Plasmid C2 (plasmid) | This paper* | See ‘Plasmid construction’ in ‘Materials and methods’ and Figure 1—figure supplement 1 | |
| Recombinant DNA reagent | Plasmid D1 (plasmid) | This paper* | See ‘Plasmid construction’ in ‘Materials and methods’ and Figure 1—figure supplement 1 | |
| Recombinant DNA reagent | Plasmid D2 (plasmid) | This paper* | See ‘Plasmid construction’ in ‘Materials and methods’ and Figure 1—figure supplement 1 | |
| Recombinant DNA reagent | gRNA-Rex1-Cas9 (plasmid) | This paper* | Cas9 and gRNA for targeting Rex1 | See ‘Plasmid construction’ in ‘Materials and methods’ |
| Recombinant DNA reagent | gRNA-Oct4-Cas9 (plasmid) | This paper* | Cas9 and gRNA for targeting Oct4 | See ‘Plasmid construction’ in ‘Materials and methods’ |
| Commercial assay or kit | Sphero Rainbow calibration beadssix peaks | Spherotech | Cat#RCP-60–5 | |
| Commercial assay or kit | NEXTFLEX ChIP-Seq Library Prep Kit for Illumina Sequencing | PerkinElmer | Cat#NOVA-514120 | |
| Commercial assay or kit | TB Green Premix Ex Taq II | Takara | Cat#RR820B | |
| Commercial assay or kit | PureLinkTM Genomic DNA Mini Kit | Invitrogen | Cat#K1820-01 | |
| Commercial assay or kit | TTE Mix V50 | Vazyme | Cat#TD501 | |
| Commercial assay or kit | Nextera kit | Illumina | Cat#FC-121–1030 | |
| Commercial assay or kit | Chromium Next GEM Single Cell 3' GEM, Library and Gel Bead Kit v3.1 | 10X Genomics | Cat#PN-1000128 | |
| Commercial assay or kit | Chromium Next GEM Chip G Single Cell Kit | 10X Genomics | Cat# PN-1000127 | |
| Commercial assay or kit | Single Index Kit T Set A | 10X Genomics | Cat#PN-1000213 | |
| Chemical compound, drug | Zeocin | Gibco | Cat#R25001 | |
| Chemical compound, drug | Doxycycline | Sigma | Cat#D9891 | |
| Chemical compound, drug | Puromycin | Gibco | Cat#A1113803 | |
| Chemical compound, drug | LMK-235 | SelleckChem | Cat#S7569 | |
| Chemical compound, drug | Vorinostat | SelleckChem | Cat#S1047 | |
| Chemical compound, drug | PF-06726304 | SelleckChem | Cat#S8494 | |
| Chemical compound, drug | A-485 | SelleckChem | Cat#S8740 | |
| Chemical compound, drug | CHIR99021 | Stemolecule | Cat#04–0004 | |
| Chemical compound, drug | PD0325901 | Stemolecule | Cat#04–0006 | |
| Chemical compound, drug | DMSO | Sigma | Cat# D8418 | |
| Chemical compound, drug | Digitonin | Promega | Cat#G9441 | |
| Software, algorithm | MATLAB | Mathworks | Matlab R2018b; RRID:SCR_001622 | |
| Software, algorithm | FlowJo | FlowJo | FlowJo X; RRID:SCR_008520 | |
| Software, algorithm | Scripts for sequencing data analysis | This paper* | https://github.com/QBioLab/sequence-data-analysis-for-noise-control (copy archived at swh:1:rev:c20430824c5a603eec695ee167e32e4cd1b6c024), Jiang, 2020a | |
| Software, algorithm | Live cell mRNA image processing codes | This paper* | https://github.com/QBioLab/CountmRNA.jl, (copy archived at swh:1:rev:27fa41066bf09a3c1ca00fd333f72755e481b16f); Jiang, 2020b | |
| Software, algorithm | Live cell tracking and single-cell fluorescent protein quantification | This paper* | https://github.com/QBioLab/FindYourCell.jl, (copy archived at swh:1:rev:0fee217824a5d6c2f12871477c514ef55b744b09); Jiang, 2021 | |
| Software, algorithm | Simulation and analysis codes for the ODE model | This paper* | https://github.com/QBioLab/noise-simulation, (copy archived at swh:1:rev:46301588f603073c2982a5e912afa4a3274bf207); Jiang, 2020c | |
| Other | DMEM | Corning | Cat#10–013-CV | |
| Other | Fetal bovine serum (FBS) | Gibco | Cat#10270–106 | |
| Other | ES cell FBS, US origin | Gibco | Cat#16141–079 | |
| Other | Leukemia inhibitory factor (LIF) | Millipore | Cat#ESG1107 | |
| Other | GlutaMax-I | Gibco | Cat#A12860 | |
| Other | MEM non-essential amino acid (NEAA) | Gibco | Cat#1140–050 | |
| Other | 2-Mercaptoethanol | Gibco | Cat#31350–010 | |
| Other | TrypLE Express Enzyme | Gibco | Cat#12604–021 | |
| Other | Lipofectamine 3000 | Invitrogen | Cat#L3000-015 | |
| Other | Penicillin/Streptomycin | Gibco | Cat#15140–122 | |
| Other | μ-plate 24-well plate | ibidi | Cat#82406 | |
| Other | H3K27AC Chip-seq, ATAC-seq and sc-ATAC-seq data | This paper* | European Nucleotide Archive under the accession-number PRJEB40269 | |
| Other | scRNA-seq rawdata for HeLa-AB1 and F9-AB2 cells | This paper* | European Nucleotide Archive under the accession-number PRJEB41743 |
-
*These reagents or resources in this paper can be obtained by contacting the corresponding author Dr Wei Huang (huangw@sustech.edu.cn).
Additional files
Download links
A two-part list of links to download the article, or parts of the article, in various formats.
Downloads (link to download the article as PDF)
Open citations (links to open the citations from this article in various online reference manager services)
Cite this article (links to download the citations from this article in formats compatible with various reference manager tools)
Quantitative control of noise in mammalian gene expression by dynamic histone regulation
eLife 10:e65654.
https://doi.org/10.7554/eLife.65654


