An agnostic study of associations between ABO and RhD blood group and phenome-wide disease risk
- Hematology Department, Karolinska University Hospital, Sweden
- Department of Medicine Solna, Clinical Epidemiology Division, Karolinska Institutet, Sweden
- Department of Medical Epidemiology and Biostatistics, Karolinska Institutet, Sweden
- Division of Hematology and Transfusion Medicine, Department of Laboratory Medicine, Lund University & Department of Clinical Immunology and Transfusion Medicine, Office of Medical Services, Region Skåne, Sweden
- Cardiology Department, Södersjukhuset, Sweden
Figures
Figure 1
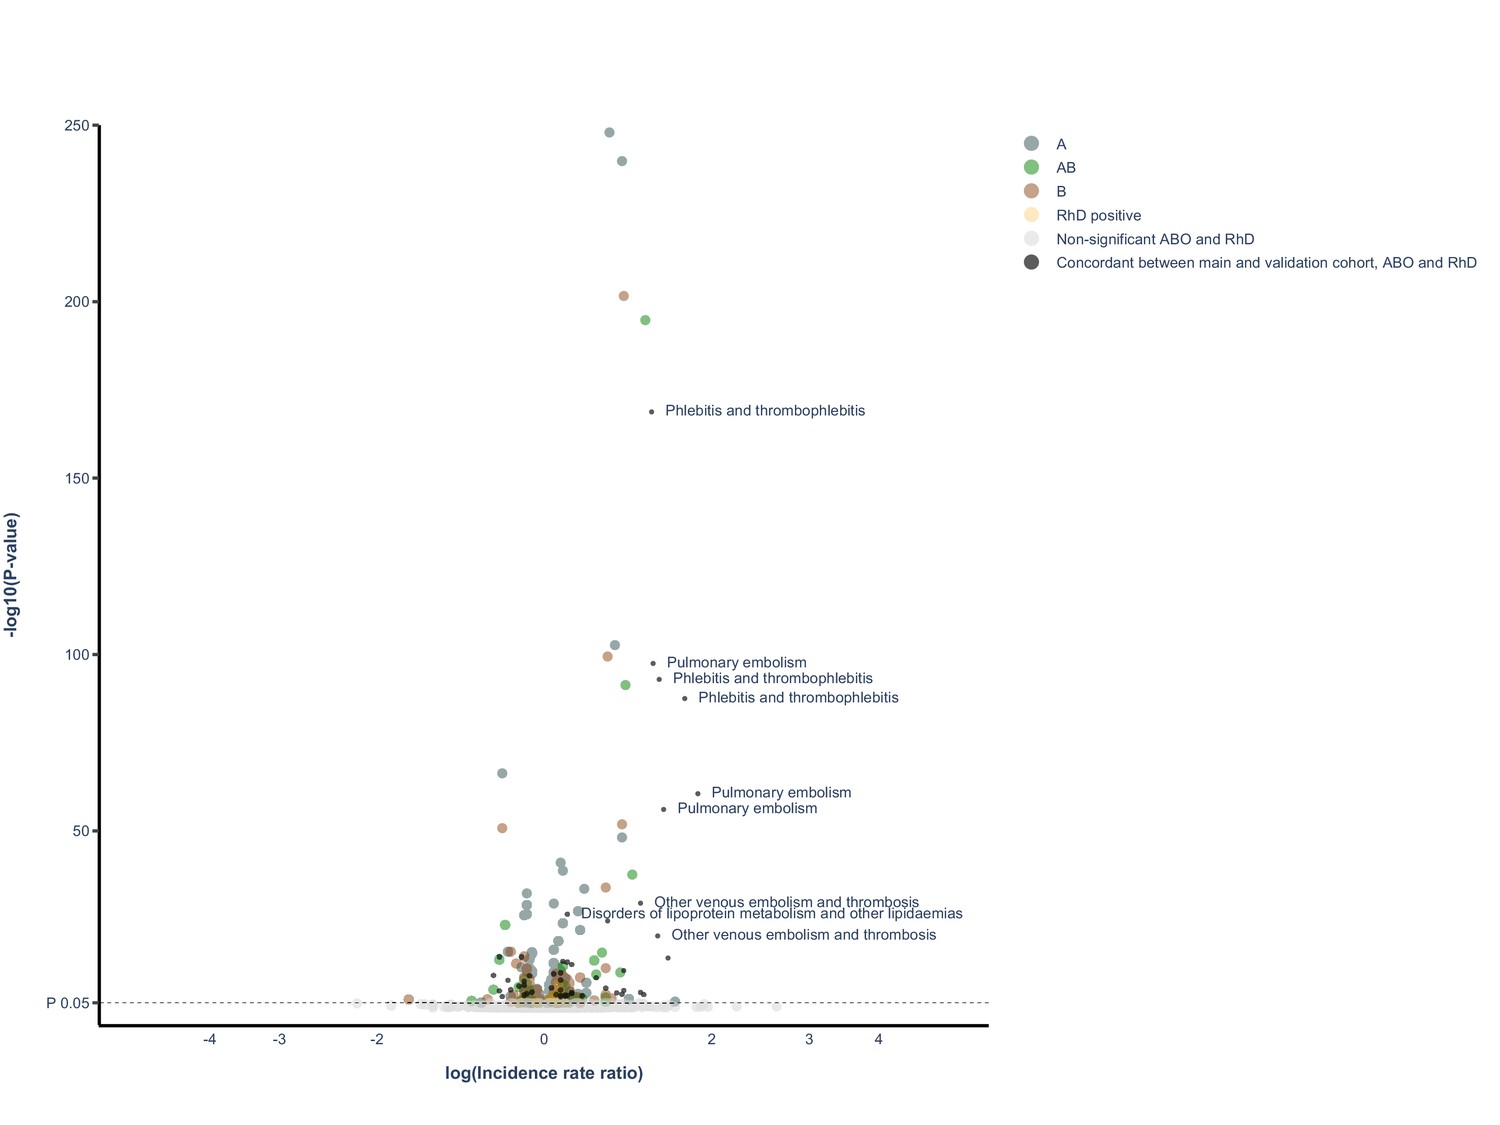
Volcano plot of all findings from main and validation cohort.
Volcano plot depicting spread of p-values of significant and non-significant ABO and RhD blood groups for main cohort and validated results (live version available as online Supplementary file 1). The labels represent the nine findings with the lowest p-value in the validation cohort.
Figure 2
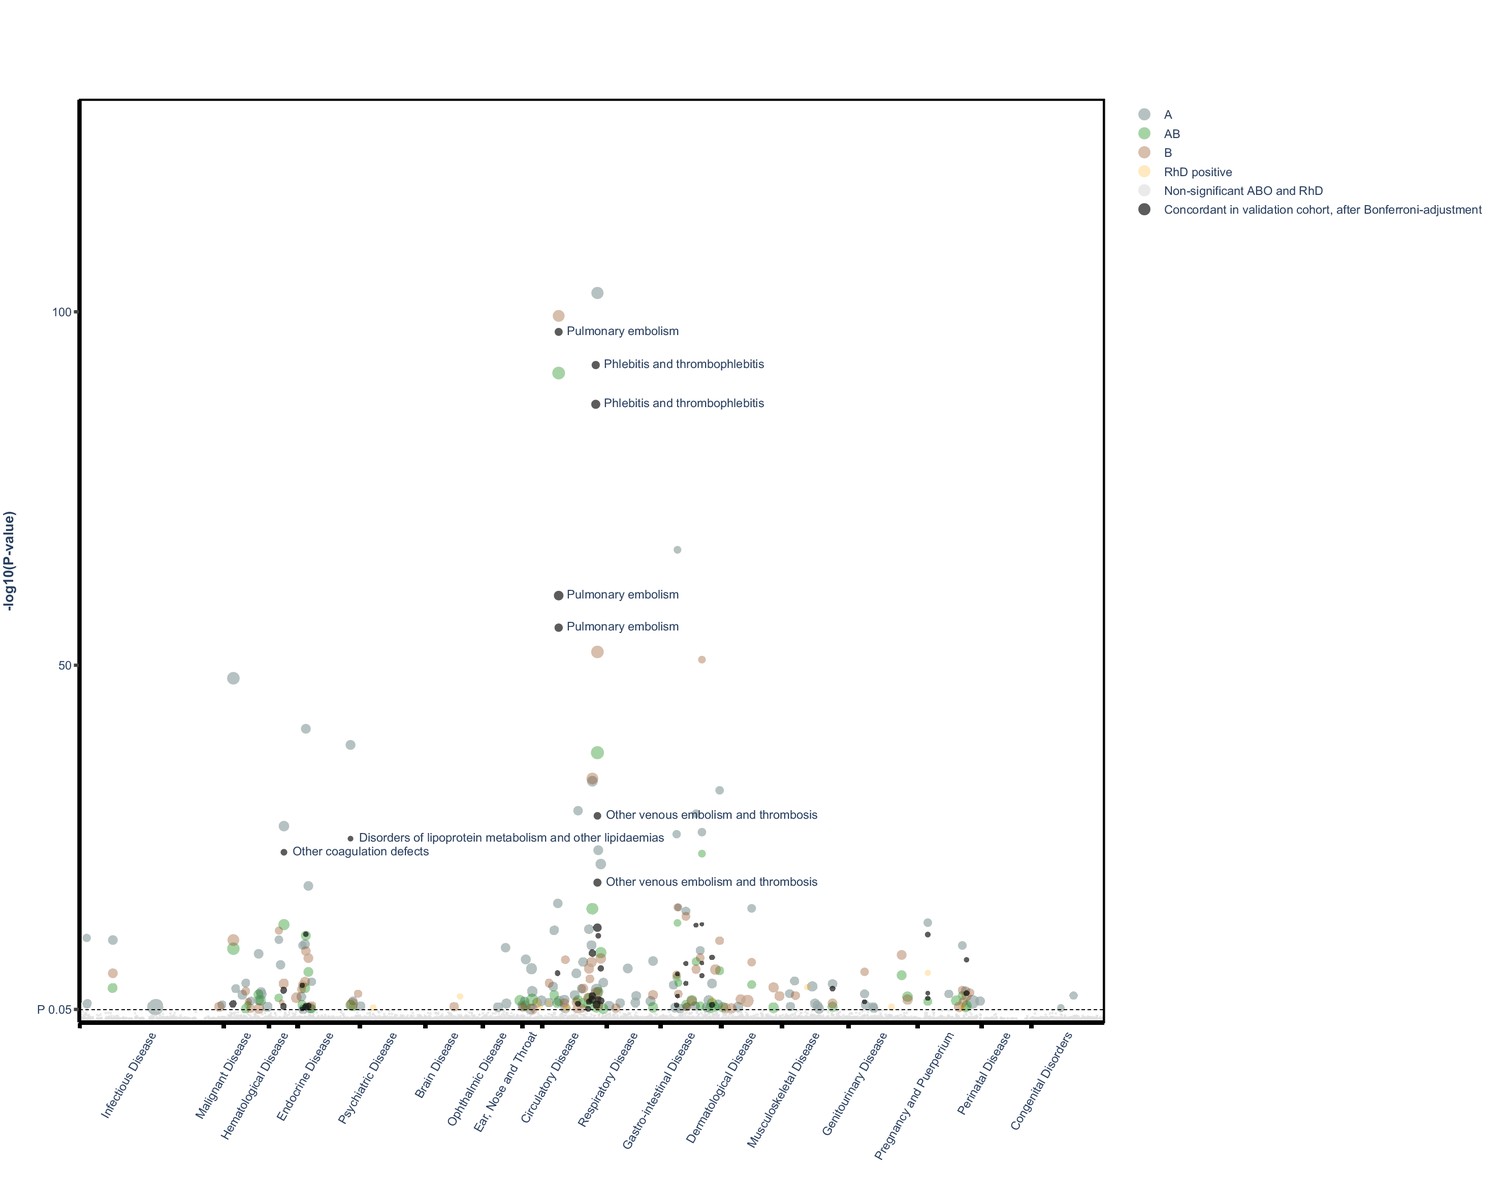
Manhattan plot of all findings from main and validation cohort mapped by ICD chapter.
Manhattan plot depicting distribution of p-values for significant and non-significant associations between ABO and RhD blood groups and available outcomes for main cohort and validated results mapped by disease chapter in ICD (live version available as online Supplementary file 2).
Figure 3
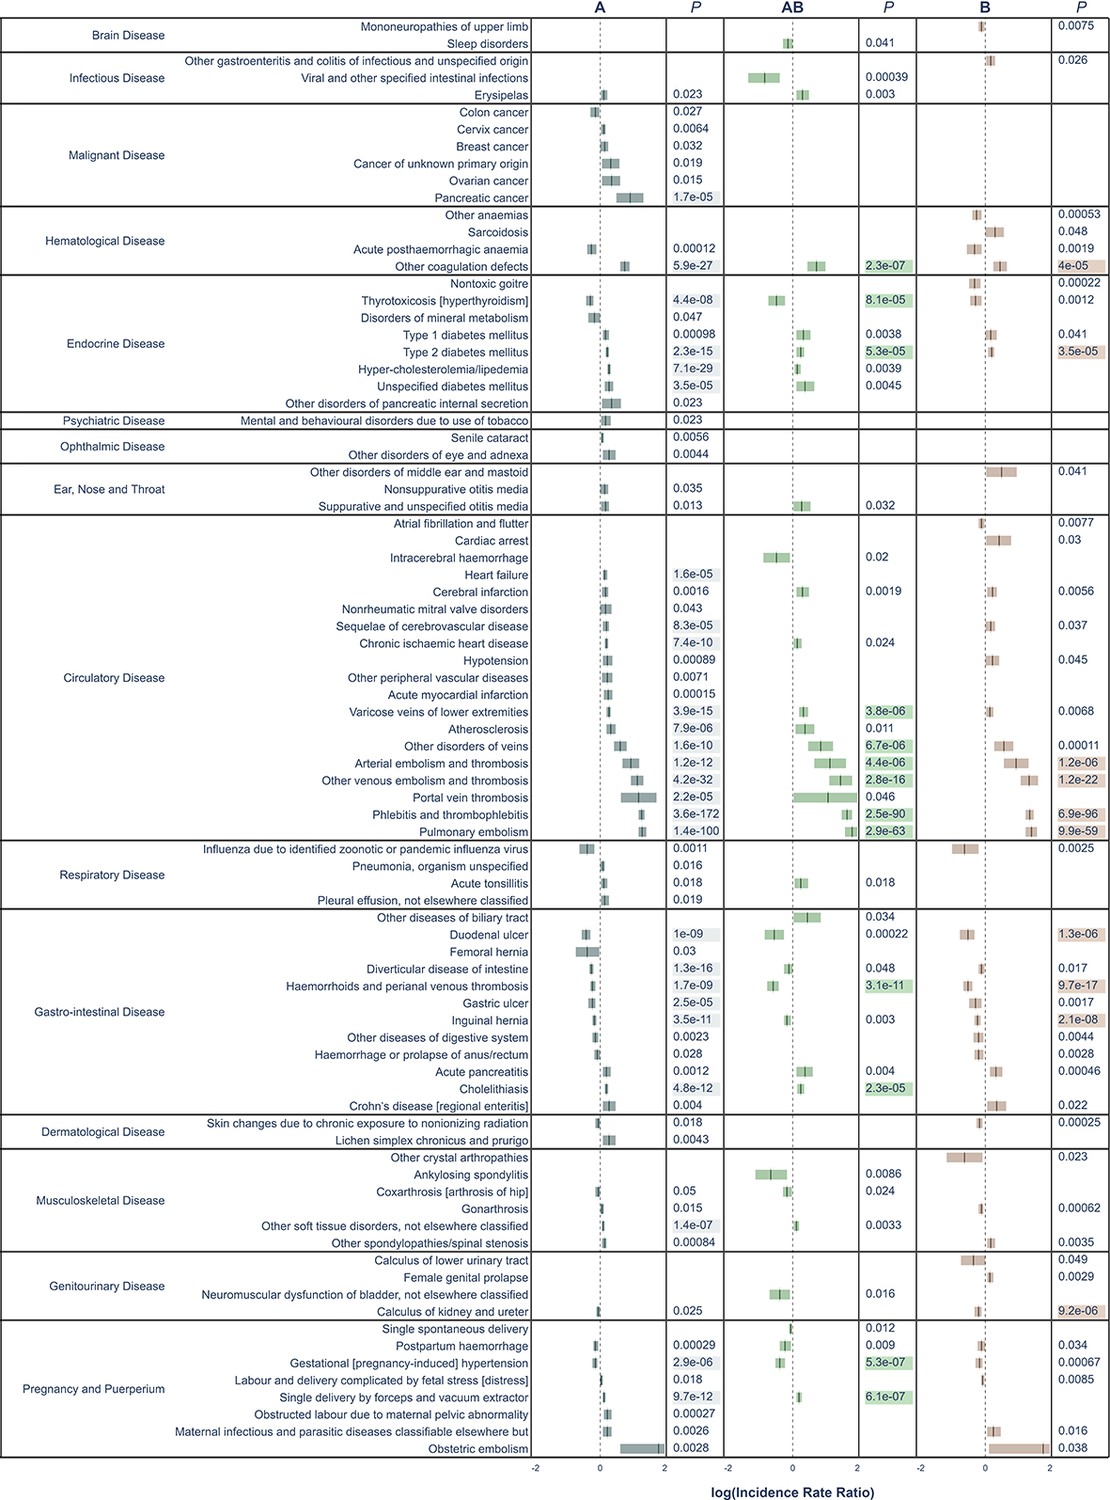
All significant un-adjusted findings from the validation cohort.
Significant disease categories in the validation cohort. Blood group as compared to blood group O and log10(IRR) displayed with 95% confidence bands. All p-values are raw, highlighted p-value indicates associations that remained statistically significant also after Bonferroni adjustment.
Author response image 1

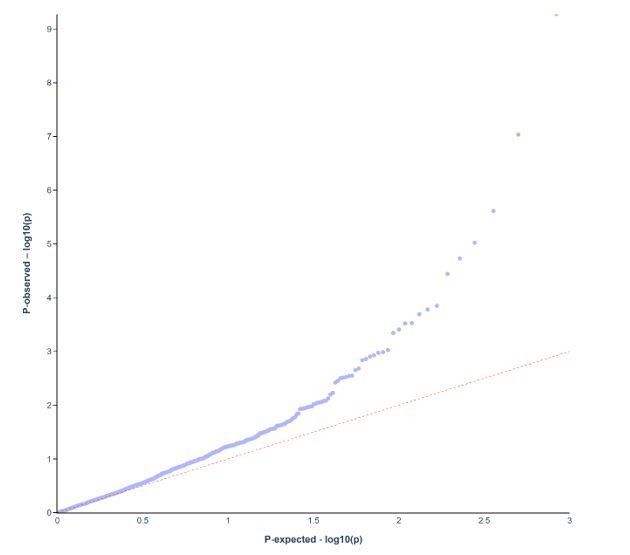
ABO blood group.
QQ plot for p-values in exploratory cohort in ABO analysis.
Author response image 2
RhD blood group.
QQ plot for p-values in exploratory cohort in RhD blood group.
Tables
Table 1
Baseline characteristics of main and validation cohort.
| Main cohort | Validation cohort | |||
|---|---|---|---|---|
| Number | 4,204,234 | 1,197,522 | ||
| Age, median (IQR) | ||||
| Age, median (IQR) | 52 | (30-71) | 30 | (23-41) |
| Year of birth, median (IQR) | 1949 | (1931–1971) | 1966 | (1953–1978) |
| Sex, % | 60 | 49 | ||
| Blood group, % | ||||
| A | 47 | 45 | ||
| AB | 5 | 5 | ||
| B | 10 | 11 | ||
| O | 38 | 39 | ||
| RhD positive, % | 84 | 82 | ||
-
IQR, interquartile range.
Table 2
Meta-summary of results.
| Main cohort | Validation cohort | ||||||||||
|---|---|---|---|---|---|---|---|---|---|---|---|
| Individuals | 4,204,234 | 1,197,522 | |||||||||
| Person-years, sum | 50 M | 22 M | |||||||||
| Events, median (IQR) | 4748 (869–23,166) | 7129 (2464–19,973) | |||||||||
| A | AB | B | ABO total | RhD positive | A | AB | B | ABO total | RhD positive | ||
| Before adjustment | 229 | 129 | 179 | 537 | 106 | 64 | 37 | 42 | 143 | 5 | |
| Positive effects, N | 150 | 79 | 107 | 336 | 61 | 47 | 23 | 22 | 92 | 3 | |
| Negative effects, N | 79 | 50 | 72 | 201 | 45 | 17 | 14 | 20 | 51 | 2 | |
| After adjustment* | 108 | 56 | 70 | 234 | 13 | 26 | 13 | 10 | 49 | 1 | |
| Positive effects, N | 66 | 38 | 36 | 140 | 10 | 19 | 10 | 6 | 35 | 1 | |
| Negative effects, N | 42 | 18 | 34 | 94 | 3 | 7 | 3 | 4 | 14 | 0 | |
| Positive IRR, median (range) | 1.05 (1.01–1.72) | 1.09 (1.03–1.52) | 1.09 (1.02–1.39) | 1.05 (1.02–1.08) | 1.1 (1.03–1.57) | 1.32 (1.07–1.89) | 1.5 (1.07–1.64) | 1.12 (1.12–1.12) | |||
| Negative IRR, median (range) | 0.95 (0.77–0.99) | 0.92 (0.74–0.97) | 0.92 (0.57–0.98) | 0.97 (0.9–0.97) | 0.92 (0.86–0.95) | 0.84 (0.81–0.87) | 0.88 (0.83–0.93) | - | |||
-
*In the main and validation cohort FDR and Bonferroni adjustment was conducted, respectively.
Additional files
-
Supplementary file 1
Interactive Volcano plot depicting spread of p-values of significance and non-significance.
ABO and RhD blood groups for main cohort and validated results. Labels are displayed on hoovering with information on blood group, disease category, p-value (FDR-adjusted and raw p-value depending on analysis, IRR with 95% confidence interval), events, and person-time.
- https://cdn.elifesciences.org/articles/65658/elife-65658-supp1-v2.zip
-
Supplementary file 2
Manhattan plot depicting distribution of p-values for significant and non-significant associations between ABO and RhD blood groups and available outcomes for main cohort and validated results mapped by disease chapter in ICD.
Labels are displayed on hoovering with information on blood group, disease category, p-value (FDR-adjusted and raw p-value depending on analysis, IRR with 95% confidence interval), events, and person-time.
- https://cdn.elifesciences.org/articles/65658/elife-65658-supp2-v2.zip
-
Supplementary file 3
Non-cancer disease categories with ICD codes and names of categories, searchable html-file.
- https://cdn.elifesciences.org/articles/65658/elife-65658-supp3-v2.zip
-
Supplementary file 4
Cancer disease categories, searchable html-file.
- https://cdn.elifesciences.org/articles/65658/elife-65658-supp4-v2.zip
-
Supplementary file 5
All significant results from ABO analysis in the main cohort after FDR adjustment, searchable html-file.
- https://cdn.elifesciences.org/articles/65658/elife-65658-supp5-v2.zip
-
Supplementary file 6
All significant results from RhD analysis in the main cohort after FDR adjustment, searchable html-file.
- https://cdn.elifesciences.org/articles/65658/elife-65658-supp6-v2.zip
-
Supplementary file 7
All findings with p-value less than 0.05 in the validation cohort in the ABO analysis, Bonferroni robust findings labeled, searchable html-file.
- https://cdn.elifesciences.org/articles/65658/elife-65658-supp7-v2.zip
-
Supplementary file 8
All findings with p-value less than 0.05 in the validation cohort in the RhD analysis, Bonferroni robust findings labeled, searchable html-file and excel-file.
- https://cdn.elifesciences.org/articles/65658/elife-65658-supp8-v2.zip
-
Transparent reporting form
- https://cdn.elifesciences.org/articles/65658/elife-65658-transrepform-v2.pdf
Download links
A two-part list of links to download the article, or parts of the article, in various formats.
Downloads (link to download the article as PDF and Executable version)
Open citations (links to open the citations from this article in various online reference manager services)
Cite this article (links to download the citations from this article in formats compatible with various reference manager tools)
An agnostic study of associations between ABO and RhD blood group and phenome-wide disease risk
eLife 10:e65658.
https://doi.org/10.7554/eLife.65658


