Distinct protocerebral neuropils associated with attractive and aversive female-produced odorants in the male moth brain
- Chemosensory lab, Department of Psychology, Norwegian University of Science and Technology, Norway
- Department of Entomology, College of Plant Protection, Henan Agricultural University, China
- State Key Laboratory for Biology of Plant Disease and Insect Pests, Institute of Plant Protection, Chinese Academy of Agricultural Sciences, China
Figures
Figure 1
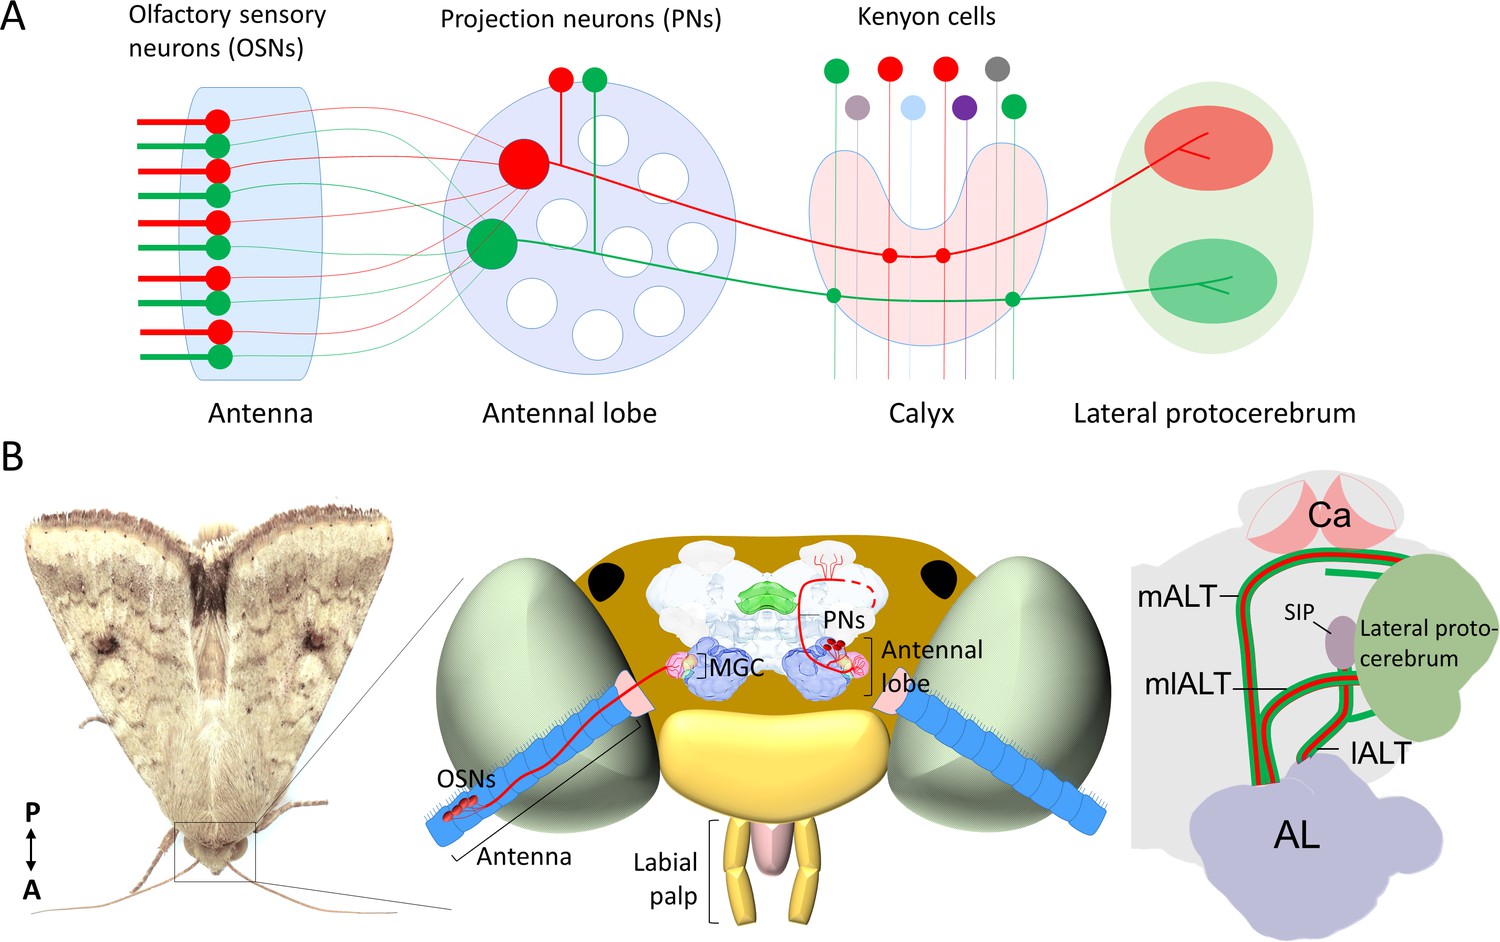
Schematic representation of the neurons in the insect olfactory system.
(A) All olfactory sensory neurons (OSNs) that express the same odorant receptor project their axons to the same antennal-lobe (AL) glomerulus. AL projection neurons (PNs) passing along the most prominent tract, the medial AL tract (mALT) have dendrites in a single glomerulus and receive direct input from one OSN class. Neurons tuned to food odors versus pheromones are portrayed in green and red, respectively. The medial-tract PNs first project to the calyces of the mushroom body (Ca), where they contact Kenyon cells. The neuron connectivity in Ca has a semi-random topographical distribution, where signals are segregated according to the nature of sensory input, for example, pheromone and general odor PNs have their terminals located at the inner and outer part of calyces, respectively (Zhao et al., 2014), but connections between the projection neurons and the Kenyon cells are random (Caron et al., 2013). Instead of encoding the identity of stimuli, the Kenyon cells process signals of positive versus negative valence into different terminal clusters (Aso et al., 2014a; Aso et al., 2014b). After innervating the Ca, the medial-tract PNs project into distinct sub-regions in the lateral protocerebrum according to the behavioral significance of the relevant odor signal. The PNs in other antennal-lobe tracts (ALTs) are not shown in this panel. (B) Schematic presentation of the olfactory system of H. armigera. Left: Portrait of a H. armigera male. Middle: Outline of the head capsule in dorsal view with the main olfactory organ (antenna) and AL along with OSNs and PNs tuned to the primary sex pheromone. The medial-tract PNs indicated here are uniglomerular neurons connecting the AL with the Ca and the lateral protocerebrum. The distinct protocerebral regions innervated by these medial-tract pheromone-sensitive PNs are undefined. Right: Schematic drawing of the main parallel ALTs: medial, mediolateral, and lateral ALT (mALT, mlALT, and lALT). Here, we followed the naming system used in Insect Brain Name Working Group et al., 2014. The mALT was previously named the inner antenno-prorocerebral tract. The mlALT, previously termed the middle antenno-protocerebral tract, is formed by multiglomerular PNs targeting the lateral protocerebrum directly. The lALT, previously named as outer antenno-protocerebral tract, is formed by both uni- and multi-glomerular PNs. In moths, some of the PNs confined to the lALT target the superior intermediate protocerebrum (SIP) and only a small part of them project into the Ca via lateral protocerebrum like the lALT PNs in honeybee/ant (Galizia and Rössler, 2010; Homberg et al., 1988; Ian et al., 2016).
Figure 2 with 2 supplements
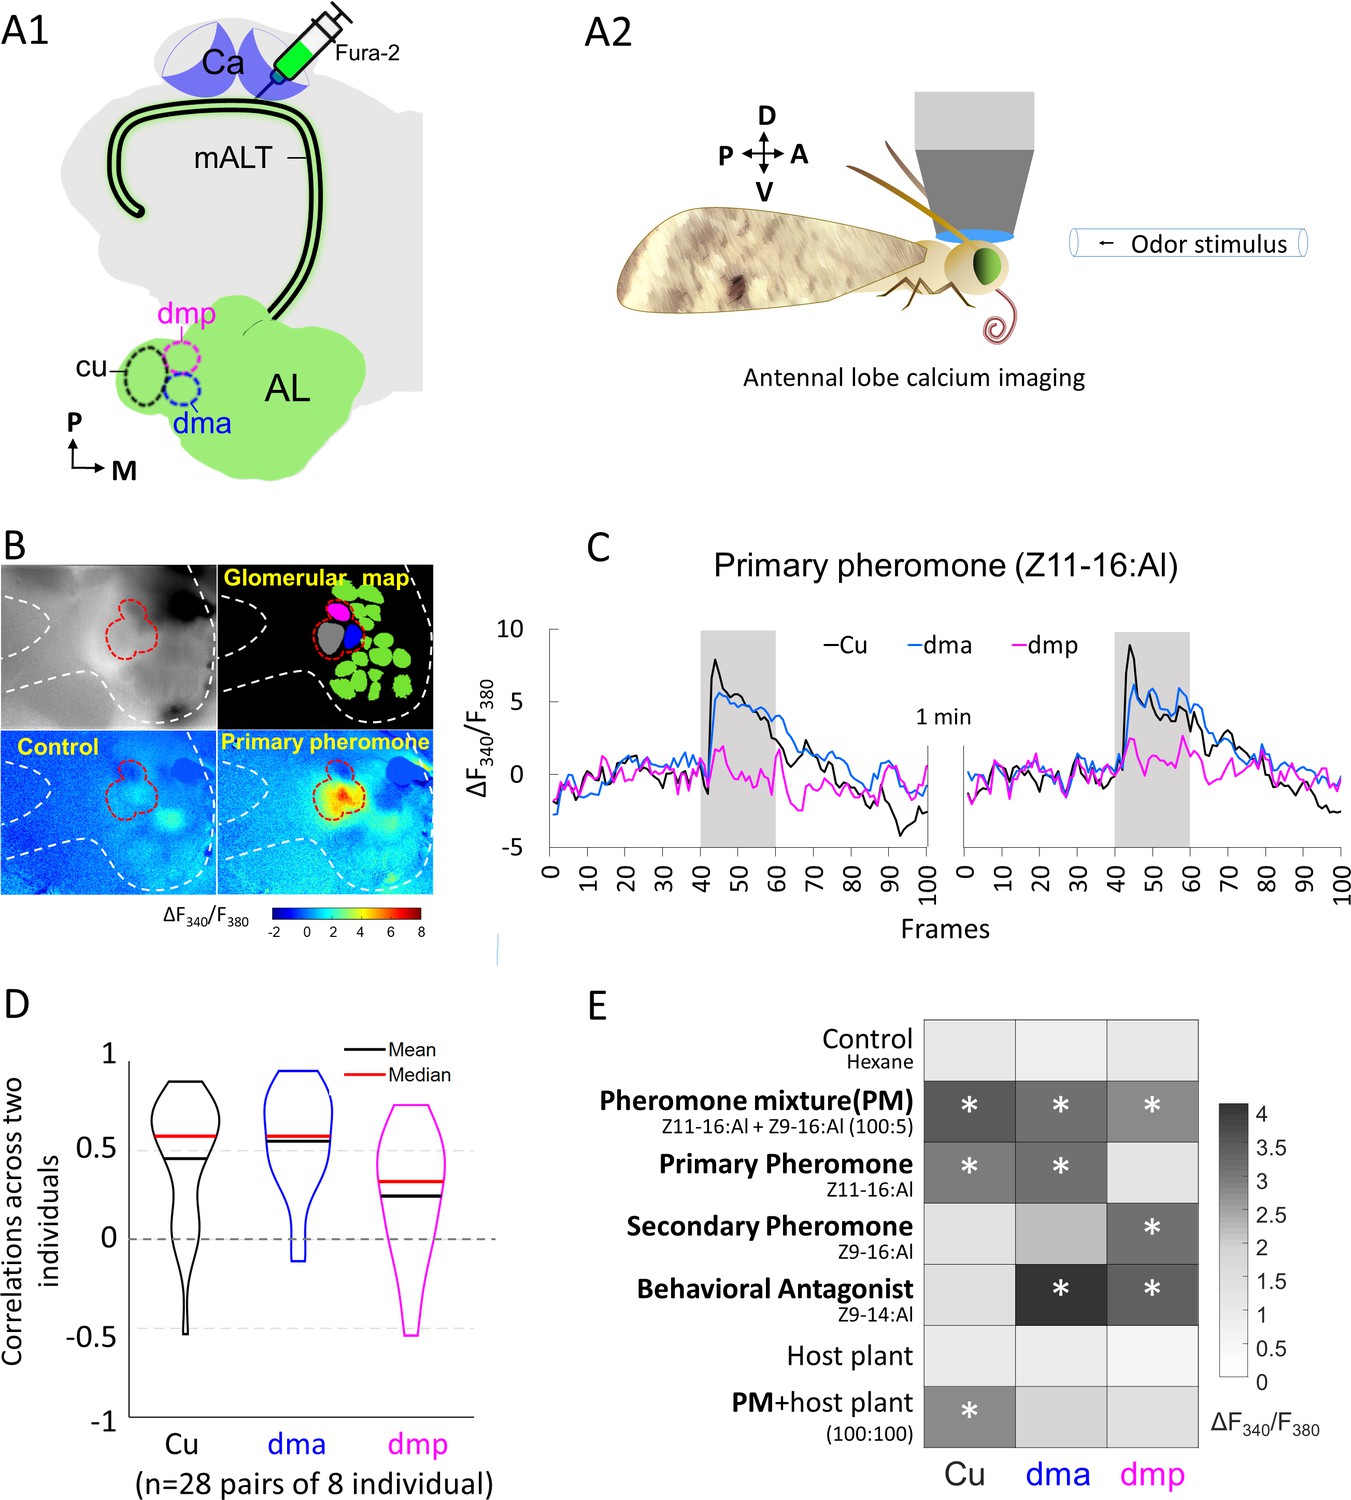
Macroglomerular complex (MGC) neurons confined to the medial antennal-lobe tract (mALT) and their odor responses during calcium imaging.
(A1) Illustration of the retrograde staining with the calcium indicator (Fura-2) from calyx (Ca) labeling a population of the antennal lobe (AL) output neurons exclusively confined to the mALT, including the mALT MGC neurons. (A2) Schematic showing the placement of the moth during calcium imaging providing dorsal orientation of the brain. (B) Characteristic examples of calcium imaging data on MGC: top left, image of an AL stained with Fura from the Ca; top right, a processed image showing a map of recognized glomeruli; down left and down right, heat maps of responses to the control and primary pheromone, respectively. Dashed white and red lines mark the AL and the MGC region, respectively. (C) Calcium signal rises in response to the primary pheromone in neurons innervating distinct MGC units. An average baseline activity, that is, the Fura signal representing the ratio between 340 and 380 nm excitation light (F340/F380) from 0.5 to 2.5 s (frames 5–25, within 4 s spontaneous activity) was selected and set to zero. The trace of neuronal activity, specified as ΔF340/F380, illustrates the changes in fluorescent level in two repeated stimulations with 100 ms sampling frequency. The interval between stimulations was 1 min. Gray bar, the duration of the stimulation period (2 s). (D) Violin plot of consistent tests across eight individuals. (E) Mean response amplitudes of a population of PNs innervating the same MGC units to all presented stimuli (n = 8), where * indicates a significant response compared with control. Box plots of the response amplitudes are shown in Figure 2—figure supplement 1. Cu, cumulus; dma, dorsomedial anterior unit; dmp, dorsomedial posterior unit.
Figure 2—figure supplement 1
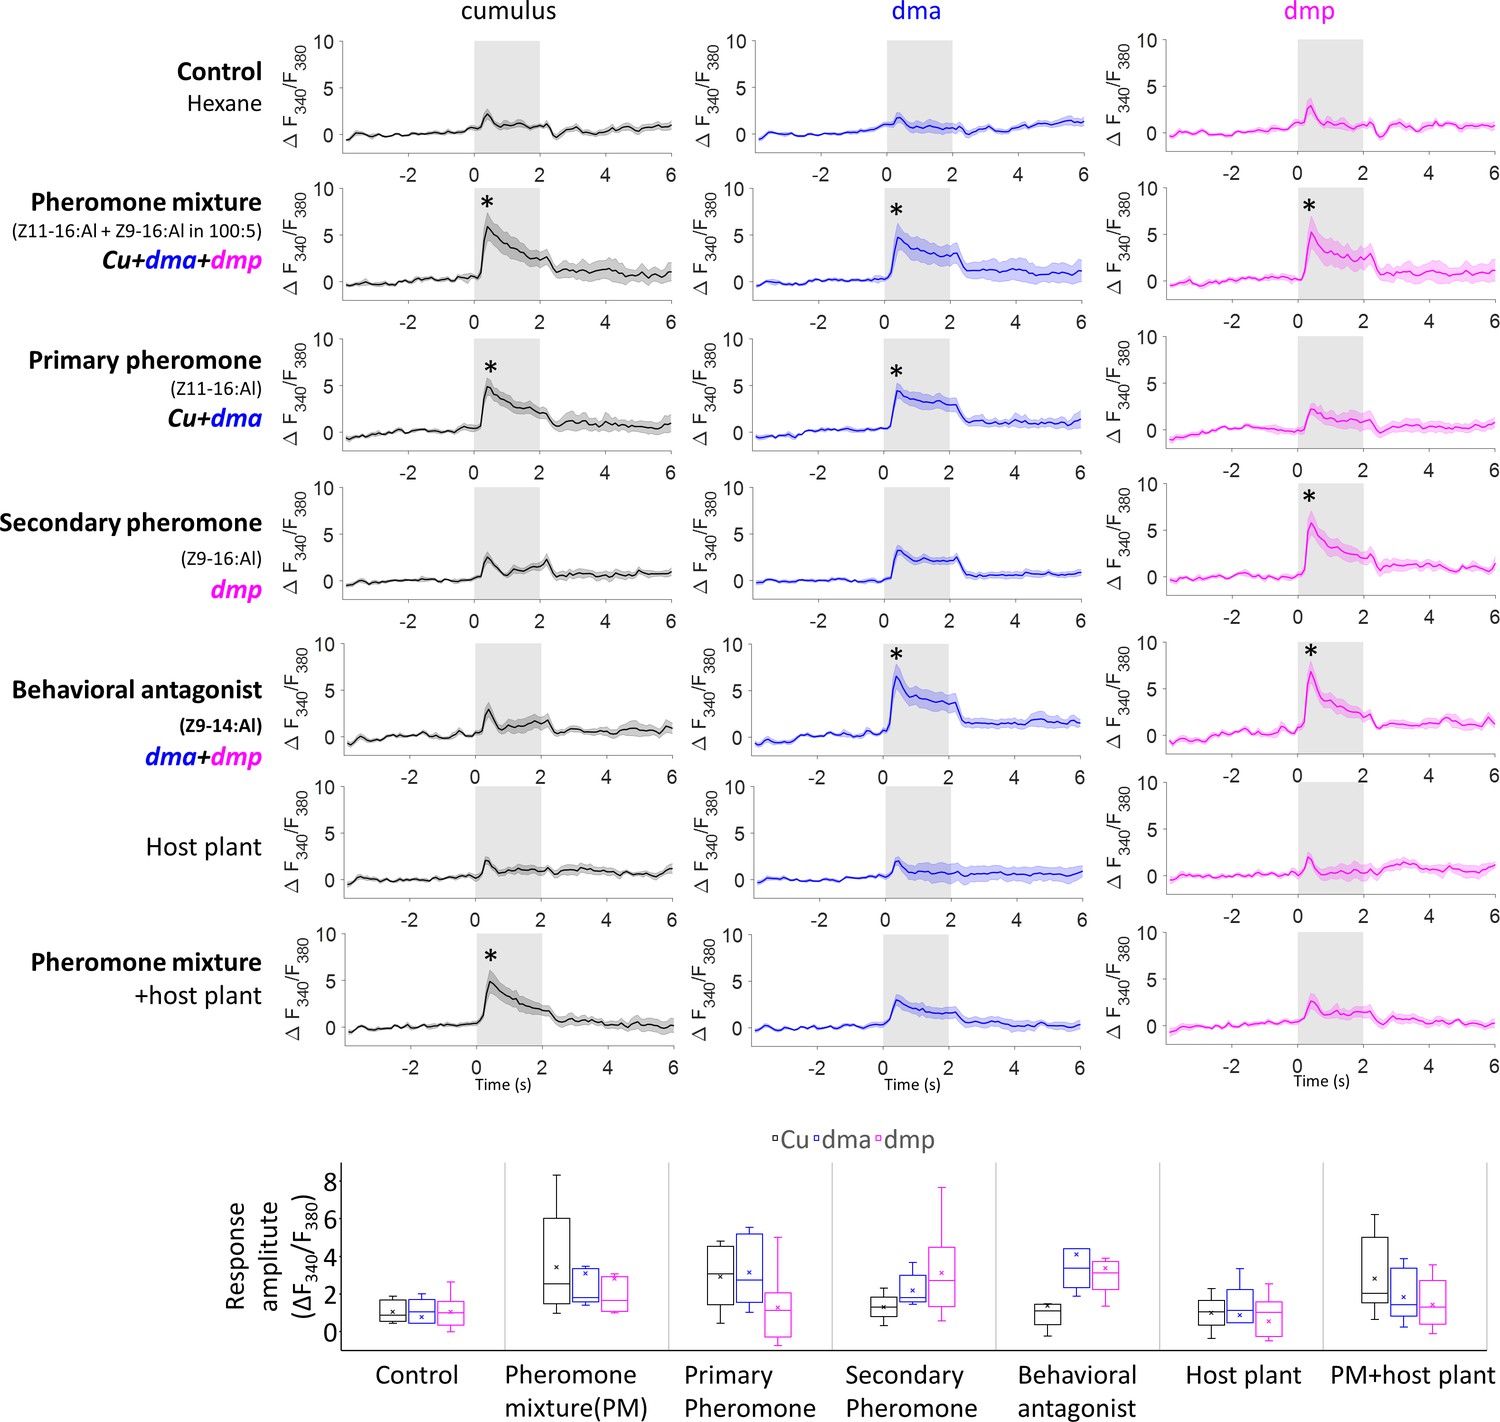
Mean response traces (n = 8 moths) of the macroglomerular complex (MGC) units during stimulation with all presented stimuli (top), where * represents a statistically significant deviation from the Fura signal evoked by control (with 95% confidence level).
The response amplitudes for each stimulus, calculated as the averaged ΔF340/F380 within 2 s stimulation window, are shown below.
Figure 2—figure supplement 2
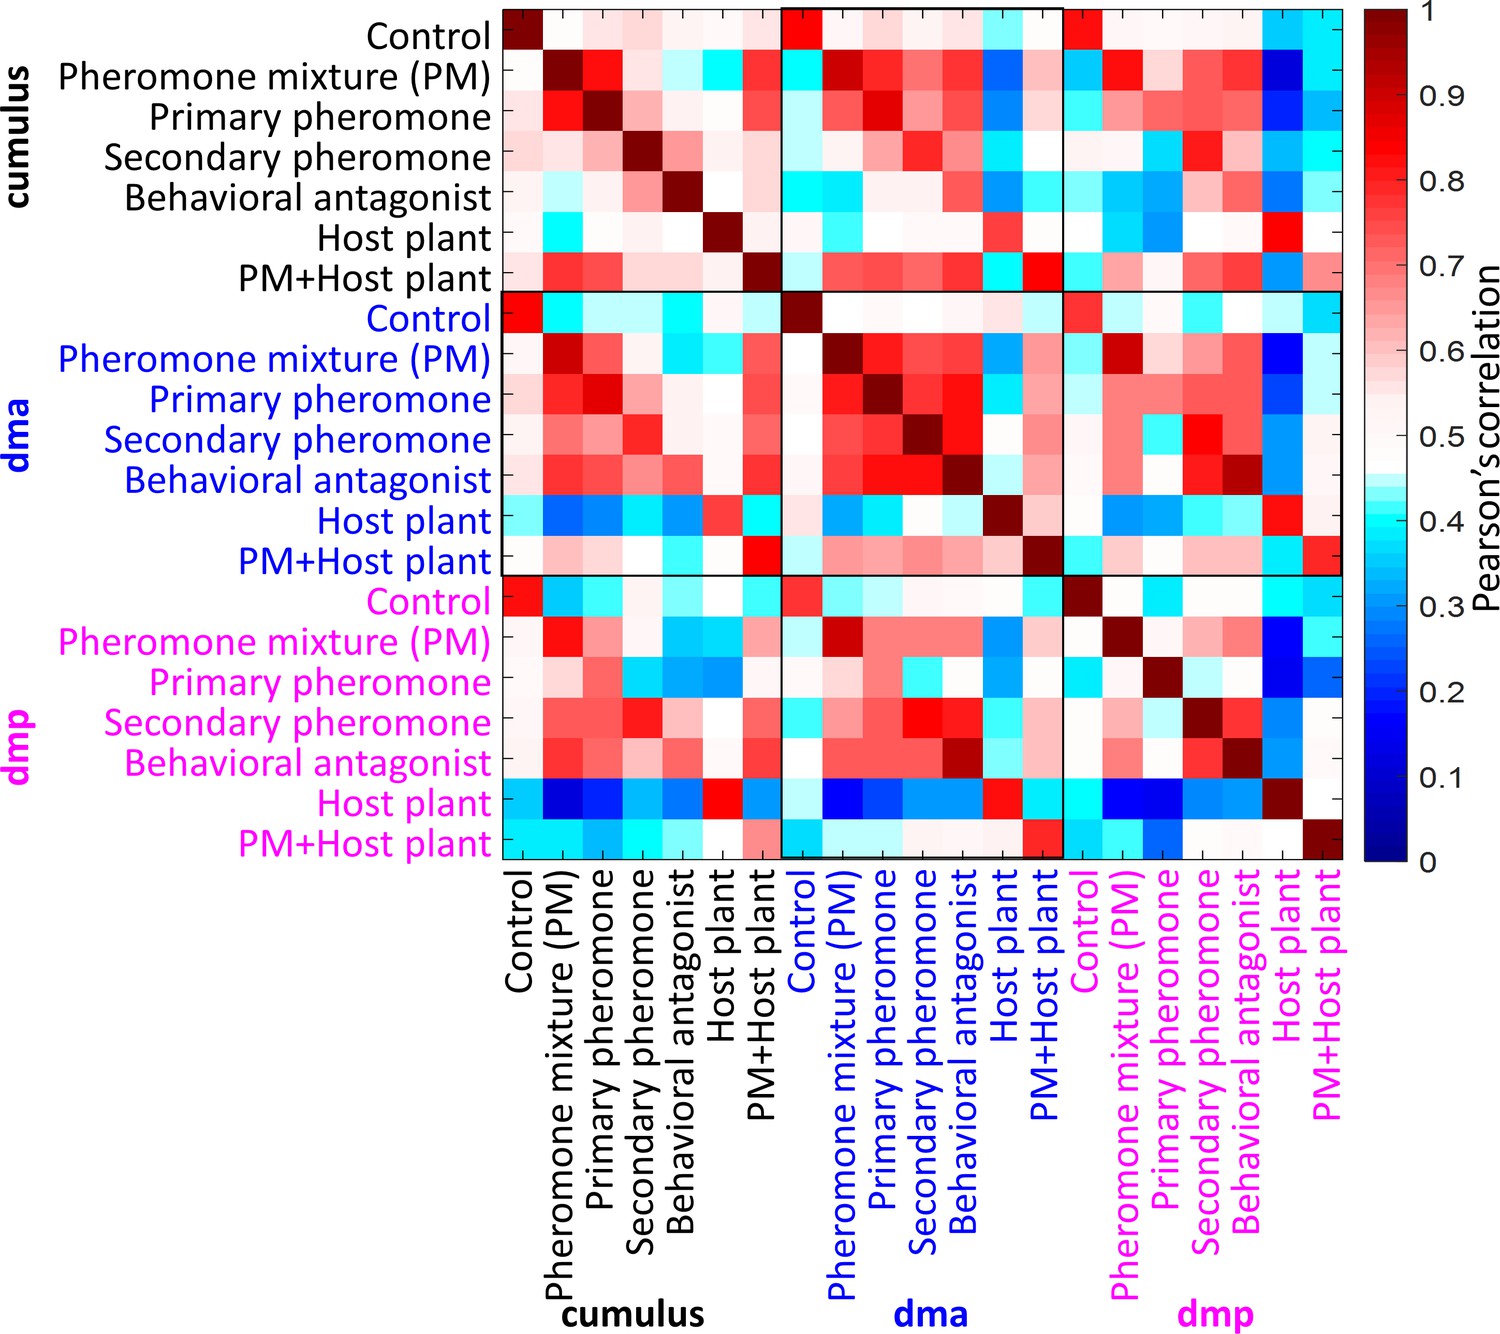
Cross-stimuli correlation plot of mean response traces of the macroglomerular complex (MGC) units during application of all presented stimuli (n = 8 moths).
The cross-stimuli correlations within the dma were high, in comparison of that within the cumulus or the dmp. Pheromone mixture was binary blend of primary pheromone and secondary pheromone in a ratio of 100:5.
Figure 3 with 2 supplements
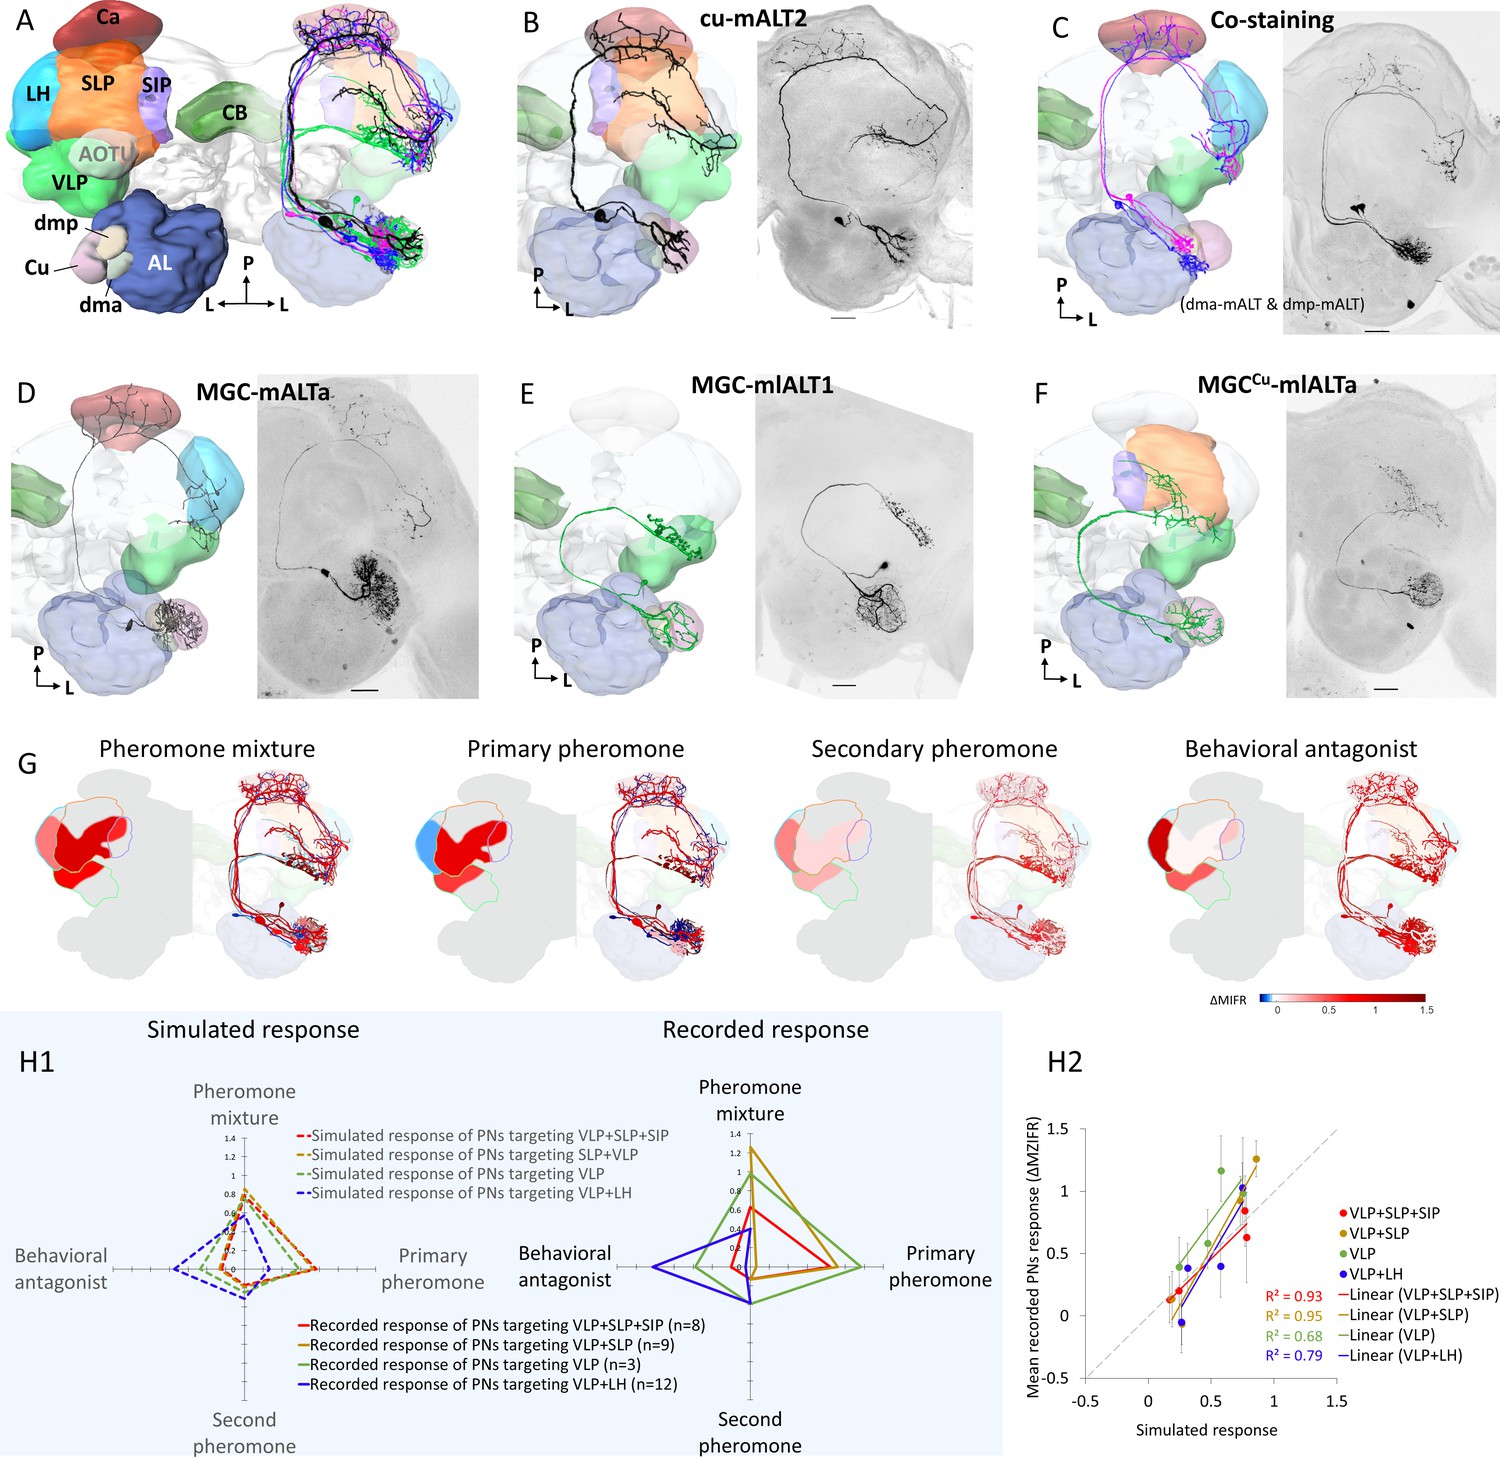
Morphological features of physiologically identified projection neurons (PNs) in the medial and mediolateral tracts – reconstructions, confocal images, and descriptive framework.
(A) Diagram of the brain neuropils targeted by the macroglomerular complex (MGC) output neurons in a dorsal view. Color codes are in correspondence with all other figure panels. AL, antennal lobe; Ca, calyces; CB, central body; LH, lateral horn; SIP, superior intermediate protocerebrum; SLP, superior lateral protocerebrum; VLP, ventrolateral protocerebrum. (B) A typical example of uniglomerular PN in the medial antennal-lobe tract (mALT), originating from cumulus. (C) Two co-labeled mALT PNs targeting the same protocerebral subregions, one innervating the dma (blue) and the other the dmp (magenta). (D) A multiglomerular medial-tract PN with dendritic branches innervating the MGC units homogeneously. (E) A mediolateral antennal-lobe tract (mlALT) PN with homogeneously distributed dendrites across all MGC units. (F) Another type of mlALT PN, with dendrites in all MGC units, but dense arborizations only in the cumulus. All neurons in (B–F), which were labeled via dye injection after intracellular recording, were 3D-reconstructed and manually registered into the representative brain by means of the AMIRA software, based on the reconstructed neuropils innervated by the neuron of interest. Unique neuron IDs are indicated in (B, D–F). D, dorsal; L, lateral; M, medial; P, posterior. Red asterisks indicate weakly co-labeled neurons. Scale bars: 50 µm. (G) Descriptive framework showing stimulus-evoked neural activation within marked areas of the relevant neuropils. The outlines are based on the computed average firing traces across recorded MGC-PNs with projections into the same subarea in the individual output neuropil (for details of PN assembling in each neuropil see Figure 3—figure supplement 1H). In each subpanel, the heat map reflecting the response amplitude of the computed firing trace within the relevant neuropil is shown in the hemisphere to the left, while the mean responses of each PN type (presented in B–F) are shown in the hemisphere to the right. (H) Comparison between simulated neuronal responses and actual recorded neuronal responses to each female-produced odor. The simulations (left in H1) were based on described value showed in (G). The scatter plot in (H2) visualized the correlation between simulated and recorded data across four stimuli.
-
Figure 3—source data 1
Overview of individual projection neuron morphologies.
- https://cdn.elifesciences.org/articles/65683/elife-65683-fig3-data1-v2.docx
Figure 3—figure supplement 1
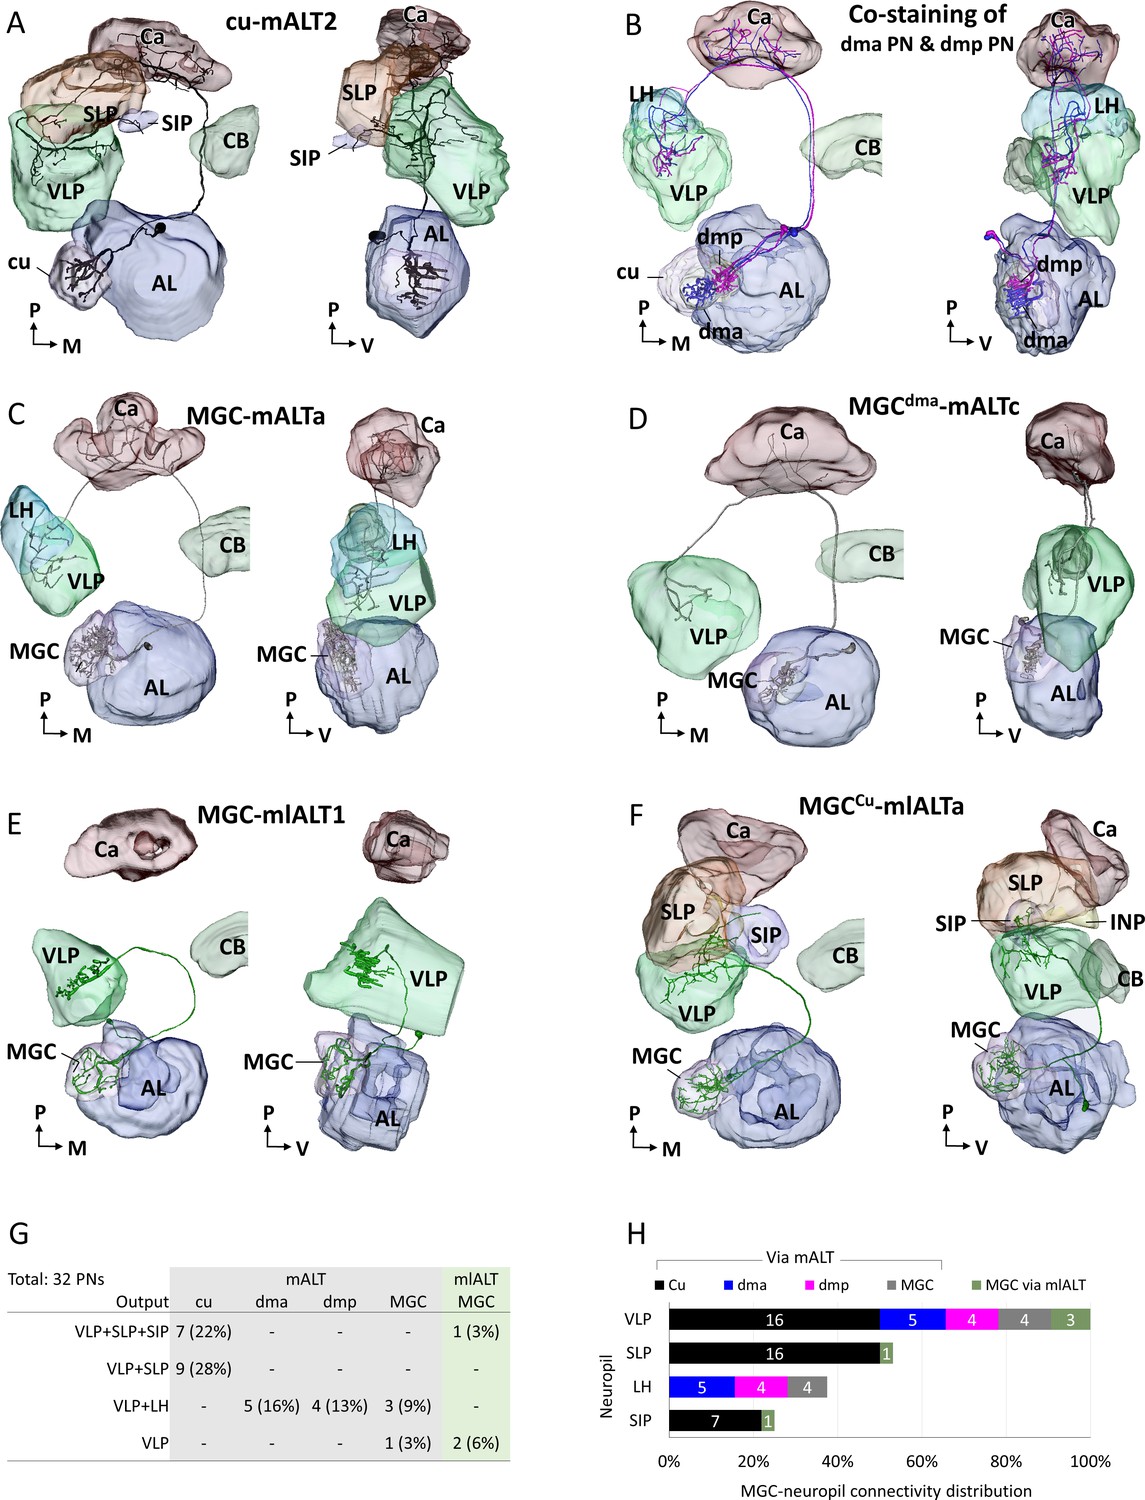
3D reconstructed macroglomerular complex projection neurons(MGC-PNs), confined to the medial antennal-lobe tract (mALT) and mediolateral antennal-lobe tract (mlALT), including reconstruction of the neuropils innervated by the neuron of interest.
The visulazations are in dorsal frontal view (left) and lateral view (right). (A) 3D reconstruction of an individual cumulus mALT neuron. (B) 3D reconstruction of two co-stained mALT neurons originating from dma and dmp unit, respectively. The PNs had overlapping axon terminals in the LH and VLP. (C–D) 3D reconstruction of multiglomerular mALT neurons originating from MGC. (E–F) 3D reconstruction of multiglomerular mlALT neurons originating from MGC. Unique neuron IDs are indicated. AL, antennal lobe; Ca, calyces; CB, central body; LH, lateral horn; SIP, superior intermediate protocerebrum; SLP, superior lateral protocerebrum; VLP, ventrolateral protocerebrum. D, dorsal; L, lateral; M, medial; P, posterior. (G) Overview of lateral protocerebral neuropils targeted by recorded MGC-PNs. Number and proportion of recorded neurons are presented in each cell. The most frequently recorded mALT neurons were the PNs innervating cumulus (total 50%), which corresponds with the fact that cumulus is the biggest MGC unit. (H) Connectivity between each MGC unit and the targeting protocerebral neuropils. The number of PNs projecting to each relevant neuropil is shown in white.
Figure 3—figure supplement 2
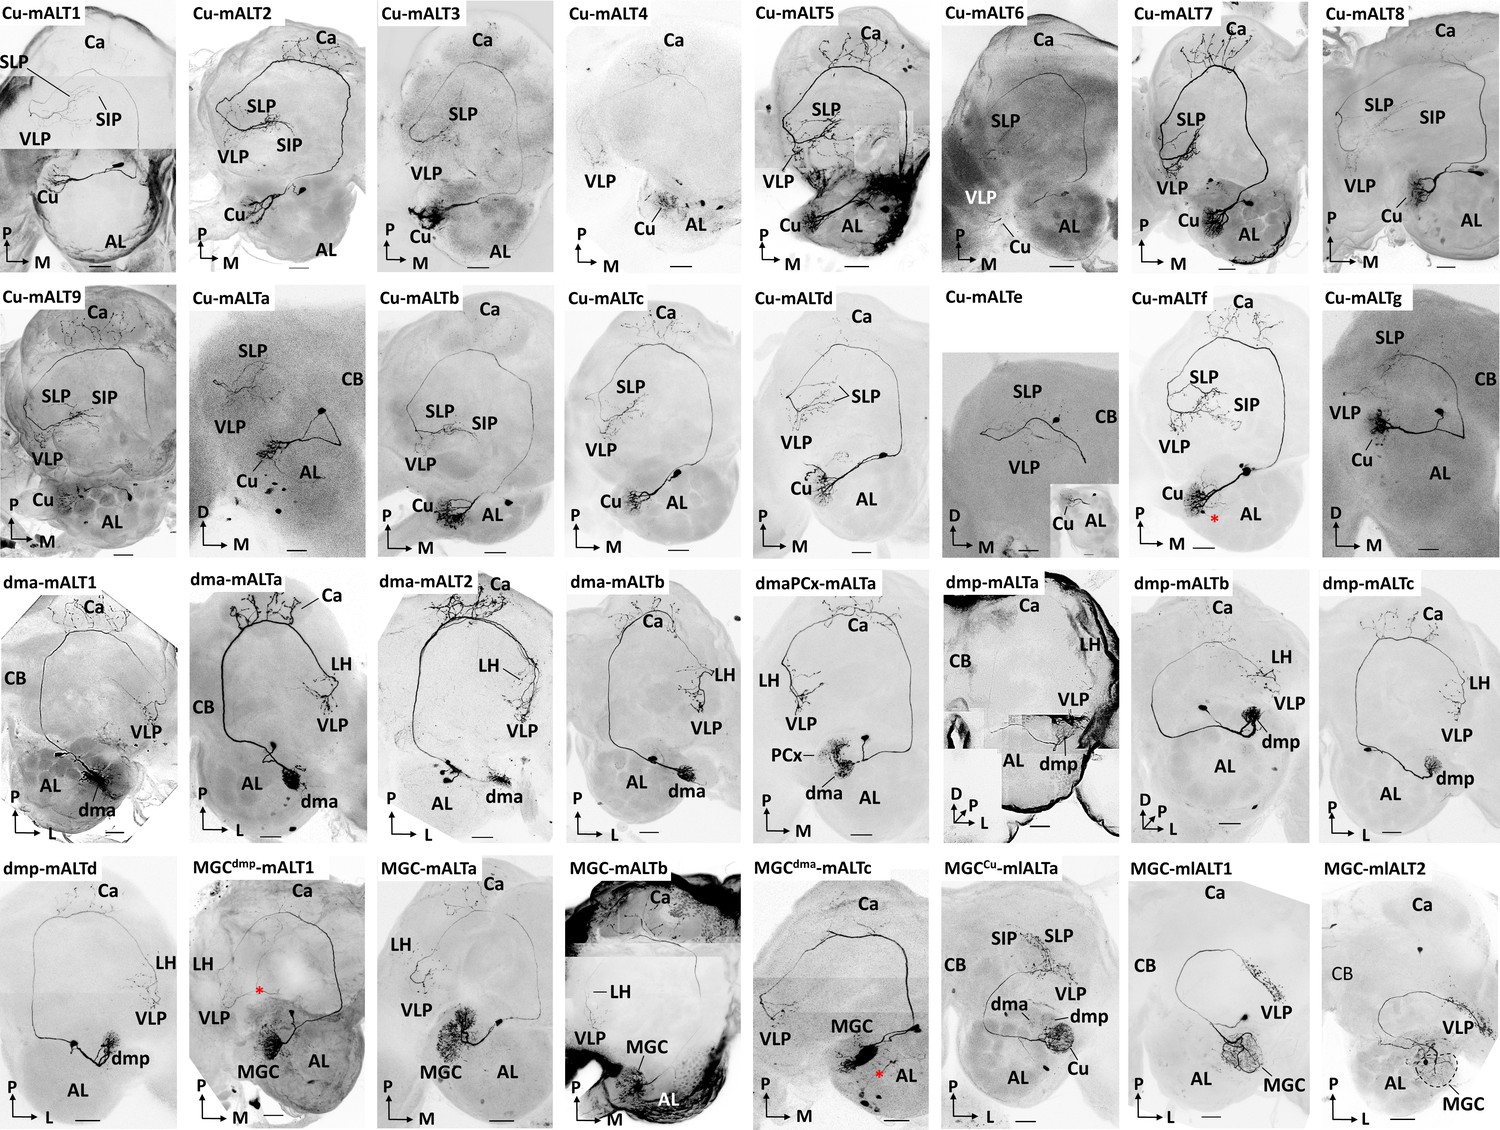
Morphology of all individually recorded macroglomerular complex projection neurons(MGC-PNs).
Red asterisks indicate weakly co-labelled neurons. AL, antennal lobe; Ca, calyces; LH, lateral horn; SIP, superior intermediate protocerebrum; SLP, superior lateral protocerebrum; VLP, ventrolateral protocerebrum. L, lateral; M, medial; P, posterior. Scale bars: 50 µm.
Figure 4
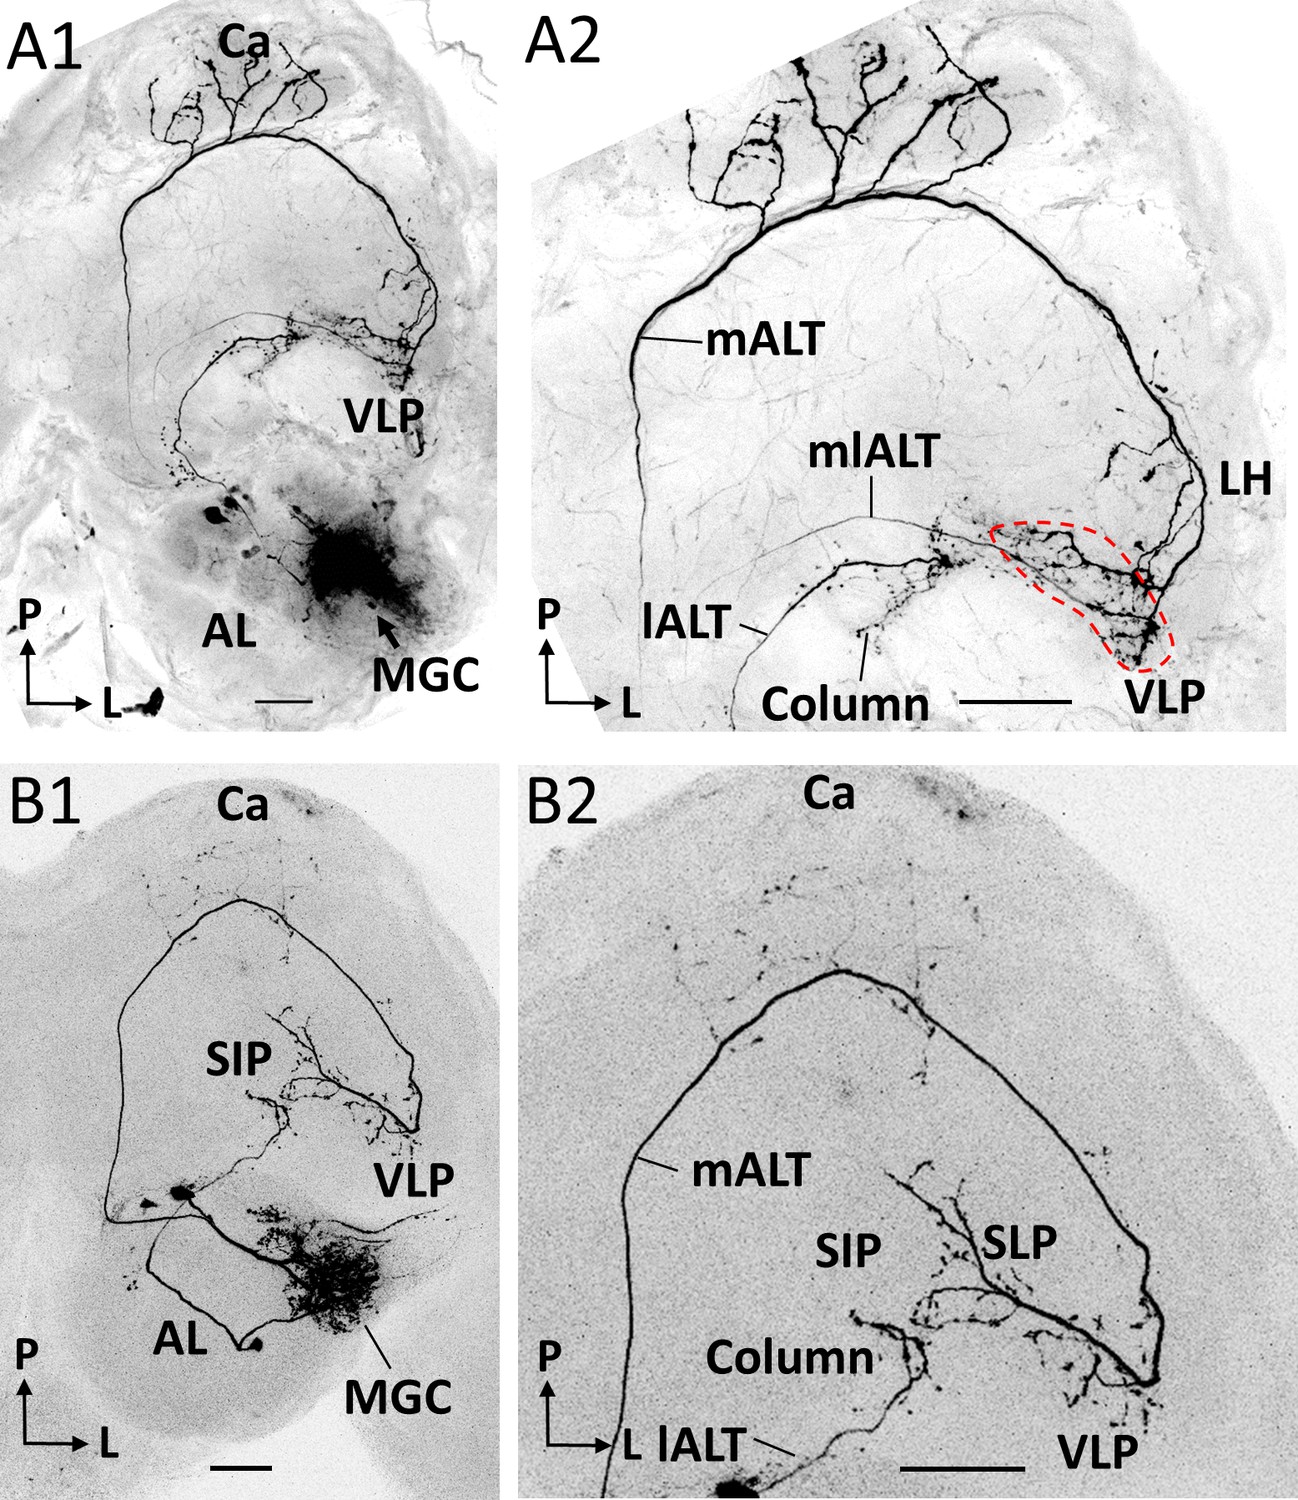
Co-labeled projection neurons (PNs) in distinct ALTs.
(A) Application of dye in the macroglomerular complex (MGC) visualized three antennal-lobe projection neurons confined to the medial antennal-lobe tract (mALT), mediolateral antennal-lobe tract (mlALT), and lateral antennal-lobe tract (lALT), respectively (A1). The axonal terminals of the mlALT PN overlapped with the mALT PN in the VLP (red dashed lines in A2). (B) Two co-labeled cumulus PNs, confined to the mALT and lALT, respectively. The mALT PN has no overlap with the lALT PN. AL, antennal lobe; Ca, calyces; LH, lateral horn; SIP, superior intermediate protocerebrum; SLP, superior lateral protocerebrum; VLP, ventrolateral protocerebrum. L, lateral; P, posterior. Scale bars: 50 µm.
Figure 5 with 7 supplements
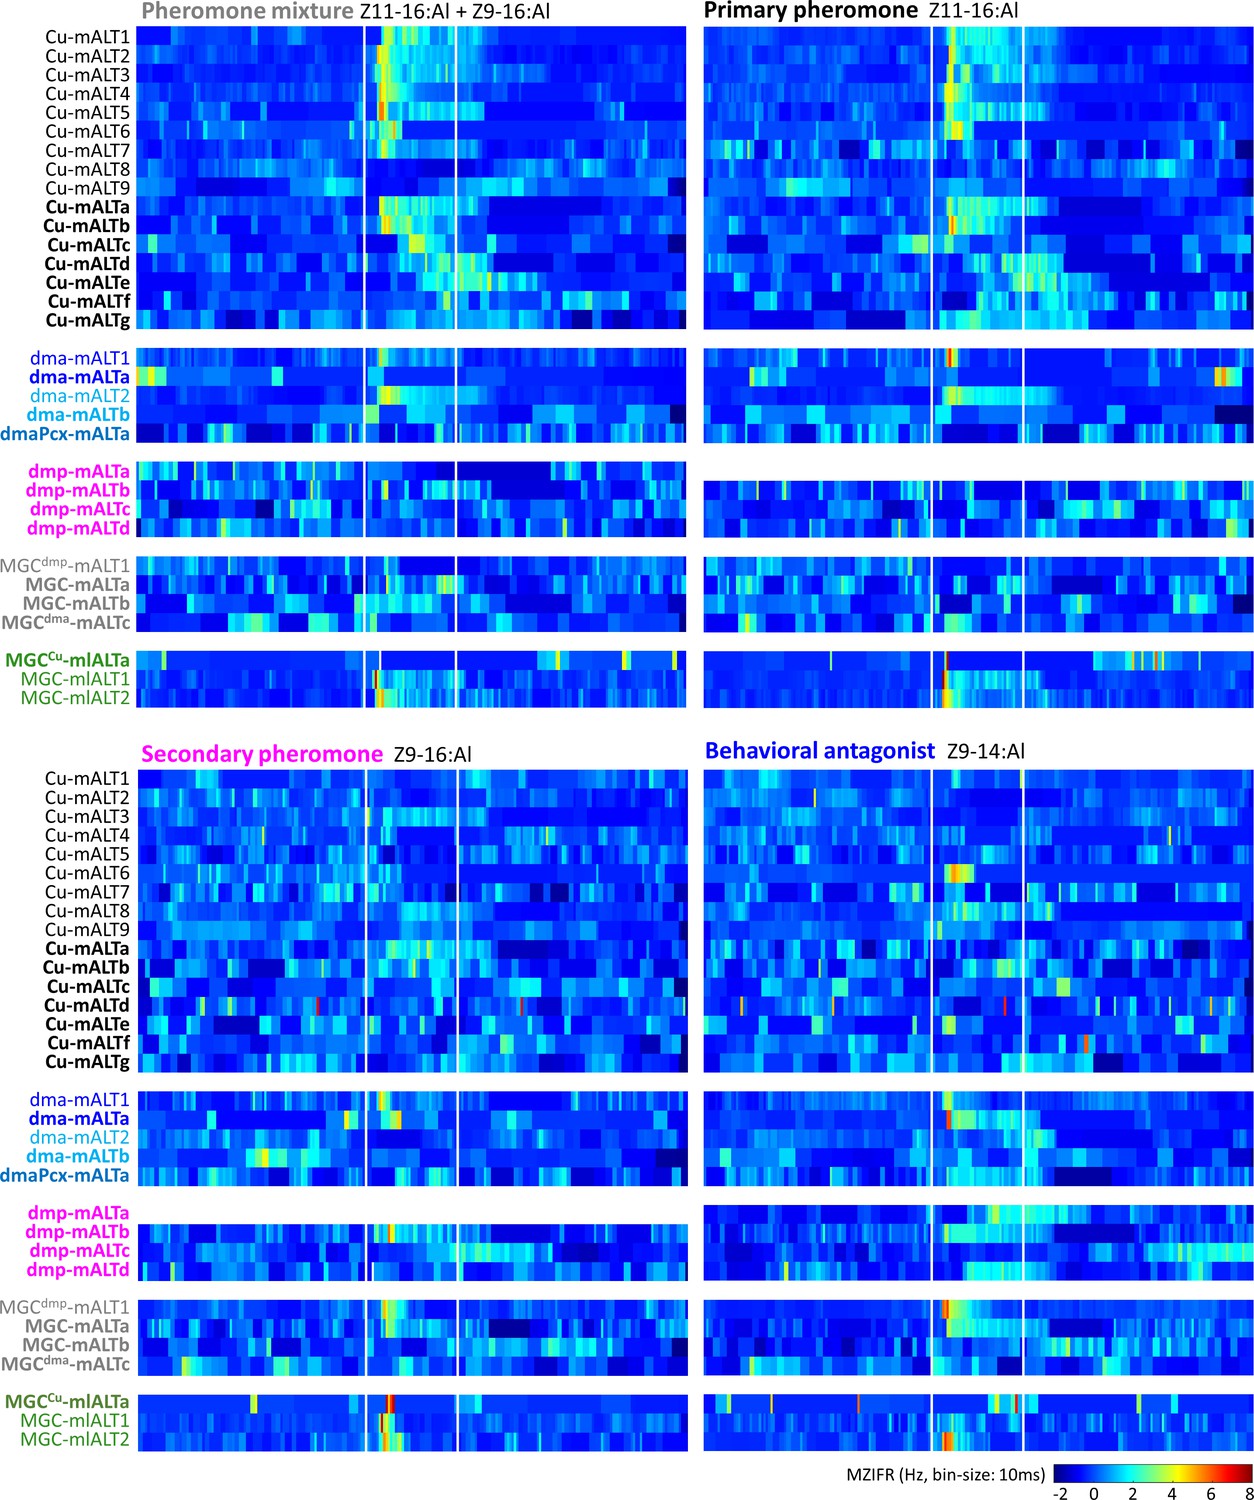
Temporal resolution index of spiking activity in the individual macroglomerular complex projection neurons (MGC -PNs).
This plot displays the across-trials mean instantaneous firing rates (MZIFR) for each of the reported PNs in response to the four presented female-produced stimuli.
Figure 5—figure supplement 1
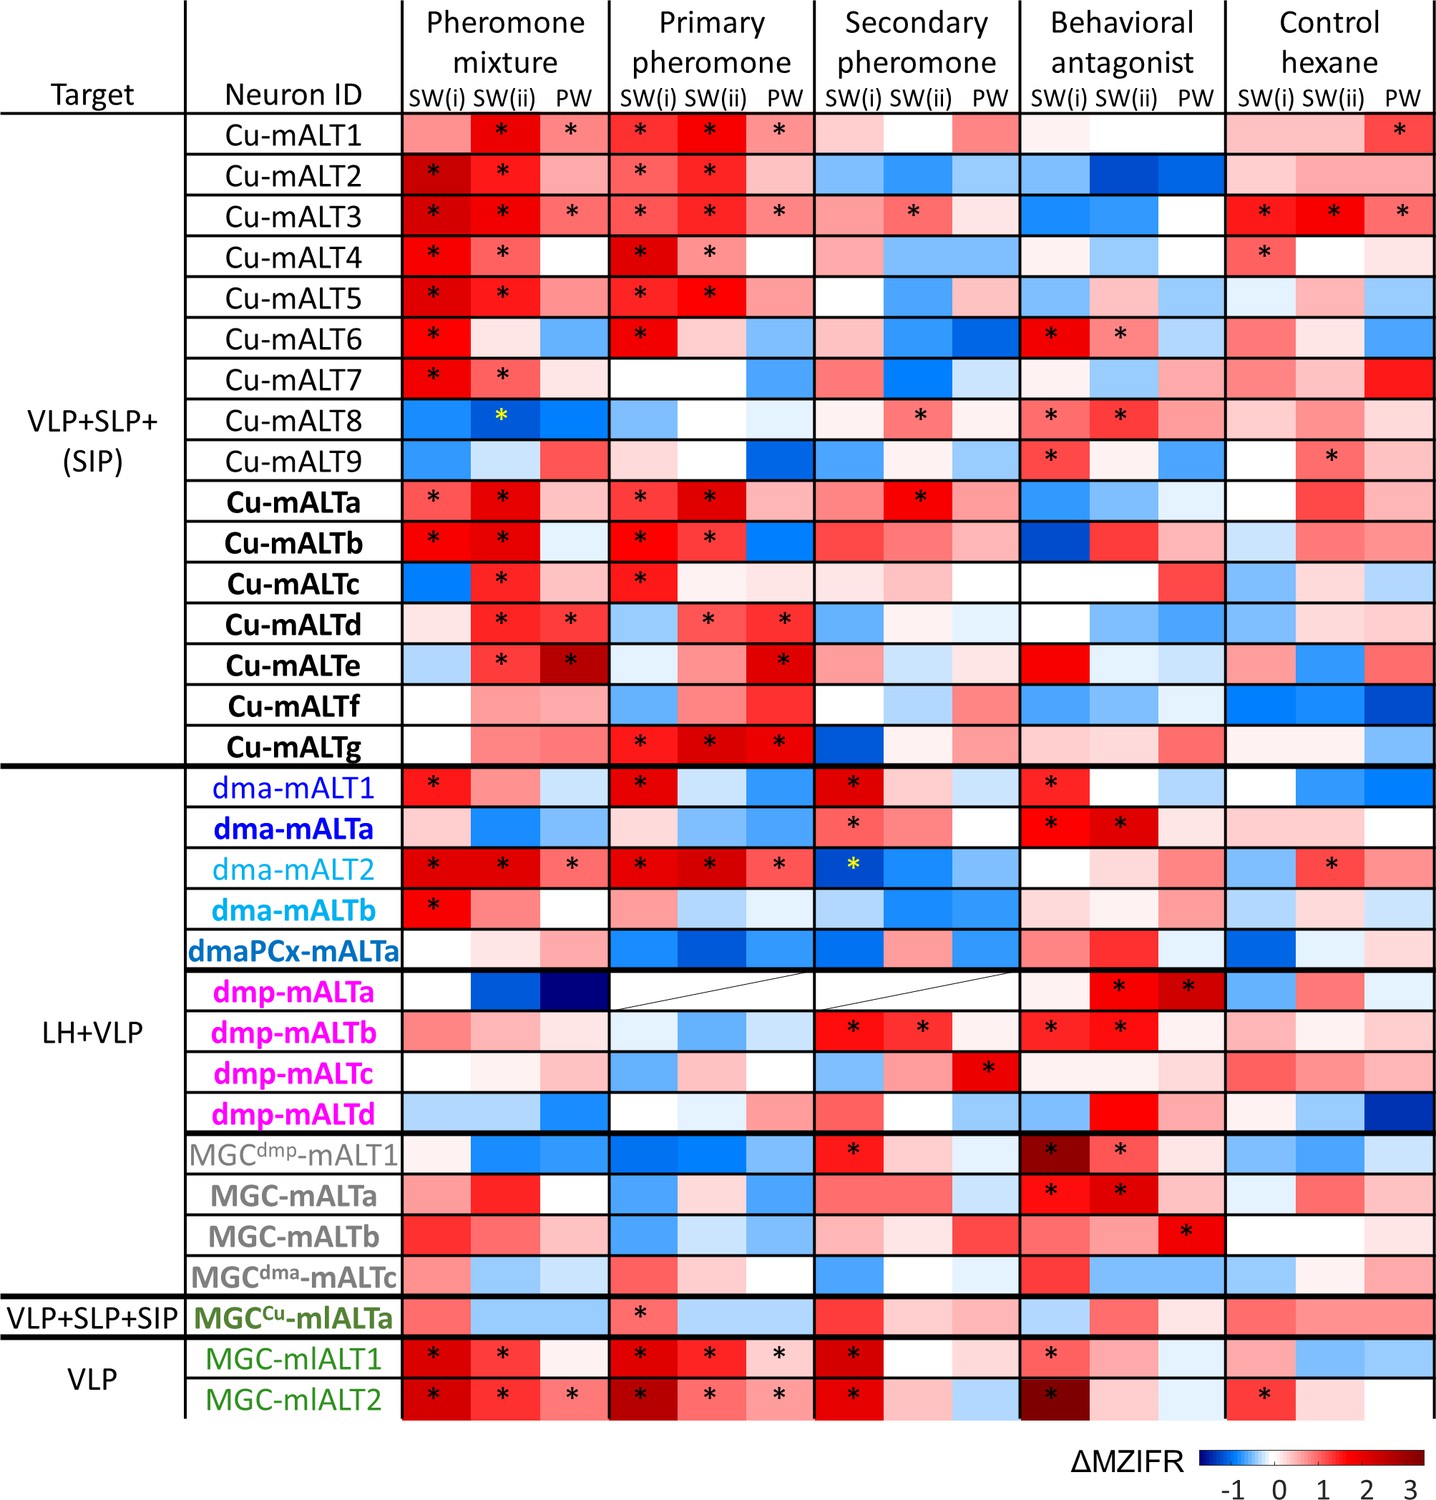
Physiological properties of individual macroglomerular complex projection neurons(MGC-PNs).
Mean response amplitudes (ΔMZIFR) were registered in three adjacent episodes: Sub-window SW(i) including the first 100 ms of the stimulation window, sub-window SW(ii) including the remaining 300 ms of the stimulus duration; and a 200 ms post-stimulation window (PW). * indicates significant responses, determined according to the threshold of baseline activity of individual neurons (with 95% confidence level). LH, lateral horn; SIP, superior intermediate protocerebrum; SLP, superior lateral protocerebrum; VLP, ventrolateral protocerebrum.
Figure 5—figure supplement 2
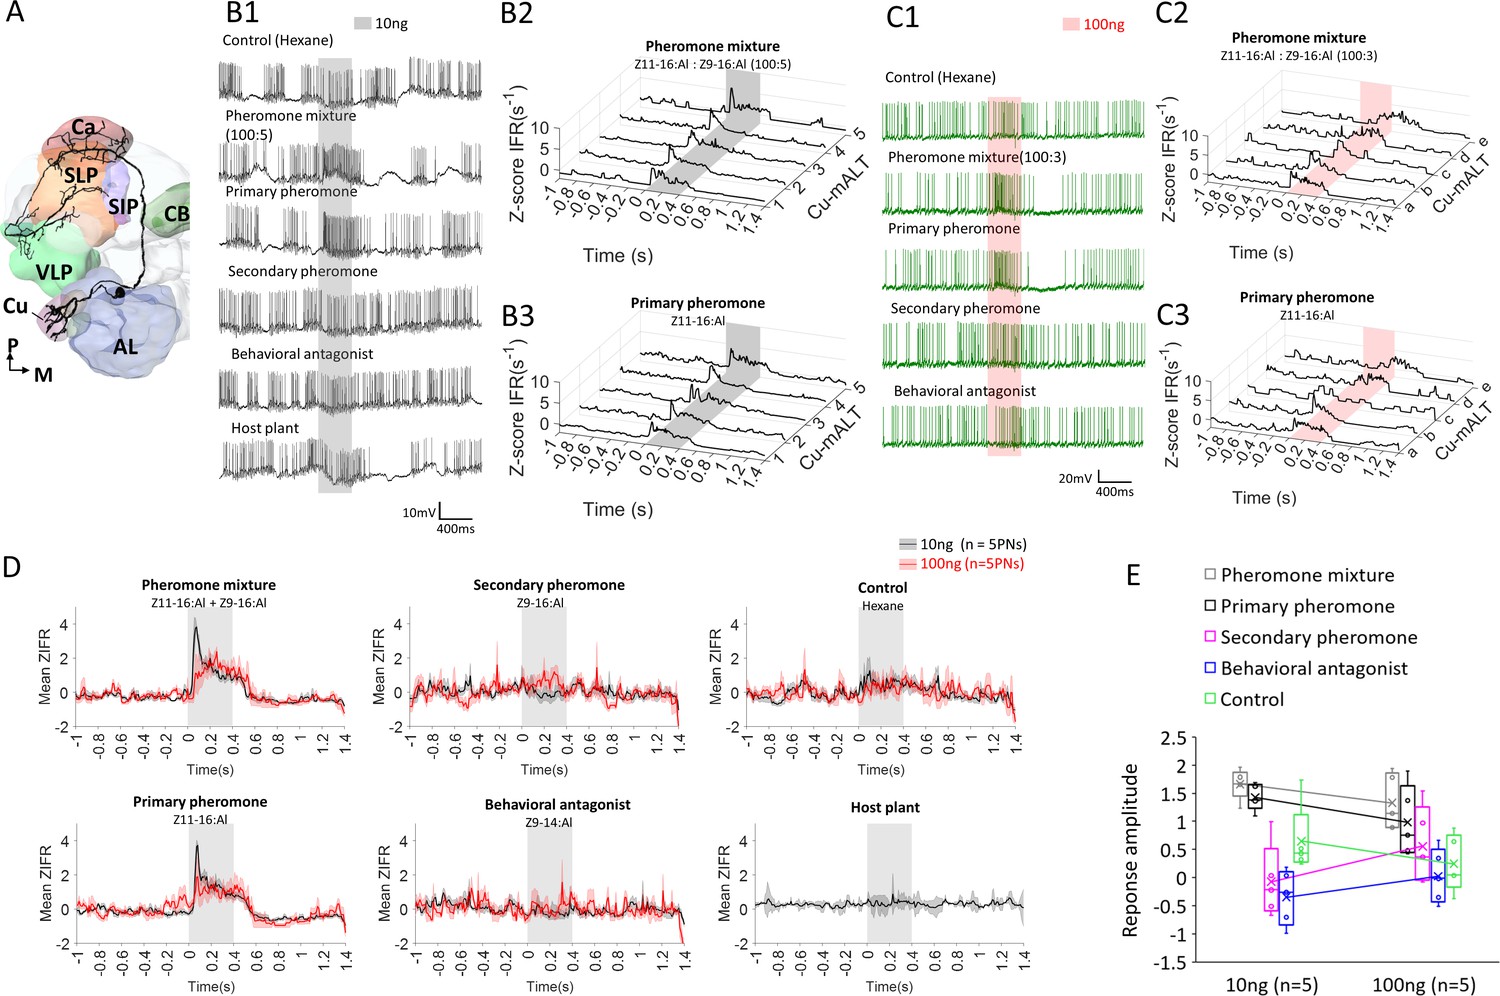
The predominant response pattern of medial antennal-lobe tract (mALT) projection neurons (PNs) originating in the cumulus.
(A) Simplified scheme of a mALT PN innervating the cumulus. AL, antennal lobe; Ca, calyces; CB, central body; SIP, superior intermediate protocerebrum; SLP, superior lateral protocerebrum; VLP, ventrolateral protocerebrum. M, medial; P, posterior. (B1) Spiking activity of one of the mALT cumulus neurons during application of odor stimuli at low concentration (10 ng). (B2–B3) Mean traces of Z-scored instantaneous firing rates (ZIFR) across repeated trials to the low concentration pheromone mixture (B2) and the primary pheromone (B3) in five cumulus neurons, Cu-mALT1-5. (C1) Spiking activity of one of the mALT cumulus neurons during application of odor stimuli at high concentration (100 ng). (C2–C3) Single trial traces of Z-scored instantaneous firing rates (ZIFR) to the high concentration pheromone mixture (C2) and the primary pheromone (C3) in five cumulus neurons, Cu-mALTa-e. (D) Comparison of mean ZIFR traces between low and high concentration protocols. (E) Box plots of response amplitude (ΔMZIFR) of the entire 400 ms stimulation window from two concentration protocols. The response amplitudes across stimuli appeared more pronounced in the low concentration protocol, suggesting that impaired odor discrimination may occur at high odor concentrations.
Figure 5—figure supplement 3
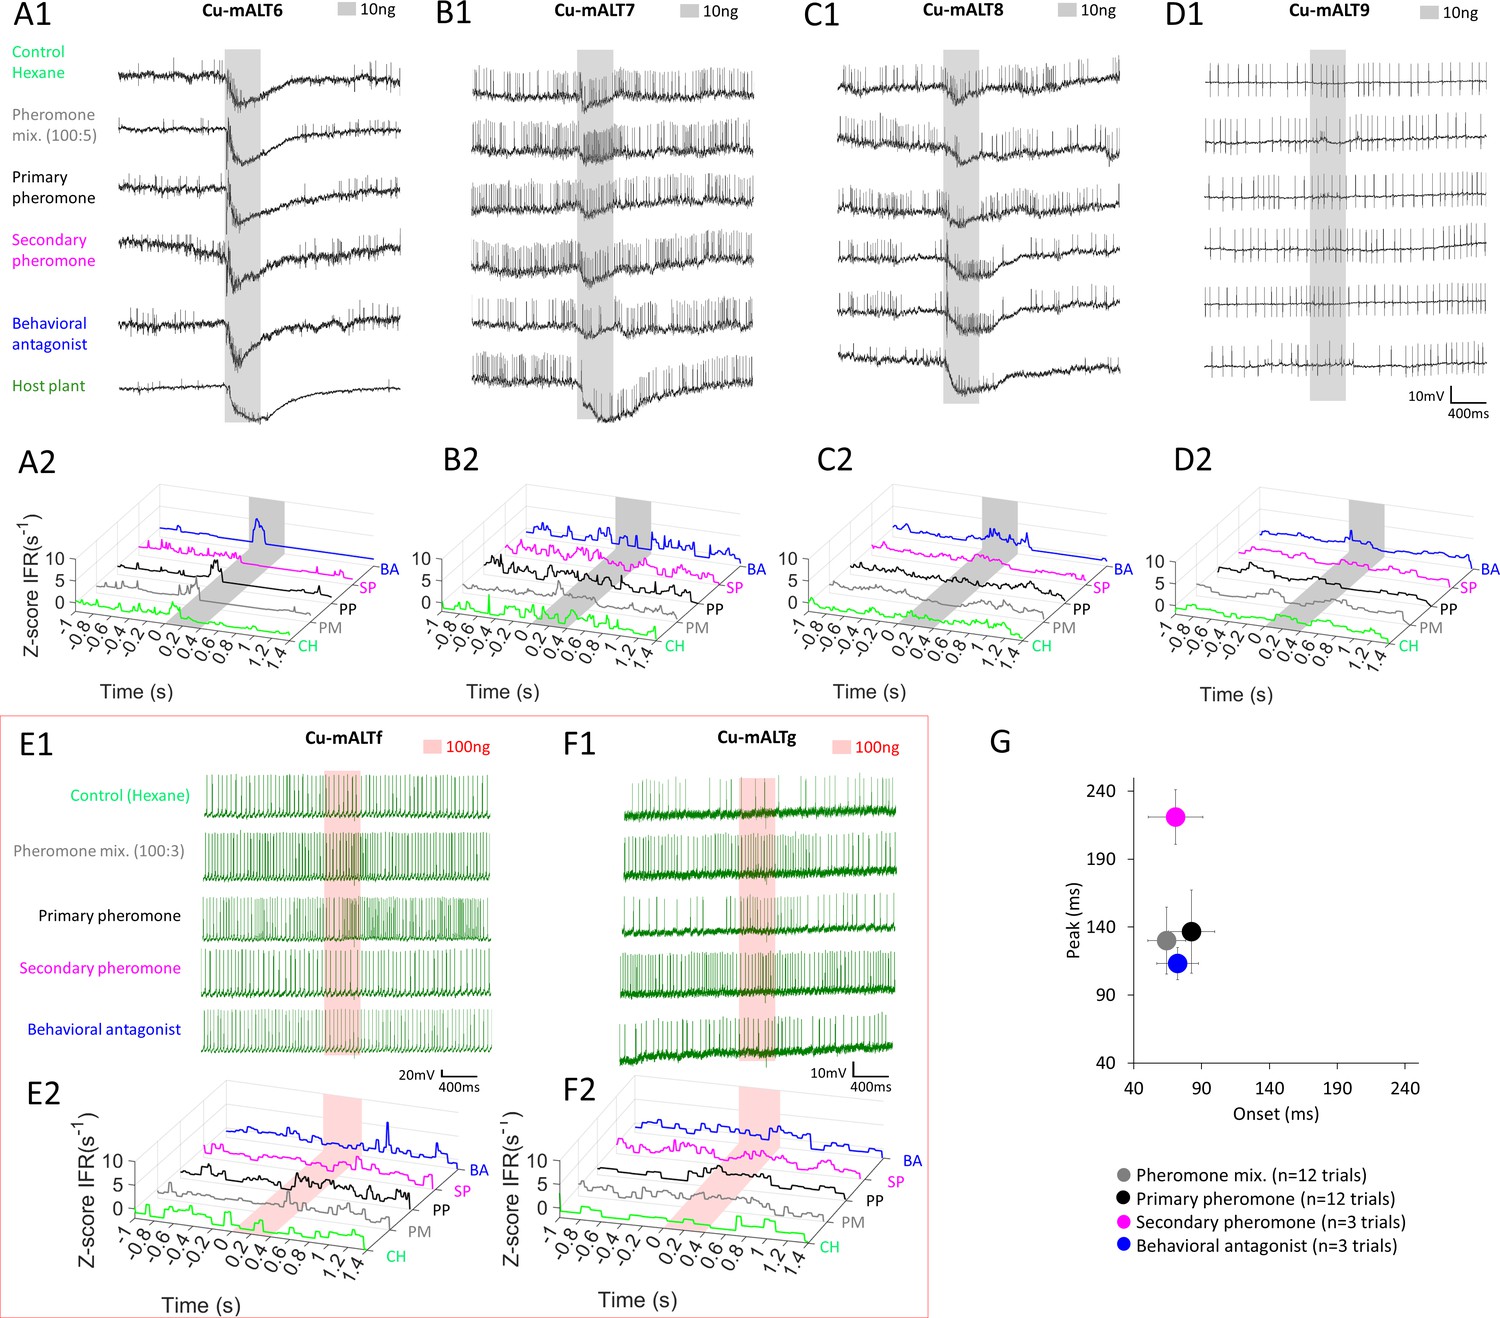
Heterogeneous response profiles of cumulus-innervating medial antennal-lobe tract (mALT) projection neurons (PNs) with homogenous morphologies.
(A–D) Spiking activity and traces of instantaneous firing rates (ZIFR) in PNs with ID CU-mALT6-9 during application of odor stimuli at low concentration (10 ng). (E–F) Spiking activity and traces of instantaneous firing rates (ZIFR) in PNs CU-mALTf-g during application of odor stimuli at high concentration (100 ng). (G) Onset-peak scatter plot including latency data from individual trials across the six presented PNs in (A–F). Data is presented as mean ± sem. The delayed peak was only evoked by the secondary pheromone. CH, hexane; PM, pheromone mixture; PP, primary pheromone; SP, secondary pheromone; and BA, behavioral antagonist.
Figure 5—figure supplement 4
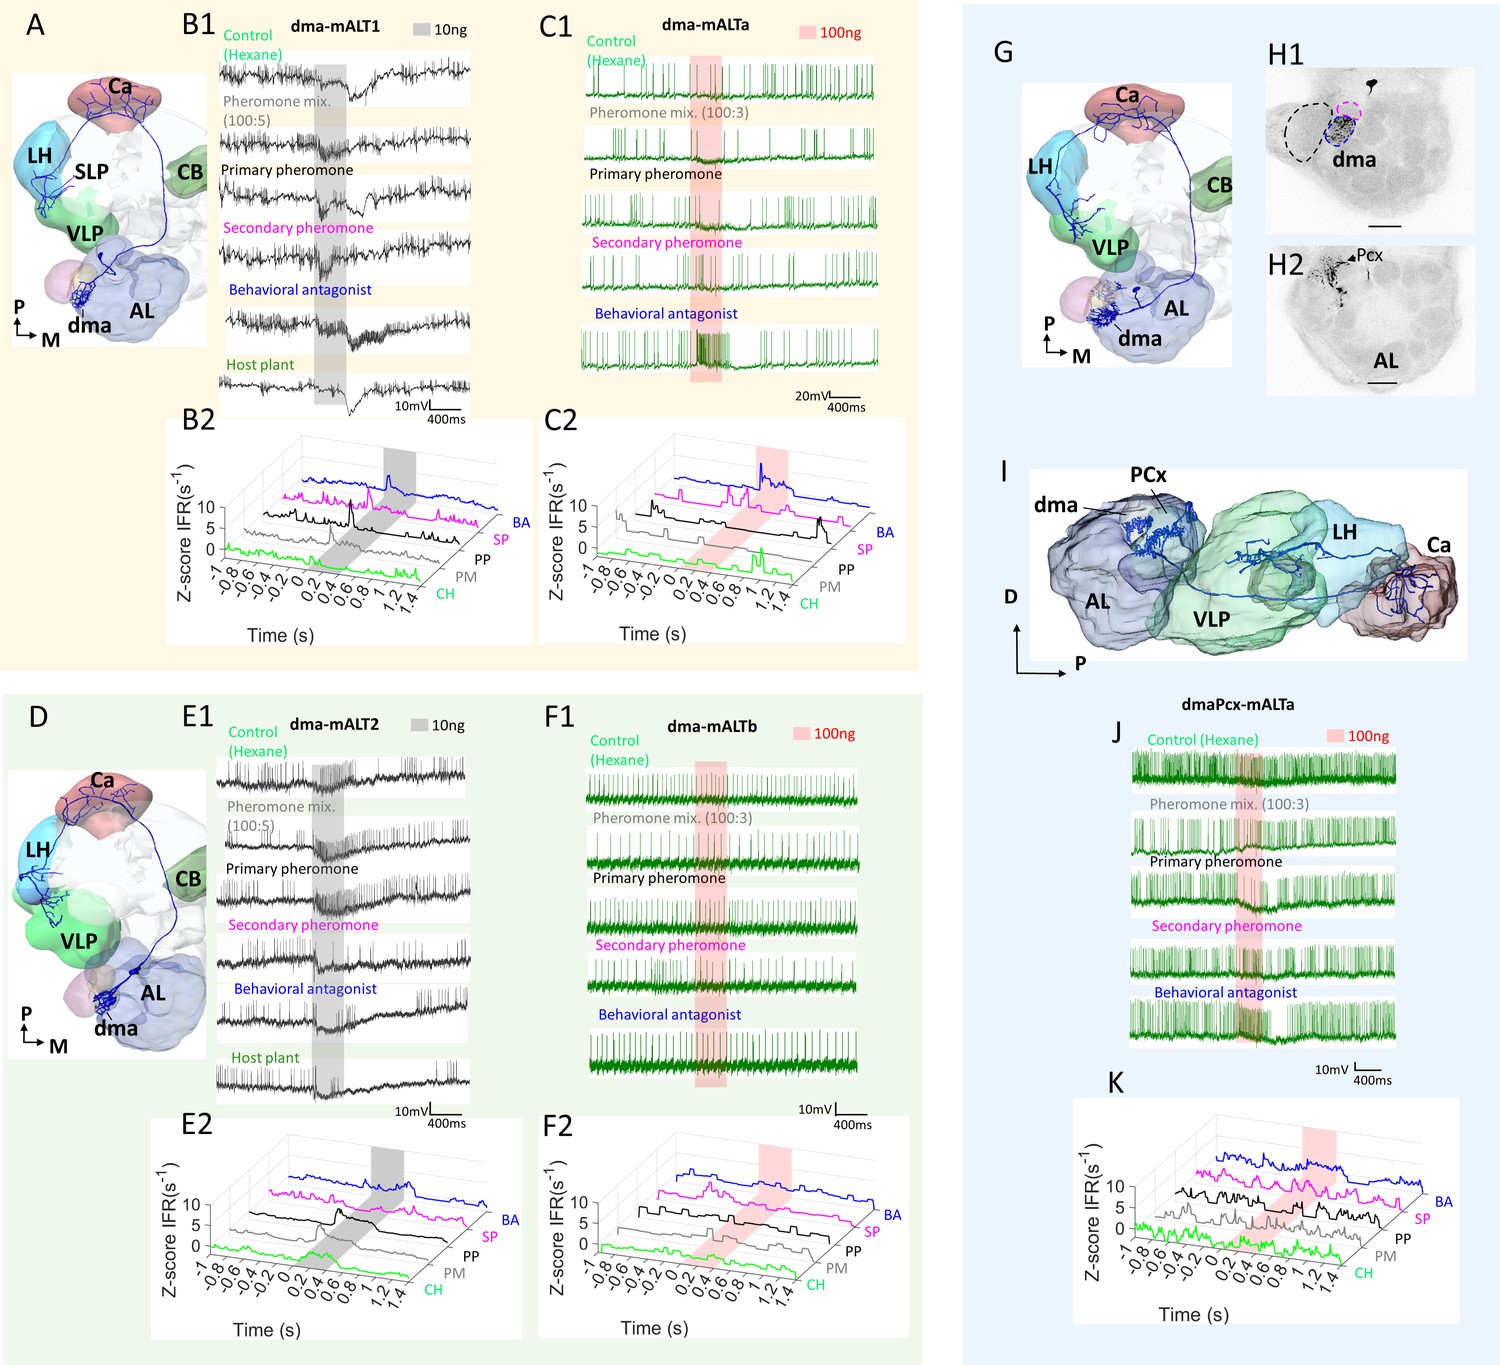
Heterogeneous response profiles of two types of dma-innervating medial antennal-lobe tract (mALT) projection neurons (PNs).
(A–C) Physiological profile of dma-PN type with extended terminals approaching to the SLP. The spiking activity and Z-scored instantaneous firing rates (ZIFR) trace showed that both PNs of this type were excited by the behavioral antagonist (BA) and the secondary pheromone (SP). PN dma-mALT1 in (B) was broadly tuned, responding with phasic excitation to all stimuli except the control hexane (CH). PN dma-mALTa appeared to be suppressed by the pheromone mixture (PM) and the primary pheromone (PP). (D–F) Physiological profile of the other dma-PN type with restricted terminal regions. The spiking activity and Z-scored instantaneous firing rates (ZIFR) trace of the two relevant neurons illustrated that neither of them responded to the BA at low concentration (E) or high concentration (F). (G–K) Dendritic morphology and response profile of the dmaPCx-mALT PN. (H) Confocal images demonstrating that this PN innervated the dma (blue dashed line in H1), but not the cumulus or dmp (black and magenta dashed lines, respectively). Three posterior complex (PCx) glomeruli also received some dendritic processes (H2). (I) Reconstruction demonstrating the AL innervation in sagittal view. (J–K) Spiking activity and Z-scored instantaneous firing rates (ZIFR) trace showed no responses that were significantly different from baseline firing rates. However, the firing rate of this PN was slightly enhanced when stimulated with the behavioral antagonist (BA), and moderately inhibited by the primary pheromone (PP). AL, antennal lobe; Ca, calyces; CB, central body; LH, lateral horn; SLP, superior lateral protocerebrum; VLP, ventrolateral protocerebrum. D, dorsal; M, medial; P, posterior. Scale bars: 50 µm.
Figure 5—figure supplement 5
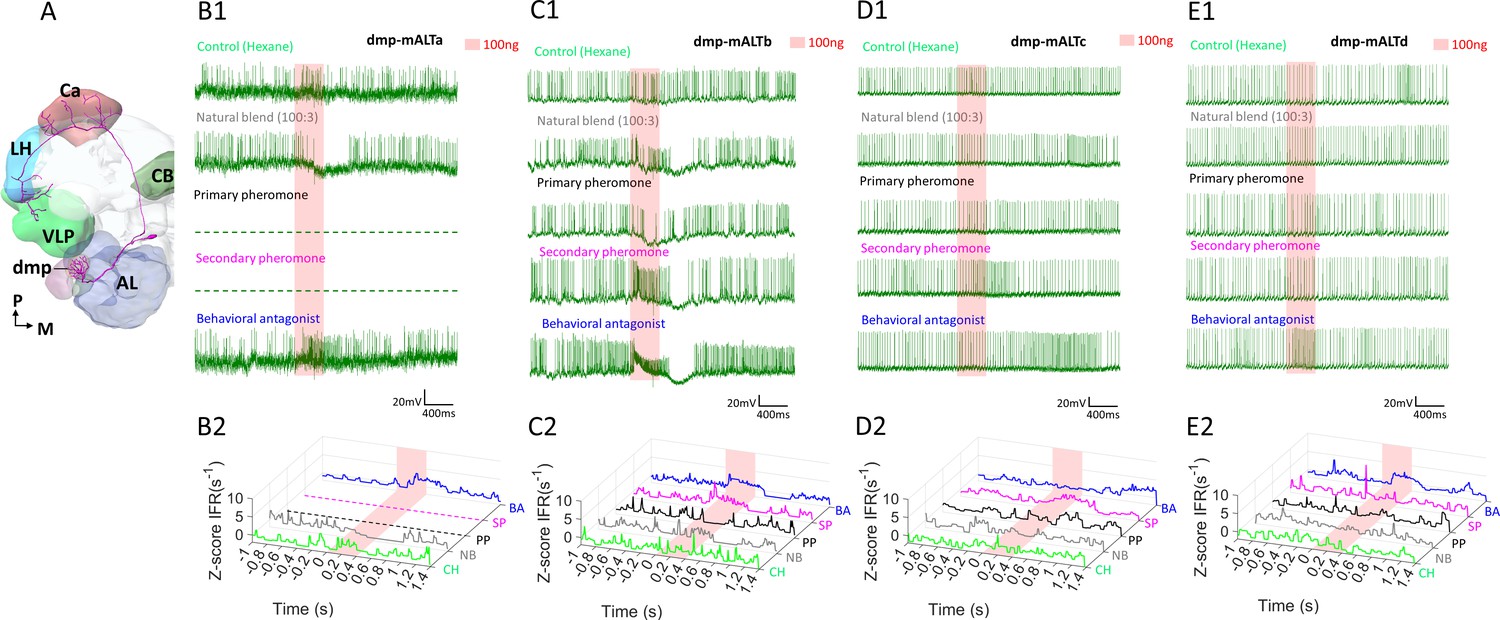
Response profiles of medial antennal-lobe tract (mALT) projection neurons (PNs) with uniglomerular dendrites in the dmp.
(A) Schematic display of a mALT PN innervating the dmp. AL, antennal lobe; Ca, calyces; CB, central body; LH, lateral horn; VLP, ventrolateral protocerebrum. M, medial; P, posterior. (B–E) Spike traces and standardized instantaneous firing rates (ZIFR) during stimulation with high concentrations of the female-produced stimuli indicated that the most prominent excitatory responses were elicited by the behavioral antagonist (BA) and/or the secondary pheromone (SP).
Figure 5—figure supplement 6
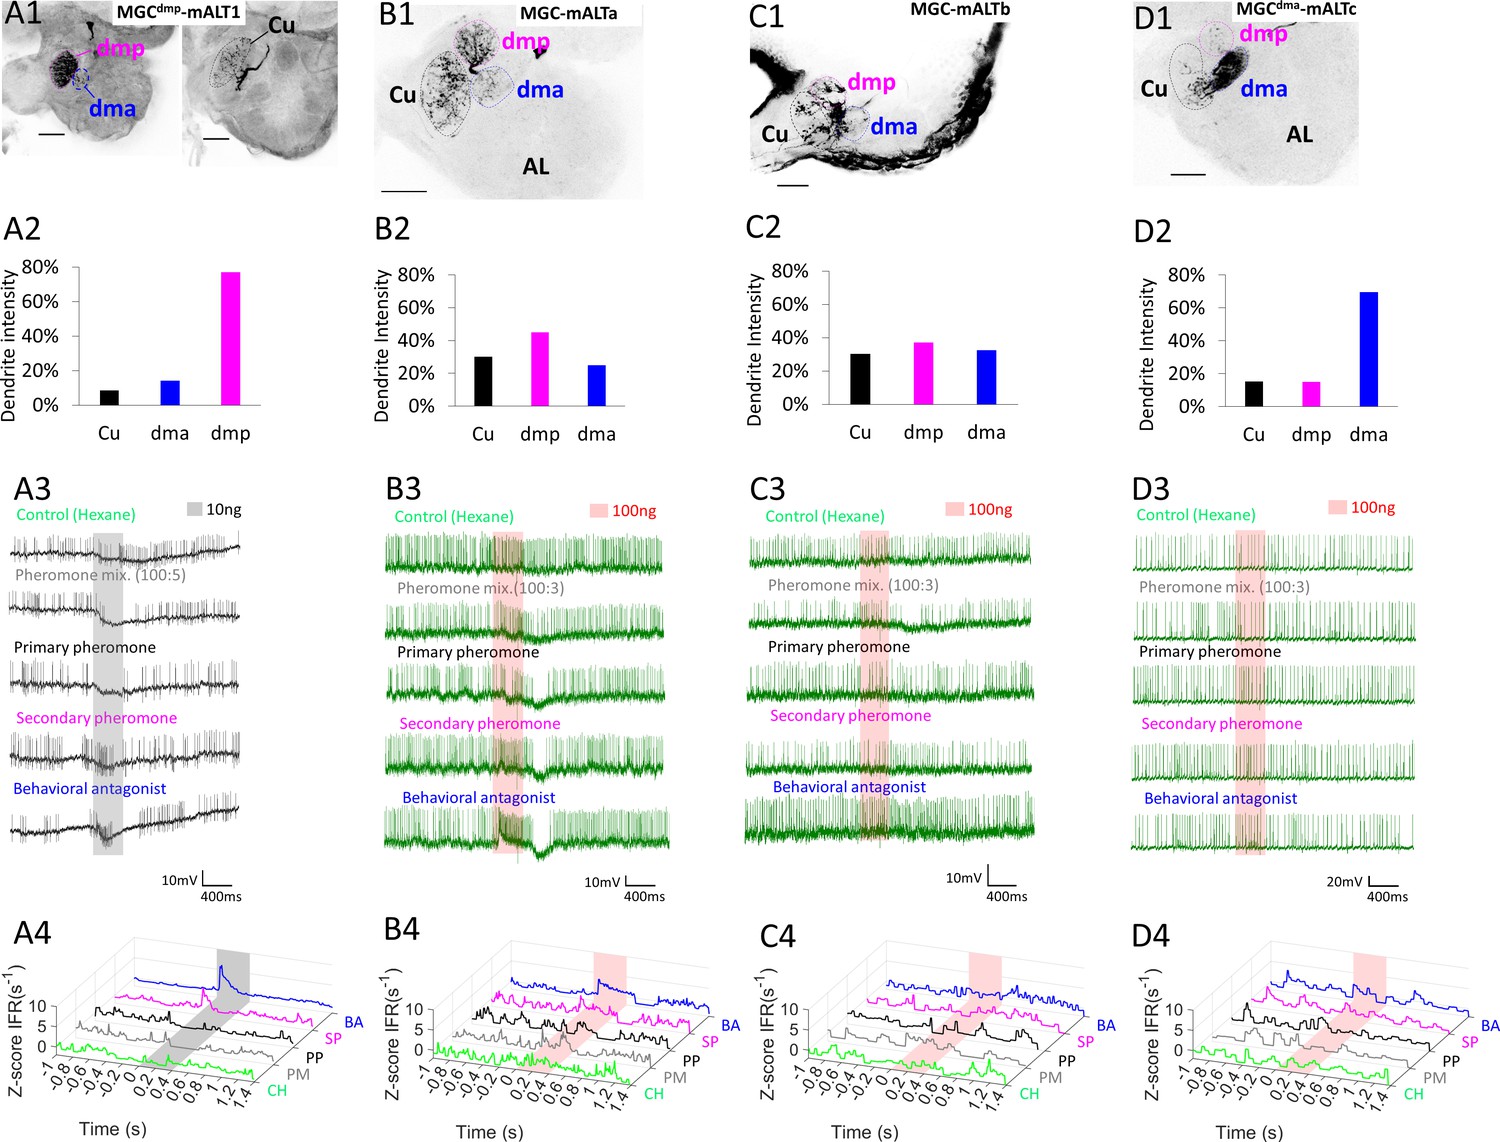
Dendritic macroglomerular complex (MGC) innervation and physiological features of multiglomerular medial antennal-lobe tract (mALT) projection neurons (PNs).
(A) The PN, MGCdmp-mALT1, had the majority of its dendrites in the dmp, along with minor innervations in the dma and cumulus (Cu; A1–A2). This neuron responded with phasic excitations to both the secondary pheromone (SP) and the behavioral antagonist (BA), and was inhibited by the pheromone mixture (PM) and the primary pheromone (PP; A3–A4). (B) The dendrites of another multiglomerural PN, MGC-mALTa, was quite evenly distributed across the MGC, yet this PN was strongly excited only by the BA stimulus. (C) A third multiglomerular PN, MGC-mALTb, also had evenly distributed dendrites, but no strong responses to any of the presented stimuli. (D) The dendrites of the fourth multiglomerular PN, MGCdma-mALTc, innervated the dma densely, while the cumulus and dmp were sparsely innervated. This PN displayed no changes in firing rates upon odor stimulation. AL, antennal lobe. Scale bars: 50 µm.
Figure 5—figure supplement 7
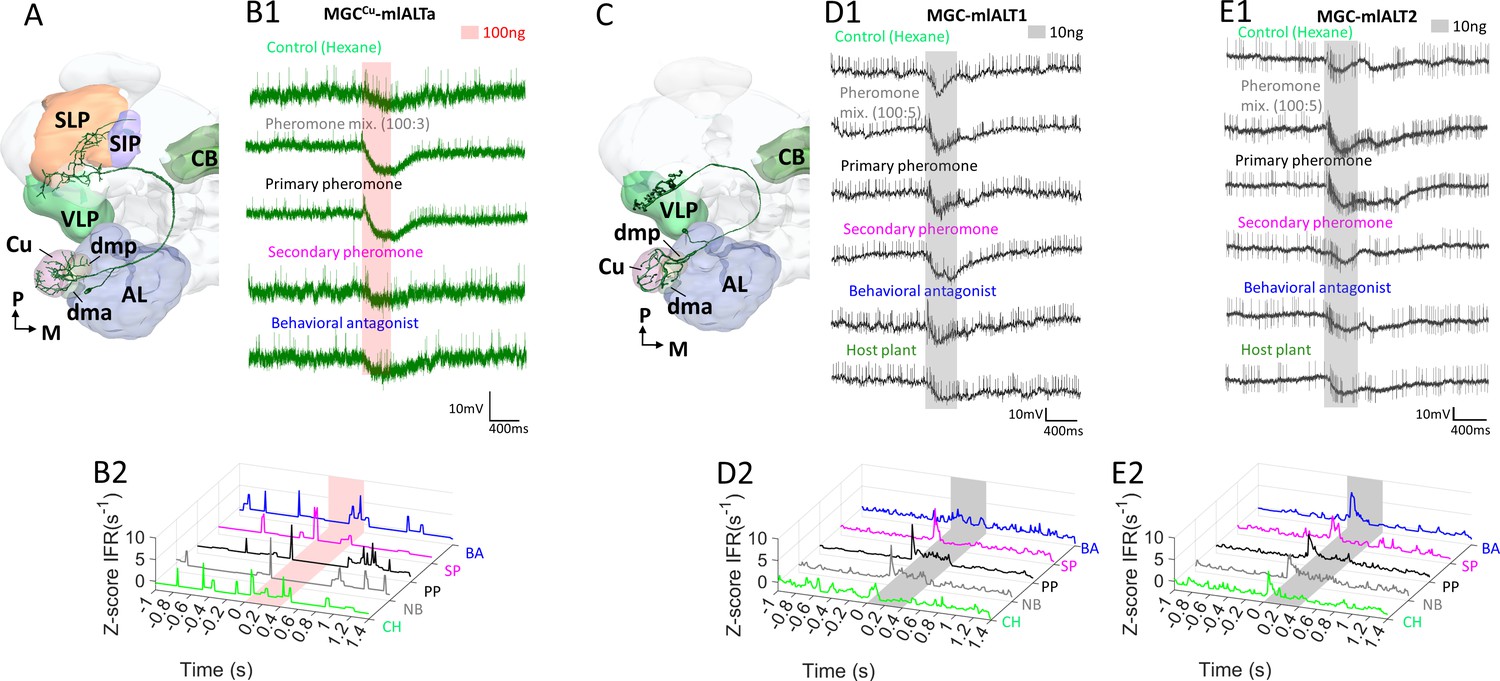
Response profiles of mediolateral antennal-lobe tract (mlALT) projection neurons (PNs) innervating the macroglomerular complex (MGC).
(A) Schematic display of a multiglomerular MGC-mlALT-PN innervating mainly the cumulus. (B) This PN, MGCCu-mlALT, arborized densely in the cumulus and had sparse dendrites in the dma, dmp, and one posterior complex glomerulus. The target areas included the ventrolateral protocerebrum (VLP) and the superior lateral protocerbrum (SLP). The neuron displayed minor early-onset excitations followed by inhibition during stimulation with the primary pheromone (PP) and the pheromone mixture (PM). (C) Schematic display of another multiglomerular mlALT PN innervating the MGC. This PN projected to the VLP exclusively. (D–E) The two multiglomerular mlALT PNs innervating all MGC units evenly were broadly tuned and displayed early-onset excitatory responses to all female-produced stimuli. Most notably, the pheromone mixture (PM) and primary pheromone (PP) elicited responses lasting throughout the entire 400 ms stimulation. In addition to the pheromone responses, MGC-mlALT2 was phasically excited by the control stimulus hexane (CH). AL, antennal lobe; CB, central body; SIP, superior intermediate protocerebrum; SLP, superior lateral protocerebrum; VLP, ventrolateral protocerebrum; M, medial; P, posterior.
Figure 6
Summary of odor representation across macroglomerular complex (MGC) units.
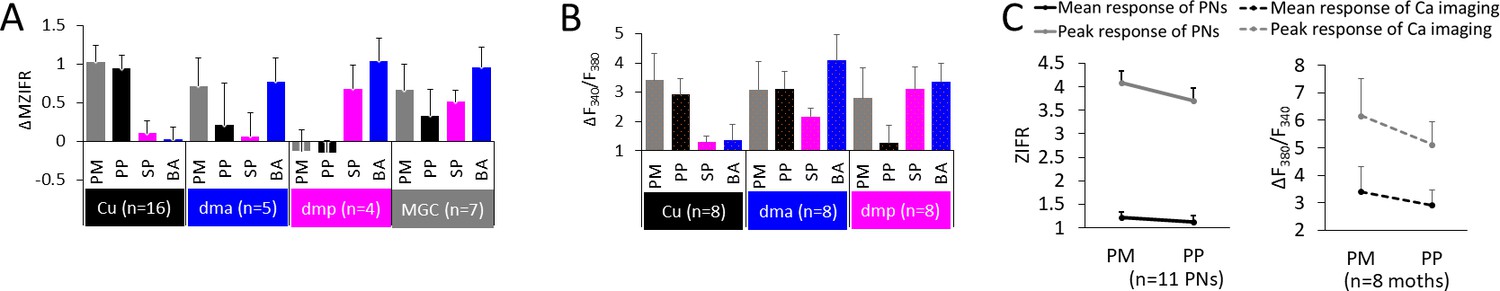
(A) Mean individual neurons’ responses (ΔMZIFR; delta mean Z-scored instantaneous firing rate, for details see 'Spike data analysis' in 'Materials and methods') of MGC medial/mediolateral-tract projection neurons (PNs) during stimulation with distinct female-produced odors, sorted according to the dendritic arborizations. Data is presented in mean + sem. Note that the PNs listed as innervating the cumulus (Cu), dma, and dmp were uniglomerular, while the PNs in the MGC category were multiglomerular. (B) Mean calcium imaging responses (ΔF340/F380) of populations of MGC medial-tract PNs during stimulation with distinct female-produced odors, sorted according to the innervated glomerulus. The ‘broad’ responses in calcium imaging, as compared with the electrophysiological data, may be derived from the inclusion of multiglomerular mALT PNs. (C) Mean responses to pheromone mixture and primary pheromone in individual PNs (left) and in calcium imaging tests (right). Data is presented in mean + sem. PM, pheromone mixture; PP, primary pheromone; SP, secondary pheromone; BA, behavioral antagonist.
Figure 7
Summary of morphological and physiological features typifying macroglomerular complex projection neurons (MGC-PNs) across the three main tracts.
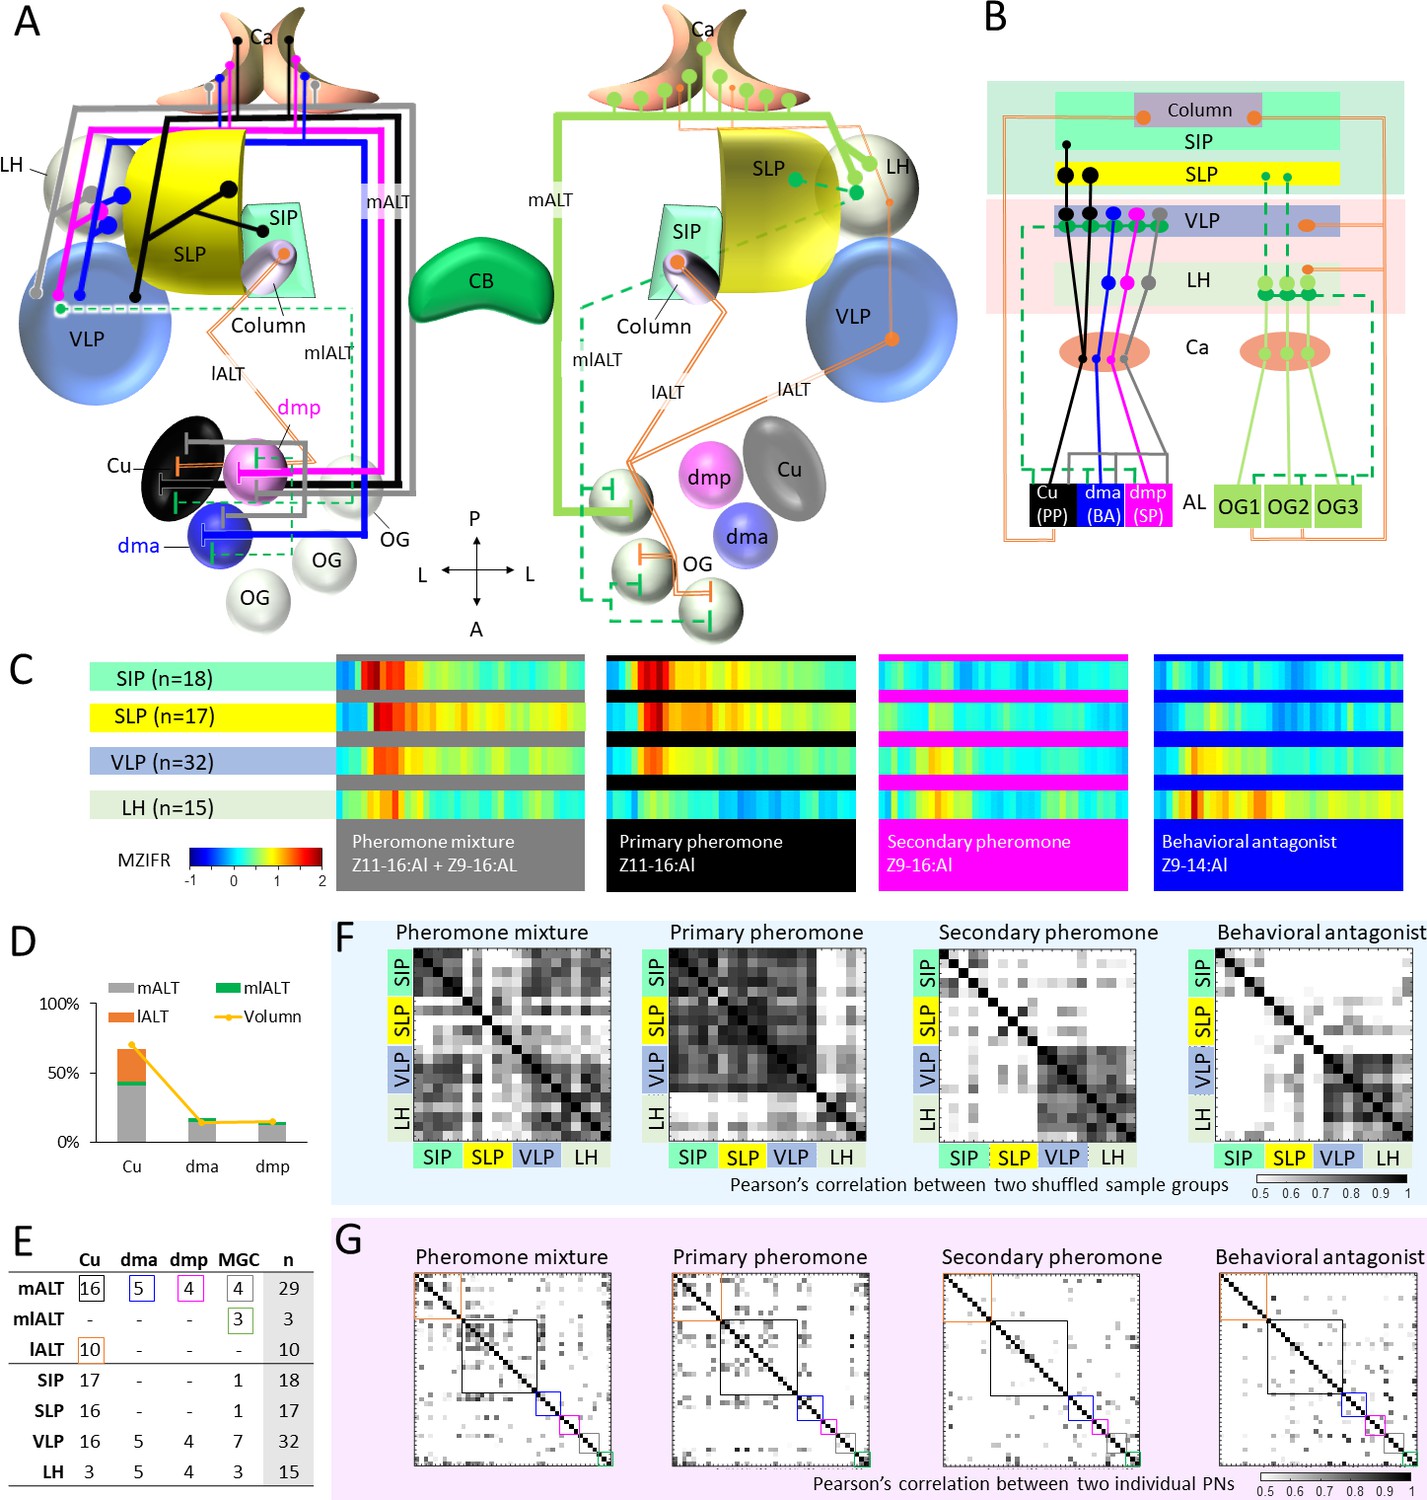
(A) A graphic representation of the olfactory pathways in male moth brain. The morphological features of MGC-PNs is displayed on the hemisphere to the left. Multiglomerular medial-tract MGC-PNs (gray) and uniglomerular PNs arborizing in the dmp (magenta) or dma (blue) project to the calyces (Ca), anteroventral LH, and VLP, while the uniglomerular PNs with dendrites in the cumulus (Cu; black) target the Ca, VLP, SLP, and posterior SIP. The multiglomerular mediolateral-tract PNs (dashed green lines) target primarily the VLP, whereas the uniglomerular lateral-tract PNs innervating the cumulus run directly to the column in the anterior SIP (Chu et al., 2020a). In the hemisphere to the right, a plethora of different PN types arborizing in the ordinary glomeruli (OG) and innervating several lateral protocerebral neuropils are indicated (Ian et al., 2016; Kymre et al., 2021). (B) Scheme illustrating projections of MGC-PNs versus OG-PNs in the higher brain regions. The three main antennal lobe tracts (ALTs) are illustrated: Solid line, medial antennal-lobe tract (mALT); dashed line, mediolateral ALT (mlALT); double line, lateral ALT (lALT). (C) An overview of temporal response properties implied by the mean firing rate during odor stimulation (MZIFR; mean Z-scored instantaneous firing rate) of the assembly of PNs projecting to the same neuropil. The PNs included in this framework are shown in (E). Note that these PNs were sampled from the antennal lobe, while the length of axons and action potential transmission rates have not been included, the actual timing of synaptic output onto the protocerebral neuropils is thereby not represented. (D) Correspondence between the proportion of sampled neurons originating from each of the MGC units and that of the volume of each MGC unit (volume data from Zhao et al., 2016) shows that our sampling strategy for the proposed framework (C) reflects the composition of the actual MGC-PN population. (E) Summary of recorded and labelled PNs’ morphologies across the three main tracts, including 10 lALT MGC-PNs from our previous study (Chu et al., 2020a). (F) Computational experiment with shuffled electrophysiological data indicating correlation between PN responses to attractive versus non-attractive stimuli and separated output areas. The data shuffling was repeated five times, and each time two-thirds of the PNs projecting to the same neuropil were randomly recruited into the data assembly. The cross correlations between each of the data assemblies showed that neuronal response profiles were consistent with the neuropils associated with different behavioral valences. (G) Cross-correlations of the firing traces between every two PNs. The neuron types are indicated by the color-coded boxes, in correspondence with (E). AL, antennal lobe; Ca, calyces; CB, central body; LH, lateral horn; OG, ordinary glomeruli; SIP, superior intermediate protocerebrum; SLP, superior lateral protocerebrum; VLP, ventrolateral protocerebrum. A, anterior; L, lateral; P, posterior.
Videos
Video 1
Confocal stacks of neuron Cu-mALT2.
The uniglomerular medial-tract neuron innervating the cumulus projects to the calyces, the ventrolateral protocerebrum (VLP), the superior lateral protocerebrum (SLP), and the superior intermediate protocerebrum (SIP).
Video 2
Confocal stacks of neuron dmp-mALTc.
The uniglomerular medial-tract neuron innervating the dmp unit projects to the calyces, the ventrolateral protocerebrum (VLP), and the lateral horn (LH).
Video 3
Confocal stacks of neuron dma-mALTa.
The uniglomerular medial-tract neuron innervating the dma unit projects to the calyces, the ventrolateral protocerebrum (VLP) and the lateral horn (LH), with extended terminals approaching the superior lateral protocerebrum (SLP).
Video 4
Confocal stacks of neuron dma-mALTb.
The uniglomerular medial-tract neuron innervating the dma unit projects to the calyces, the ventrolateral protocerebrum (VLP) and the lateral horn (LH).
Video 5
Confocal stacks of neuron dmaPCx-mALTa.
The multiglandular medial-tract neuron innervating the dma unit and three posterior complex glomeruli projects to the calyces, the ventrolateral protocerebrum (VLP), and the lateral horn (LH).
Video 6
Confocal stacks of neuron MGC-mALTa.
The multiglandular medial-tract neuron has dendrites evenly distributed across three macroglomerular complex (MGC) units. It projects to the calyces, the ventrolateral protocerebrum (VLP) and the lateral horn (LH).
Video 7
Confocal stacks of neuron MGCdma-mALTc.
The multiglandular medial-tract neuron innervates the dma densely, while the cumulus and dmp are sparsely innervated. It projects to the calyces and the ventrolateral protocerebrum (VLP).
Video 8
Confocal stacks of neuron MGCdmp-mALT1.
The multiglandular medial-tract neuron innervates the dmp densely, while the cumulus and dma are sparsely innervated. It projects to the calyces, the ventrolateral protocerebrum (VLP), and the lateral horn (LH).
Video 9
Confocal stacks of neuron MGC-mlALT1.
The multiglandular mediolateral-tract neuron innervating the macroglomerular complex (MGC) units evenly projects to the ventrolateral protocerebrum (VLP) with blebby terminals.
Video 10
Confocal stacks of neuron MGCCu-mlALTa.
The multiglandular mediolateral-tract neuron mainly innervating the cumulus has sparse dendrites in the dma and the dmp units. It projects to the ventrolateral protocerebrum (VLP), the superior lateral protocerebrum (SLP), and the superior intermediate protocerebrum (SIP).
Tables
Author response table 1
| Factor | Protocol (Between two protocols) | ||||
|---|---|---|---|---|---|
| Interval in stimulation window | 0-400 ms | 0-100 ms | 100-200 ms | 200-300 ms | 300-400 ms |
| bins | 1-40 | 1-10 | 11-20 | 21-30 | 31-40 |
| df | 1 | 1 | 1 | 1 | 1 |
| error | 8 | 8 | 8 | 8 | 8 |
| F | 0.47 | 0.18 | 0.26 | 0.01 | 1.96 |
| p | 0.29 | 0.69 | 0.63 | 0.91 | 0.20 |
| Factor | Protocol x Bin (Interaction effect of protocols and bins) | ||||
| Interval in stimulation window | 0-400 ms | 0-100 ms | 100-200 ms | 200-300 ms | 300-400 ms |
| bins | 1-40 | 1-10 | 11-20 | 21-30 | 31-40 |
| df | 39 | 9 | 9 | 9 | 9 |
| error | 312 | 72 | 72 | 72 | 72 |
| F | 0.56 | 0.42 | 0.92 | 1.00 | 0.79 |
| p | 0.99 | 0.92 | 0.52 | 0.45 | 0.63 |
Additional files
Download links
A two-part list of links to download the article, or parts of the article, in various formats.
Downloads (link to download the article as PDF)
Open citations (links to open the citations from this article in various online reference manager services)
Cite this article (links to download the citations from this article in formats compatible with various reference manager tools)
Distinct protocerebral neuropils associated with attractive and aversive female-produced odorants in the male moth brain
eLife 10:e65683.
https://doi.org/10.7554/eLife.65683


