The mechanism underlying transient weakness in myotonia congenita
- Department of Neuroscience, Cell Biology and Physiology, Wright State University, United States
- Department of Dermatology & Cutaneous Surgery, University of Miami, United States
- Evokes LLC, United States
- Naval Medical Research Unit, Wright Patterson Air Force Base, United States
- Department of Pharmacology, Medical University of Innsbruck, Austria
- Department of Biology, Wright State University, United States
Figures
Figure 1
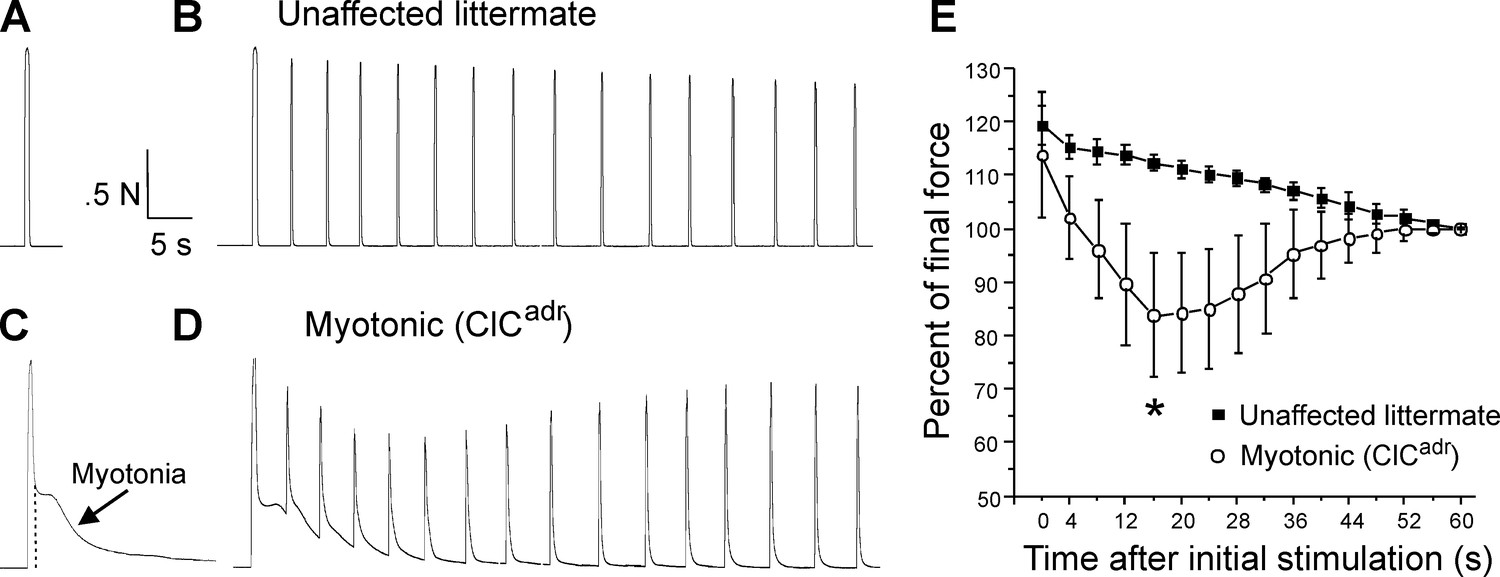
Transient weakness in the ClCadr mouse model of recessive myotonia.
(A) Shown is a force trace from a triceps surae muscle group of an unaffected littermate in response to stimulation of the sciatic nerve with 45 pulses at 100 Hz. (B) The force trace generated by following the initial stimulus with 15 pulses at 100 Hz delivered every 4 s. (C) In a ClCadr mouse, following the 45 pulses at 100 Hz (indicated by the dotted vertical line) there was continued force generation secondary to myotonia. (D) With stimulation every 4 s transient weakness was revealed. (E) Plot of the force normalized to force at 60 s in unaffected littermates and ClCadr mice. Transient reduction in force was present in ClCadr mice (*, p=0.00015 vs unaffected littermates at 16 s, t-test, 95% confidence interval 110–114 vs 75–93). n = 5 unaffected littermates and n = 9 ClCadr mice. Error bars represent ± SD.
Figure 2
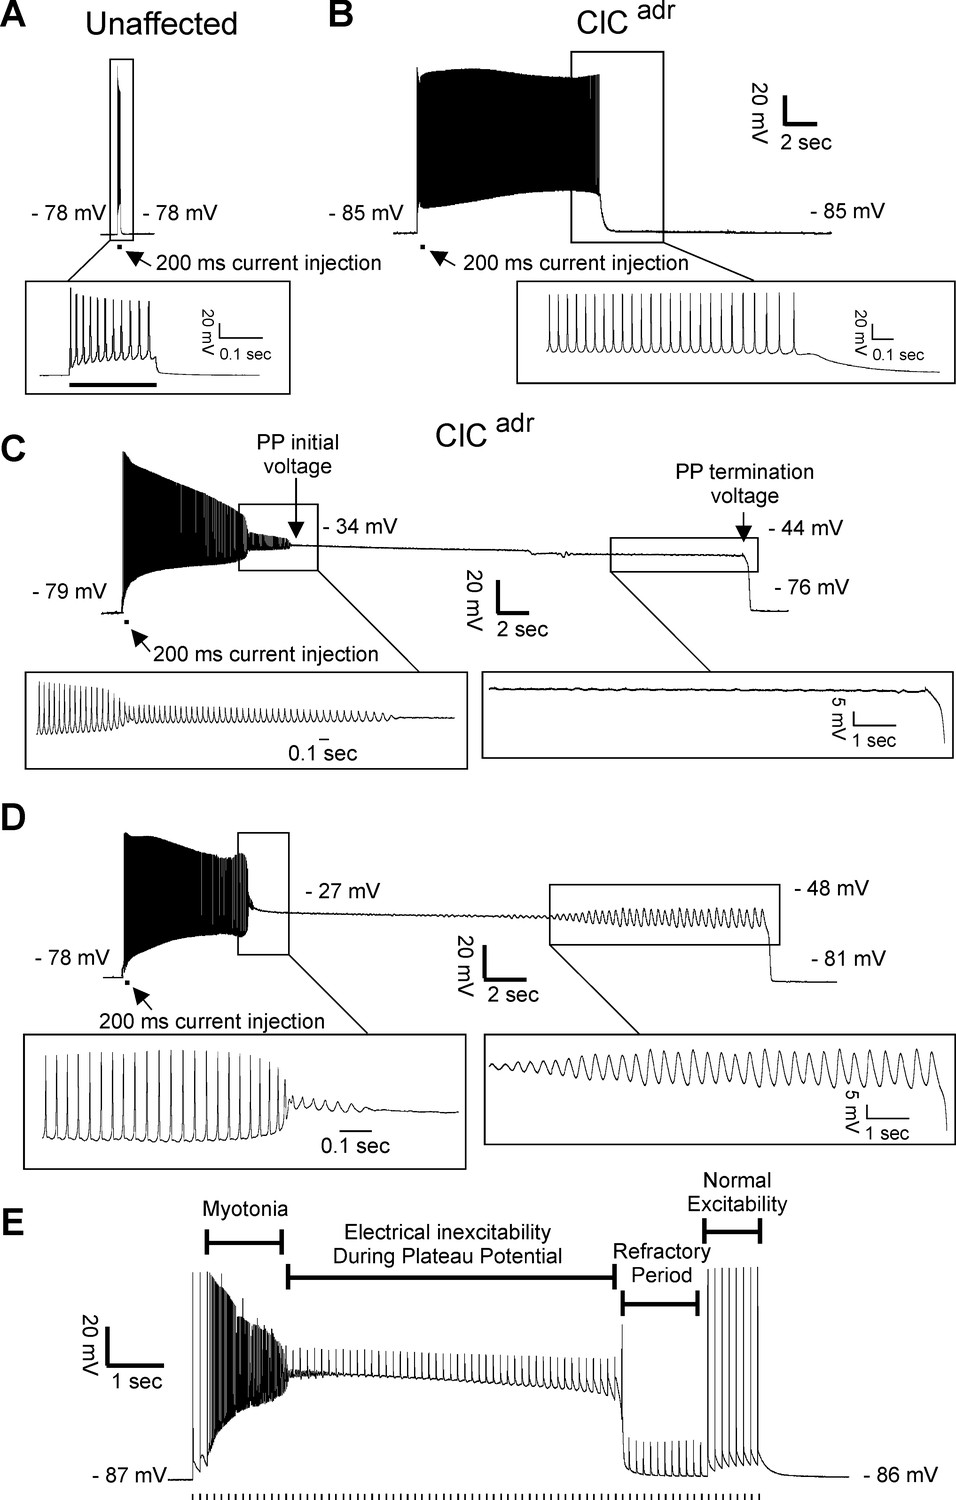
Plateau potentials in ClCadr muscle.
For A–D, the insets show portions of the traces on an expanded time base. (A) The response of muscle from an unaffected littermate to injection of 200 ms of depolarizing current (horizontal bar below the voltage trace); note that action potentials stop when current stops. (B–D) Traces of myotonia triggered by a 200 ms injection of depolarizing current from three different ClCadr muscle fibers. The following membrane potentials are identified in C and D: membrane potential prior to stimulation, initial membrane potential during the plateau potential, membrane potential prior to the termination of the plateau potential, and membrane potential following repolarization. (E) Development of a plateau potential during repetitive stimulation at 8 Hz (stimuli represented by vertical hash marks under the recording).
Figure 3
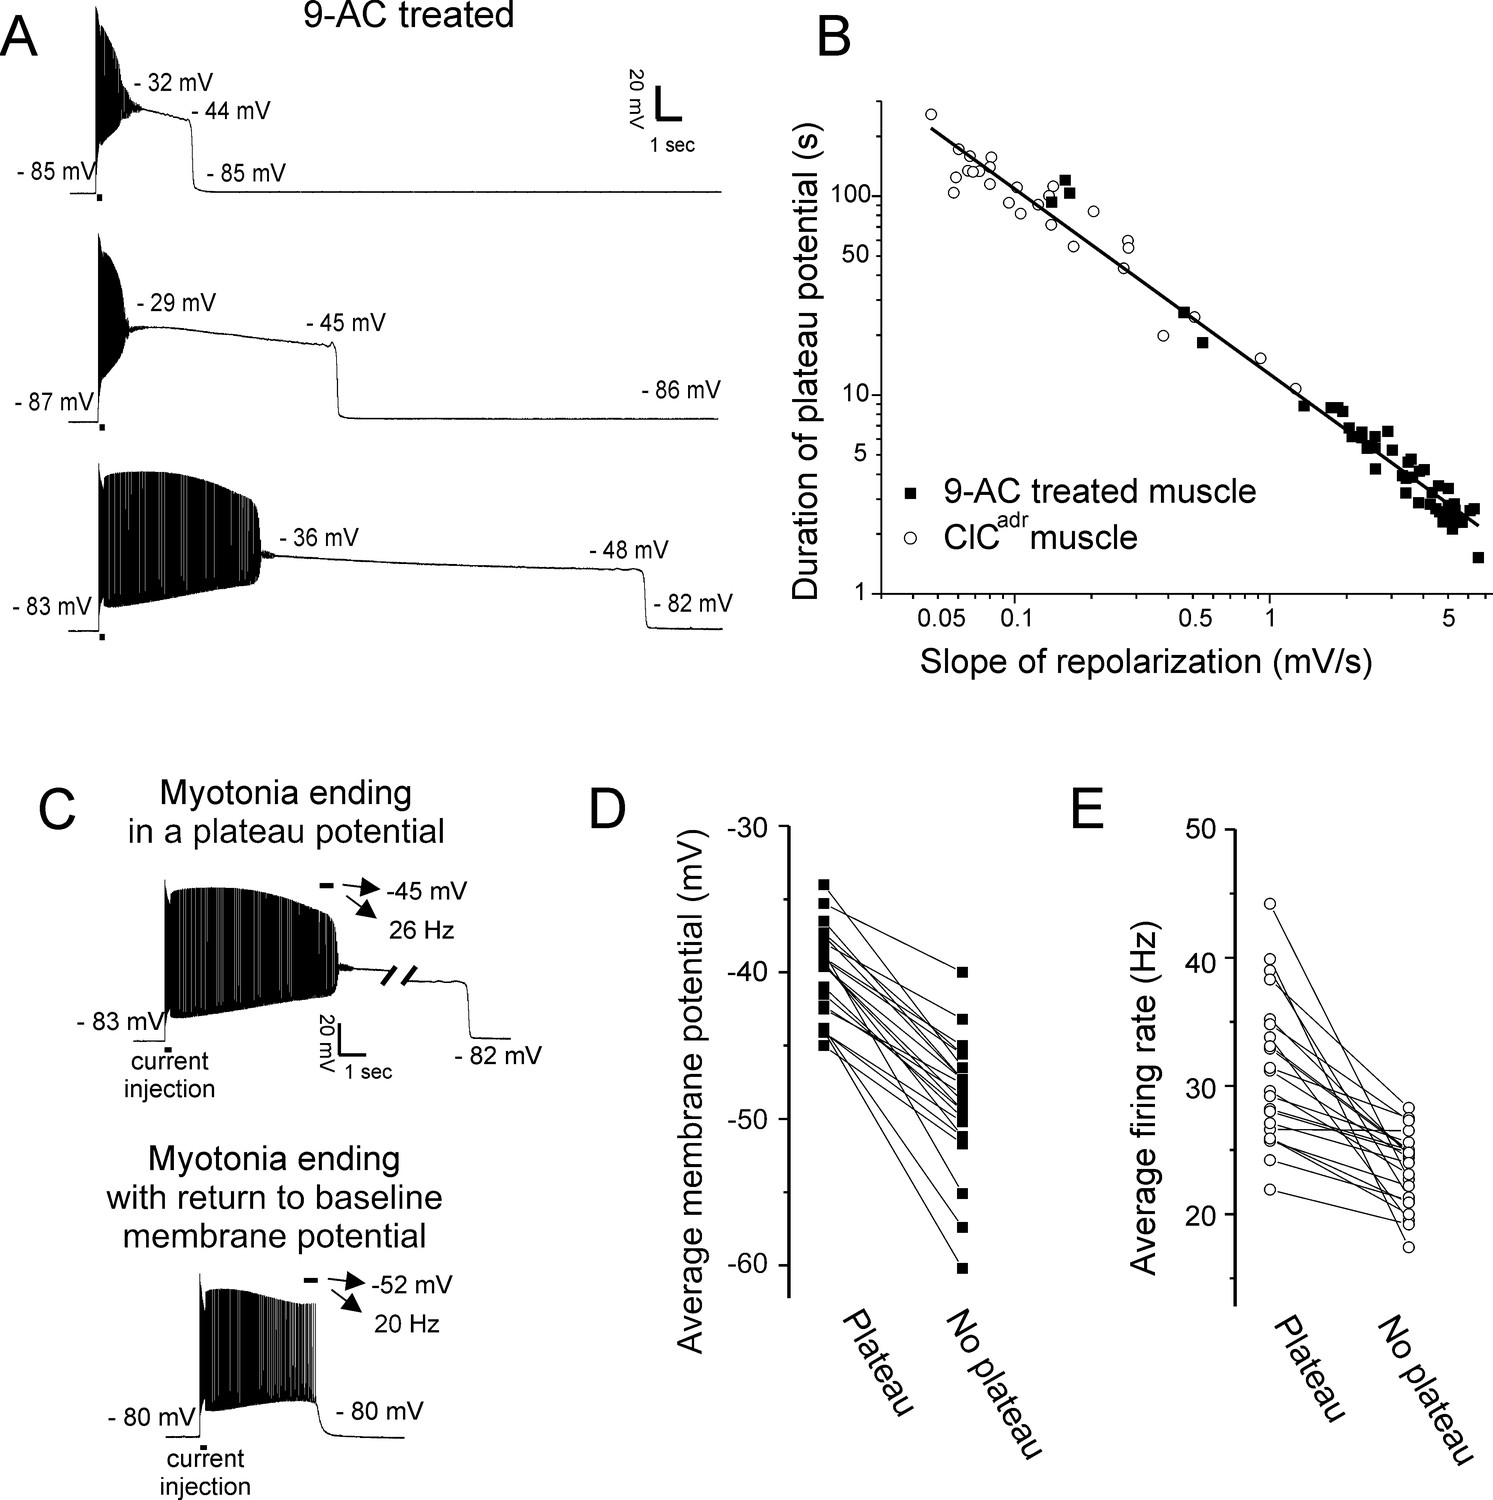
Characterization of plateau potentials.
(A) Three examples of plateau potentials of different duration in 9-AC treated muscle. The 200 ms current injection is indicated by a horizontal bar underneath the trace. Indicated on each trace is the membrane potential at the start and end of the plateau potential. (B) The duration of plateau potentials in the ClCadr and 9-AC models of myotonia plotted against the rate of repolarization during the plateau potential. A linear fit was performed on the log–log plot with an R2 value of 0.98 and a slope of −0.93. (C) Shown are two runs of myotonia from the same muscle fiber, one ending in a plateau potential and one ending with repolarization. The mean membrane potential and firing rate in the final 500 ms of myotonia (horizontal bar) are indicated by the arrows above each trace. (D) Plot of the average membrane potential during the final 500 ms of myotonia for 22 fibers in which there were both a run of myotonia ending in a plateau potential and a run ending with repolarization (no plateau potential). (E) Plot of the average firing rate during the final 500 ms of myotonia for the same 22 fibers.
Figure 4
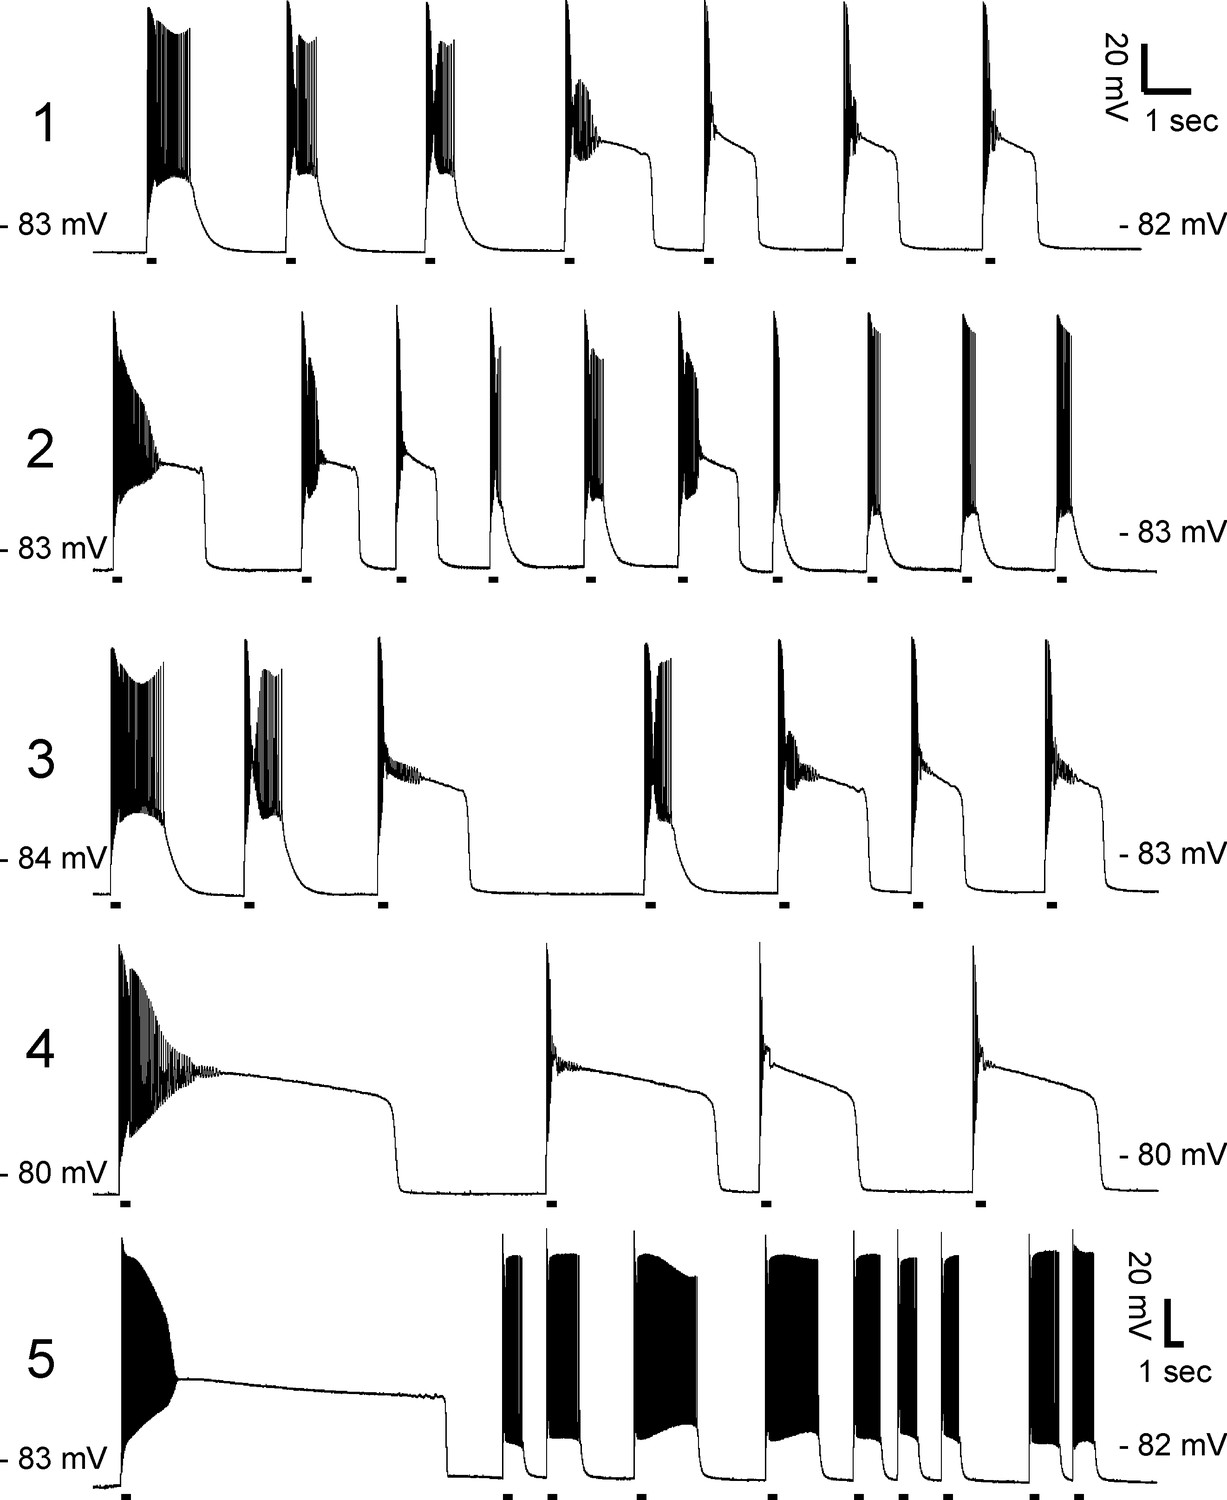
Lack of correlation between duration of myotonia and development of plateau potentials.
Exemplary prolonged intracellular recordings of plateau potentials from 9-AC treated muscle fibers (n = 5 fibers). There is no consistent relationship between duration of myotonia and development of plateau potentials. The horizontal lines under each trace mark 200 ms injections of depolarizing current.
Figure 5
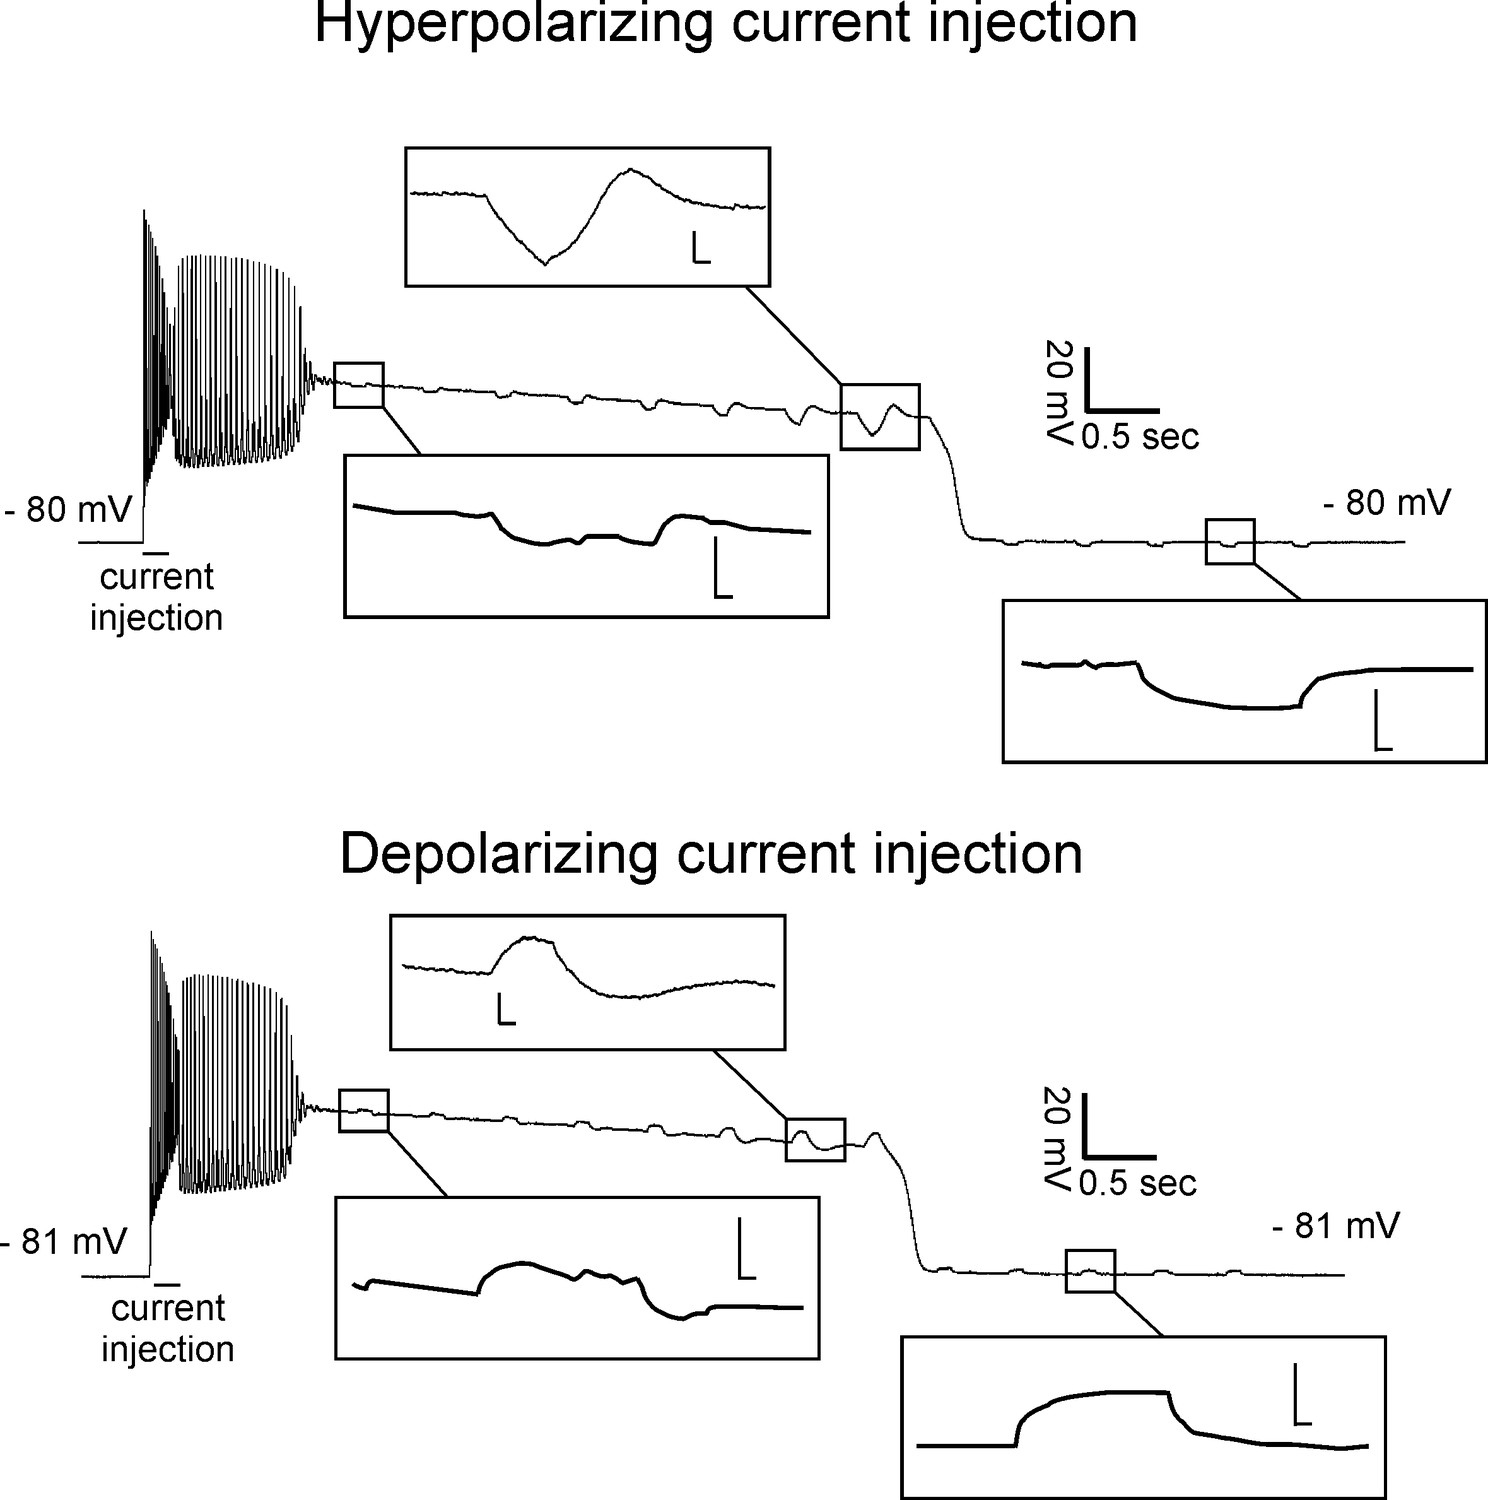
Reduced input resistance during the early phase of plateau potentials.
Shown are recordings with 200 ms injections of hyperpolarizing (top) or depolarizing (bottom) current during two plateau potentials from a 9-AC treated fiber. Insets show the trace on an expanded voltage and time axis (scale bars of insets 4.0 mV and 0.02 s).
Figure 6
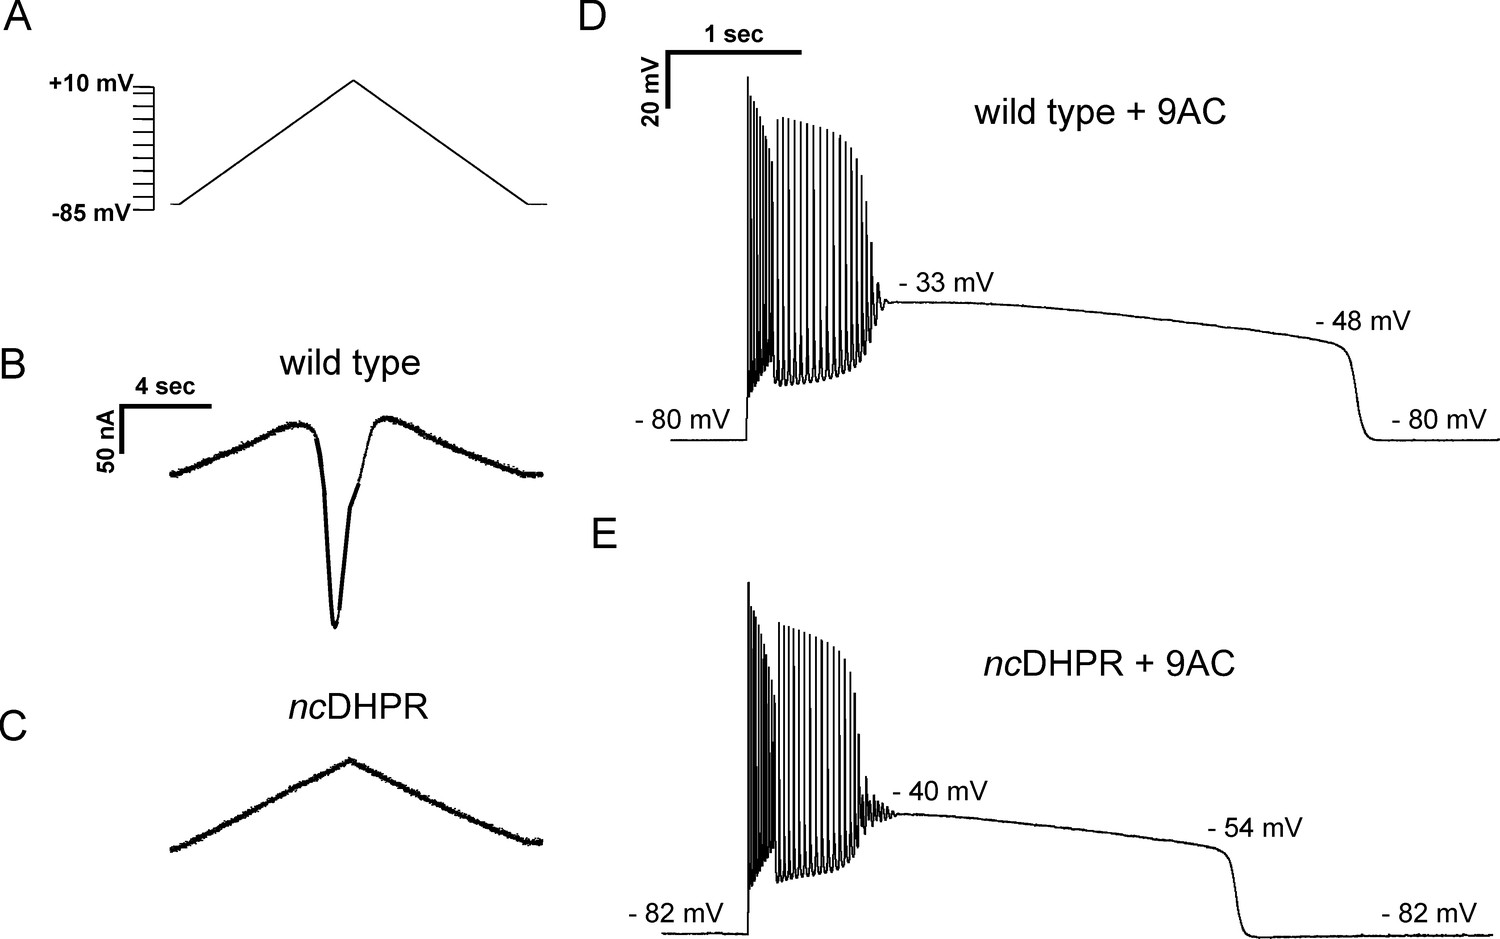
Current flow through Cav1.1 does not initiate, but helps to sustain, plateau potentials in 9-AC treated muscle.
(A) The voltage protocol applied to FDB/IO fibers consisted of a ramp depolarization from −85 mV to +10 mV applied over 8 s. (B) A large inward current is present in wild-type muscle when Na+, K+, and Cl− currents were blocked. (C) ncDHPR muscle fibers confirm the absence of inward Ca2+ current as there is only the linear change in current due to the changing command potential. (D) A plateau potential in a 9-AC treated wild-type muscle fiber. (E) A plateau potential in a 9-AC treated ncDHPR fiber.
Figure 7
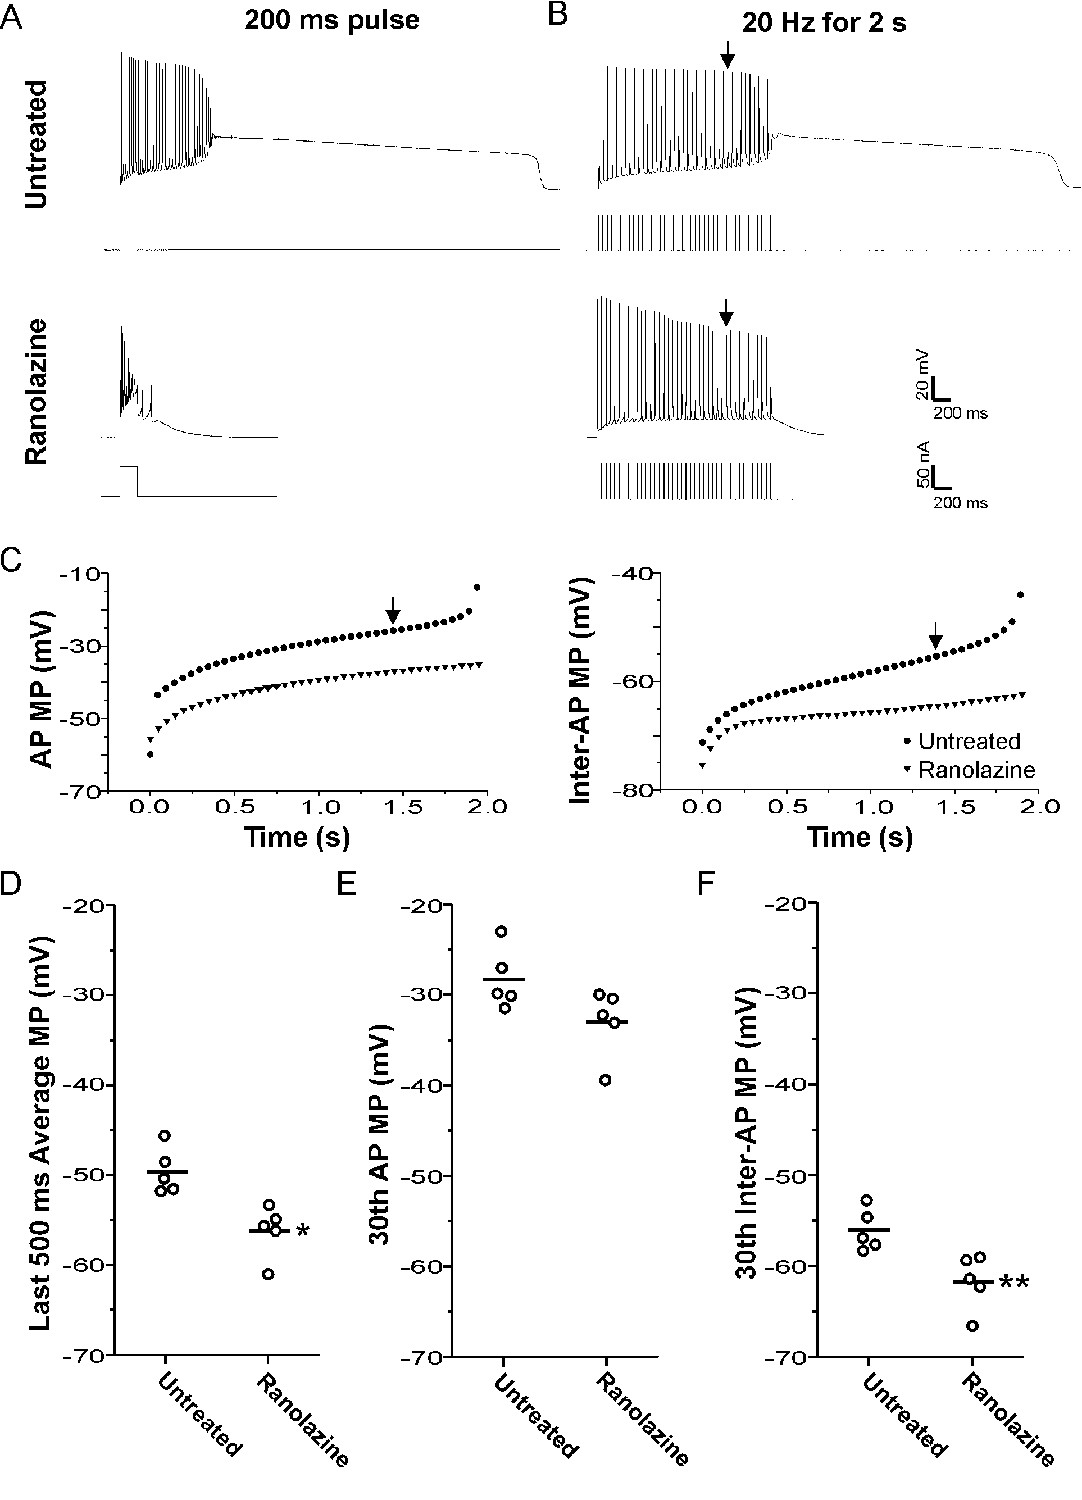
Block of plateau potentials by ranolazine in 9-AC treated muscle is associated with lessening of depolarization during repetitive firing.
(A) Examples of the response to a 200 ms injection of depolarizing current at baseline and following treatment with 40 µM ranolazine. (B) Examples of the response to 2 s of stimulation at 20 Hz. The vertical arrow points to the 30th action potential in each trace, which was used for the analysis of differences between ranolazine untreated and ranolazine treated muscle (D–F). (C) Plots of the membrane potential during the 8 ms encompassing the action potential and the 42 ms encompassing the interspike interval for the untreated and ranolazine traces shown in B. Each point represents the value for a single action potential during the 2 s of 20 Hz stimulation. Action potential MP = the mean membrane potential during the 8 ms encompassing the action potential, Inter-AP MP = the mean membrane potential during the 42 ms interspike interval. (D) Plot of the mean membrane potential during the last 500 ms of stimulation. Each point represents an animal average derived from at least four fibers without (n = 5) and with treatment with ranolazine (n = 5). The horizontal line represents the mean. (E and F) Plots of the mean membrane potential during the 30th action potential and the 30th interspike interval. * indicates p=0.005 (t-test), **p=0.01 (t-test).
Figure 8
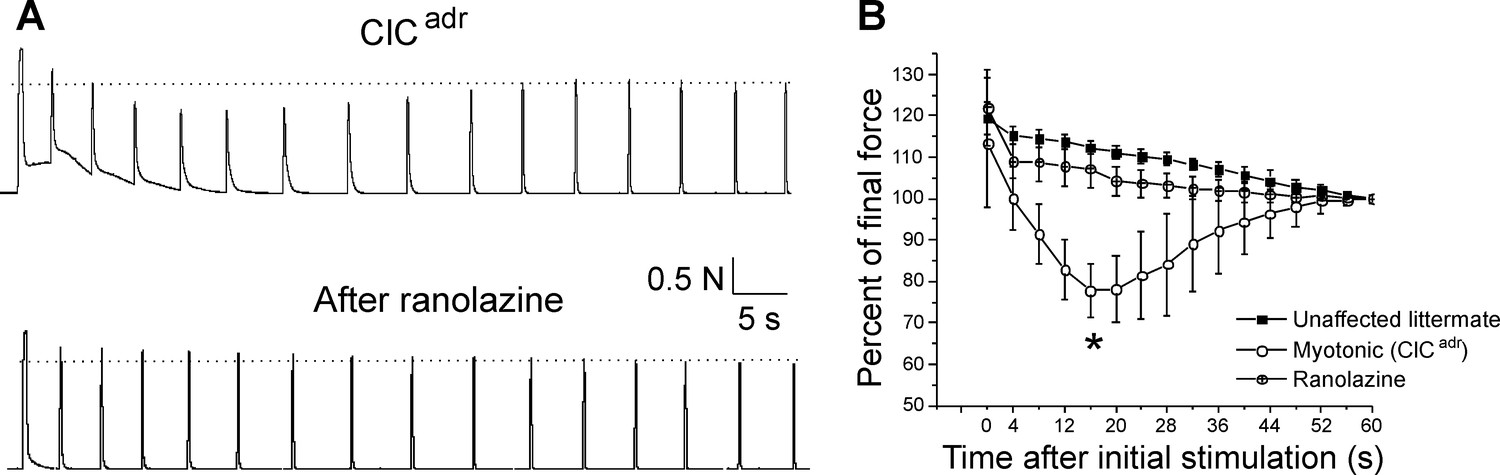
Ranolazine eliminates transient weakness in vivo.
(A) Shown are the force traces from a triceps surae muscle group before and 45 min after i.p. injection of 50 mg/kg ranolazine. (B) Shown is the mean normalized force in 5 ClCadr mice before and after injection of ranolazine. p=0.001 for the difference in force 16 s (*) after the initial stimulation (paired t-test, 95% confidence interval 70–86 vs 102–113). The unaffected littermate data from Figure 1 is replotted here to allow for comparison.
Figure 9
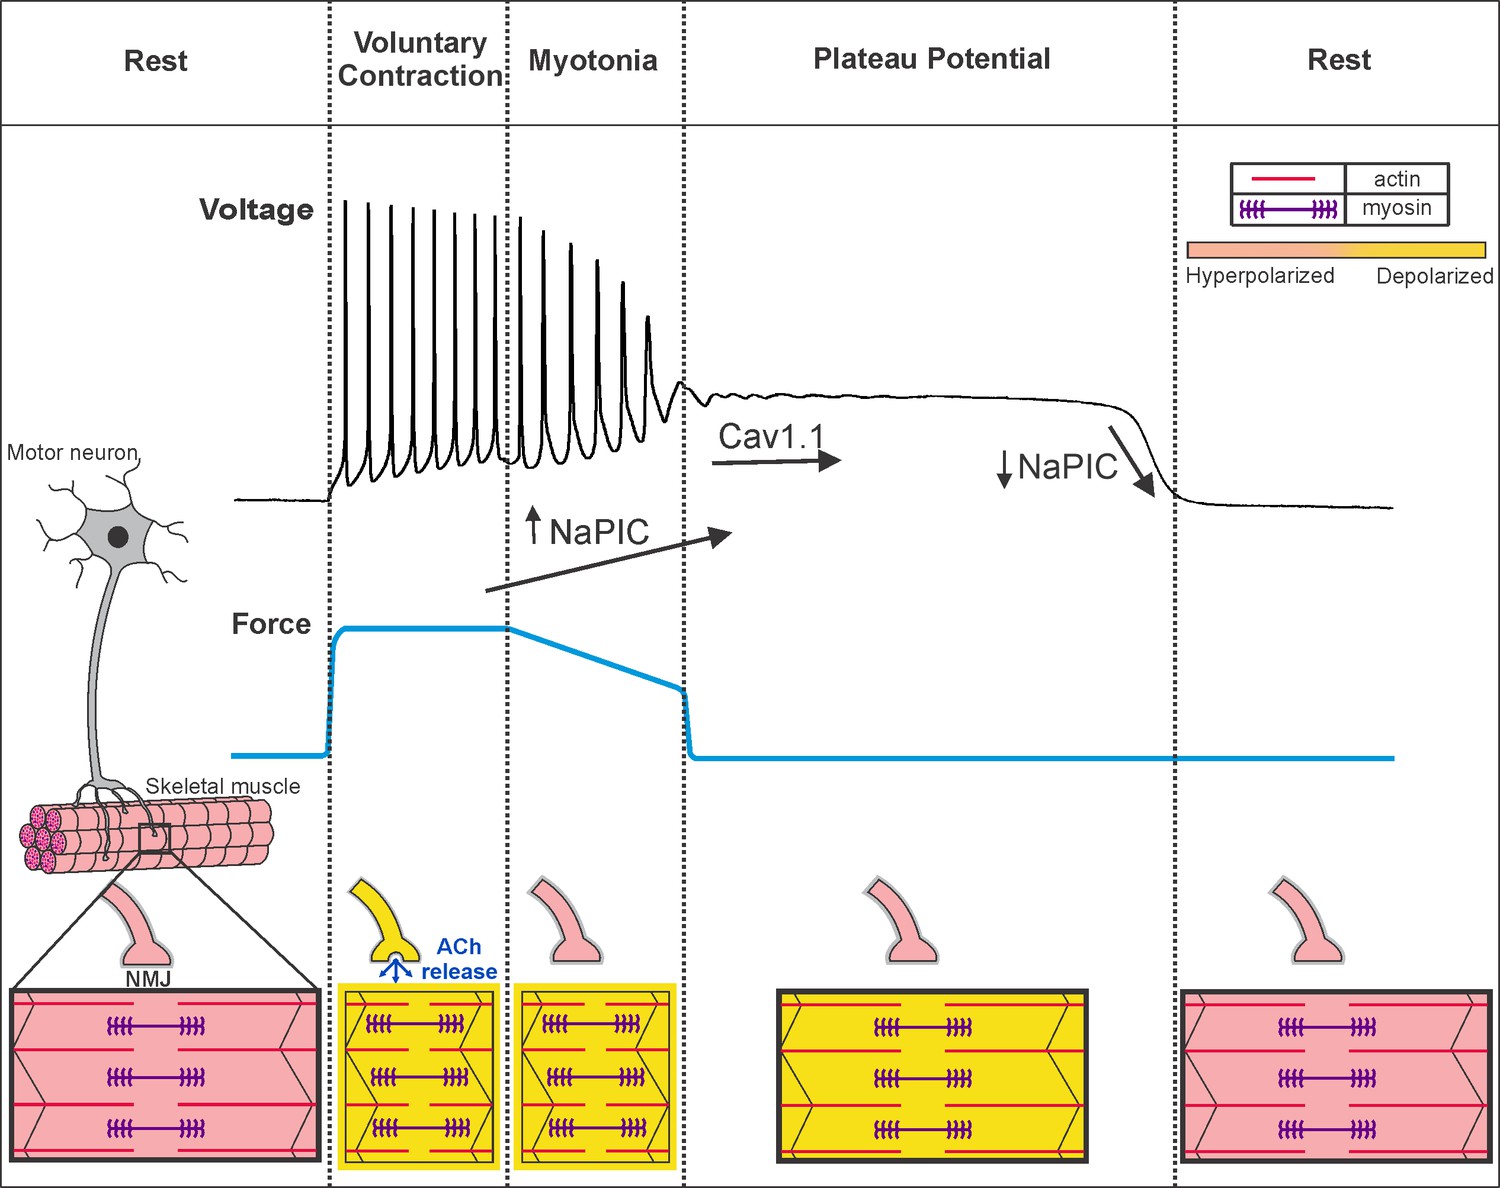
Voluntary contraction in myotonia congenita triggers a sequential progression through states of hyperexcitability and inexcitability.
Shown on the left is a motor unit consisting of a motor neuron and the muscle fibers it innervates. At rest, both the motor neuron and muscle fibers are hyperpolarized and muscle is relaxed. To initiate voluntary contraction, the motor neuron fires repeated action potentials, which activate the neuromuscular junction (NMJ) to trigger repeated firing of action potentials in muscle (indicated by a yellow outline around the fiber). With the rapid firing of muscle action potentials, there is sustained contraction and force production (blue line). At the end of voluntary contraction, the motor neuron stops firing and the NMJ repolarizes, but in myotonic muscle there is continued involuntary firing of action potentials, which slows relaxation of muscle. When myotonia is terminated by transition into a plateau potential, muscle remains depolarized but cannot fire action potentials (black outline of the fiber), such that muscle is paralyzed. Finally, there is sudden repolarization and return of muscle to the resting state. Under the voltage trace our hypothesis regarding the contribution of NaPIC and current through CaV1.1 channels is illustrated. NaPIC begins to turn on at the end of voluntary contraction and triggers myotonia. In some runs of myotonia, NaPIC continues to increase and contributes to initiation of plateau potentials. The initial plateau potential voltage is sufficiently depolarized to trigger opening of CaV1.1 channels, which help to sustain plateau potentials. The gradual repolarization during plateau potentials causes CaV1.1 channels to close prior to termination of the potential. Rapid, voltage-dependent closing of Na+ channels in the NaPIC mode contributes to termination of plateau potentials. ACh = acetylcholine.
Tables
Table 1
Plateau potential parameters in ClCadrand 9-AC treated unaffected muscle.
| Pre-myotonia vm (mV) | Initial PP vm (mV) | PP repol slope (mV/s) | Final PP vm (mV) | Max repol rate (mV/s) | Post PP vm (mV) | Duration of PP (s) | |
|---|---|---|---|---|---|---|---|
| ClCadr | −80.4 ± 2.9 (-80.0) | −35.2 ± 4.2 (−35.8) | −0.25 ± 0.19 (−0.17) | −46.3 ± 2.9 (−46.7) | 250 ± 78 (246) | −80.4 ± 2.9 (−79.7) | 81.9 ± 47.6 (74.4) |
| 9-AC | −81.5 ± 2.6 (-82.4) | −31.2 ± 3.1* (−31.4) | −3.4 ± 1.8** (−3.5) | −45.2 ± 2.3 (−45.1) | 197 ± 44+ (192) | −80.8 ± 2.9 (−81.6) | 11.7 ± 25.0++ (4.1) |
-
Shown are the mean value ± the standard deviation for parameters of plateau potentials in ClCadr fibers and 9-AC treated fibers. Below the mean value is the median value in parenthesis. n = 26 fibers with plateau potentials from 10 ClCadr mice and 49 fibers with plateau potentials from eight unaffected muscles treated with 9-AC. Vm is membrane potential, and repol is repolarization. Pre-myotonia Vm is the resting membrane potential prior to stimulation. Initial PP Vm is the membrane potential at the beginning of the plateau potential. Final PP Vm is the membrane potential prior to the sudden repolarization terminating the plateau potential. Max repol rate is the maximum rate of repolarization during the sudden repolarization. Post PP Vm is the membrane potential following termination of the plateau potential. * indicates p<0.05, ** indicates p<1 × 10⁻²⁰ of log transformed data. + indicates p<0.01. ++ indicates p<1 × 10⁻¹⁸ of log transformed data.
Table 2
Plateau potential parameters in 9-AC treated wild-type and ncDHPR muscle.
| Pre-myotonia vm (mV) | Initial plateau vm (mV) | PP repol slope (mV/s) | Final PP vm (mV) | Max repol rate (mV/s) | Post PP vm (mV) | Duration of PP (s) | |
|---|---|---|---|---|---|---|---|
| Wild type | −79.3 ± 0.9 (−79.5) | −36.0 ± 1.6 (−36.0) | −3.3 ± 0.7 (−3.1) | −48.1 ± 1.2 (−48.5) | −125 ± 6 (125) | −79.5 ± 0.4 (−79.7) | 3.9 ± 0.7 (3.8) |
| ncDHPR | −78.9 ± 0.6 (−79.0) | −37.2 ± 0.8 (−37.1) | −5.4 ± 0.6* (−5.3) | −49.2 ± 1.1 (−49.7) | −134 ± 10 (138) | −79 ± 0.8 (−79.3) | 2.4 ± 0.3* (2.3) |
-
Shown are the mean value and the standard deviation for parameters of plateau potentials in 9-AC treated wild-type and ncDHPR fibers. Below the mean value in parentheses is the median value. n = 41 fibers from four wild-type mice and n = 47 fibers from three ncDHPR mice. Vm is membrane potential, and repol is repolarization. Pre-myotonia Vm is the resting membrane potential prior to stimulation. Initial PP Vm is the membrane potential at the beginning of the plateau potential. Final PP Vm is the membrane potential prior to the sudden repolarization terminating the plateau potential. Max repol rate is the maximum rate of repolarization during the sudden repolarization. Post PP Vm is the membrane potential following termination of the plateau potential. * indicates p=0.01 for both significant differences (t-test).
Key resources table
| Reagent type (species) or resource | Designation | Source or reference | Identifiers | Additional information |
|---|---|---|---|---|
| Strain, strain background (Mus musculus) | Clcn1adr-mto/J (ClCadr) mice | Jackson Labs | Stock #000939 | |
| Strain, strain background (Mus musculus) | ncDHPR mice | Dayal et al., 2017 Nat Commun 8:475. | ||
| Chemical compound, drug | 9-Anthracene-carboxylic acid (9-AC) | Sigma | Cat. #: A4678 | 0.1 mM |
| Chemical compound, drug | N-benzyl-p-toluenesulfonamide (BTS) | TCI America | Prod. #: B3082 | 0.05 mM |
| Chemical compound, drug | Ranolazine | Sigma-Aldrich | Cat. #: R6152 | 0.04 mM |
| Chemical compound, drug | Tetrodotoxin (TTX) | Tocris | Cat. #: 1069 | 0.001 mM |
| Chemical compound, drug | 3,4-diaminopyridine (3,4-DAP) | Sigma-Aldrich | Cat. #: D7148 | 0.1 mM |
| Chemical compound, drug | Ouabain | Sigma-Aldrich | Cat. #: 03125 | 0.01 mM |
| Software, algorithm | Spike2 | http://ced.co.uk/downloads/latestsoftware | Version 8 | |
| Software, algorithm | MATLAB | https://www.mathworks.com/downloads |
Additional files
Download links
A two-part list of links to download the article, or parts of the article, in various formats.
Downloads (link to download the article as PDF)
Open citations (links to open the citations from this article in various online reference manager services)
Cite this article (links to download the citations from this article in formats compatible with various reference manager tools)
The mechanism underlying transient weakness in myotonia congenita
eLife 10:e65691.
https://doi.org/10.7554/eLife.65691


