Cryo-EM structure of the yeast TREX complex and coordination with the SR-like protein Gbp2
Figures
Figure 1
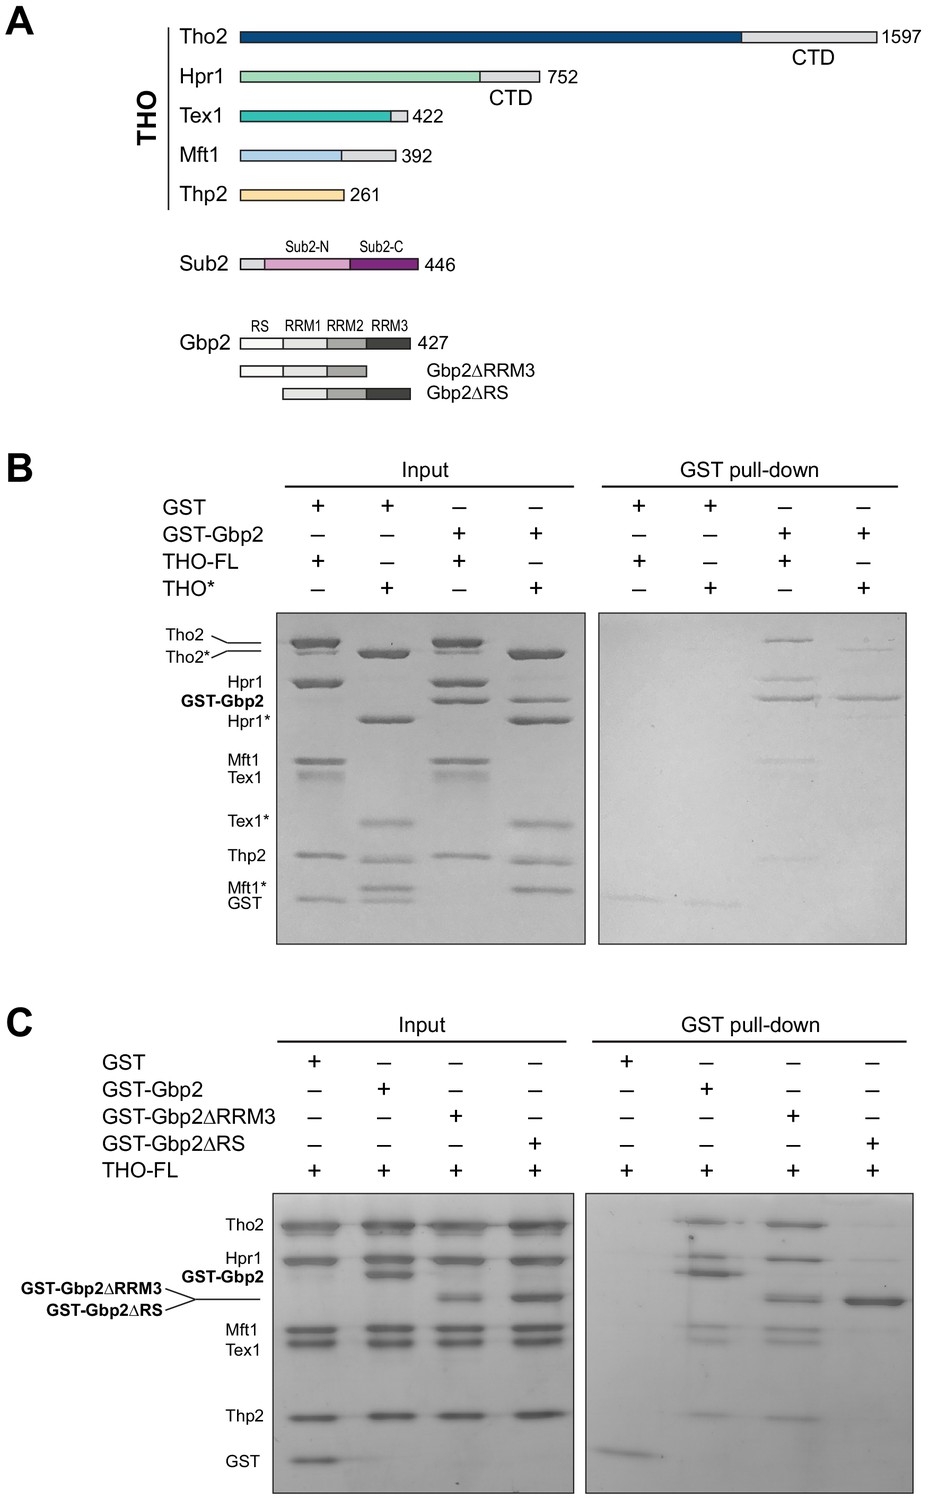
The THO complex directly interacts with the SR-like protein Gbp2.
(A) Domain organization of the THO complex, Sub2, and Gbp2. Within THO, the protein regions that are included in the core THO* complex are colored (Tho2 in blue, Hpr1 in green, Tex1 in cyan, Mft1 in light blue, and Thp2 in yellow). Sub2 is colored in pink (Sub2-N) and purple (Sub2-C). Gbp2 contains an N-terminal RS domain followed by three RRM domains. (B) THO directly interacts with Gbp2. In vitro GST-pull down assays with purified recombinant proteins show that both THO–FL and THO* bind to Gbp2 with the former exhibiting stronger interaction. (C) THO binding to Gpb2 requires the N-terminal RS domain of Gbp2.
Figure 2 with 4 supplements
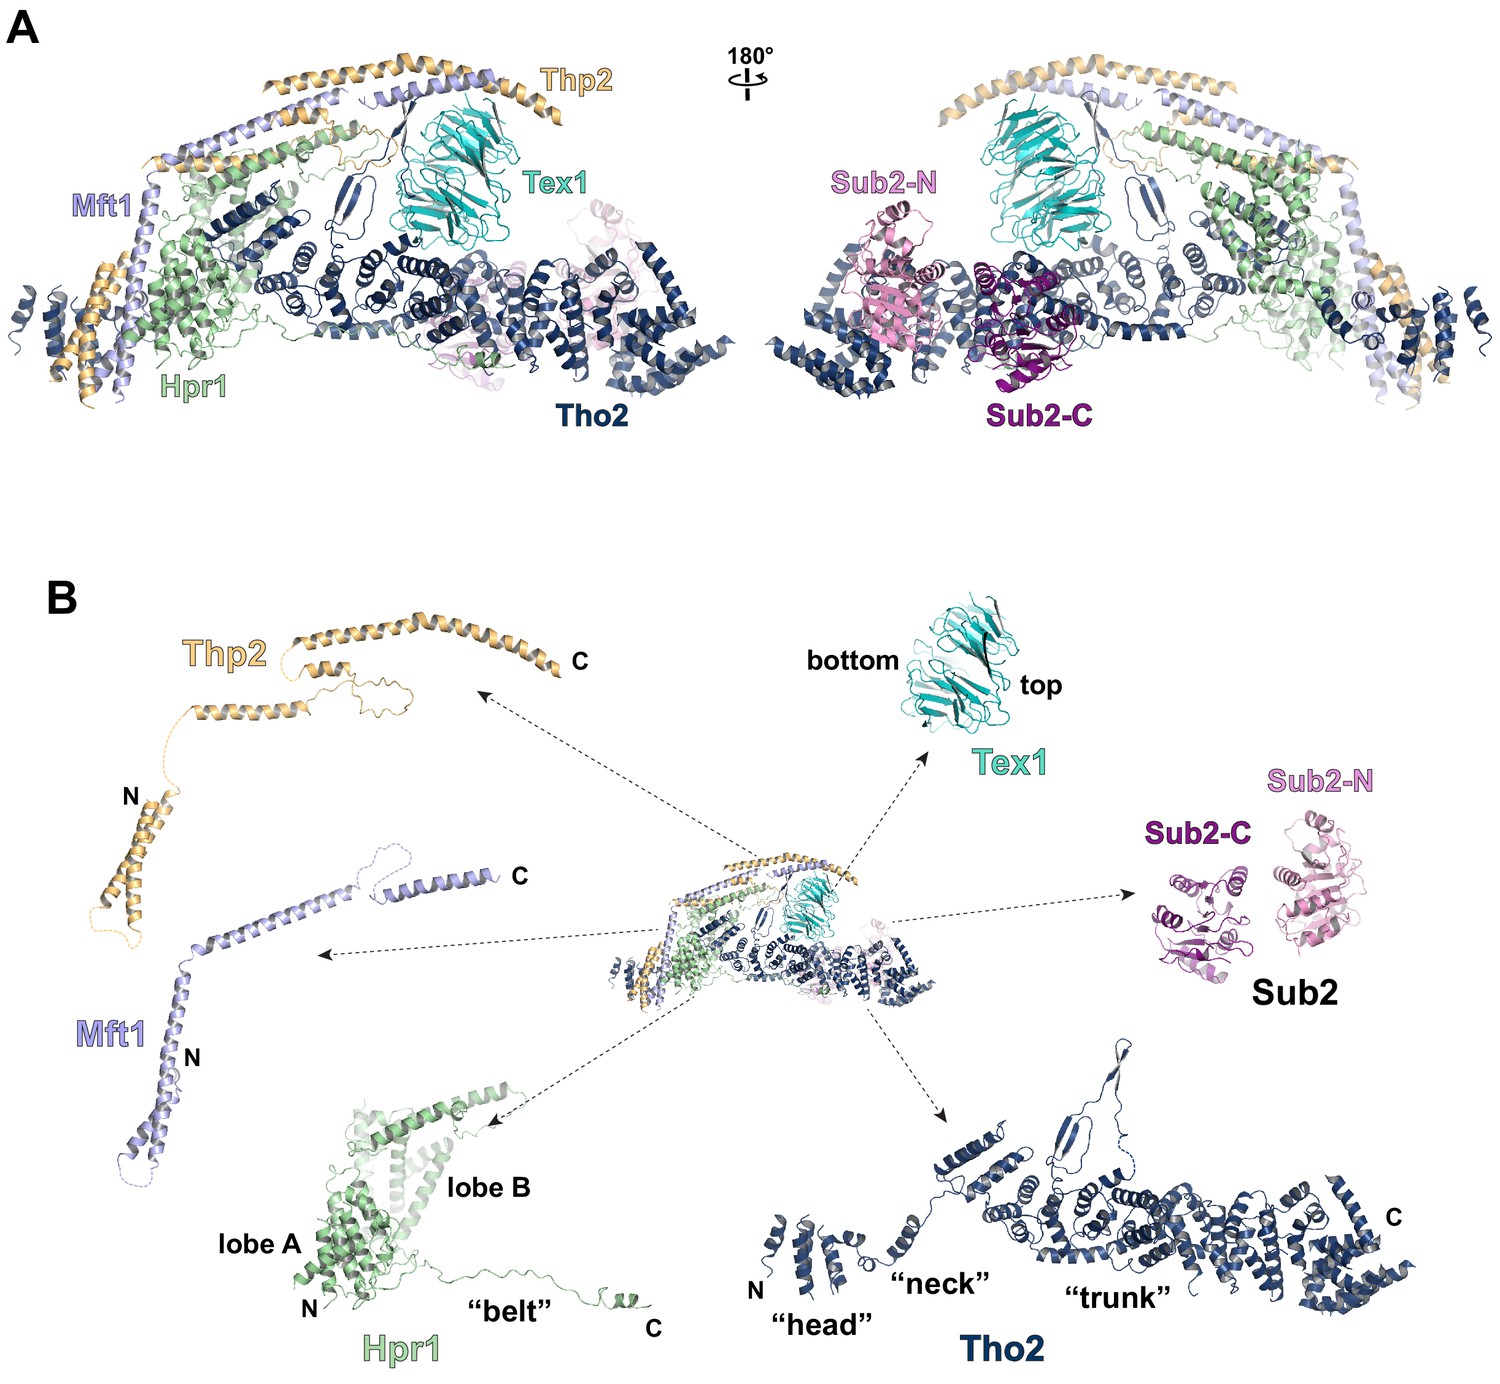
Cryo-EM structure of the THO*•Sub2 complex at 3.70 Å resolution.
(A) Overall architecture of the THO*•Sub2 complex in front and back views. (B) Dissected view of the THO*•Sub2 complex subunits. The largest THO subunit, Tho2, contains a ‘head’, a ‘neck’, and an α-solenoid ‘trunk’. Hpr1 contains lobe A, lobe B, followed by an extended ‘belt’.
Figure 2—figure supplement 1
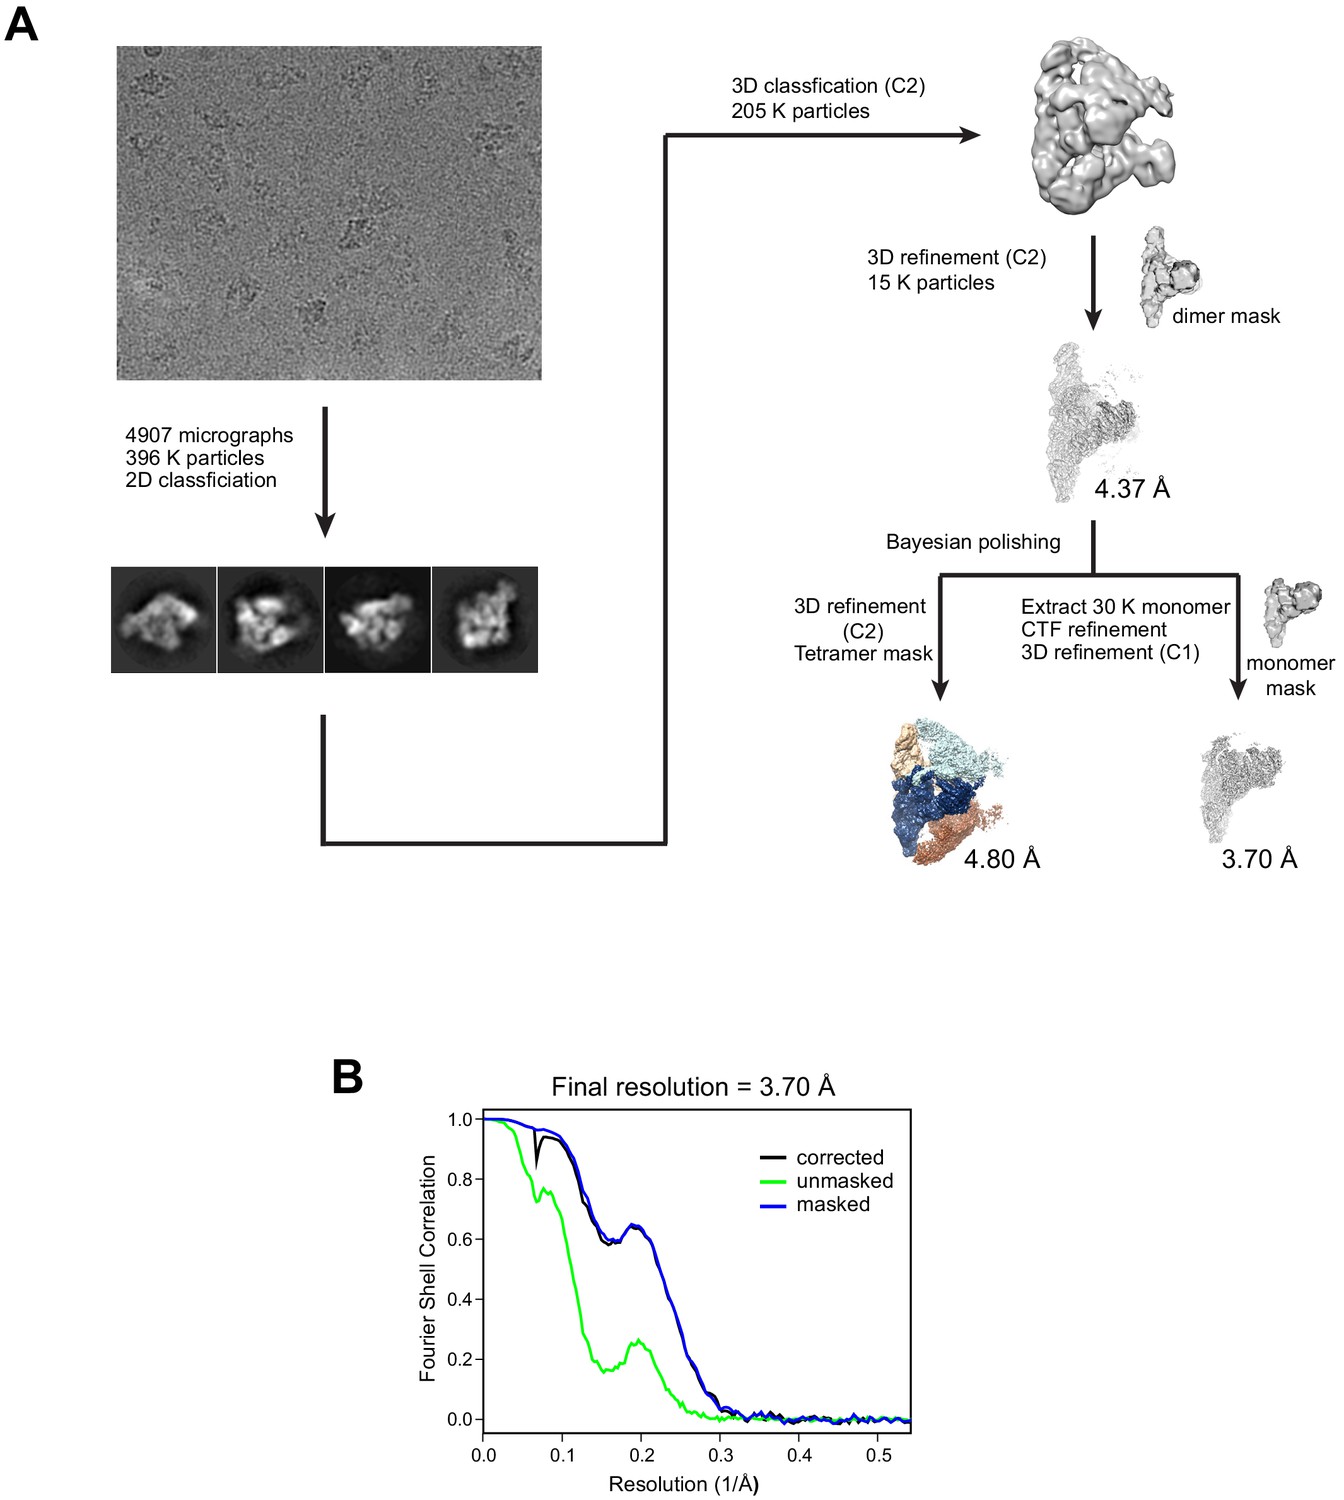
Cryo-EM data processing.
(A) Cryo-EM data processing workflow. (B) Fourier shell correlation (FSC) curves between the two half maps of the THO*•Sub2 protomer.
Figure 2—figure supplement 2
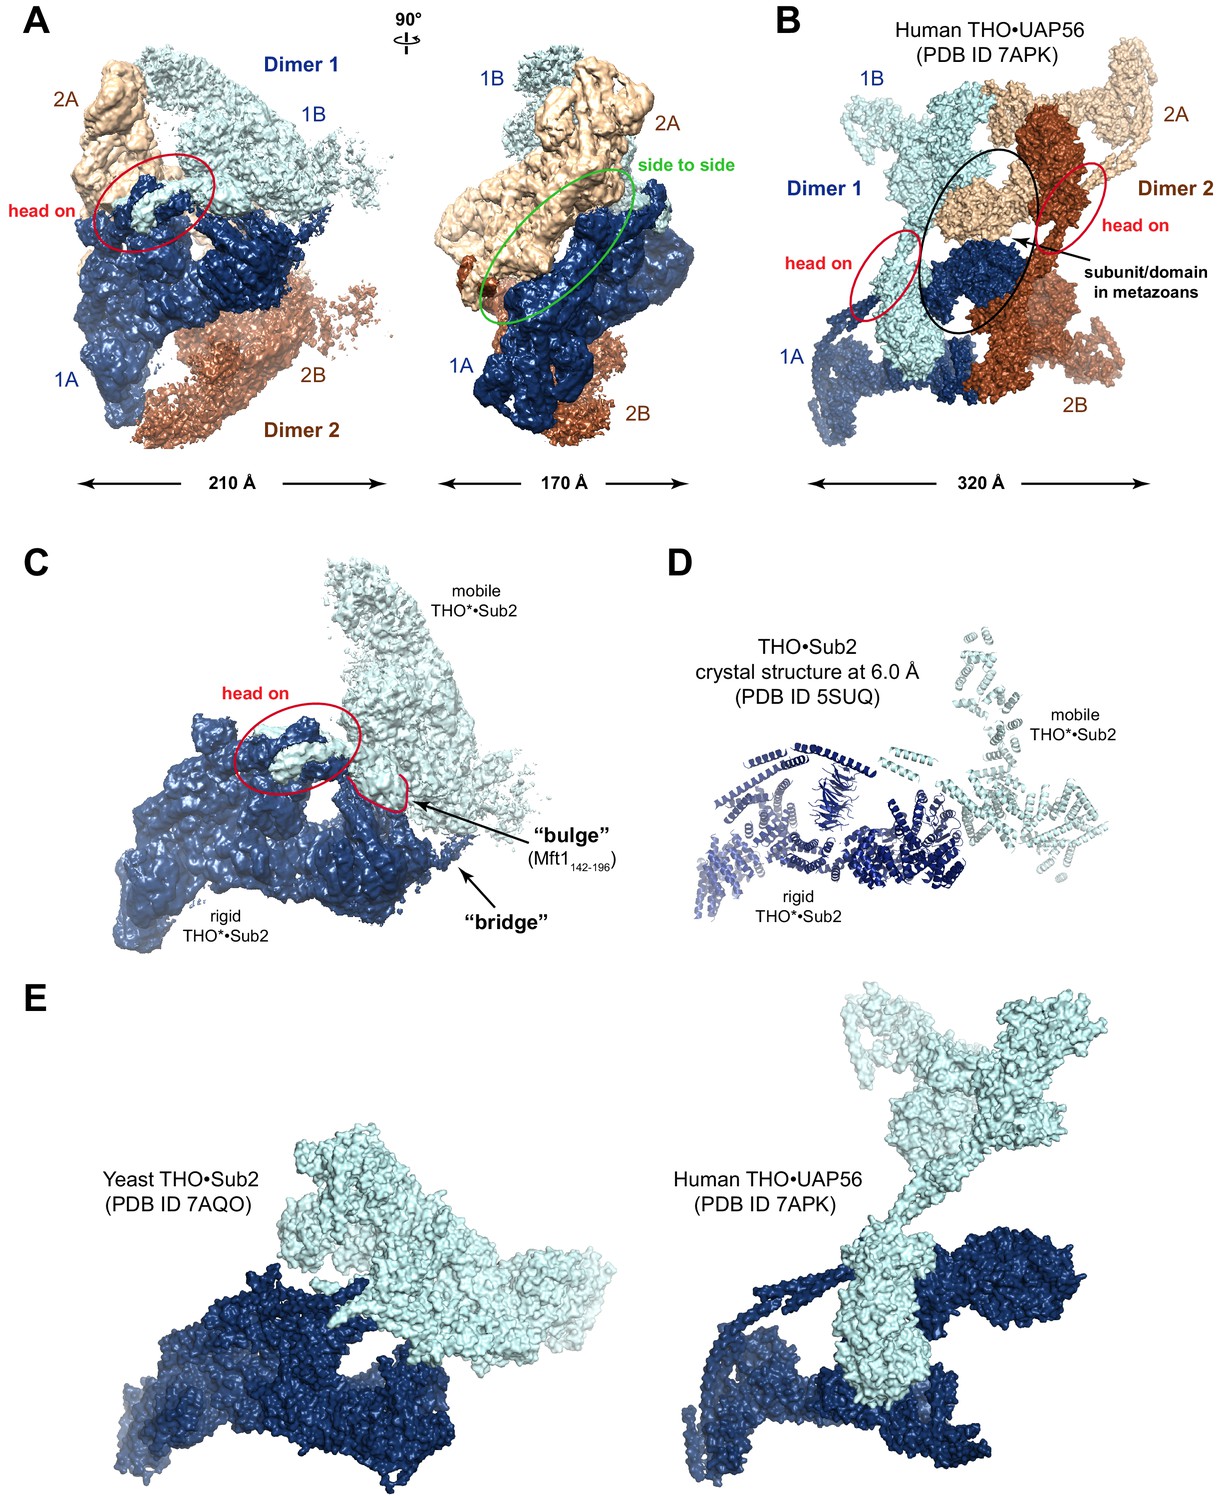
Structural comparison of yeast and human TREX.
(A) THO*•Sub2 particle exhibits an assembly of four THO*•Sub2 protomers. It can be dissected as two dimers related by twofold symmetry. Within each dimer, a coiled-coil region from each protomer interacts via a ‘head on’ mode. The two dimers interact via a ‘side to side’ mode with the same coiled-coil region. (B) The human THO•UAP56 complex tetramer (PDB ID 7APK). The ‘head on’ mode is conserved from yeast to human in forming the THO dimer. Tetramerization of human THO•UAP56 is mediated by the Thoc6 subunit and a Thoc5 region, both of which do not exist in yeast THO complex. (C) Features of the THO*•Sub2 dimer interface. In addition to the ‘head on’ interaction, XL-MS analysis in this study identified multiple cross-links between a ‘bulge’ formed by Mft1 and the C-terminal region of Tho2. Furthermore, a ‘bridge’ is observed connecting the two THO*•Sub2 protomers. (D) The THO•Sub2 crystal structure (PDB ID 5SUQ) from our previous work corresponds to a rigid THO•Sub2 protomer and partial structure of a mobile protomer. (E) Surface representation of the recently reported yeast THO•Sub2 (PDB ID 7AQO) and human THO•UAP56 (PDB ID 7APK) structures.
Figure 2—figure supplement 3
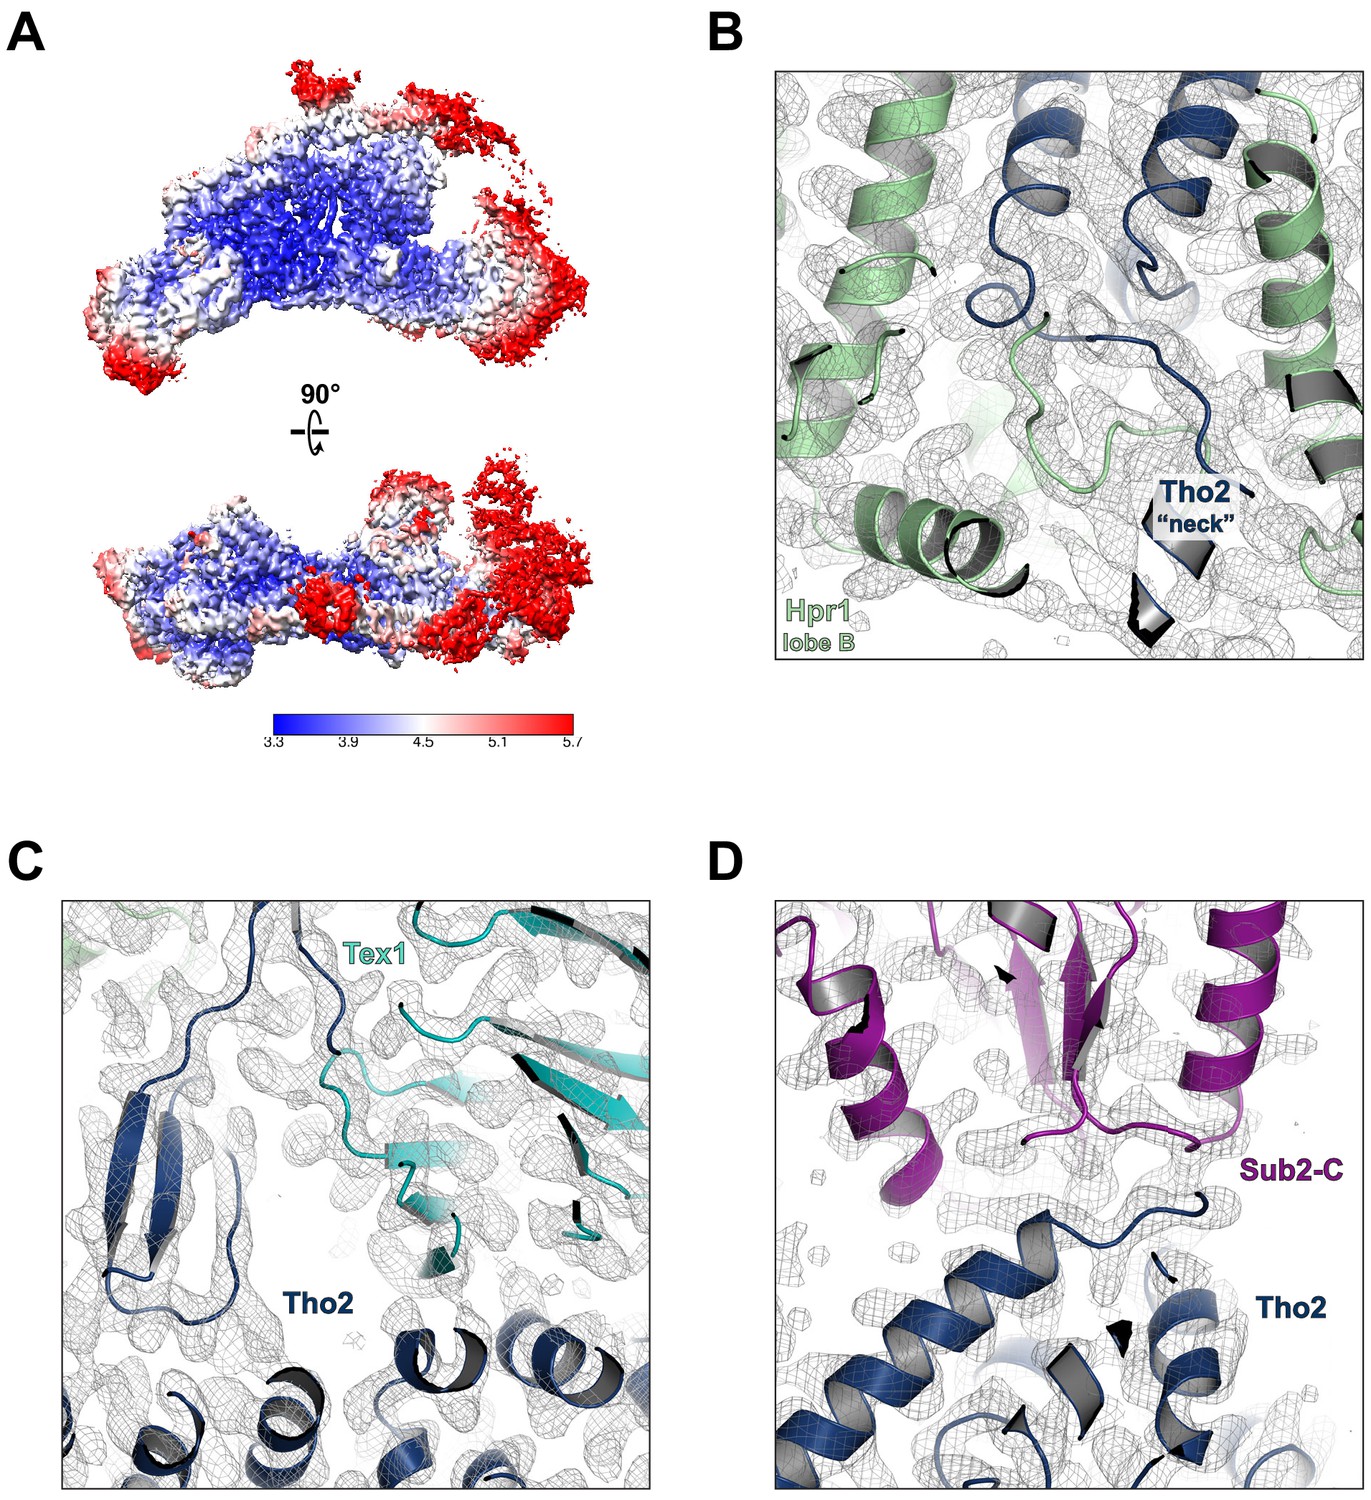
Cryo-EM model building.
(A) Local resolution of the final reconstruction calculated by Relion. Electron density maps at the Tho2 ‘neck’ (B), the Tho2–Tex1 interface (C), and the Tho2–Sub2 interface (D).
Figure 2—figure supplement 4
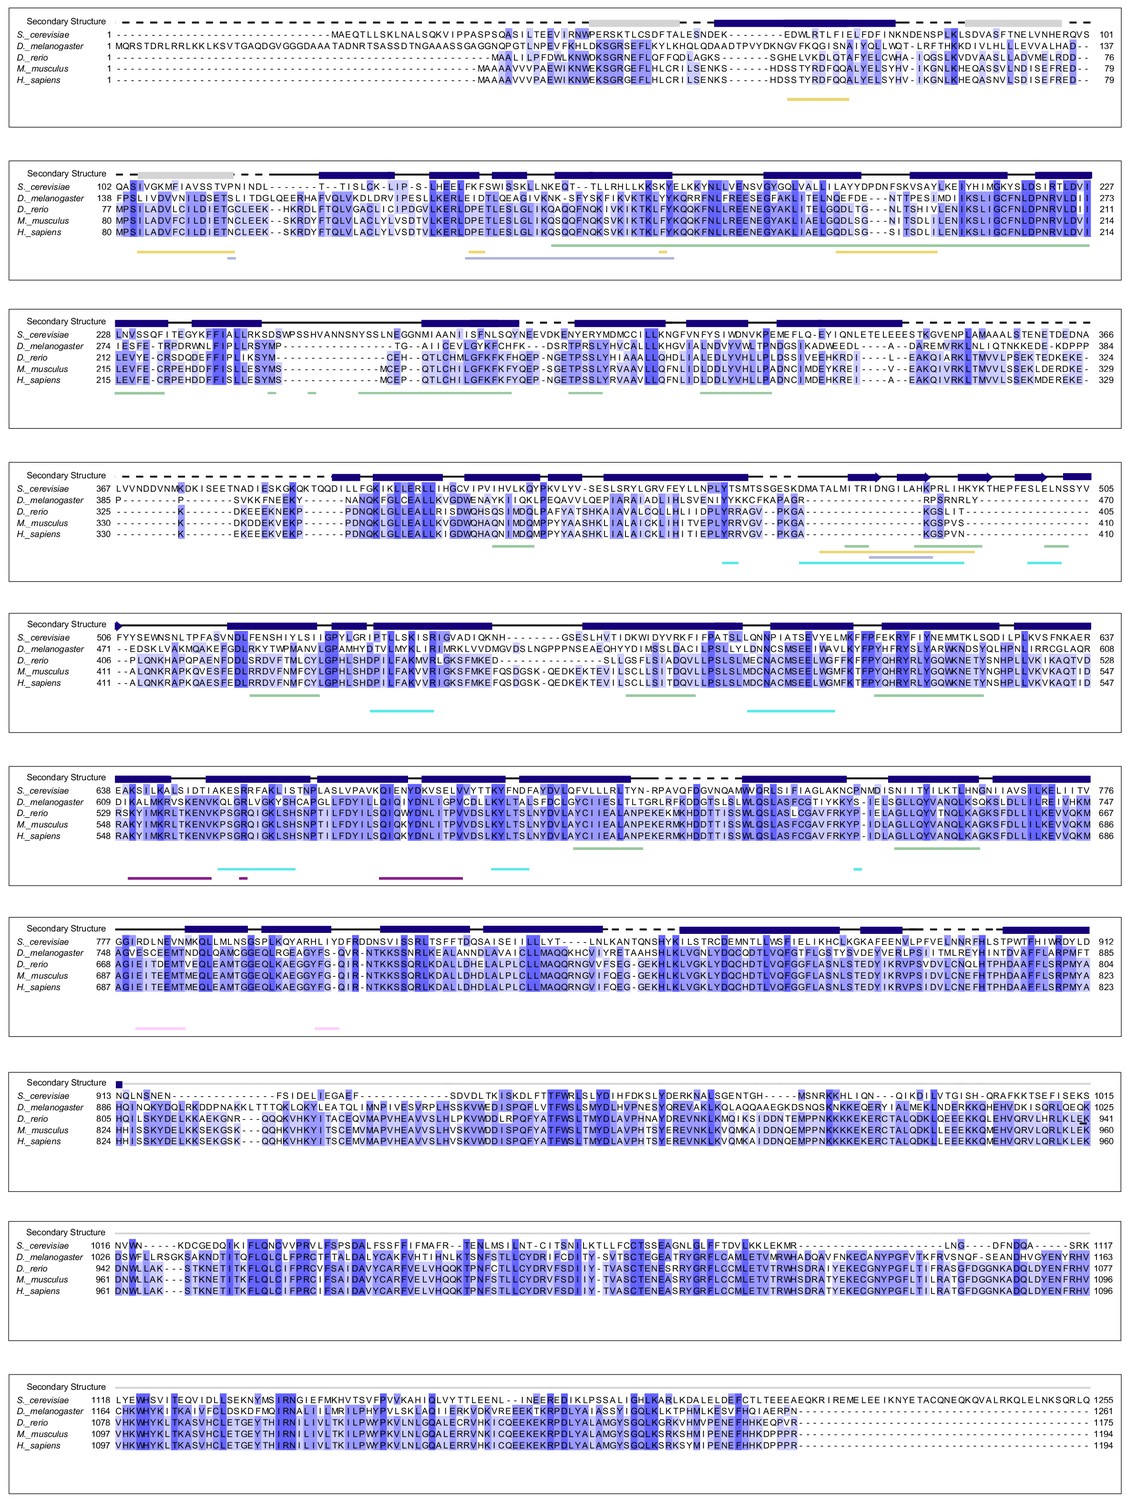
Sequence alignment of Tho2 homologues.
Tho2 sequences from S. cerevisiae, D. melanogaster, D. rerio, M. musculus, and H. sapiens were aligned with ClustalW. Shading indicates the degree of conservation across homologues. Tho2 secondary structural features from our cryo-EM structure are shown above the sequence alignment with α-helices represented as blue bars and β-sheets represented as blue arrows. The model of Tho2 contains 10 poly-Ala helices at its C-terminus represented by gray line. Three poly-Ala helices at the N-terminus of Tho2 are represented by gray bars. Sequences that are not present in the model (loops and highly flexible regions) are represented by dotted lines. The regions of Tho2 that form interaction interfaces with each of the other THO complex subunits were identified using PISA, and these interaction regions are shown below the sequence alignment. The coloration for the interaction regions is consistent with the color scheme throughout the manuscript with Hpr1 in green, Tex1 in cyan, Mft1 in light blue, Thp2 in yellow, Sub2-N in pink, and Sub2-C in purple.
Figure 3 with 1 supplement
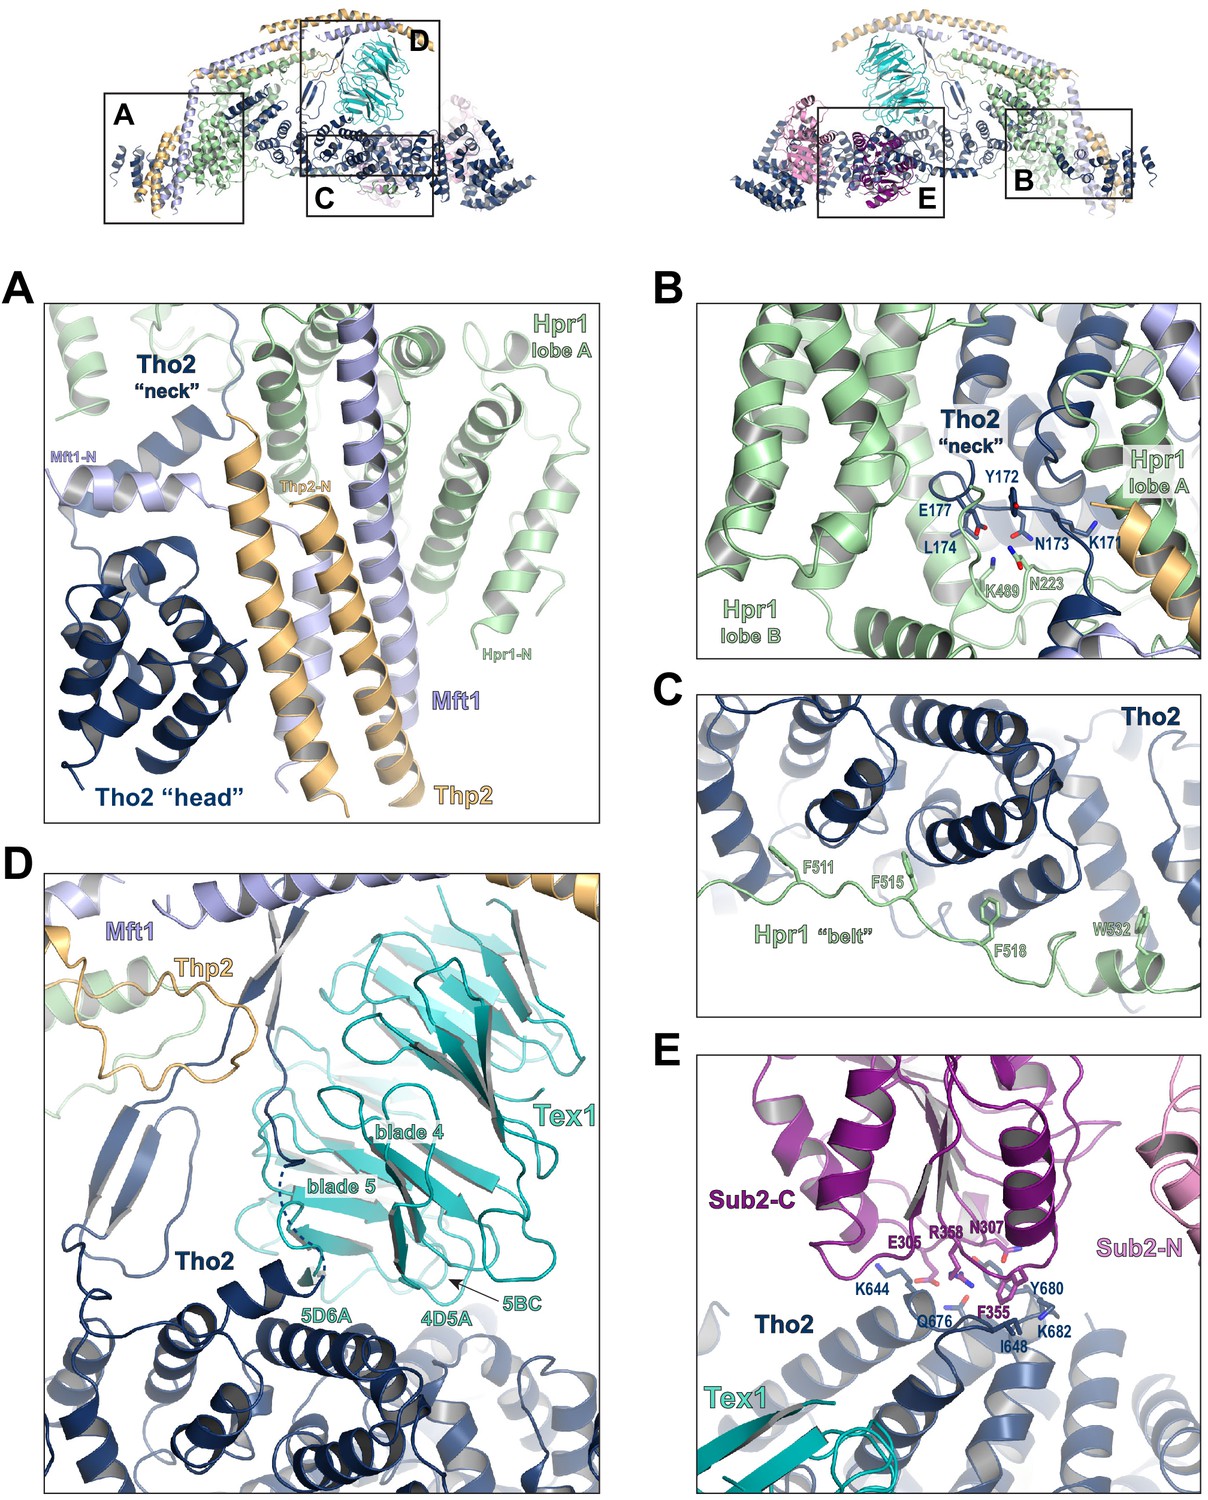
Key interactions in the THO*•Sub2 complex.
(A) A highly intimate interface involving the Tho2 ‘head’. (B) The Tho2 ‘neck’ is embraced by the two lobes of Hpr1. (C) The Hpr1 exhibits an extended ‘belt’ lining the Tho2 ‘trunk’. (D) The Tex1 beta propeller sits at the center of the Tho2 ‘trunk’. (E) The interface between Tho2 and Sub2-C.
Figure 3—figure supplement 1
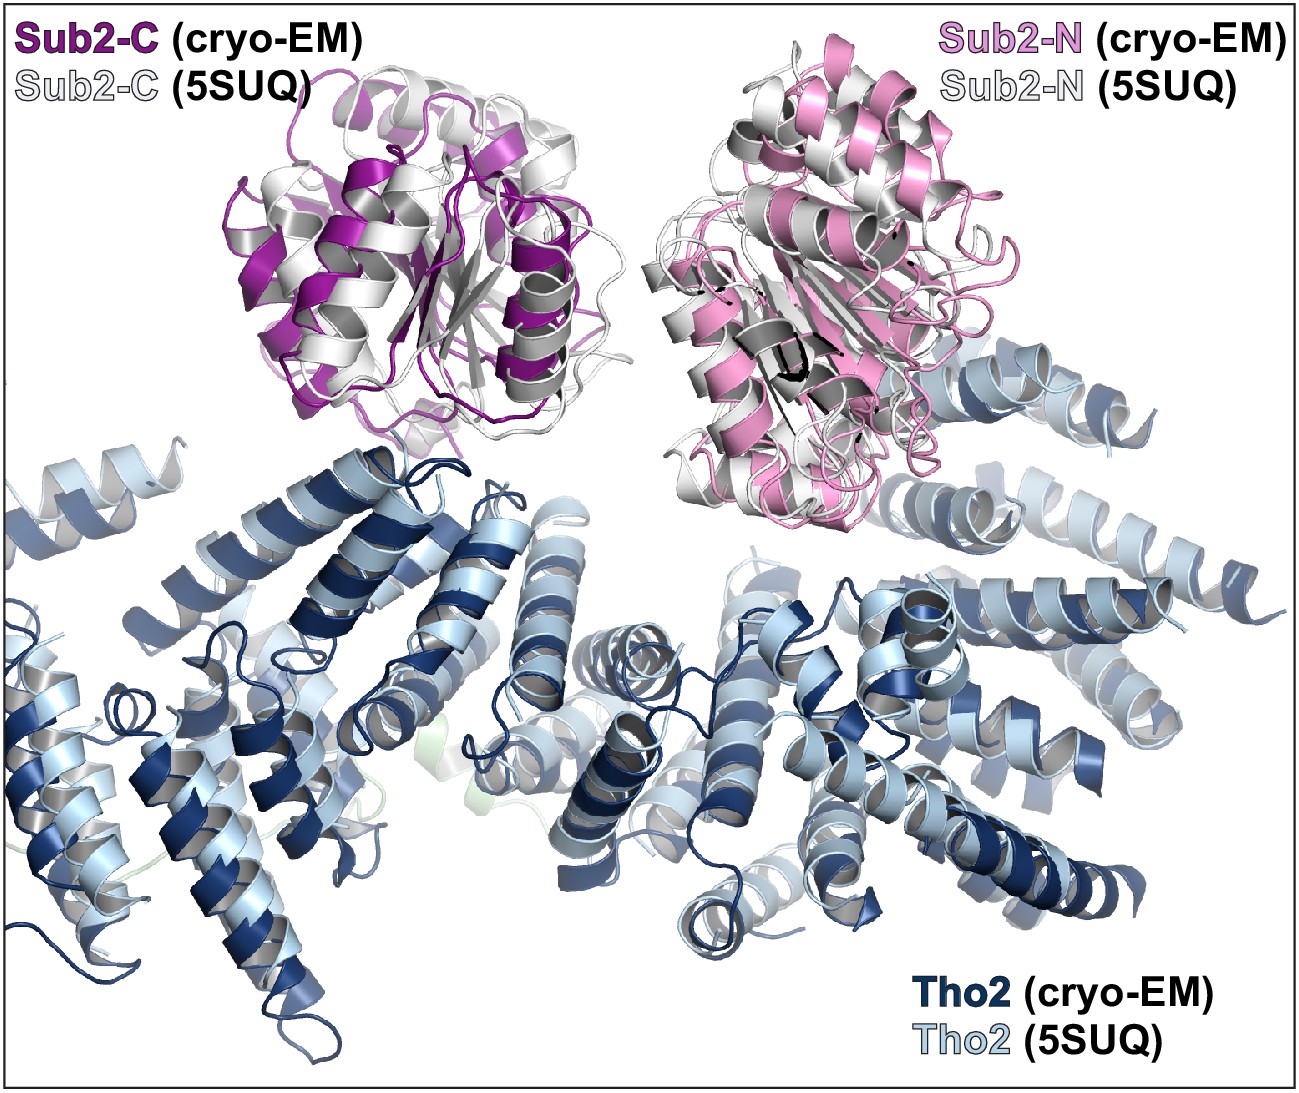
Comparison of the cryo-EM structure and our previous crystal structure of THO•Sub2 at the THO–Sub2 interface.
Cryo-EM structure is colored in blue (Tho2), pink (Sub2-N), and purple (Sub2-C). Crystal structure is colored in light blue (Tho2) and gray (Sub2-N and Sub-C).
Figure 4 with 3 supplements
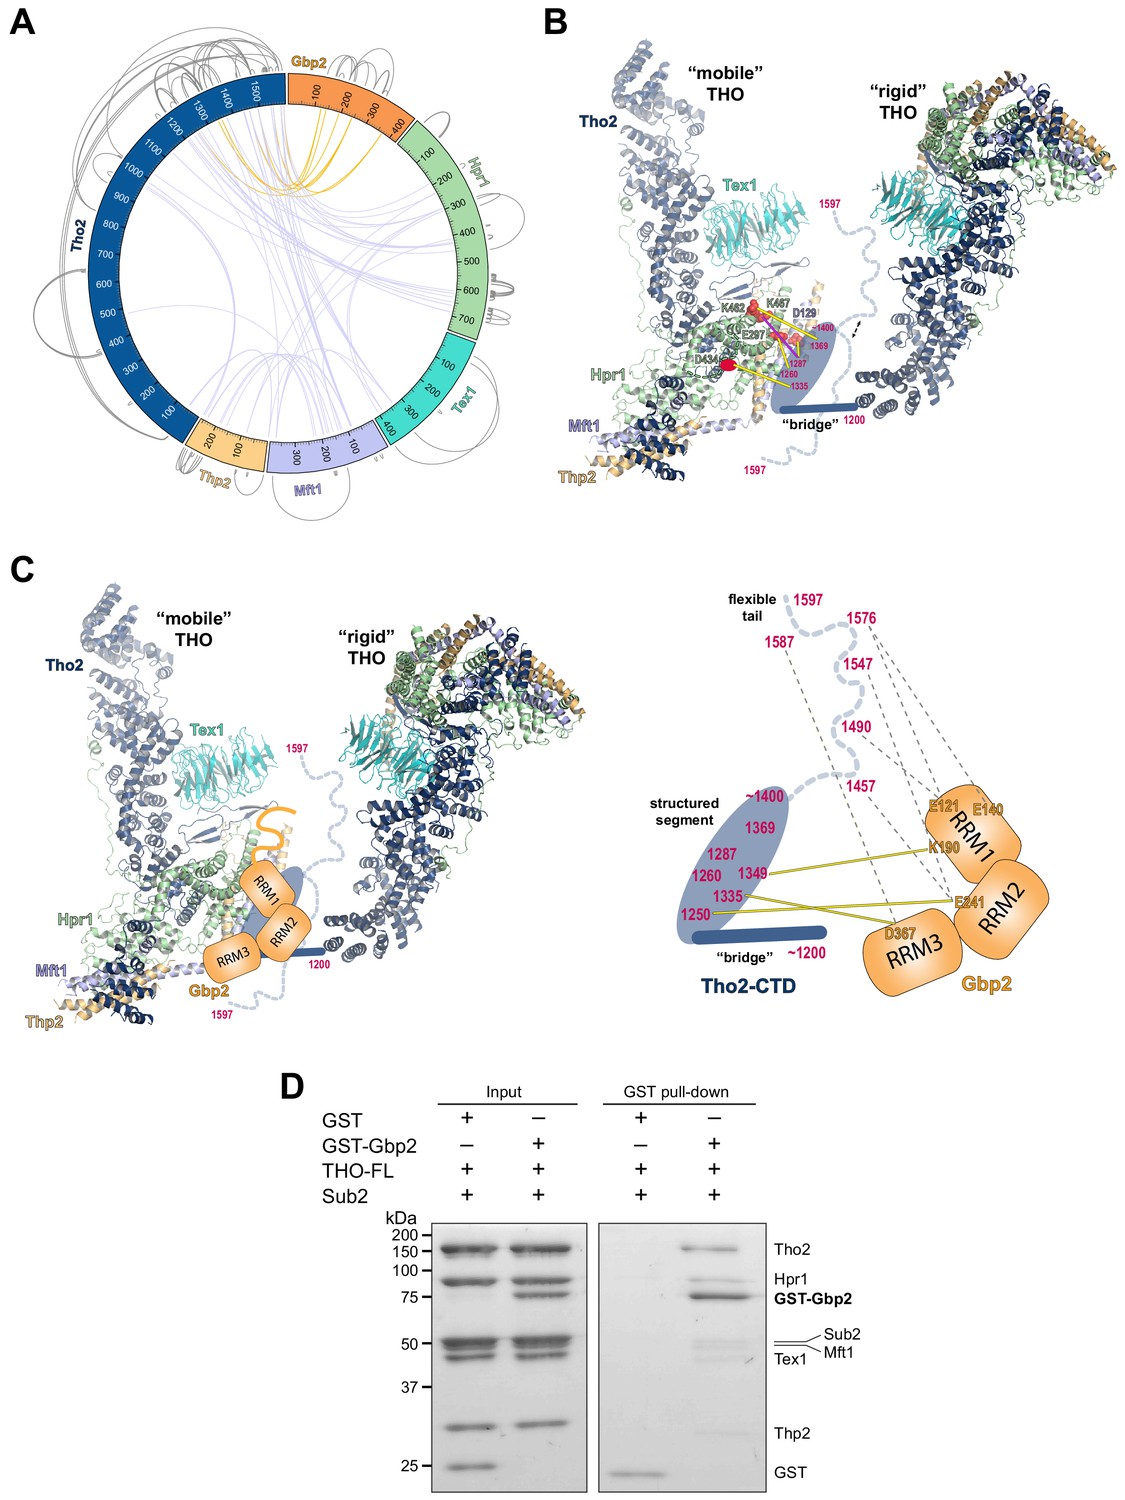
Chemical cross-linking and mass spectrometry reveals THO–Gbp2 interactions.
(A) Circular plot showing the cross-linking sites with EDC cross-linker. Each THO•Gbp2 complex subunit is represented as a colored segment with the amino acid residues indicated. Intermolecular cross-links are mapped inside the circle and the intramolecular cross-links are mapped outside the circle. The cross-links between Tho2 and Gbp2 are colored in orange. (B) Schematics of the arrangement of the Tho2–CTD, which contains a ‘bridge’ connecting two THO molecules, followed by a structured segment and a flexible tail (residues ~1400–1597). The EDC cross-links between the structured Tho2–CTD fragment and Hpr1 (E297, D434, and K462) as well as Mft1 (D129) are indicated by yellow lines. The DSS cross-link between Tho2–CTD and Hpr1–K467 is indicated by a purple line. (C) Schematics of the THO–Gbp2 interactions (left) and the identified cross-linking sites between Tho2–CTD and Gbp2 RRM domains. (D) In vitro GST-pull downs show that Gbp2 binds to the THO•Sub2 complex.
Figure 4—figure supplement 1
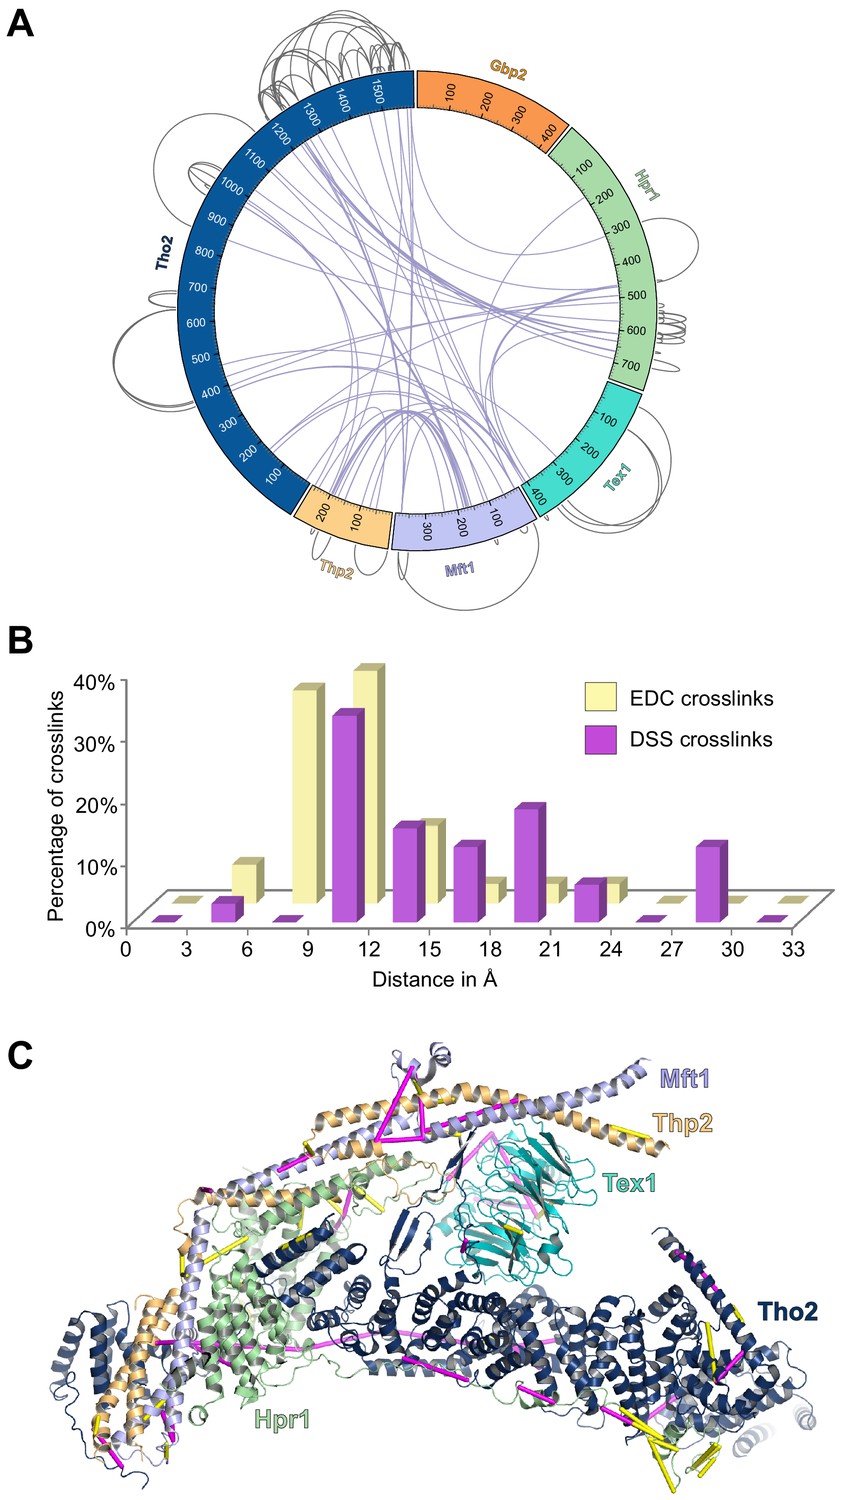
Analyses of the XL-MS data.
(A) Circular plot showing the cross-linking sites with DSS cross-linker. (B) Distance distribution of the cross-links. We mapped the Cα–Cα distances between cross-linked residues onto the dimeric THO structure (PDB ID 7AQO). 91% of the EDC cross-links and 100% of the DSS cross-links that can be mapped to the structure fall within the expected threshold of 17 Å and 30 Å. (C) EDC (yellow) and DSS (purple) cross-links are mapped on the THO structure (PDB ID 7APX).
Figure 4—figure supplement 2

XL-MS data indicate the arrangement of the C-termini of Tex1 and Hpr1.
(A) The C-terminal tail of Tex1 (residues 367–422) is localized near Hpr1 lobe B. The cross-linking sites are indicated by yellow lines. (B) The Hpr1-CTD binds to the C-terminus of the Tho2 ‘trunk’ and is localized close to the neighboring THO molecule. (C) Structural alignment of the dimeric THO assembly between our cryo-EM structure (colored as in B) and the recently reported THO–Sub2 structure (colored in gray, PDB ID 7AQO). Sub2 is omitted for clarity. The structures are aligned using one THO molecule, revealing significant flexibility in the relative orientation between the two THO molecules.
Figure 4—figure supplement 3
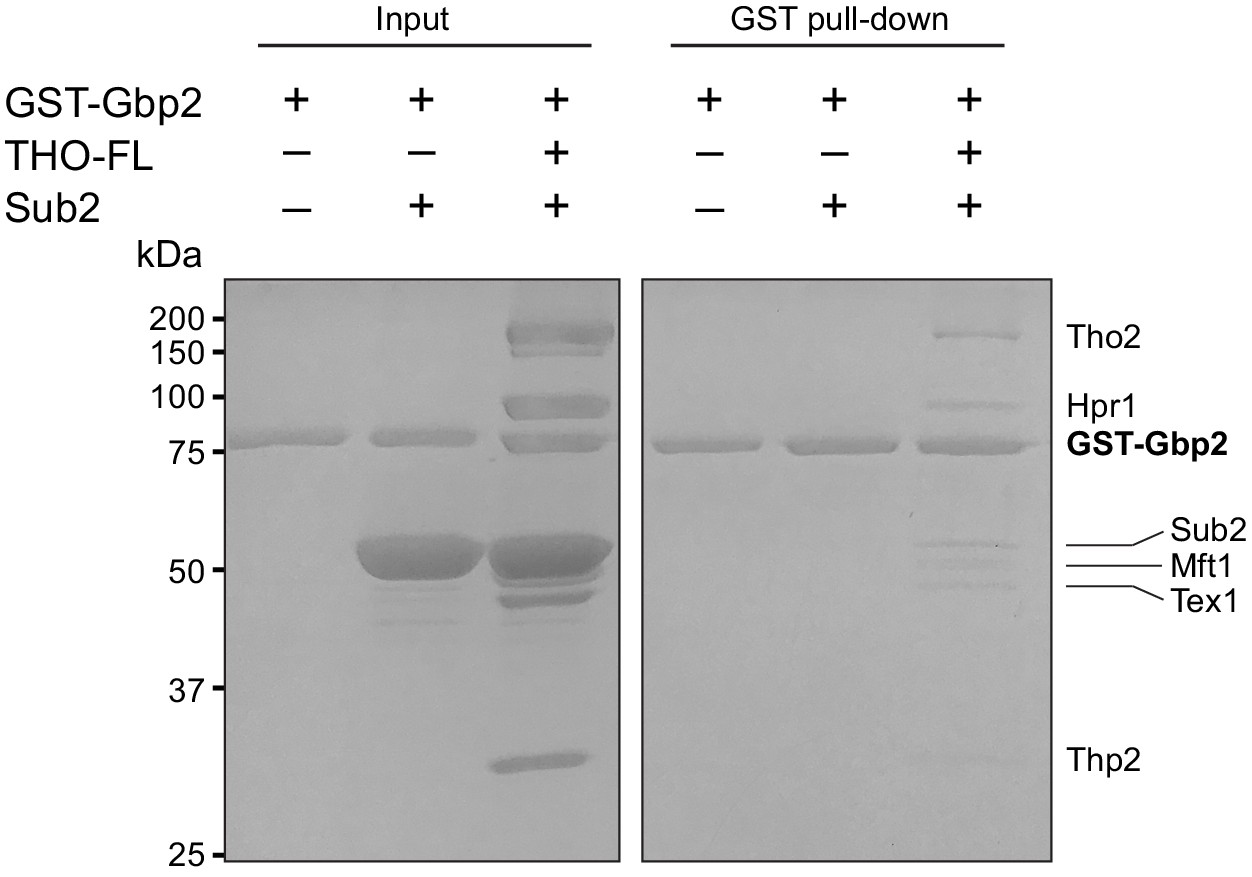
Gbp2 does not interact with Sub2.
In vitro GST-pull down with excessive amount of Sub2 shows that Gbp2 does not make direct contact with Sub2 and Gbp2 still binds to THO•Sub2 under this condition.
Figure 5 with 1 supplement
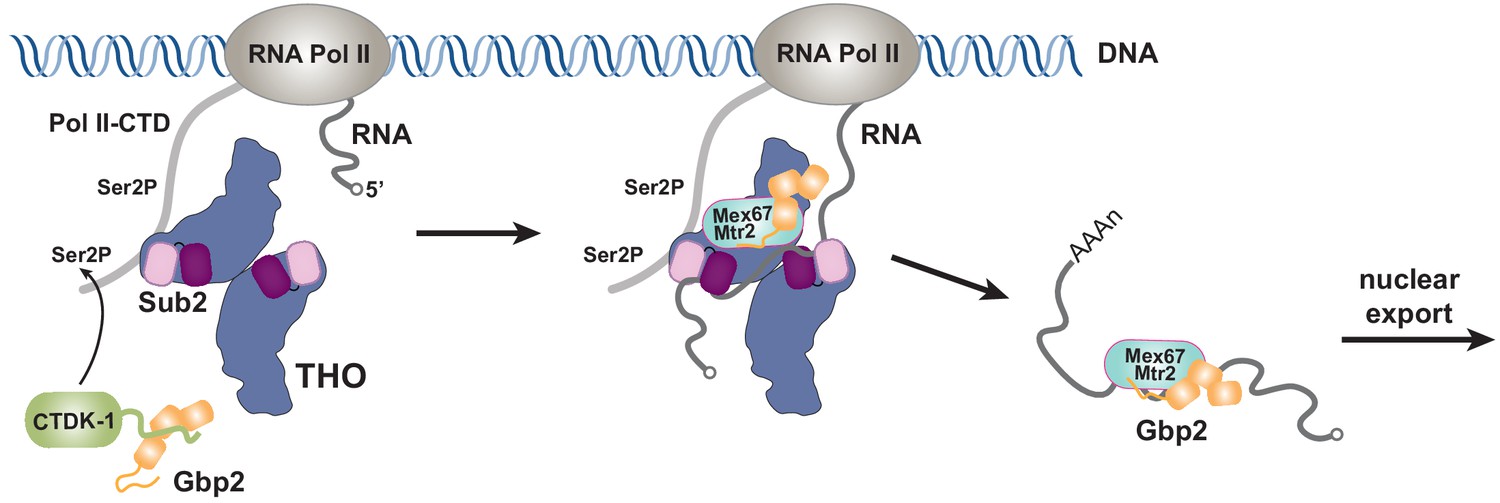
Working model of coordinated function of TREX and Gbp2.
During transcription, the yeast CTDK-1 complex phosphorylates Ser2 of the RNA Pol II CTD. The N-terminal extension in CTDK-1’s kinase subunit Ctk1 recognizes the RRM domains of Gbp2, connecting Gbp2 to the transcription machinery. TREX travels along with the transcription machinery and recognizes multiple domains of Gbp2, possibly facilitating its loading onto the maturing mRNP. Both TREX and Gbp2 are involved in subsequent loading of the export receptor Mex67•Mtr2 to generate export competent mRNPs.
Figure 5—figure supplement 1
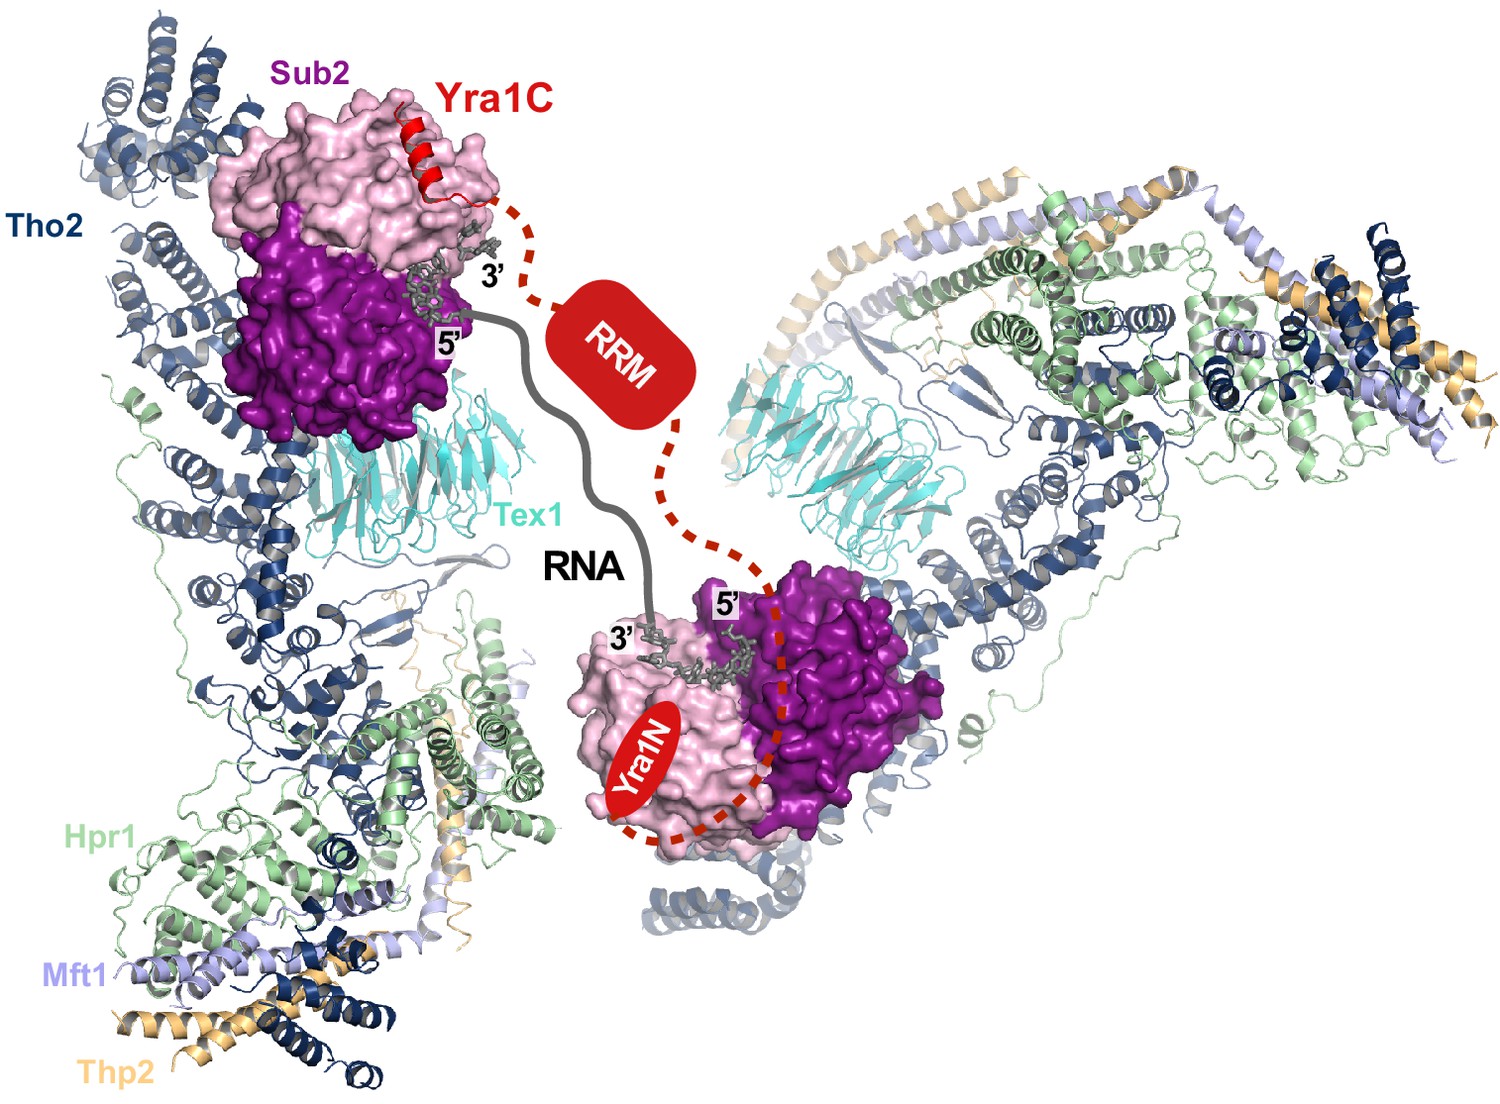
Hypothetical model of the THO•Sub2•Yra1 complex.
THO from our cryo-EM structure is represented as ribbon. Sub2 in a closed conformation in association with RNA (PDB ID 5SUP) is aligned to Sub2-C in THO*•Sub2 and represented as a surface model. One copy of Sub2 is shown bound to the C-terminal region of Yra1 (Yra1C) (PDB ID 5SUP). The other copy of Sub2 is shown bound to the N-terminal region of Yra1 (Yra1N), which is thought to interact with Sub2 in the same manner as Yra1C. This model depicts a hypothetical model in which one Yra1 molecule is engaged with two copies of THO•Sub2.
Tables
Key resources table
| Reagent type (species) or resource | Designation | Source or reference | Identifiers | Additional information |
|---|---|---|---|---|
| Cell line (S. frugiperda) | Sf9 | Thermo Fisher Scientific | ||
| Cell line (T. ni) | High Five | Thermo Fisher Scientific | ||
| Strain (E. coli) | DH10Bac | Thermo Fisher Scientific | ||
| Strain (E. coli) | Rosetta | Novagen | ||
| Gene (S. cerevisiae) | Hpr1 | Uniprot | P17629 | |
| Gene (S. cerevisiae) | Tho2 | Uniprot | P53552 | |
| Gene (S. cerevisiae) | Mft1 | Uniprot | P33441 | |
| Gene (S. cerevisiae) | Thp2 | Uniprot | O13539 | |
| Gene (S. cerevisiae) | Tex1 | Uniprot | P53851 | |
| Gene (S. bayanas) | Tex1 | GenBank | AACA01000 273.1 | Bases 2762–4030 |
| Gene (S. cerevisiae) | Sub2 | Uniprot | Q07478 | |
| Gene (S. cerevisiae) | Gbp2 | Uniprot | P25555 | |
| Software, algorithm | COOT | https://www2.mrc-lmb.cam.ac.uk/personal/pemsley/coot/ | COOT 0.8.8 | |
| Software, algorithm | Chimera | https://www.cgl.ucsf.edu/chimera/ | ||
| Software, algorithm | PyMOL | Molecular Graphics System, Schrodinger, LLC | PyMOL 2.4 | |
| Software, algorithm | Phenix | https://www.phenix-online.org | Phenix 1.11 | |
| Software, algorithm | Relion | https://www3.mrc-lmb.cam.ac.uk/relion/ | Relion 3.1 | |
| Software, algorithm | pLink2 | http://pfind.ict.ac.cn/software/pLink/ | ||
| Software, algorithm | CX-Circos | http://cx-circos.net | ||
| Software, algorithm | Xlink Analyzer | https://www.embl-hamburg.de/XlinkAnalyzer/XlinkAnalyzer.html |
Additional files
-
Supplementary file 1
Cryo-EM data collection, refinement, and validation statistics.
- https://cdn.elifesciences.org/articles/65699/elife-65699-supp1-v2.docx
-
Supplementary file 2
Unique EDC and DSS cross-linked peptides identified from the THO–Gbp2 complex.
- https://cdn.elifesciences.org/articles/65699/elife-65699-supp2-v2.xlsx
-
Transparent reporting form
- https://cdn.elifesciences.org/articles/65699/elife-65699-transrepform-v2.docx
Download links
A two-part list of links to download the article, or parts of the article, in various formats.
Downloads (link to download the article as PDF)
Open citations (links to open the citations from this article in various online reference manager services)
Cite this article (links to download the citations from this article in formats compatible with various reference manager tools)
Cryo-EM structure of the yeast TREX complex and coordination with the SR-like protein Gbp2
eLife 10:e65699.
https://doi.org/10.7554/eLife.65699


