Sushi domain-containing protein 4 controls synaptic plasticity and motor learning
- Center for Interdisciplinary Research in Biology (CIRB), Collège de France, CNRS, INSERM, PSL Research University, France
- Institut des Neurosciences Cellulaires et Intégratives (INCI), CNRS, Université de Strasbourg, France
- Institut Biology Paris Seine (IBPS), Neuroscience Paris Seine (NPS), CeZaMe, CNRS, Sorbonne University, INSERM, France
- BioCampus Montpellier, CNRS, INSERM, Université de Montpellier, France
- Institut de Génomique Fonctionnelle, CNRS, INSERM, Université de Montpellier, France
- École Normale Supérieure, Institut de Biologie de l'ENS, INSERM, CNRS, PSL Research University, France
- Université de Lyon, Université Claude Bernard Lyon 1, CNRS UMR 5310, INSERM U 1217, Institut Neuromyogène, France
Figures
Figure 1 with 5 supplements

SUSD4 is necessary for motor coordination adaptation and learning.
(A) Diagram of the protein SUSD4 showing its domain organization with four extracellular Complement Control Protein (CCP) domains, one transmembrane (TM) domain and a cytoplasmic domain (CT). (B) Quantitative RT-PCR shows an increase in Susd4 mRNA expression (relative to the housekeeping gene Rpl13a) during postnatal development in the cerebellum and in the brainstem. Extracts were prepared from tissue samples of mice aged from 0 to 21 days (P0-21) and 3 months (3mo). Mean ± s.e.m. (n = 3 independent experiments). (C) HA-tagged SUSD4 is found in dendrites (left panel, single plane) and in some of the distal dendritic spines (right panel, arrowheads, projection of a 1.95 µm z-stack) in adult cerebellar Purkinje cells. Anti-HA and anti-GFP immunolabeling was performed on parasagittal cerebellar sections obtained from adult L7Cre mice after stereotaxic injection of AAV particles driving the expression of HA-SUSD4 and soluble GFP. Scale bars: 10 µm (left panel) and 2 µm (right panel). (D) Purkinje cells from primary mixed cerebellar cultures of L7Cre mice were transduced at 3 days in vitro (DIV3) with an HA-tagged SUSD4 expressing virus (AAV2-hSYN-DIO-HA-SUSD4-2A-eGFP) or with a control virus expressing GFP alone (AAV2-hSYN-DIO-eGFP), and immunostained in non-permeabilizing conditions at DIV17 for HA to localize surface SUSD4 (anti-HA, red), and in permeabilizing conditions to detect the green fluorescent protein (anti-GFP, green) and the endogenous GluD2 subunit (anti-GRID2, blue). Scale bar 5 µm. (E) Genomic structure of the Susd4 gene. White boxes represent exons. Exon 1 is deleted in the Susd4 loss-of-function mouse model. See also Figure 1—figure supplement 2. (F) Motor coordination and learning is deficient in adult male Susd4 -/- (knockout [KO]) mice compared to age-matched Susd4+/+ (wild-type [WT]) littermates. Each mouse was tested three times per day during 5 consecutive days on an accelerating rotarod (4-40 r.p.m. in 10 min) and the time spent on the rotarod was measured. Mean ± s.e.m. (WT n = 11 and KO n = 7 mice, two-way ANOVA with repeated measures, interaction (time and genotype): **p=0.0079, F(14, 224)=2.22; time: ****p<0.0001, F(14, 224)=3.469; genotype: p=0.0553, F(1, 16)=4.272). (G) In situ hybridization experiments were performed on brain sections from 1-month-old Susd4 WT and Susd4 KO mice to detect Susd4 mRNA using a probe encompassing exons 2–5 (see also Figure 1—figure supplement 2). Susd4 expression was found in many regions of the brain in Susd4 WT mice (see also Figure 1—figure supplement 1) including the cerebral cortex (CTX), the cerebellum (CB), and the brainstem (BS). No labeling was found in the brain of Susd4KO mice. Scale bar 500 µm.
-
Figure 1—source data 1
Numerical data to support graphs in Figure 1.
- https://cdn.elifesciences.org/articles/65712/elife-65712-fig1-data1-v2.xlsx
Figure 1—figure supplement 1
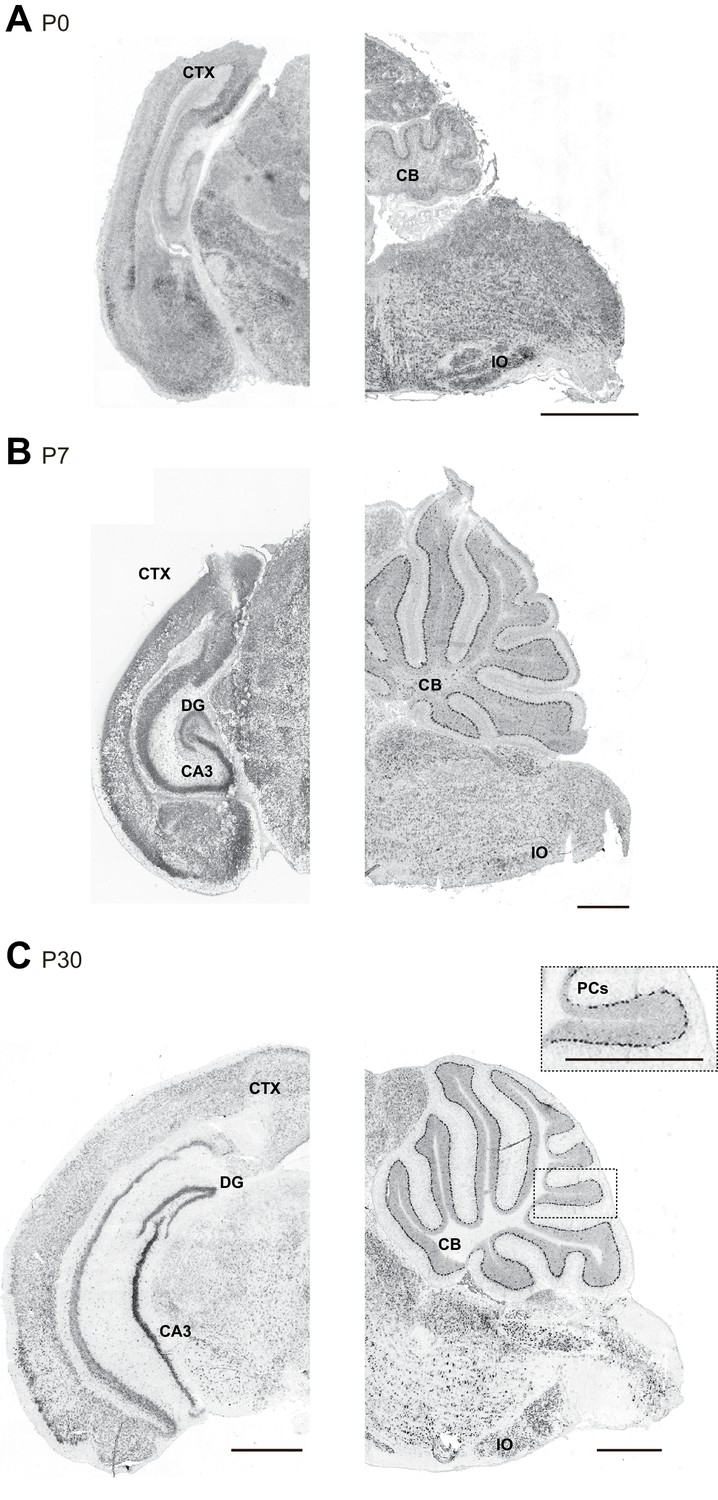
Susd4 mRNA expression in the developing mouse brain.
(A) Susd4 mRNA expression was visualized in the brain of wild-type mice by in situ hybridization. Coronal (left) and sagittal (right) sections are presented at postnatal day 0 (P0), (B) postnatal day 7 (P7), and (C) postnatal day 30 (P30). Susd4 expression was found in many regions including the cerebral cortex (CTX), the dentate gyrus (DG) and CA3 regions in the hippocampus (coronal section, left), the cerebellum (CB), in particular Purkinje cells (PCs), and the inferior olive (IO; sagittal section, right). Scale bars 250 and 500 μm (inset C).
Figure 1—figure supplement 2
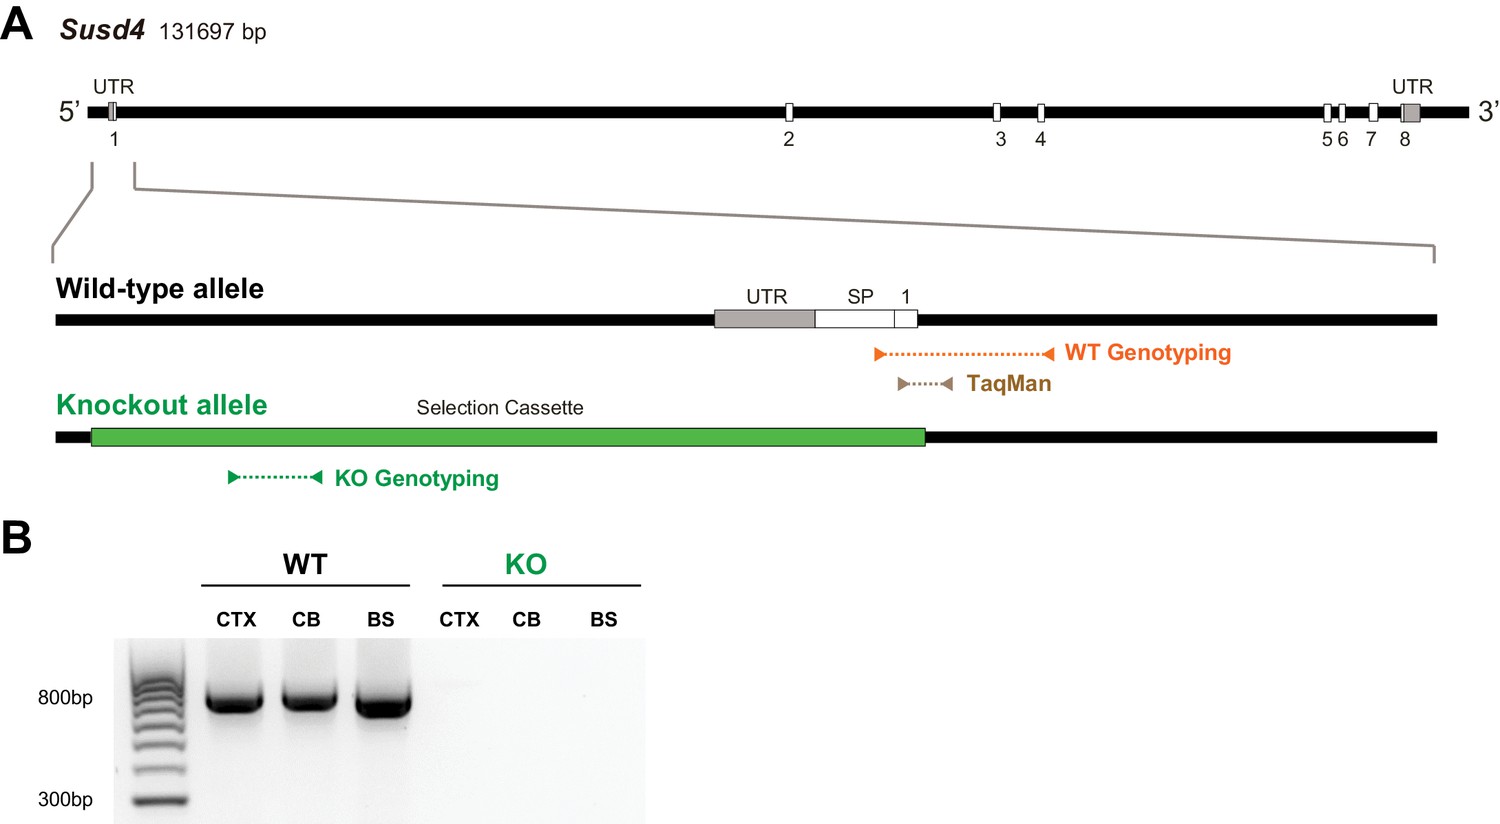
Characterization of Susd4 knockout (KO) mice.
(A) Structure of the Susd4 gene and strategy for the generation of the KO mouse. The gene coding for the Susd4 mRNA contains eight exons. The wild-type (WT) allele is presented indicating the localization of the primers used for genotyping and of the probes used for TaqMan RT-qPCR. In the KO allele, the 5'UTR and first exon are entirely deleted and replaced by the selection cassette. (B) Susd4 expression was assessed by RT-PCR using primers encompassing exons 6-8 in extracts from cortex (CTX), cerebellum (CB), and brainstem (BS) in Susd4 WT and Susd4 KO mice.
Figure 1—figure supplement 3
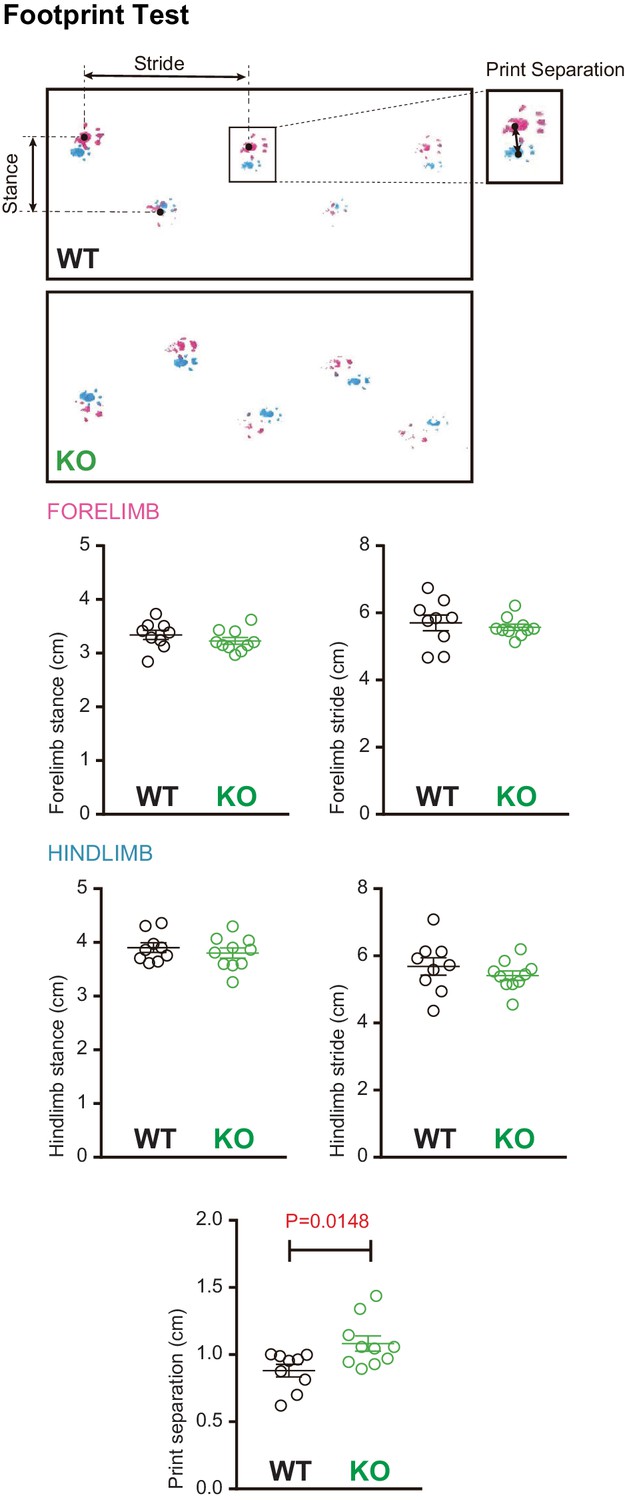
Footprint analysis in Susd4 knockout (KO) mice.
Footprint patterns of P30 Susd4WT and Susd4 KO mice were quantitatively analyzed by measuring stride length for the fore paws (magenta) and hind paws (cyan), stance length for the forelimbs and hindlimbs, and print separation. Mean ± s.e.m. (WT n = 9 and KO n = 10 mice; unpaired Student’s t-test; forelimb stance: p=0.3059; forelimb stride: p=0.5882; hindlimb stance: p=0.4533; hindlimb stride: p=0.3580; print separation: *p=0.0148).
Figure 1—figure supplement 4
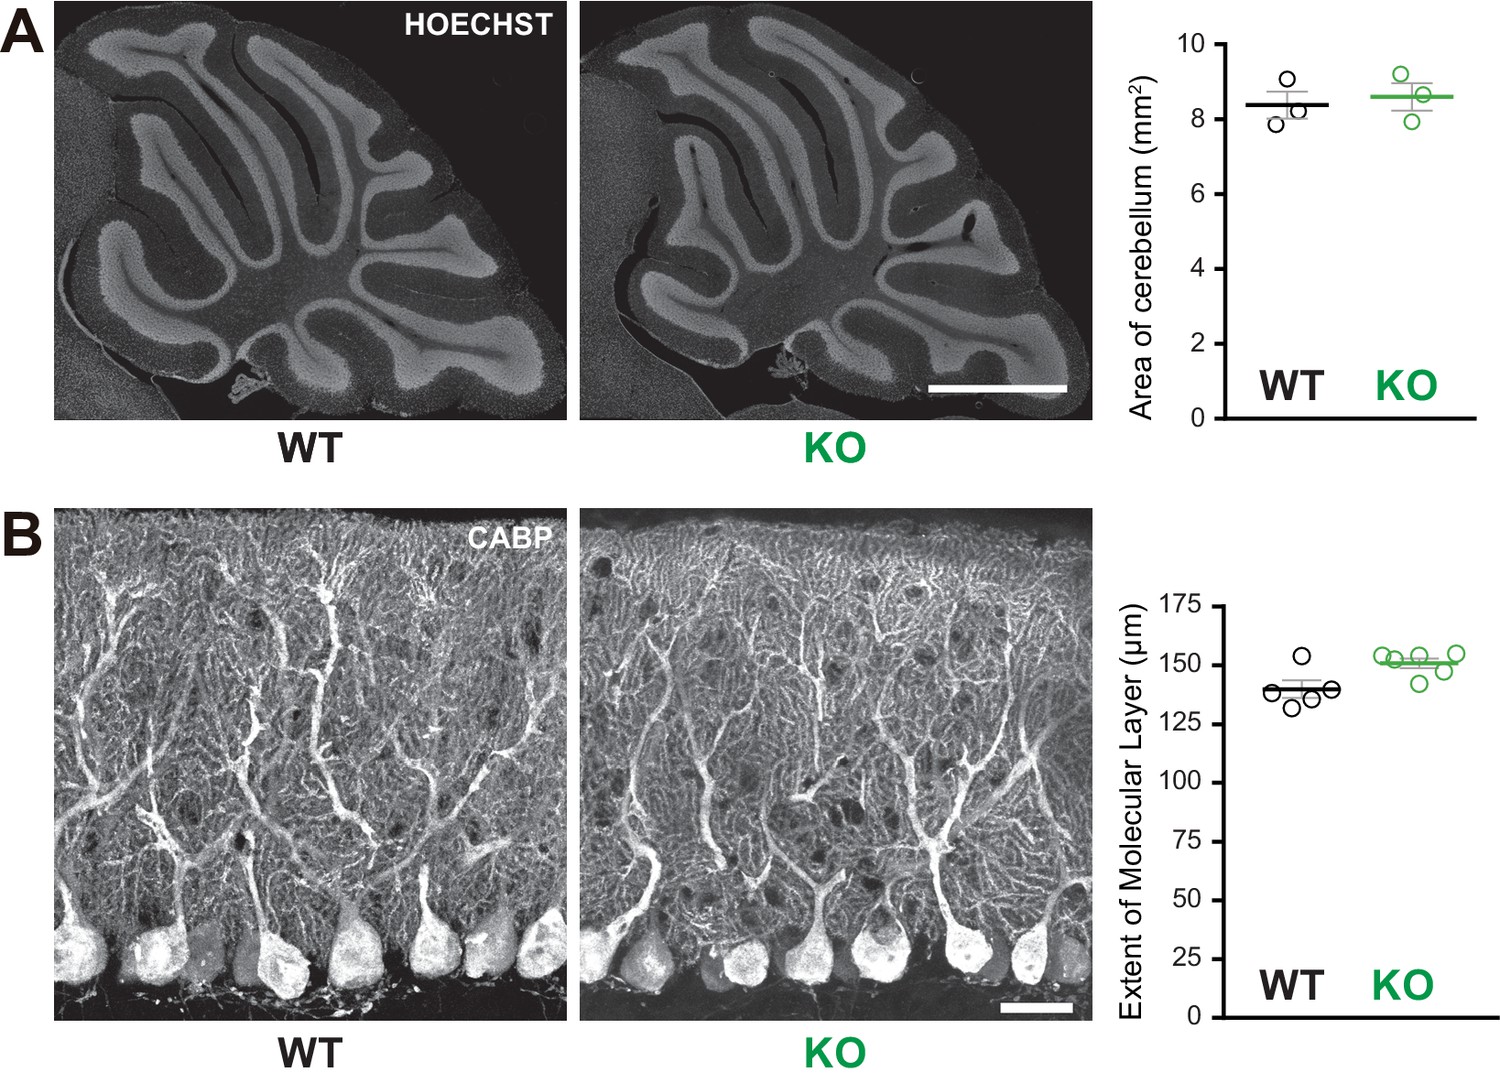
Normal cerebellar cytoarchitecture in Susd4 knockout (KO) mice.
(A) Parasagittal sections of P30 Susd4 wild-type (WT and Susd4 KO cerebella were stained with Hoechst and used for quantitative analysis of the mean area of the cerebellum). Mean ± s.e.m. (n = 3 WT mice and n = 3 KO mice). Scale bar 500 µm. (B) Calbindin protein (CABP) immunostaining was used for quantitative analysis of the mean height of the molecular layer. Mean ± s.e.m. (WT n = 5 and KO n = 6 mice). Scale bar 30 µm.
Figure 1—figure supplement 5
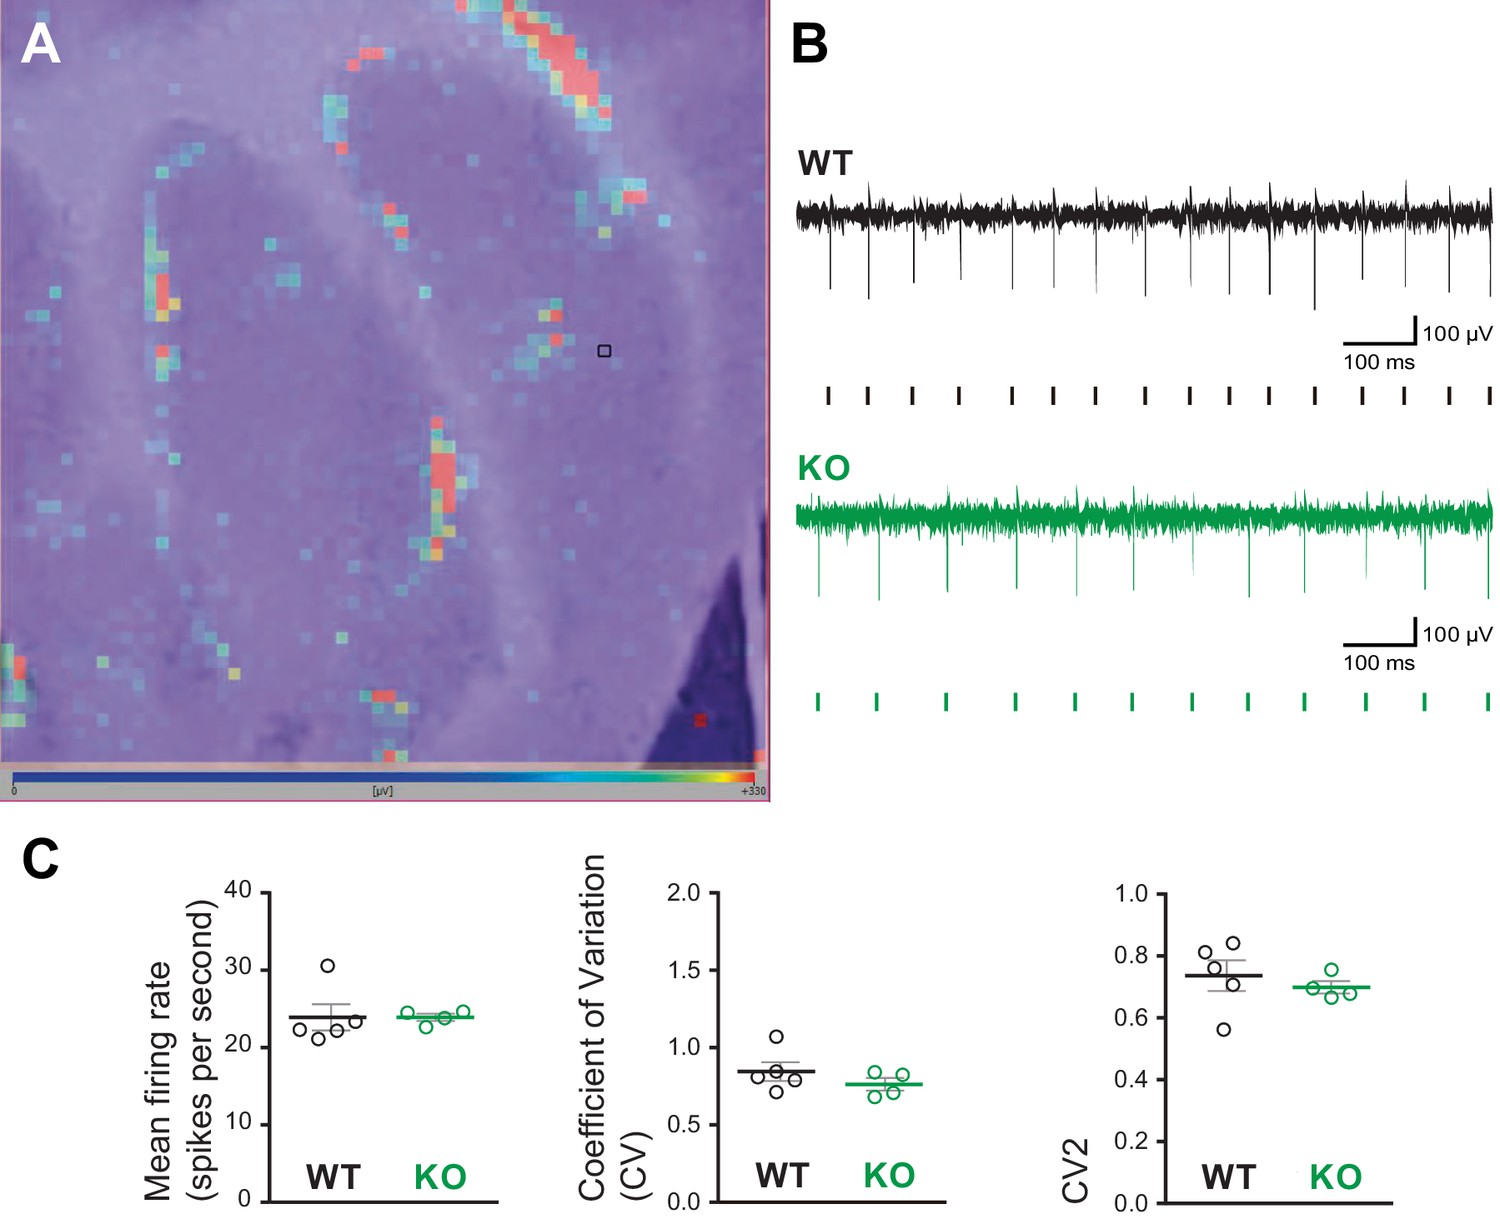
High-density microelectrode array (MEA) analysis of Purkinje cell spiking in acute cerebellar slices from Susd4 knockout (KO) compared to Susd4 wild type (WT).
(A) Image of a cerebellar acute slice from a WT mouse overlapped with the image of the color map of the MEA recording. Each pixel represents one channel, where the active units are in red. The black square highlights one of the channels. (B) Representative traces of electrical activity recorded in one channel from Susd4 WT and KO mice. Each tick points out one action potential that has been detected and sorted by the Brainwave software. (C) Histograms of the mean firing rate, coefficient of variation (CV) of interspike intervals, and CV2. Mean ± s.e.m. (WT n = 5 and KO n = 4 mice; Mann-Whitney test; mean firing rate: p=0.2857; CV: p=0.4127; CV2: p=0.5373).
Figure 2 with 1 supplement
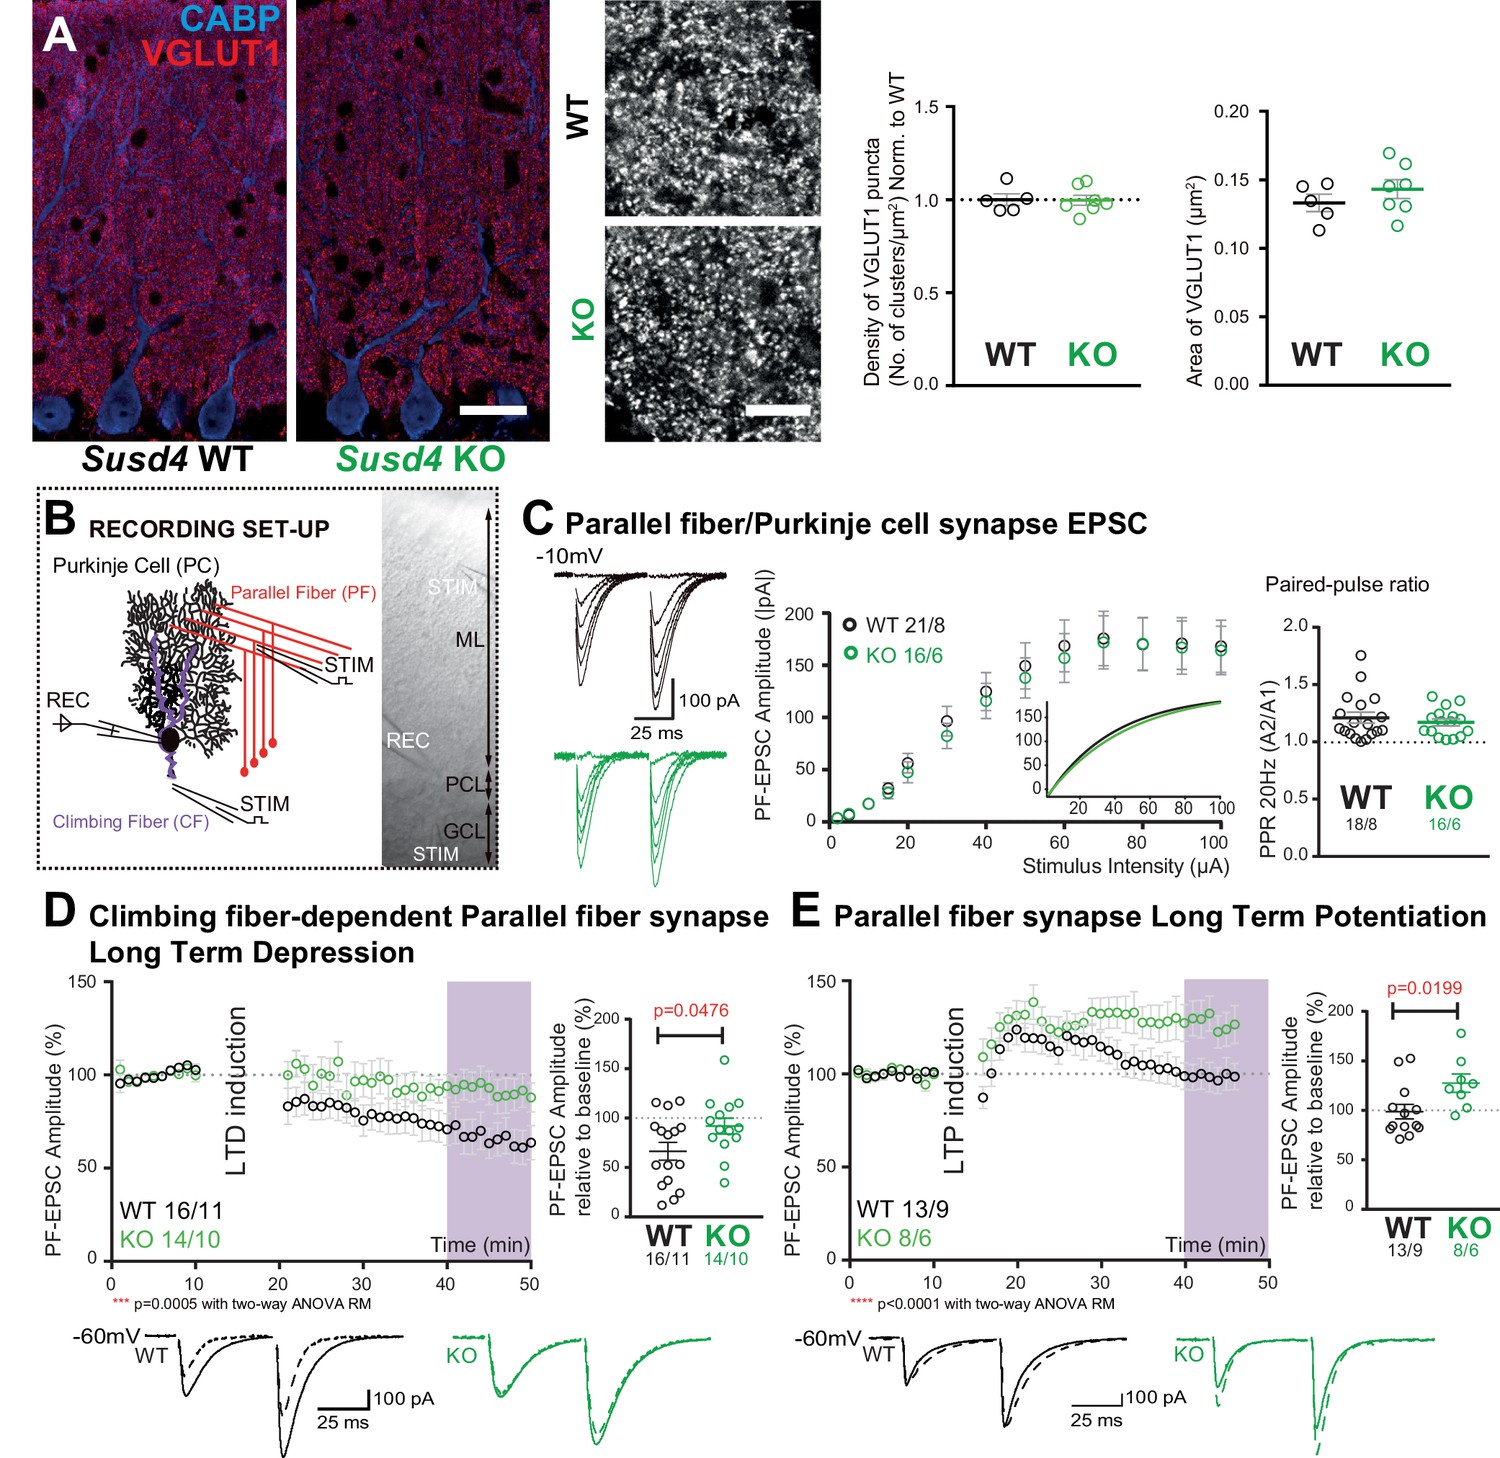
Susd4 loss-of-function leads to deficient long-term depression and facilitated long-term potentiation of parallel fiber (PF)/Purkinje cell synapses.
(A) Quantitative analysis of the morphology of PF presynaptic boutons immunolabeled by an anti-VGLUT1 antibody (red) in Purkinje cells (anti-CABP, blue). Quantifications of the density and the area of the VGLUT1 clusters did not reveal any difference between Susd4 knockout (KO) and Susd4 wild-type (WT) mice. Mean ± s.e.m. (WT n = 5 and KO n = 7 mice; VGLUT1 clusters density: Mann-Whitney test, p>0.9999; area VGLUT1 clusters: unpaired Student’s t-test, p=0.3089). Scale bars 30 µm (left) and 10 µm (right). (B) Diagram of the setup for patch-clamp recordings (REC) of Purkinje cells in 300-µm-thick parasagittal cerebellar slices. PF and climbing fiber responses were elicited by electrical stimulation (STIM). ML: molecular layer; PCL: Purkinje cell layer; GCL: granule cell layer. (C) Input-output curve of the PF/Purkinje cell transmission. The amplitude of the elicited excitatory postsynaptic currents (EPSCs) increases with the intensity of the stimulus and is not significantly different between Susd4 KO and WT littermates. The fitted curves for each genotype are presented in the inset. Representative sample traces are presented. Mean ± s.e.m. (WT n = 18 cells from eight mice and KO n = 16 cells from six mice; Kolmogorov-Smirnov test, p=0.8793). Short-term plasticity of PF/Purkinje cell synapses is not affected by Susd4 loss-of-function. PFs were stimulated twice at 50 ms interval and the paired-pulse ratio (PPR) was calculated by dividing the amplitude of the second peak by the amplitude of the first peak. Mean ± s.e.m. (WT n = 21 cells from eight mice and KO n = 16 cells from six mice; Mann-Whitney test, p=0.9052). (D) Climbing fiber-dependent PF/Purkinje cell synapse long-term depression (LTD) is impaired in the absence of Susd4 expression. LTD was induced by pairing stimulations of PFs and climbing fibers at 100 ms interval during 10 min at 0.5 Hz (see also Figure 2—figure supplement 1). The amplitude of the PF EPSC was measured using two consecutive PF stimulations at 50 ms interval. Representative sample traces are presented. Right: EPSC amplitudes from the last 10 min (purple) of recordings were used to calculate the LTD ratio relative to baseline. Mean ± s.e.m. (WT n = 16 cells from eleven mice and KO n = 14 cells from ten mice; two-tailed Wilcoxon signed rank test with null hypothesis of 100: WT **p=0.0063; KO p=0.2676; Mann-Whitney test, WT vs. KO *p=0.0476). (E) Loss-of-function of Susd4 facilitates PF/Purkinje cell synapse long-term potentiation (LTP). Tetanic stimulation of only PFs at 0.3 Hz for 100 times (see also Figure 2—figure supplement 1) induced LTP in Susd4 KO Purkinje cells while inducing only a transient increase in PF transmission in WT Purkinje cells. Representative sample traces are presented. Right: EPSC amplitudes from the last 7 min (purple) were used to calculate the LTP ratio relative to baseline. Mean ± s.e.m. (WT n = 13 cells from nine mice and KO n = 8 cells from six mice; two-tailed Wilcoxon signed rank test with null hypothesis of 100: WT p=0.5879; KO *p=0.0234; Mann-Whitney test, WT vs. KO: *p=0.0199).
-
Figure 2—source data 1
Numerical data to support graphs in Figure 2.
- https://cdn.elifesciences.org/articles/65712/elife-65712-fig2-data1-v2.xlsx
Figure 2—figure supplement 1
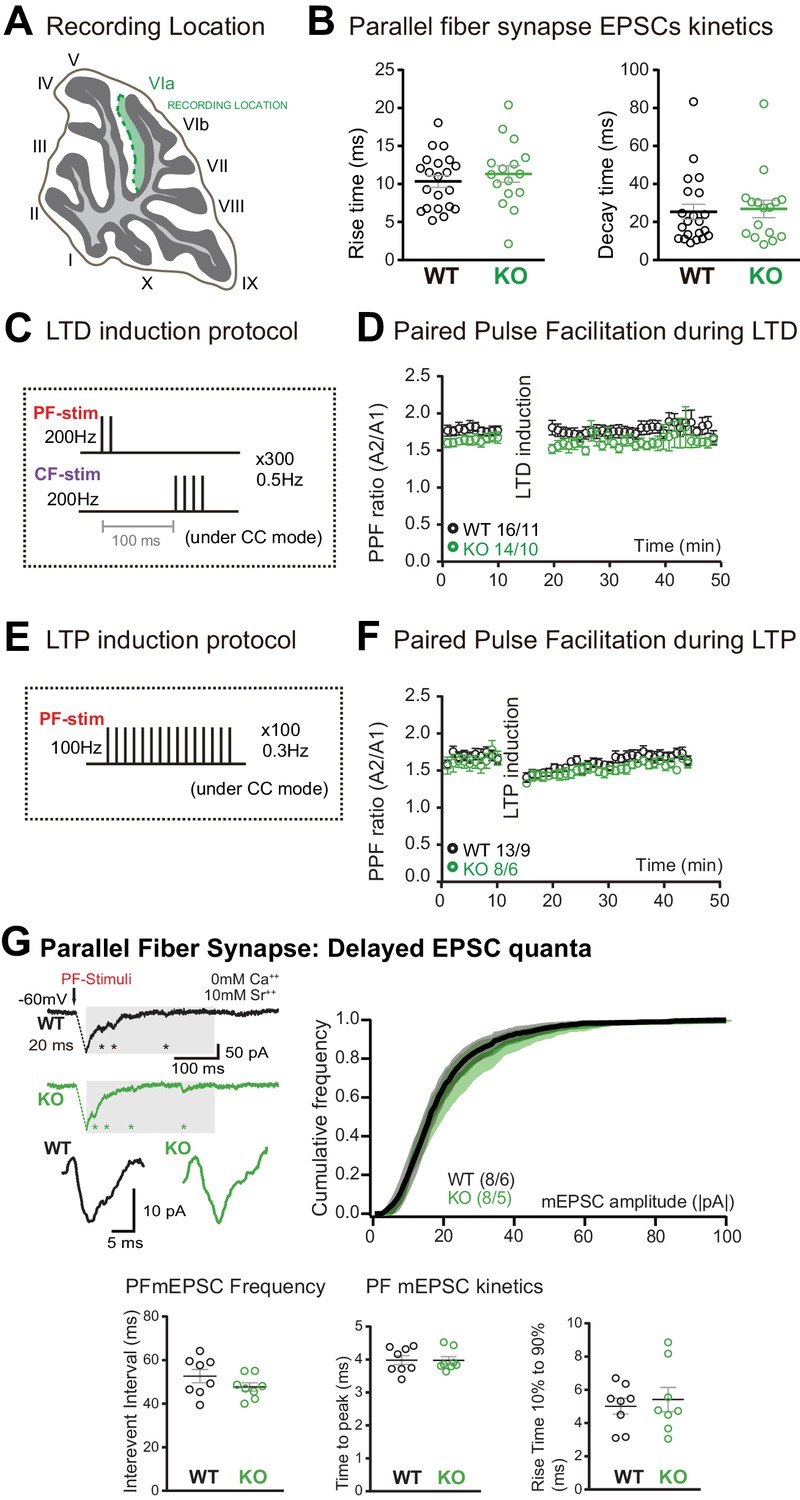
Parallel fiber (PF)/Purkinje cell (PC) synapse excitatory postsynaptic currents (EPSCs) kinetics, long-term plasticity induction protocols, paired-pulse facilitation ratio, and delayed EPSC quanta.
(A) Schematic representation of the recording location (internal lobule VIa of the vermis). (B) No change in the rise time and decay of PF/PC EPSCs was induced by Susd4 deletion. Mean ± s.e.m. (wild-type [WT] n = 21 cells from eight mice and knockout [KO] n = 16 cells from six mice; rise time: unpaired Student’s t-test, p=0.4570; decay time: Mann-Whitney test, p=0.7276). (C) PF long-term depression (LTD) induction protocol. (D) Paired-pulse ratio (A2/A1) during LTD measured at 20 Hz. Mean ± s.e.m. (WT n = 16 cells from 11 mice and KO n = 14 cells from 10 mice; two-way ANOVA with repeated measures, interaction (time and genotype): p=0.9935, F(39, 1092)=0.5222). (E) PF long-term potentiation (LTP) induction protocol. (F) Paired-pulse ratio (A2/A1) during LTP measured at 20 Hz. Mean ± s.e.m. (WT n = 13 cells from nine mice and KO n = 8 cells from six mice, two-way ANOVA with repeated measures, interaction (time and genotype): p=0.9366, F(39, 741)=0.6745). (G) Delayed PF-EPSC quanta were evoked by PF stimulation in the presence of strontium (Sr++) instead of calcium (Ca++) to induce desynchronization of fusion events. Representative sample traces are presented. The cumulative probability for the amplitude shows no difference with Susd4 loss-of-function. The individual frequency values for each cell (measured as interevent interval) present no differences between the genotypes. No change in the time to peak and in the rise time of PF/PC synapse-delayed EPSC quanta was induced by Susd4 deletion. Mean ± s.e.m. (WT n = 8 cells from six mice and KO n = 8 cells from five mice; amplitude: Kolmogorov-Smirnov distribution test, p=0.1667; frequency: Mann-Whitney test, p=0.1913; time to peak: Mann-Whitney test, p=0.6454; rise time 10-90%: unpaired Student’s t-test, p=0.6486).
Figure 3 with 1 supplement

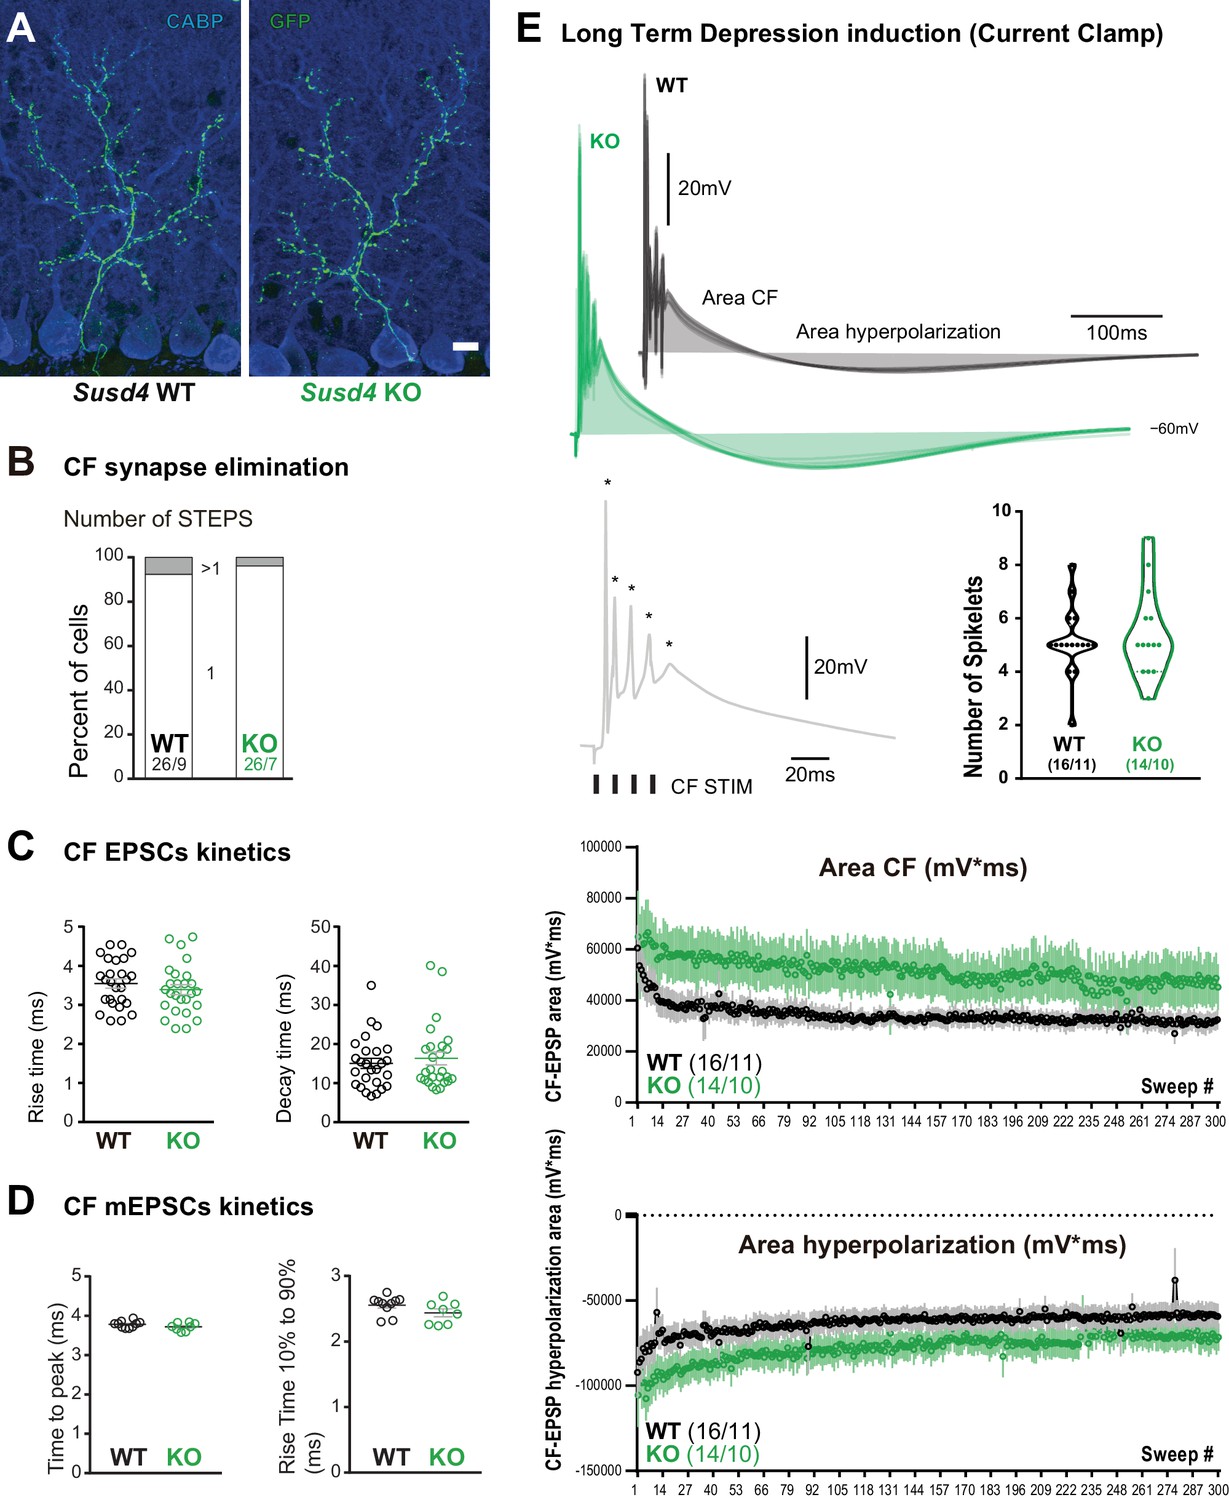
Transmission at the climbing fiber (CF)/Purkinje cell synapses is increased in Susd4 knockout (KO) mice.
(A) Climbing fiber presynaptic boutons were immunostained with an anti-VGLUT2 antibody in cerebellar sections from P30 Susd4 wild-type (WT) and Susd4 KO mice. The extension of the CF synaptic territory was calculated by measuring the extent of the VGLUT2 (red) labeling relative to the height of the Purkinje cell dendritic tree (immunostained using an anti-CABP antibody, blue). Quantification of the mean density of VGLUT2 puncta and their mean area showed no differences between Susd4 KO mice and their control littermates. Mean ± s.e.m. (WT n = 5 and KO n = 7 mice; VGLUT2 extension: Mann-Whitney test, p=0.6389; VGLUT2 area: unpaired Student’s t-test, p=0.4311; VGLUT2 density: unpaired Student’s t-test, p=0.8925). Scale bars 30 µm (left) and 10 µm (right). (B) Short-term synaptic plasticity of CF/Purkinje cell synapses was elicited by two consecutive stimulations at various intervals. The amplitude of the CF-elicited excitatory postsynaptic current (EPSC) was increased in Susd4 KO mice compared to WT littermates. (WT n = 26 cells, nine mice and KO n = 26 cells, seven mice, Mann-Whitney test, **p=0.0066). No difference in the paired-pulse ratios (PPRs) was detected at any interval between Susd4 KO mice and WT mice. Representative sample traces are presented. See also Figure 3—figure supplement 1. Mean ± s.e.m. (WT n = 12 cells from three mice and KO n = 17 cells from five mice; Kolmogorov-Smirnov test, p=0.4740). (C) Delayed CF-EPSC quanta were evoked by CF stimulation in the presence of Sr++ instead of Ca++ to induce desynchronization of fusion events. Representative sample traces are presented. The cumulative probability for the amplitude of the events together with the individual amplitude values for each event show an increased amplitude associated with Susd4 loss-of-function. The individual frequency values for each cell (measured as interevent interval, IEI) present no differences between the genotypes. See also Figure 3—figure supplement 1. Mean ± s.e.m. (WT n = 10 cells from six mice and KO n = 8 cells from three mice; amplitude: Kolmogorov-Smirnov distribution test, ***p<0.0001; frequency: Mann-Whitney test, p=0.6334).
-
Figure 3—source data 1
Numerical data to support graphs in Figure 3.
- https://cdn.elifesciences.org/articles/65712/elife-65712-fig3-data1-v2.xlsx
Figure 3—figure supplement 1
Characteristics of the climbing fiber (CF)/Purkinje cell (PC) synapse.
(A) CFs were visualized in Susd4 wild-type (WT) and knockout (KO) mice crossed with Htr5b-eGFP reporter mice expressing the green fluorescent protein (GFP) specifically in inferior olivary neurons. Anti-GFP and anti-CABP (to visualize PCs) immunolabeling was performed on parasagittal sections of P30 mice and showed no qualitative differences in the absence of Susd4 expression. Scale bar 10 µm. (B) Patch-clamp recordings of PCs showed a similar percentage of mono- (one climbing fiber) and multi-innervation (>1 CFs) of PCs in P30 Susd4 KO and WT mice, as measured by the number of steps elicited by electrical stimulation of the CFs (WT n = 26 cells from nine mice and KO n = 26 cells from seven mice; chi-square test, p=0.5520). (C) No change in the rise and decay times of CF/PC excitatory postsynaptic currents (EPSCs) was induced by Susd4 deletion. Mean ± s.e.m. (WT n = 26 cells from nine mice and KO n = 26 cells from seven mice; rise time: unpaired Student’s t-test, p=0.3750; decay time: Mann-Whitney test, p=0.7133). (D) No change in the time to peak and in the rise time of CF/PC synapse-delayed EPSC quanta was induced by Susd4 loss-of-function. Mean ± s.e.m. (WT n = 10 cells from six mice and KO n = 8 cells from three mice; time to peak: unpaired Student’s t-test, p=0.1692; rise time 10-90%: Mann-Whitney test, p=0.0639). (E) CF/PC transmission was monitored during long-term depression (LTD) induction in current-clamp mode. Representative traces of the CF-EPSP are shown. The quantification of the number of spikelets (spikes induced by repeated CF stimulation [Mathy et al., 2009; Titley et al., 2019]) did not reveal any difference between WT and KO PCs (unpaired Student’s t-test, p=0.5791). Bottom: Measurements of the CF-EPSP area and hyperpolarization area during the LTD induction protocol. Mean ± s.e.m. (WT n = 16 cells from 11 mice and KO n = 14 cells from 10 mice).
Figure 4 with 2 supplements

Loss of SUSD4 leads to misregulation of the AMPA receptor subunit GluA2.
(A) The number of GluA2 clusters (anti-GluA2 immunolabeling, green) per climbing fiber presynaptic bouton (anti-VGLUT2 immunolabeling, red) and their intensity were quantified in cerebellar sections of juvenile Susd4 knockout (KO) mice and Susd4 wild-type (WT) littermates. Cumulative plot for the mean GluA2 intensity per VGLUT2 bouton shows no significant change between WT and KO. The distribution of the VGLUT2 boutons according to the number of associated GluA2 clusters is significantly different between WT and KO. Mean ± s.e.m. (WT n = 5 and KO n = 5 mice; intensity: Kolmogorov-Smirnov test, p=0.5009; distribution: chi-square contingency test, ****p<0.0001). Scale bars 30 µm (top) and 15 µm (bottom). (B) Activity-dependent changes in surface localization of GluA2 was studied in cerebellar acute slices from Susd4 KO mice and control Susd4 WT littermates using a chemical LTD protocol (cLTD; K-Glu: K+50 mM and glutamate 10 μM for 5 min followed by 30 min of recovery). Surface biotinylation of GluA2 subunits was followed by affinity purification of biotinylated GluA2 subunits and anti-GluA2 immunoblot analysis. The fraction of biotinylated GluA2 was obtained by measuring the levels of biotinylated GluA2 in affinity-purified samples and total GluA2 normalized to βACTIN in input samples for each condition. The ratios between the fraction of biotinylated GluA2 after cLTD and control conditions are represented. Mean ± s.e.m. (n = 8 independent experiments; two-tailed Student’s one sample t-test was performed on the ratios with a null hypothesis of 1, PWT = 0.0212 and PKO = 0.0538). (C) Activity-dependent degradation of GluA2 was assessed in cerebellar acute slices from Susd4 KO and WT mice after induction of chemical LTD (cLTD; K-Glu: K+50 mM and glutamate 10 μM for 5 min followed by 30 min of recovery). This degradation was absent when slices were incubated with 100 µg/mL leupeptin and with 50 µM MG132 (to inhibit lysosomal and proteasome degradation, respectively), or when slices were obtained from Susd4 KO mice. Band intensities of GluA2 were normalized to βACTIN. The ratios between levels with cLTD induction (K-Glu) and without cLTD induction (CTL) are represented. See also Figure 4—figure supplement 1. Mean ± s.e.m. (n = 8 independent experiments; two-tailed Student’s one sample t-test was performed on the ratios with a null hypothesis of 1, PWT = 0.0107, PWT+Leu/MG132 = 0.3755, PKO = 0.3176 and PKO+Leu/MG132 = 0.2338). (D) Purkinje cells from primary cerebellar cultures of L7Cre mice were transduced at 3 days in vitro (DIV3) with AAV particles driving the expression of HA-SUSD4 and soluble GFP (AAV2-hSYN-DIO-HA-SUSD4-2A-eGFP) and immunolabeled at DIV17 in non-permeabilizing conditions to localize surface SUSD4 (anti-HA, red) and surface GluA2 subunits (anti-GluA2, blue). Direct green fluorescent protein is shown (GFP, green). Right panels are binarized images of the anti-HA and anti-GluA2 immunolabelings and of the colocalization of these signals (maximum projection of a 1.8 µm z-stack). Scale bar 5 µm.
-
Figure 4—source data 1
Numerical data to support graphs in Figure 4.
- https://cdn.elifesciences.org/articles/65712/elife-65712-fig4-data1-v2.xlsx
Figure 4—figure supplement 1
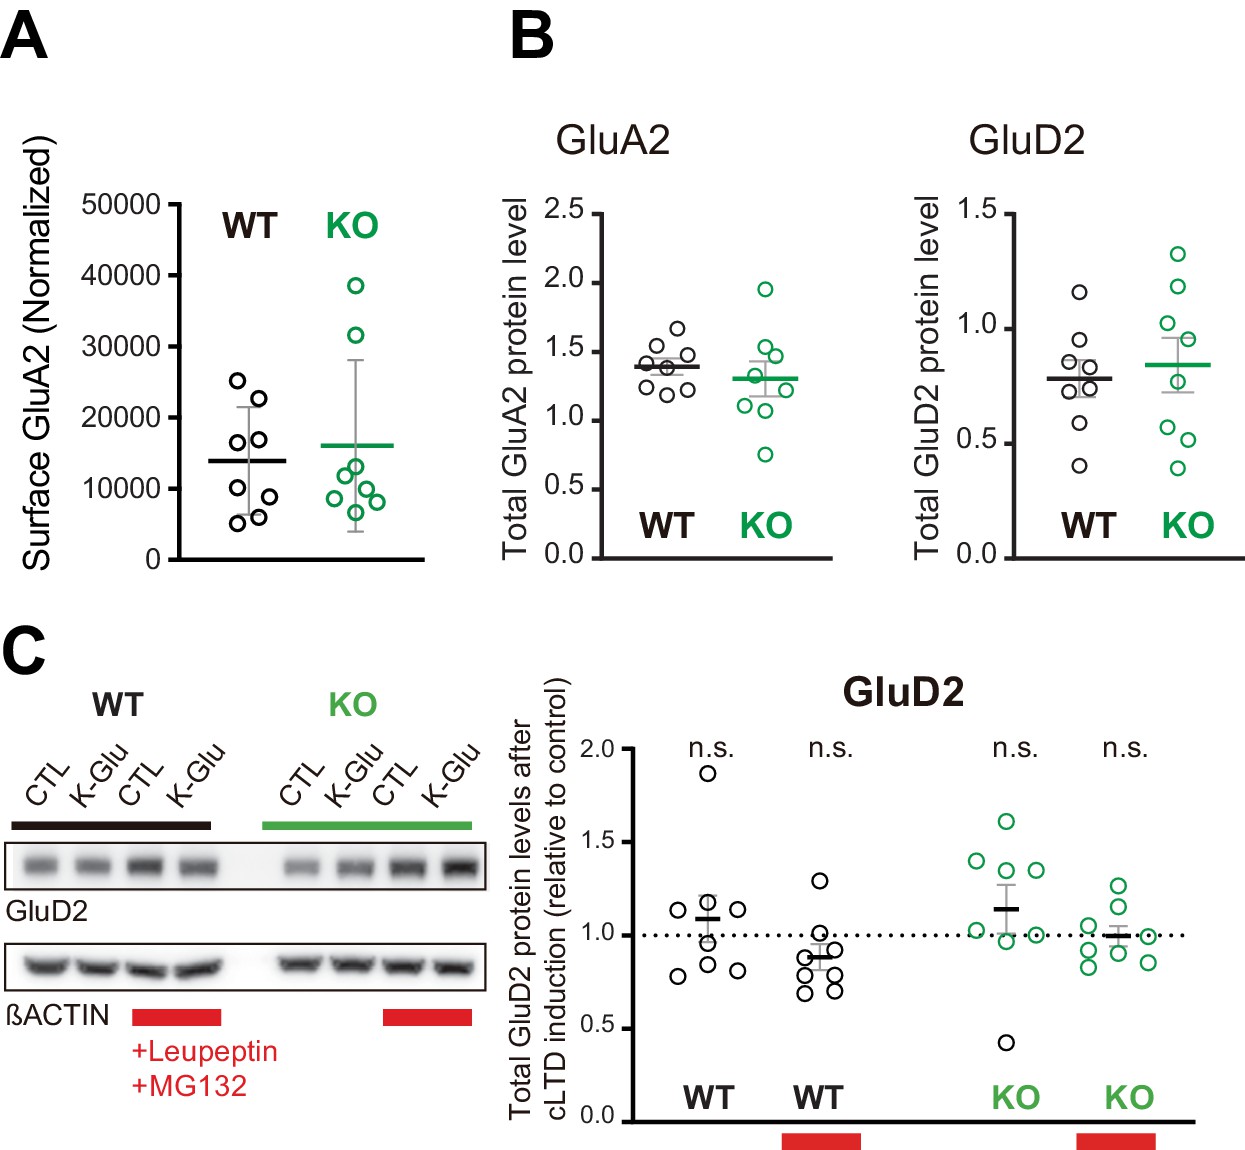
Basal surface GluA2 levels and total GluA2 and GluD2 levels in SUSD4 knockout (KO) mice.
(A) Surface GluA2 levels (relative to normalized GluA2 input) in basal conditions were not different on average in acute cerebellar slices from Susd4 KO when compared to slices from wild-type (WT) mice. (B) and (C) Total protein levels (normalized to βACTIN) of GluA2 (B) and GluD2 (C) were not changed in acute cerebellar slices from Susd4 WT or KO mice in basal conditions. Mean ± s.e.m. (n = 8 independent experiments; unpaired Student’s t-test; GluA2: p=0.5424; GluD2: p=0.6821). (D) Cerebellar acute slices from control WT and Susd4 KO mice were incubated to induce chemical LTD (cLTD; K-Glu: K+50 mM and glutamate 10 μM for 5 min followed by 30 min of recovery). Slices were incubated with 100 µg/mL leupeptin and with 50 µM MG132 (to inhibit lysosomal and proteasome degradation, respectively). Band intensities of GluD2 were normalized to βACTIN. The ratios between levels with cLTD induction (K-Glu) and without cLTD induction (CTL) are represented. Mean ± s.e.m. (n = 8 independent experiments; two-tailed Student’s one sample t-test was performed on the ratios with a null hypothesis of 1, PWT = 0.4973, PWT+Leu/MG132 = 0.1433, PKO = 0.3143, PKO+Leu/MG132 = 0.9538, n.s. = not significant).
Figure 4—figure supplement 2
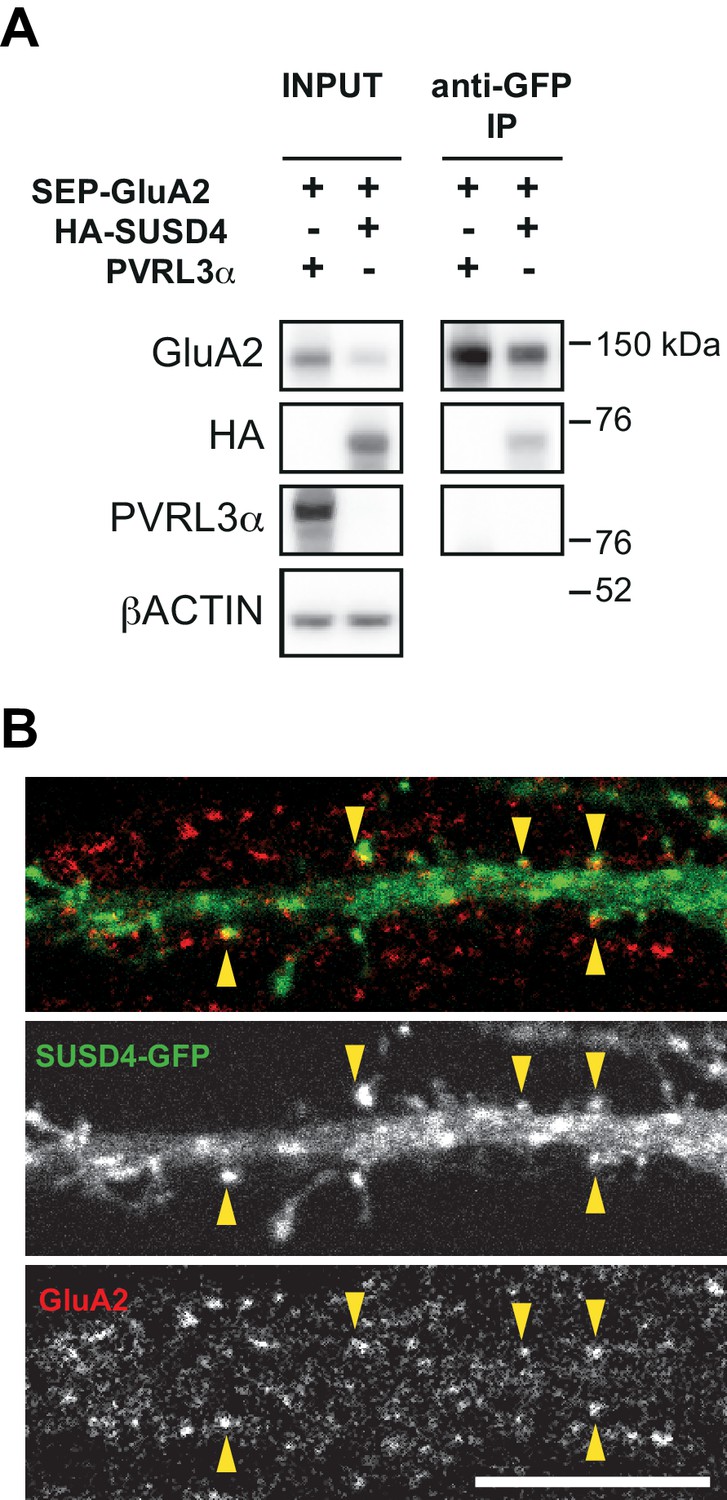
Interaction and colocalization of HA-SUSD4 and the AMPA receptor subunit GluA2.
(A) SUSD4 interaction with GluA2 was assessed by co-immunoprecipitation using HEK293 cells transfected with SEP-GluA2 together with PVRL3α as a control or HA-SUSD4. Affinity purification was performed with an anti-GFP antibody and extracts were probed for co-immunoprecipitation of GluA2 (with an anti-GluA2 antibody) and of HA-SUSD4 (anti-HA antibody) or PVRL3α (anti-PVRL3α antibody). βACTIN was used as a loading control. Representative of N = 3 independent experiments. (B) Mouse hippocampal neurons were transfected at 13 days in vitro (DIV13) with a GFP-tagged SUSD4 construct and immunostained at DIV17 for green fluorescent protein (GFP, green) to localize SUSD4 and for the endogenous GluA2 subunit (anti-GluA2, red). The arrowheads indicate the spines containing SUSD4 and GluA2. Scale bar 10 μm.
Figure 5 with 2 supplements
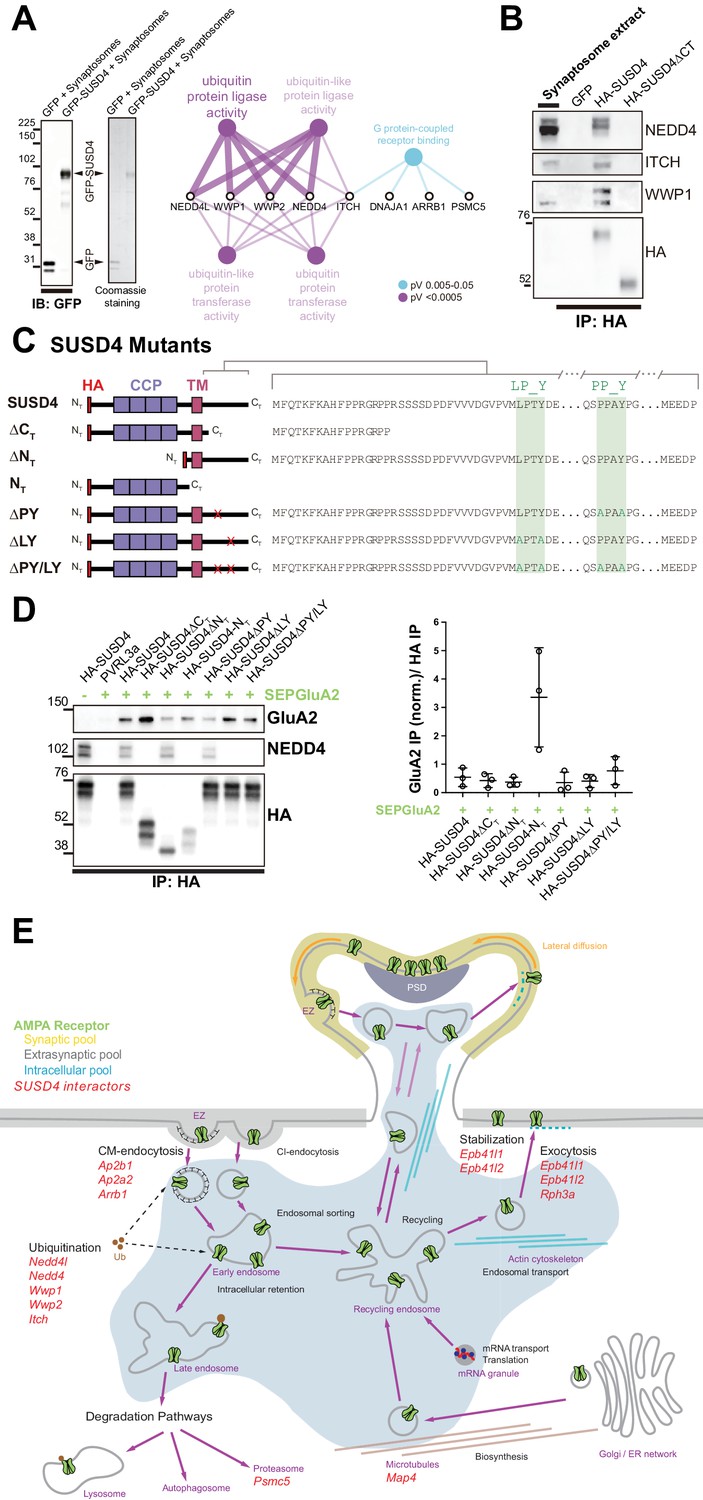
SUSD4 binds NEDD4 ubiquitin ligases, known regulators of AMPA receptor turnover and degradation.
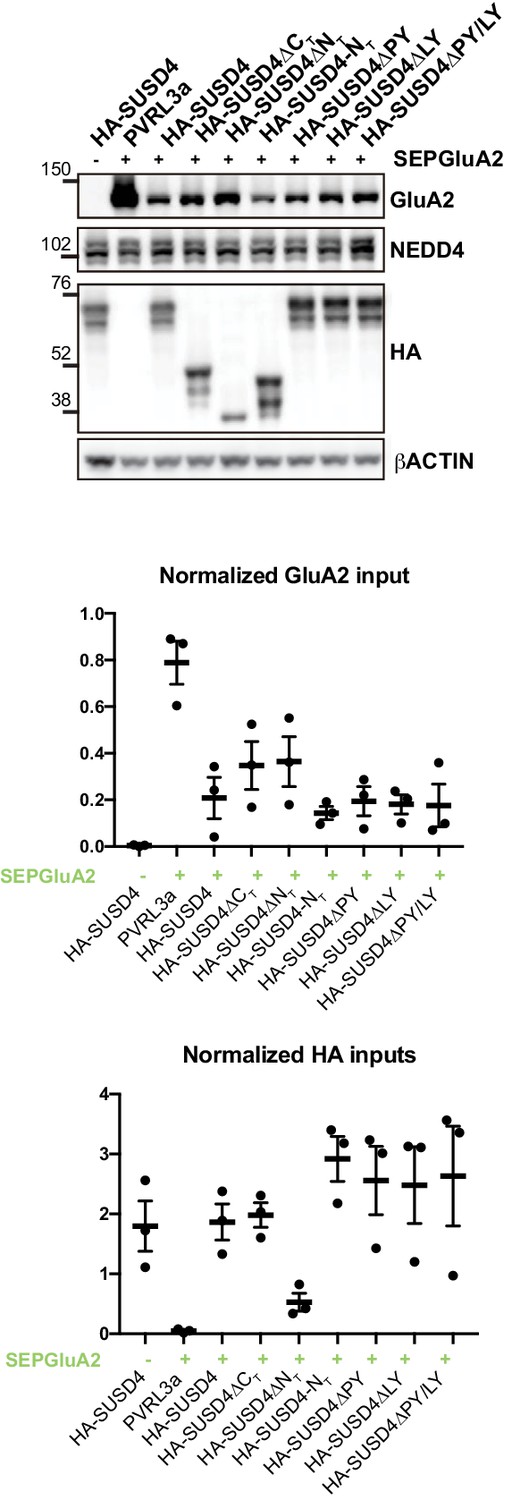
(A) Mass spectrometry identification of SUSD4 interactors. Left: Affinity purification from cerebellar synaptosomes was performed using either GFP-SUSD4 as a bait or GFP as a control. Proteins were then resolved using SDS-PAGE followed by immunoblot for anti-GFP and coomassie staining of proteins. Right: Gene ontology (GO) enrichment analysis network (Molecular Function category) of the 28 candidate proteins (Cytoscape plugin ClueGO) identified in affinity purified samples (A) by liquid chromatography with tandem mass spectrometry (LC MS/MS). The ubiquitin ligase activity term is significantly enriched in particular due to the identification of several members of the NEDD4 family of HECT ubiquitin ligases. See also Table 1 (n = 3 independent experiments). (B) Immunoblot confirmation of SUSD4 interaction with NEDD4 ubiquitin ligases. Affinity purification from cerebellar synaptosomes was performed using full-length SUSD4 (HA-tagged, HA-SUSD4), a mutant lacking the C-terminal tail (HA-SUSD4ΔCT), or GFP as a bait. Proteins were then resolved using SDS-PAGE followed by immunoblot for NEDD4, ITCH, WWP1, or HA-SUSD4 (anti-HA). HA-SUSD4 interacts with all three members of the NEDD4 family. This interaction is lost when the C-terminal tail of SUSD4 is deleted or when GFP is used instead of SUSD4 as a control. (C) Schematic representation of HA-tagged SUSD4 and different mutant constructs: SUSD4ΔCT (lacking the cytoplasmic tail), SUSD4ΔNT (lacking the extracellular domain), SUSD4NT (lacking the transmembrane and intracellular domains), SUSD4ΔPY (point mutation of the PPxY site), SUSD4ΔLY (point mutation of the LPxY), and SUSD4ΔPY/LY (double mutant at both PPxY and LPxY). (D) SUSD4 interaction with GluA2 and NEDD4 was assessed by co-immunoprecipitation using HEK293 cells transfected with SEP-GluA2 together with PVRL3α as a control or one of the HA-SUSD4 constructs represented in (C). Affinity purification was performed with an anti-HA antibody and extracts were probed for co-immunoprecipitation of GluA2 (with an anti-GluA2 antibody) and of the HECT ubiquitin ligase NEDD4 (anti-NEDD4 antibody). Co-immunoprecipitated GluA2 levels are normalized to input GluA2 and then represented as relative to the immunoprecipitated levels for each SUSD4 construct. N = 3 independent experiments. (E) Potential interactors of SUSD4 control several parameters of AMPA receptor turnover. Three different pools of AMPA receptors are found in dendrites and spines: synaptic, extrasynaptic, and intracellular. AMPA receptors are synthetized and delivered close to the synaptic spine to reach the synaptic surface. At the surface, AMPA receptors can move laterally (lateral diffusion) or vertically by endocytosis and exocytosis. Endocytosis can be mediated by clathrin (CM-endocytosis) or be clathrin-independent (CI-endocytosis). CM-endocytosis is often related to activity-dependent processes. After endocytosis, AMPA receptors can choose between two different pathways from the early endosomes, one for recycling and the other for degradation. Potential molecular partners of SUSD4 identified by our proteomic analysis could regulate AMPA receptor turnover at several levels of this cycle (in red).
-
Figure 5—source data 1
Numerical data to support graphs in Figure 5.
- https://cdn.elifesciences.org/articles/65712/elife-65712-fig5-data1-v2.xlsx
Figure 5—figure supplement 1
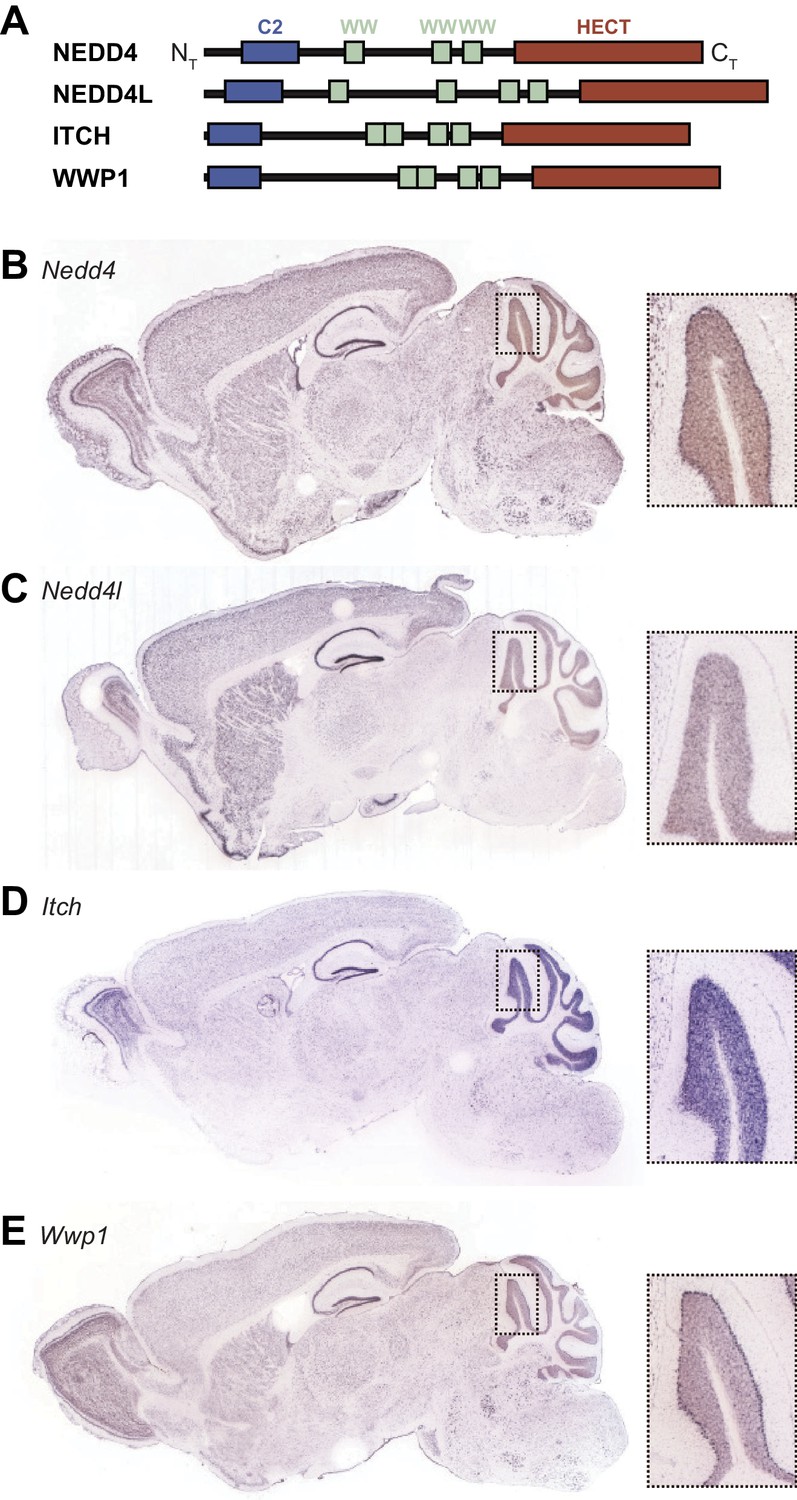
Expression of HECT ubiquitin ligases in adult mouse brain.
(A) Schematic representation of four SUSD4 interactors: NEDD4, NEDD4L, ITCH, and WWP1. Legends: NT, N-terminus; HECT, homologous to the E6-AP C-terminus domain; CT, C-terminus. (B) Pattern of expression of Nedd4 (RP_050712_03_C08), (C) Nedd4l (RP_040625_01_G10), (D) Itch (RP_050222_01_H06), and (E) Wwp1 (RP_050510_02_E12) mRNA in the adult mouse brain. From Allen Brain Atlas (http://www.brain-map.org).
Figure 5—figure supplement 2
Total protein levels in HEK293 cells transfected with SEP-GluA2 and different SUSD4 mutant constructs (related to Figure 5C and D).
HEK293 cells were transfected with SEP-GluA2 together with PVRL3α as a control or one of the HA-SUSD4 constructs for co-immunoprecipitation experiments. Input extracts were probed for GluA2 (with an anti-GluA2 antibody), the HECT ubiquitin ligase NEDD4 (anti-NEDD4 antibody), and the HA-tagged SUSD4 constructs (anti-HA antibody). βACTIN was used as a loading control. Representative image of N = 3 independent experiments. Quantifications represent the GluA2 or HA band intensity normalized to the intensity of the βACTIN band.
Tables
Table 1
List of SUSD4 interactors.
Proteomic identification of SUSD4 interacting partners affinity-purified from synaptosomes extracts using GFP-SUSD4 as a bait (≥2 unique peptides; enrichment factor ≥4).
| UniProtKB accession num. | Protein name | Gene name | Mol. weight (kDa) | Unique peptides | MS/MS count | Enrichment factor |
|---|---|---|---|---|---|---|
| Q8CFI0 | E3 ubiquitin-protein ligase NEDD4-like | Nedd4l | 115,42 | 28 | 319 | 159.5 |
| Q8BH32 | Sushi domain-containing protein 4 | Susd4 | 53,796 | 4 | 97 | 48.5 |
| Q8BZZ3 | NEDD4-like E3 ubiquitin-protein ligase WWP1 | Wwp1 | 104,69 | 13 | 90 | 45 |
| Q8C863 | E3 ubiquitin-protein ligase Itchy | Itch | 98,992 | 24 | 83 | 41.5 |
| Q3TXU5 | Deoxyhypusine synthase | Dhps | 40,642 | 9 | 81 | 40.5 |
| Q9DBG3 | AP-2 complex subunit beta | Ap2b1 | 104,58 | 9 | 47 | 23.5 |
| P50171 | Estradiol 17-beta-dehydrogenase 8 | Hsd17b8 | 26,588 | 2 | 32 | 16 |
| Q9DBH0 | NEDD4-like E3 ubiquitin-protein ligase WWP2 | Wwp2 | 98,76 | 14 | 31 | 15.5 |
| Q922R8 | Protein disulfide-isomerase A6 | Pdia6 | 48,1 | 8 | 26 | 13 |
| P27773 | Protein disulfide-isomerase A3 | Pdia3 | 56,678 | 12 | 24 | 12 |
| P17427 | AP-2 complex subunit alpha-2 | Ap2a2 | 104,02 | 7 | 23 | 11.5 |
| Q8BWG8 | Beta-arrestin-1 | Arrb1 | 46,972 | 4 | 23 | 11.5 |
| Q91WC3 | Long-chain fatty acid – CoA ligase 6 | Acsl6 | 78,016 | 11 | 22 | 11 |
| P27546 | Microtubule-associated protein 4 | Map4 | 117,43 | 9 | 18 | 9 |
| Q505F5 | Leucine-rich repeat-containing protein 47 | Lrrc47 | 63,589 | 9 | 17 | 8.5 |
| Q9Z2H5 | Band 4.1-like protein 1 | Epb41l1 | 98,314 | 8 | 17 | 8.5 |
| P46935 | E3 ubiquitin-protein ligase NEDD4 | Nedd4 | 102,71 | 7 | 17 | 8.5 |
| Q8BMK4 | Cytoskeleton-associated protein 4 | Ckap4 | 63,691 | 11 | 16 | 8 |
| P47708 | Rabphilin-3A | Rph3a | 75,488 | 7 | 15 | 7.5 |
| P42128 | Forkhead box protein K1 | Foxk1 | 74,919 | 6 | 15 | 7.5 |
| P62812 | Gamma-aminobutyric acid receptor subunit alpha-1 | Gabra1 | 51,753 | 7 | 14 | 7 |
| Q60737 | Casein kinase II subunit alpha | Csnk2a1 | 45,133 | 7 | 13 | 6.5 |
| Q99KV1 | DnaJ homolog subfamily B member 11 | Dnajb11 | 40,555 | 5 | 10 | 5 |
| P63037 | DnaJ homolog subfamily A member 1 | Dnaja1 | 44,868 | 4 | 10 | 5 |
| Q9QY76 | Septin-11 | Sept11 | 49,694 | 5 | 9 | 4.5 |
| O70318 | Band 4.1-like protein 2 | Epb41l2 | 109,94 | 6 | 8 | 4 |
| P62196 | 26S protease regulatory subunit 8 | Psmc5 | 45,626 | 5 | 8 | 4 |
| Q9Z2Q6 | Septin-5 | Sept5 | 42,747 | 4 | 8 | 4 |
Key resources table
| Reagent type (species) or resource | Designation | Source or reference | Identifiers | Additional information |
|---|---|---|---|---|
| Gene (Mus musculus) | Susd4 | NCBI | Gene ID: 96935 | chr1:182,764,895–182,896,591 |
| Strain (Mus musculus) | Susd4 knockout mice | Lexicon Genetics Incorporated, Tang et al., 2010 | B6:129S5-Susd4tm1Lex | |
| Strain (Mus musculus) | Htr5b-GFP mouse line | Gene Expression Nervous System Atlas (GENSAT) Project | STOCK Tg(Htr5b-EGFP)BZ265Gsat/Mmmh | |
| Strain (Mus musculus) | L7Cre mouse line | Jackson Laboratories | B6.129-Tg(Pcp2-cre)2Mpin/J | Stock number 004146 |
| Cell line (Homo sapiens) | HEK293H | Gibco | Cat# 11631–017 | |
| Cell line (Homo sapiens) | HeLA | Sigma | Cat# 93021013 | |
| Antibody | Mouse monoclonal anti-CABP | Swant | Cat# 300 | (1:1000) |
| Antibody | Rabbit polyclonal anti-CABP | Swant | Cat# CB38 | (1:1000) |
| Antibody | Mouse monoclonal anti-GFP | Abcam | Cat# ab1218 | (1:1000) |
| Antibody | Rabbit polyclonal anti-GFP | Abcam | Cat# ab6556 | (1:1000) |
| Antibody | Mouse monoclonal anti-GLUA2, clone 6C4 | Millipore and BD | Cat# MAB397 and Cat# 556341 | (1:500) |
| Antibody | Rabbit monoclonal anti-GLUA2 | Abcam | Cat# ab206293 | (1:1000) |
| Antibody | Rabbit polyclonal anti-GLURδ1/2 | Millipore | Cat# AB2285 | (1:1000) |
| Antibody | Rat monoclonal anti-HA | Roche Life | Cat# 11867423001 | (1:1000) |
| Antibody | Rabbit monoclonal anti-ITCH | Cell Signaling Technology | Cat# 12117 | (1:1000) |
| Antibody | Rabbit polyclonal anti-NEDD4 | Millipore | Cat# 07–049 | (1:100,000) |
| Antibody | Guinea pig polyclonal anti-VGLUT1 | Millipore | Cat# AB5905 | (1:5000) |
| Antibody | Guinea pig polyclonal anti-VGLUT2 | Millipore | Cat# AB2251 | (1:5000) |
| Antibody | Rabbit polyclonal anti-WWP1 | Proteintech | Cat# 13587–1-AP | (1:2000) |
| Antibody | Donkey polyclonal anti-goat Alexa Fluor 568 | Invitrogen | Cat# A11057 | (1:1000) |
| Antibody | Donkey anti-mouse Alexa Fluor 488 | Invitrogen | Cat# R37114 | (1:1000) |
| Antibody | Donkey polyclonal anti-mouse Alexa Fluor 568 | Invitrogen | #A10037 | (1:1000) |
| Antibody | Donkey polyclonal anti-rabbit Alexa Fluor 488 | Invitrogen | Cat# A21206 | (1:1000) |
| Antibody | Donkey polyclonal anti-rat Alexa Fluor 594 | Invitrogen | #A21209 | (1:1000) |
| Antibody | Donkey polyclonal anti-rat Alexa Fluor 568 | Abcam | Cat# 175475 | (1:1000) |
| Antibody | Goat polyclonal anti-guinea Pig Alexa Fluor 488 | Invitrogen | Cat# A110-73 | (1:1000) |
| Antibody | Goat polyclonal anti-guinea Pig Alexa Fluor 647 | Invitrogen | Cat# A21450 | (1:1000) |
| Antibody | Goat polyclonal anti-mouse HRP | Jackson Immune Research Laboratories | Cat# 115-035-174 | (1:10,000) |
| Antibody | Goat polyclonal anti-rat HRP | Jackson Immune Research Laboratories | #112-035-175 | (1:10,000) |
| Antibody | Sheep polyclonal anti-digoxigenin alkaline phosphatase | Roche Life Science | Cat# 11093274910 | (1:2000 - 1:5000) |
| Antibody | Mouse monoclonal anti-βACTIN HRP, clone AC-15 | Abcam | Cat# ab49900 | (1:25,000) |
| Recombinant DNA reagent | pHA-SUSD4-GFP | This paper | From pEGFP-N1 (Addgene, Cat# 6085–1) | |
| Recombinant DNA reagent | pHA-SUSD4 | This paper | ||
| Recombinant DNA reagent | pHA-SUSD4-ΔNT | This paper | ||
| Recombinant DNA reagent | pHA-SUSD4-NT | This paper | ||
| Recombinant DNA reagent | HA-SUSD4-ΔPY | This paper | ||
| Recombinant DNA reagent | HA-SUSD4-ΔLY | This paper | ||
| Recombinant DNA reagent | HA-SUSD4-ΔPY/LY | This paper | ||
| Recombinant DNA reagent | pIRES2-eGFP | Addgene | Cat# 6029–1 | |
| Recombinant DNA reagent | pCAG-PVRL3α | This paper | From pCAG-mGFP (Addgene, Cat# 14757) | |
| Sequenced-based reagent | Susd4_WT_F | This paper | PCR primers | CTG TGG TTT CAA CTG GCG CTG TG |
| Sequenced-based reagent | Susd4_WT_R | This paper | PCR primers | GCT GCC GGT GGG TGT GCG AAC CTA |
| Sequenced-based reagent | Susd4_KO_F | This paper | PCR primers | TTG GCG GTT TCG CTA AAT AC |
| Sequenced-based reagent | Susd4_KO_R | This paper | PCR primers | GGA GCT CGT TAT CGC TAT GAC |
| Sequenced-based reagent | Htr5b-GFP_F | PCR primers | TTG GCG CGC CTC CAA CAG GAT GTT AAC AAC | |
| Sequenced-based reagent | Htr5b-GFP_R | PCR primers | CGC CCT CGC CGG ACA CGC TGA AC | |
| Sequenced-based reagent | L7cre_1 | PCR primers | GGT GAC GGT CAG TAA ATT GGA C | |
| Sequenced-based reagent | L7cre_2 | PCR primers | CAC TTC TGA CTT GCA CTT TCC TTG G | |
| Sequenced-based reagent | L7cre_3 | PCR primers | TTC TTC AAG CTG CCC AGC AGA GAG C | |
| Chemical compound, drug | Picrotoxin | Sigma-Aldrich | Cat# P1675 | |
| Chemical compound, drug | D-AP5 | Tocris | Cat# 0106 | |
| Chemical compound, drug | CGP52432 | Tocris | Cat# 1246 | |
| Chemical compound, drug | JNJ16259685 | Tocris | Cat# 2333 | |
| Chemical compound, drug | DPCPX | Tocris | Cat# 0439 | |
| Chemical compound, drug | AM251 | Tocris | Cat# 1117 | |
| Software, algorithm | Sinaptiqs | Antoine Valera | Software written in Python | http://synaptiqs.wixsite.com/synaptiqs |
| Other | Hoechst 33342 | Sigma | Cat# 14533 | |
| Recombinant viral particles | hSYN-DIO-HA-SUSD4-2A-eGFP-WPRE | Vector biolabs | AAV2 particles |
Additional files
-
Supplementary file 1
Behavioral characterization of Susd4 KO mice.
- https://cdn.elifesciences.org/articles/65712/elife-65712-supp1-v2.docx
-
Transparent reporting form
- https://cdn.elifesciences.org/articles/65712/elife-65712-transrepform-v2.docx
Download links
A two-part list of links to download the article, or parts of the article, in various formats.
Downloads (link to download the article as PDF)
Open citations (links to open the citations from this article in various online reference manager services)
Cite this article (links to download the citations from this article in formats compatible with various reference manager tools)
Sushi domain-containing protein 4 controls synaptic plasticity and motor learning
eLife 10:e65712.
https://doi.org/10.7554/eLife.65712


