Unveiling the sensory and interneuronal pathways of the neuroendocrine connectome in Drosophila
- Department of Molecular Brain Physiology and Behavior, LIMES Institute, University of Bonn, Germany
- Department of Zoology, University of Cambridge, United Kingdom
- Life & Brain, Institute for Experimental Epileptology and Cognition Research, University of Bonn Medical Center Germany, Germany
- Janelia Research Campus, Howard Hughes Medical Institute, United States
- MRC Laboratory of Molecular Biology, Cambridge Biomedical Campus, Francis Crick Avenue, United Kingdom
- Department of Physiology, Development and Neuroscience, United Kingdom
Abstract
Neuroendocrine systems in animals maintain organismal homeostasis and regulate stress response. Although a great deal of work has been done on the neuropeptides and hormones that are released and act on target organs in the periphery, the synaptic inputs onto these neuroendocrine outputs in the brain are less well understood. Here, we use the transmission electron microscopy reconstruction of a whole central nervous system in the Drosophila larva to elucidate the sensory pathways and the interneurons that provide synaptic input to the neurosecretory cells projecting to the endocrine organs. Predicted by network modeling, we also identify a new carbon dioxide-responsive network that acts on a specific set of neurosecretory cells and that includes those expressing corazonin (Crz) and diuretic hormone 44 (Dh44) neuropeptides. Our analysis reveals a neuronal network architecture for combinatorial action based on sensory and interneuronal pathways that converge onto distinct combinations of neuroendocrine outputs.
Introduction
An organism is constantly subject to changing environmental challenges to homeostasis, and it counteracts these changes by adapting its physiology and behavior (Selye, 1956). In order to regulate homeostasis, animals must sense and integrate external and internal changes and generate outputs that comprise fundamental motivational drives such as feeding, fleeing, fighting, and mating (Pribram, 1960). This output ultimately leads to motor activities through movement of muscles or through secretion of hormones that act on target tissues. The neuroendocrine system in any animal with a nervous system plays a vital role in controlling both forms of outputs. In its simpler form, for example, in cnidarians, this takes place in a single sheet of epidermal cells that subsumes the functions of sensory, inter-, motor neurons and peptidergic cells (Grimmelikhuijzen et al., 1996; Martin, 1992). With more complex systems, the requirement for environmental sensing, integrating information and controlling motor outputs has given rise to specialized neurons of the periphery and the central nervous system (CNS) (Buijs and Van Eden, 2000; Hartenstein, 2006; Toni, 2004).
In mammals, different hormonal axes exist to keep essential physiological functions in balance, including the hypothalamic-pituitary-adrenal (HPA), the hypothalamic-pituitary-thyroid, the somatotropic, and the two reproductive axes (Charmandari et al., 2005; Fliers et al., 2014; Grattan, 2015; Kaprara and Huhtaniemi, 2018). The various neuroendocrine axes also regulate each other. For example, the stress regulatory HPA axis relies on corticotropin releasing hormone (CRH) in the hypothalamus and has a negative influence on the reproductive regulatory axis (hypothalamic-pituitary-gonadal [HPG]) by inhibiting gonadotropin releasing hormone (GnRH) (Kageyama, 2013; Rivier et al., 1986) such that when nutrients are scarce, the reproductive system is negatively affected until metabolic homeostasis is re-established (Tilbrook et al., 2002). The peptidergic basis for homeostatic regulation has also been characterized in invertebrates. These include, to name a few, stress (Johnson and White, 2009; Kubrak et al., 2016; Veenstra, 2009), metabolism and growth (Cannell et al., 2016; Dus et al., 2015; Gáliková et al., 2018; Geminard et al., 2006; Kahsai et al., 2010; Kim and Rulifson, 2004; McBrayer et al., 2007), and development (Hartenstein, 2006; Jindra et al., 2013; Truman, 2019; Truman et al., 1981; Wigglesworth, 1965). For comprehensive reviews, see Nässel, 2018, Nässel and Winther, 2010, and Nässel and Zandawala, 2019. Despite the extensive characterization of the neuroendocrine system in both vertebrates and invertebrates, very little is known regarding the sensory inputs to the neuroendocrine cells in the CNS. In general, a neuroendocrine system consists of neurosecretory cells in the brain that release peptides/hormones into the circulation to modulate effector organs. Via hormonal feedback loops, the neuroendocrine system is able to tune its regulatory function to set itself back into homeostasis. However, the synaptic pathways of sensory signals onto the neurosecretory cells in the brain remain largely elusive.
The Drosophila larva is a well-suited model to tackle the issue of the sensory pathways that act on the central neuroendocrine system. Parallels to the mammalian HPA system have been pointed out at physiological and anatomical levels. The pars intercerebralis (PI) and pars lateralis (PL) regions of the larval brain are considered to be analogous to the vertebrate hypothalamus. The three known endocrine glands (collectively known as the ring gland) – the corpora cardiaca (CC), the corpus allatum (CA), and the prothoracic gland (PG) – exert functions that are physiologically similar to the vertebrate pituitary gland (de Velasco et al., 2007; Hartenstein, 2006; Scharrer and Scharrer, 1944). These produce the critical metabolic, growth, and maturation factors that are released directly into the circulation (adipokinetic hormone from the CC; juvenile hormone from the CA; ecdysone from the PG). There are also analogies in basic functional and anatomical features that interconnect the hypothalamus and the brainstem in mammals, and the PI/PL region and the subesophageal zone (SEZ) in Drosophila. These also include the connections from the enteric nervous system to the CNS via the vagus nerve in mammals and the recurrent nerve in Drosophila (Schlegel et al., 2016; Schoofs et al., 2014b; Figure 1).
Figure 1
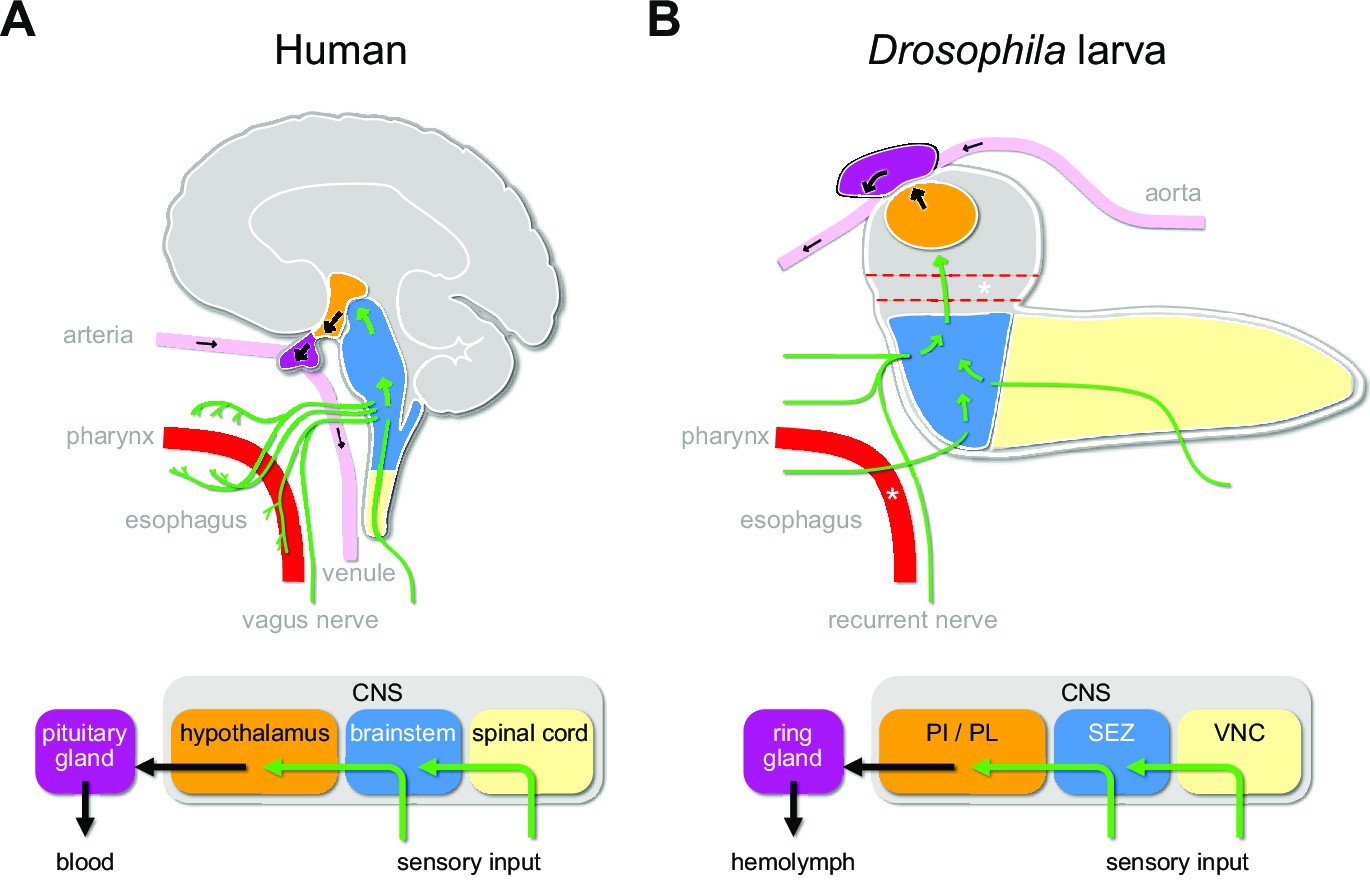
Sensory to endocrine pathways.
(A) Schematic showing information flow from sensory input (green) to the endocrine system in the human brain compared to the Drosophila larval brain. (B) Asterisks denote the foramen (dotted red tube), where the esophagus (solid red tube) would pass through the CNS. Green arrows denote flow of sensory information; black arrows denote release of hormones into the circulatory system. CNS: central nervous system; PI: pars intercerebralis; PL: pars lateralis; SEZ: subesophageal zone; VNC: ventral nerve cord.
Leveraging a synaptic resolution serial section transmission microscopy (ssTEM) volume of a whole first instar larval CNS (Eschbach and Zlatic, 2020; Miroschnikow et al., 2020; Ohyama et al., 2015; Schlegel et al., 2017; Thum and Gerber, 2019; Vogt, 2020), together with functional analysis of the hugin neuropeptide circuit, we have been characterizing the neuronal circuits that control specific aspects of feeding behavior and the sensorimotor pathways of the pharyngeal nerves that drive food intake (Hückesfeld et al., 2016; Miroschnikow et al., 2018; Schlegel et al., 2016; Schoofs et al., 2014a). We now provide a comprehensive analysis of all neurosecretory cells that target the ring gland and the sensory neurons that form synaptic contacts with these cells, either directly or through interneurons. The neuronal network is organized in parallel interneuronal pathways that converge onto distinct combinations of neurosecretory cells based on different sensory inputs. The circuit architecture allows variable and flexible action to maintain homeostasis and growth in response to broad multi-sensory and diverse metabolic signals. Using network modeling, we also identify novel carbon dioxide (CO2)-responsive sensory pathways onto a specific set of neuroendocrine outputs.
Results
EM reconstruction of the neuroendocrine system
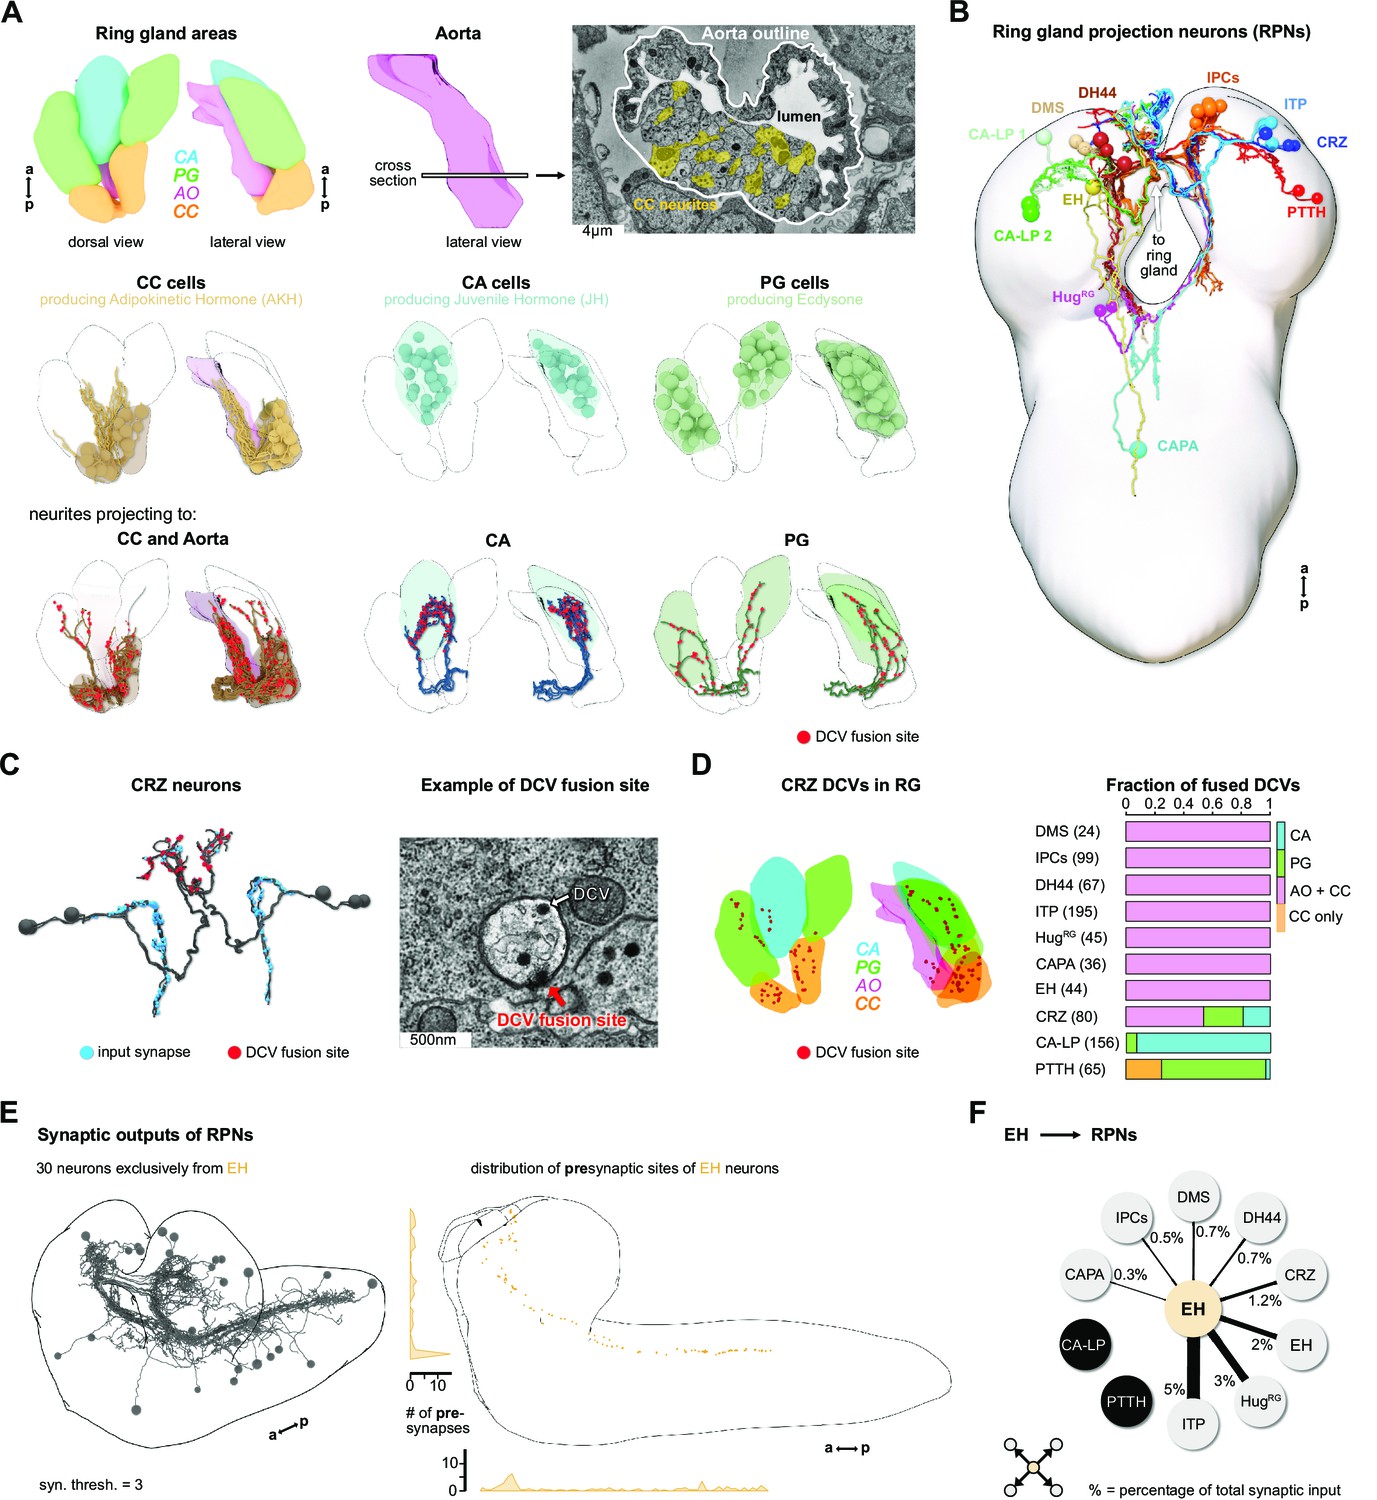
To elucidate the sensory inputs onto the neuroendocrine cells, we first reconstructed the ring gland and the interconnected portion of the aorta (AO), and all neurons that project to these structures (Figure 2A). Reconstruction of a subset of the neurons in the PI was described earlier (Schlegel et al., 2016). All neurosecretory cell clusters found previously by light microscopy analysis (Siegmund and Korge, 2001) were identified and compared to expression patterns of known peptide-Gal4 driver lines. Since cell clusters that project to the ring gland (we collectively refer to them as ring gland projection neurons [RPNs]) have varying names, we use here the peptide names that these neurons are mainly known for (Figure 2B, Figure 2—figure supplement 1). CA-LP1 and CA-LP2 neurons were the only ones for which we could not unambiguously identify the neuropeptide identity, but found their expression in two independent Burs-Gal4 lines; also FMRFamide-positive projections were found in the CA, which likely are derived from the CA-LP1 or CA-LP2 neurons (de Velasco et al., 2007). To analyze ion transport peptide (ITP) neurons (de Haro et al., 2010; Herrero et al., 2007; Kahsai et al., 2010), we generated LexA-knock-in lines (Figure 2—figure supplement 2). A comprehensive overview for all RPN clusters analyzed in this study is provided in Figure 2—source data 1.
Figure 2 with 5 supplements see all
Reconstruction of the Drosophila larval ring gland and RPNs.
(A) Upper panel: 3D reconstructed RG areas in dorsal and lateral view (CC = orange, PG = green, CA = blue, AO = pink). Cross section of the AO: colored areas represent single neurites of different CC cells. Middle panel: dorsal and lateral view of the RG showing the different cells in the distinct RG areas (CC, CA, and PG). Lower panel: neurites innervating the RG areas were separated based on innervation of the CC and aorta, only CA or only PG. Fused DCVs are marked as red dots. (B) Schematic of all 56 neurons innervating the RG named by the main neuropeptide produced. Total number of neurons per RPN cluster: DMS = 4, IPCs = 14, DH44 = 6, CRZ = 6, ITP = 8, CA-LP = 6, PTTH = 4, HugRG = 4, CAPA = 2, EH = 2. For clarity, only one side is shown for each neuronal cluster. (C) Left: reconstructed CRZ. Fused DCVs were marked as non-polar output synapses at distal neurites in RG tissues (red dots). Blue dots represent chemical synaptic input sites. Right: example picture of a DCV fusion site in the EM volume (DCV has to be fused to the membrane). (D) Left: magnification of the reconstructed RG with spatial distribution of CRZ DCV fusion sites (red dots).Right: quantification of all DCV fusion sites found in the RG areas for each RPN group. Numbers in brackets are total numbers of marked DCVs. The X-axis represents a fraction of fused DCVs. (E) Left: synaptic outputs of all RPNs (threshold = 3 synapses) constitute in total 30 neurons, which are exclusively downstream of EH RPNs. Right: spatial distribution of presynaptic sites of EH. EH neurons are the only RPNs having presynaptic sites located along abdominal, thoracic segments, and SEZ and protocerebrum. (F) EH neurons synaptically target other RPNs. Percentage represents the fraction of input of distinct RPNs from EH neurons, for example, ITP neurons receive 5% of its inputs from EH. a: anterior; AO: aorta; CA: corpus allatum; CA-LP: corpus allatum innervating neurosecretory neurons of the lateral protocerebrum; CAPA: capability neurons; CC: corpora cardiaca; CRZ: corazonin neurons; DCVs: dense core vesicles; DH44: diuretic hormone 44 neurons; DMS: Drosophila myosuppressin neurons; EH: eclosion hormone neurons; HugRG: Hugin neurons innervating ring gland; IPCs: insulin-producing cells; ITP: ion transport peptide neurons; p: posterior; PG: prothoracic gland; PTTH: prothoracicotropic hormone neurons; RG: ring gland; RPN: ring gland projection neurons; SEZ: subesophageal zone; ssTEM: serial section transmission electron microscope.
-
Figure 2—source data 1
Comprehensive overview of all Drosophila RPN clusters.
- https://cdn.elifesciences.org/articles/65745/elife-65745-fig2-data1-v1.docx
Peptidergic and synaptic outputs
Peptidergic signaling is accomplished through release from dense core vesicles (DCVs). The specific peptidergic output region of all cells was identified by contacts of DCVs with the membrane with the apparent liberation of small dense particles, as exemplified for the corazonin neurons (CRZ) (Figure 2C). The outputs of all 10 peptidergic RPN groups are restricted mainly to the CC and AO. PTTH and CA-LP project almost exclusively to the PG and CA, respectively (Figure 2D). Neurons producing the stress-related peptide Crz (Kubrak et al., 2016) showed the broadest output pattern, targeting all tissues (Figure 2C and D). We also analyzed the reliability of determining the output release site by quantifying DCV fusions sites. Using Crz and corazonin receptor (CrzR)-expressing cells as an example, we could confirm by trans-Tango system (Inagaki et al., 2012) that the CC cells are the main target of CRZ (Figure 2—figure supplement 3). Thus, DCVs found in the PG or CA might mean that other RPNs, like PTTH and CA-LP, express the CrzR (for PTTH shown in Imura et al., 2020). These data further lend support that DCV fusion sites represent a reliable measure for targets of RPNs. The anatomical data on peptidergic outputs were combined with existing single-cell transcriptomic data on the larval brain (Brunet Avalos et al., 2019). Focusing on the expression of neuropeptides and their cognate receptors within the ring gland system, we confirmed, for example, that CRZ are targeting all other RPNs by releasing Crz as well as short neuropeptide F and proctolin (Figure 2—figure supplement 4). At the same time, the Crz receptor is expressed in the CC and to a lesser extent in the PG and CA, as well as in other RPNs. Based on the peptides and receptors expressed by the distinct RPN groups, the analysis uncovers complex interactions between neuroendocrine cells. At this point, it is unclear to what extent these peptide-receptor interactions occur between peptides released within the CNS or found in the hemolymph.
We next addressed the issue of the largely unknown synaptic connectivity of the neuroendocrine cells by reconstructing the synaptic up- and downstream partners of all RPNs (threshold of three synapses to each RPN). For information on completeness of our analysis and the criteria for choosing certain threshold values, see Figure 2—figure supplement 5. We identified 30 downstream partners that, unexpectedly, were exclusively targeted by the two eclosion hormone neurons (EH), one on each side of the ventromedial protocerebrum (Figure 2E). The functional significance of the EH synaptic outputs is as yet unknown. However, it has been shown that the neurohemal release sites could be removed and the axon stumps electrically stimulated; this evoked an ecdysis motor program through interaction of the EH with response circuitry in the ventral nerve cord (VNC) (Hewes and Truman, 1991). Notably, these include all the other RPNs with the exception of CA-LP and PTTH, which regulate the activity of two major growth/maturation hormones, namely juvenile hormone and ecdysone (Figure 2F).
Synaptic inputs onto the neuroendocrine system
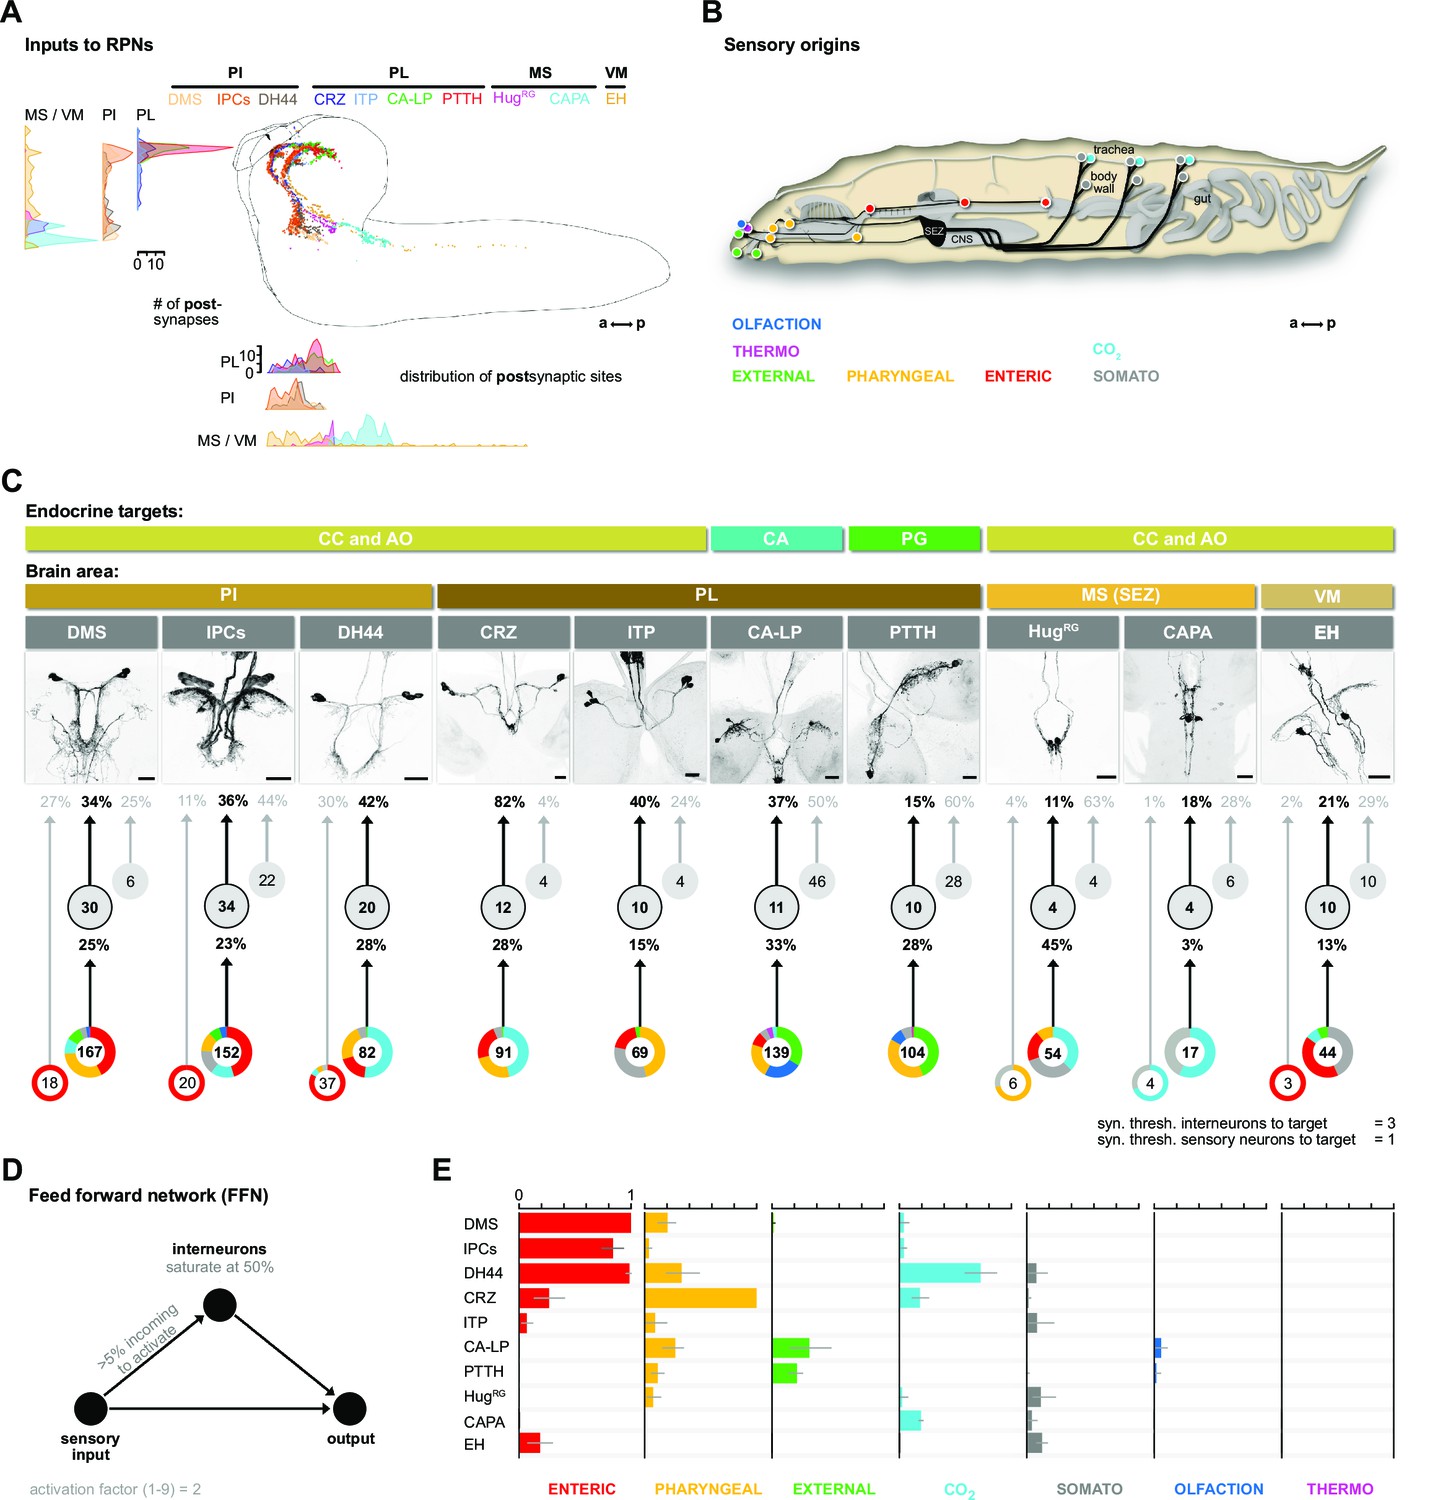
We identified 209 upstream partners of the RPNs, whose synaptic sites are distributed in the anterior thoracic and SEZ region and up along the protocerebrum in a sprinkler-like fashion (Figure 3A). Unlike the RPNs in the PI (IPCs, DMS, DH44), which have significant amounts of monosynaptic connections with sensory neurons (Miroschnikow et al., 2018; Schlegel et al., 2016), the RPNs of the PL (CRZ, PTTH, CA-LP, and ITP) have no direct sensory input. Similarly, EH, CAPA, and HugRG (hugin neurons innervating ring gland) RPNs have only small amounts of direct sensory contacts (Figure 3—figure supplement 1). We therefore focused on the interneurons and their connection with the sensory system.
Figure 3 with 6 supplements see all
Inputs of RPNs and sensory origins.
(A) Spatial distribution of postsynaptic sites of all RPNs (color coded). RPN postsynaptic sites are located along upper SEZ and in the protocerebrum in a sprinkler-like fashion. (B) Schematic side view of a Drosophila larva. Colored dots represent the location of sensory organs, based on their sensory origin. (C) Synaptic connections to RPNs (grouped) from top to bottom: RPNs are grouped by their endocrine targets or their location of somata within the CNS (brain area, colored bars). RPNs (displayed by expression pattern of the respective Gal4 or LexA lines) receive synaptic inputs (fraction of total synaptic inputs as percentage) from distinct sets of interneurons (numbers in circles represent the number of interneurons connected to RPNs), which in turn receive information from sensory neurons (fraction of total synaptic input as percentage). Colored pie charts represent the sensory profile through which interneurons (grouped) of each RPN group integrate sensory inputs (numbers in white circles). Colors of pie charts correspond to the respective sensory origins shown in (B). Note that the monosynaptic sensory neurons are also involved in polysynaptic pathways to the RPNs. (D) Scheme of the FFN. Sensory neurons are activated with an activation factor of 2 in the FFN. When more than 5% of presynaptic neurons are active, interneurons become activated up to an activity of 50%. (E) Summary of sensory-driven modulation of RPN output groups by FFN. The X-axis for each panel shows the mean activity of RPNs listed on the Y-axis. Colors represent the different sensory origins used to activate the network through 1- and 2-hop synaptic connections. a: anterior; AO: aorta; CA: corpus allatum; CA-LP: corpus allatum innervating neurosecretory neurons of the lateral protocerebrum; CAPA: capability neurons; CC: corpora cardiaca; CNS: central nervous system; CO2: carbon dioxide; CRZ: corazonin neurons; DCVs: dense core vesicles; DH44: diuretic hormone 44 neurons; DMS: Drosophila myosuppressin neurons; EH: eclosion hormone neurons; FFN: feed forward network; HugRG: hugin neurons innervating ring gland; IPCs: insulin-producing cells; ITP: ion transport peptide neurons; MS (SEZ): medial subesophageal ganglion; p: posterior; PG: prothoracic gland; PI: pars intercerebralis; PL: pars lateralis; PTTH: prothoracicotropic hormone neurons; RPNs: ring gland projection neurons; syn. thresh.: synaptic threshold; VM: ventromedial cells.
We first divided the upstream interneurons into two groups: interneurons receiving direct sensory input and those that do not (threshold at two synapses); slightly more than half of all upstream neurons integrate sensory information, n = 110 (Figure 3—figure supplement 1). Based on previous publications, we know the peripheral origin (e.g., enteric, pharyngeal, olfactory) of most sensory neurons (Berck et al., 2016; Miroschnikow et al., 2018). Here, we additionally characterize a subset of tracheal dendritic neurons (TD neurons) (Qian et al., 2018; Schlegel et al., 2016) as being responsive to CO2 levels (Figure 3—figure supplement 2). To determine which sensory signals are integrated by RPNs via these interneurons, we grouped their sensory inputs based on their peripheral origin (Figure 3B). The resulting map provides a comprehensive overview of the sensory to endocrine pathways in the larval neuroendocrine system (Figure 3C). All of the RPNs receive input from a distinct combination of interneurons, which in turn receive input from a distinct combination of sensory neurons. In one extreme (e.g., IPCs), 152 sensory neurons from six different sensory regions (greatest from enteric) target 34 interneurons. At the other extreme (e.g., CAPA), 17 sensory neurons from two sensory regions target just four interneurons. The synaptic load of RPNs from interneurons that receive sensory inputs varies greatly. The largest is for CRZ, where 82% (fraction of input synapses) of the total input is from interneurons with direct sensory connections.
Modeling the impact of activating sensory neurons on the neuroendocrine system
To assess the potential impact of sensory inputs on the neuroendocrine system, we employed a network diffusion model based on direct monosynaptic and 2-hop polysynaptic connections using feed-forward connectivity (Figure 3D). The model is deliberately kept simple as we lack detailed knowledge on the physiology (e.g., neurotransmitter) of the neurons involved. Such networks have been recently used successfully in the mouse to model sensory impact on activity in higher brain centers of the thalamus (Shadi et al., 2020). Our model predicts the impact of specific sensory origins onto each RPN group (Figure 3E; for parameterization and connection types in the model, see Figure 3—figure supplements 3–5; adjacency matrix for all neurons used in this study in Figure 3—figure supplement 6). As a first experimental analysis based on the predictions, we chose the CO2 path because the defined sensory organ, that is, TD neurons, and distinct modality (CO2) made it more tractable.
A novel CO2-dependent trachea to endocrine pathway
The model predicts a strong impact of TD (CO2) neurons on DH44, CRZ, DMS, and CAPA RPNs (Figure 3E). To validate this, we performed imaging experiments using the ratiometric calcium integrator CaMPARI-2 to measure changes in activity of the RPNs upon CO2 exposure (Figure 4). Indeed, the in vivo experiments confirmed the predictions for DH44 and CRZ RPNs, which were strongly activated by CO2 (Figure 4). Weaker activation of DMS and IPCs was also observed, consistent with the predicted weak effects. CAPA neurons did not differ significantly from control groups but tended to show a lower activity upon CO2 stimulation. Since the network diffusion model does not take the sign of a connection into account, it is conceivable that CAPA neurons are inhibited by CO2. The analysis of connectivity based on the EM volume enabled us to identify a new circuit in which CO2 level is detected by TD neurons, integrated by a core set of four thoracic interneurons (somata located in T1–T3 segments), which in turn strongly connect to DH44 and CRZ (Figure 5A and B). Each of the thoracic interneurons have slightly different connectivity profiles in terms of their up- and downstream partners (Figure 5C). Thus, while all four are interconnected to CO2 sensory neurons and target DH44 or CRZ, the strength of the connections differs as well as their connections to other sensory neurons and RPNs. Please see Figure 5—figure supplement 1 and 2 for identity (ID number and connectivity) of all interneurons.
Figure 4
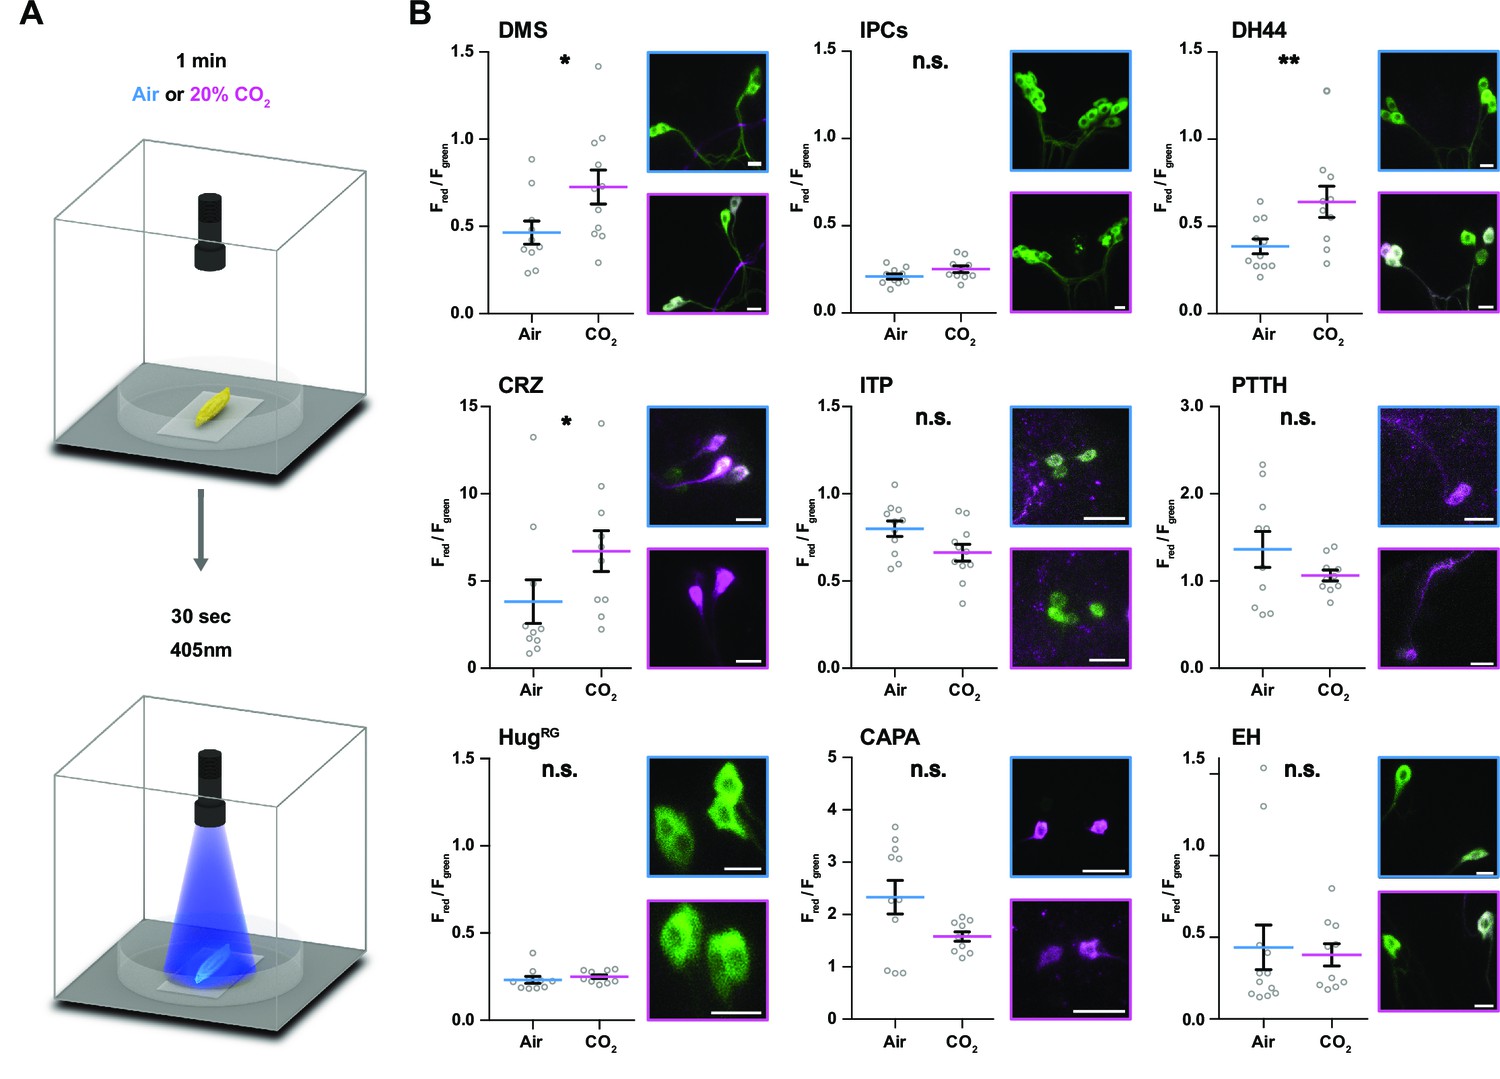
Impact of CO2 stimulation on RPNs.
(A) Setup for CO2 stimulation of intact larvae. After 1 min of CO2 exposure (0 or 20%), light of 405 nm wavelength was activated for 30 s. (B) Different peptide Gal4-lines driving expression of CaMPARI-2 in RPN clusters. Note that certain peptidergic clusters show baseline activity (CRZ, PTTH, CAPA) and therefore different scaling for the Y-axis was used, which represents the red to green fluorescence ratio. Significant activity changes could be observed for DMS, DH44, and CRZ upon CO2 stimulation (magenta bars) compared to air (blue bars). Images next to the graphs show representative maximum projections of imaged cells (blue border = air, magenta border = 20% CO2). All scale bars represent 20 µm. CaMPARI-2: calcium-modulated photoactivatable ratiometric integrator 2; CAPA: capability neurons; CO2: carbon dioxide; CRZ: corazonin neurons; DH44: diuretic hormone 44 neurons; DMS: Drosophila myosuppressin neurons; EH: eclosion hormone neurons; HugRG: hugin neurons innervating ring gland; IPCs: insulin-producing cells; ITP: ion transport peptide neurons; n.s.: not significant; PTTH: prothoracicotropic hormone neurons; RPN: ring gland projection neuron.
Figure 5 with 3 supplements see all
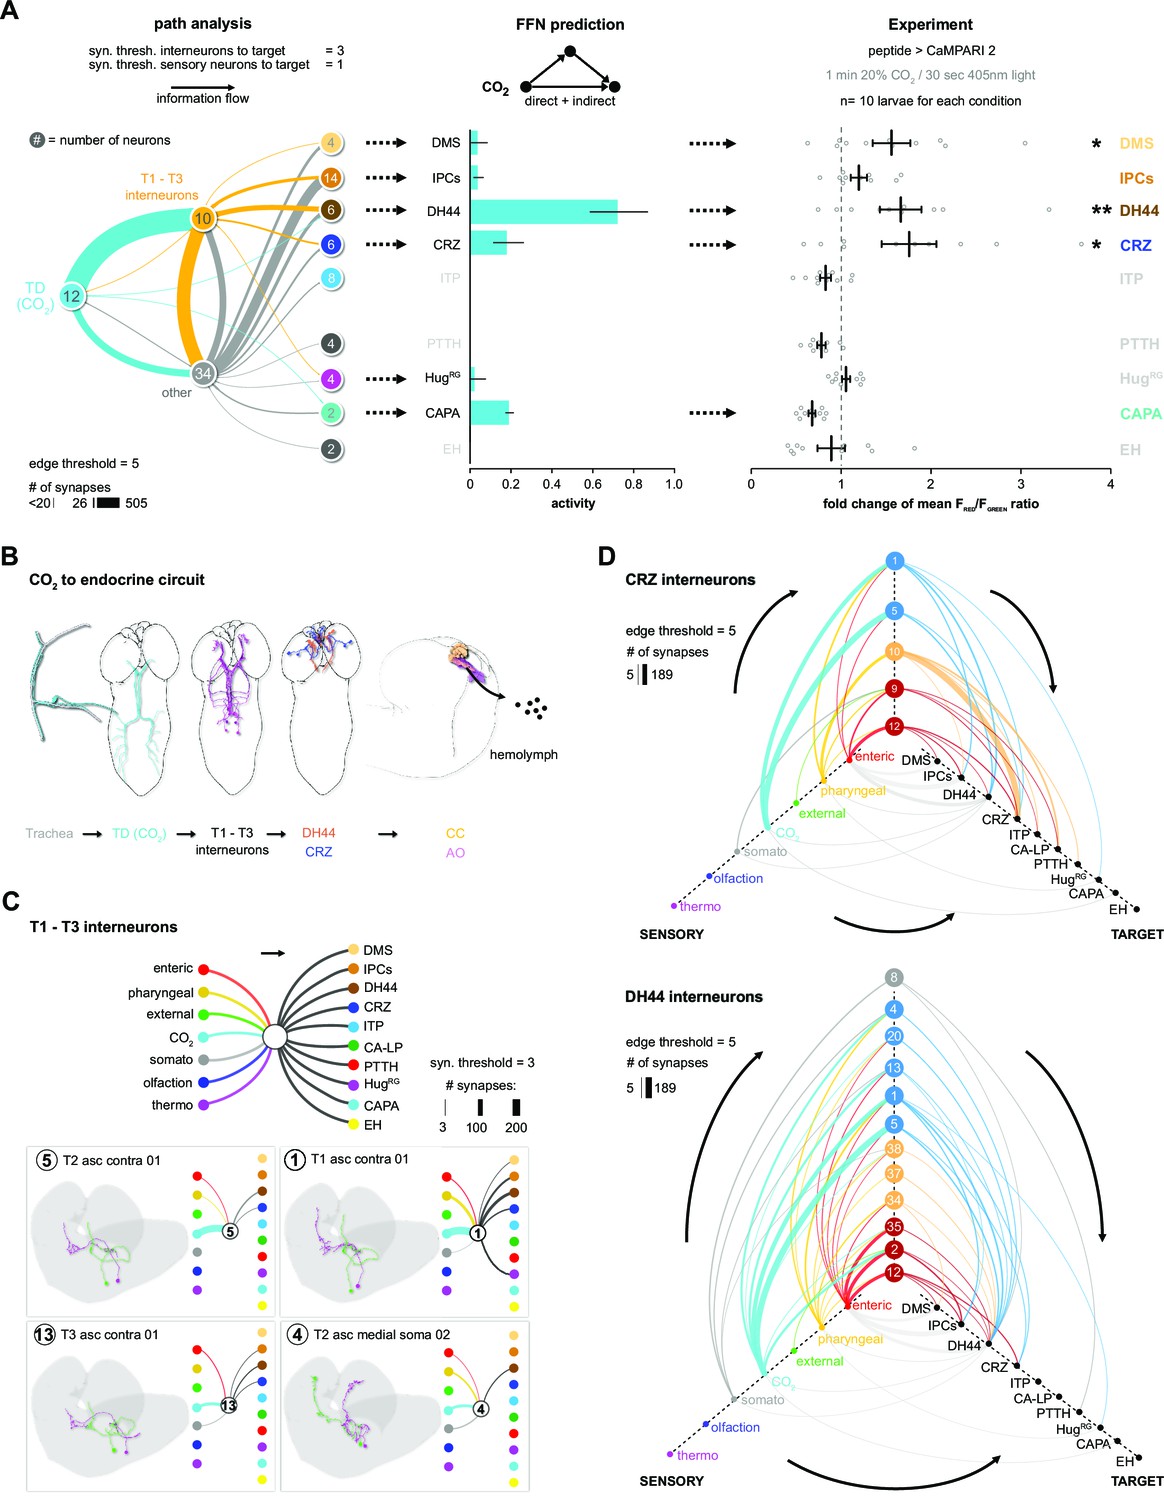
CO2-dependent pathway from TD neurons to RPNs.
(A) Comparison of underlying connectivity of TD (CO2) neurons via interneurons to the RPNs, with the predicted outcome of mean activity (with an activation factor of 2; when more than 5% of presynaptic neurons are active, interneurons become activated up to an activity of 50%) of RPNs, and the outcome of CaMPARI-2 CO2 experiments. FFN diffusion model reliably shows modulation of the RPNs. Please note that the circled numbers in the path analysis refer to the total number of neurons, not neuron identification number. (B) Using the combination of connectivity, prediction, and functional imaging experiments, a new sensory to endocrine neural circuit can be derived. TD (CO2) neurons at the trachea respond to CO2 levels and communicate predominantly via a core set of thoracic interneurons to DH44 and CRZ, which show release sites in the CC and AO. (C) Connectivity of the single thoracic interneurons (hemilateral pairs) to presynaptic sensory origins and to the distinct postsynaptic RPN groups. Thoracic interneurons receive additionally other sensory modalities apart from TD (CO2) neurons and target different combinations of RPNs. (D) CRZ interneurons: hive plot showing the polysynaptic pathways from all sensory origins to all RPN target groups using the interneurons (synaptic threshold = 3) that target CRZ. Main sensory origins are enteric, pharyngeal, and CO2. DH44 interneurons: TD (CO2) represent the most dominant polysynaptic path from sensory origins to DH44. Note that monosynaptic connections from sensory neurons to RPNs are shown in gray. AO: aorta; CA-LP: corpus allatum innervating neurosecretory neurons of the lateral protocerebrum; CaMPARI-2: calcium-modulated photoactivatable ratiometric integrator 2; CAPA: capability neurons; CC: corpora cardiaca; CO2: carbon dioxide; CRZ: corazonin neurons; DH44: diuretic hormone 44 neurons; DMS: Drosophila myosuppressin neurons; EH: eclosion hormone neurons; FFN: feed forward network; HugRG: hugin neurons innervating ring gland; IPCs: insulin-producing cells; ITP: ion transport peptide neurons; PTTH: prothoracicotropic hormone neurons; RPNs: ring gland projection neurons; ssTEM: serial section transmission electron microscope; TD: tracheal dendritic neurons.
We then took the two main output RPNs of the tracheal CO2-responsive circuit (CRZ and DH44) and asked what other interneurons were upstream of these, and to which sensory neurons these interneurons were connected (Figure 5D). For CRZ, the strongest are in fact not the thoracic interneurons from the CO2 pathway: one hemilateral pair of interneurons (#10, Munin 2) accounts for over 50% of total synaptic input to the CRZ neurons. These interneurons receive sensory information exclusively from pharyngeal sensory neurons (Figure 5D, top hive plot). There are two other strongly connected interneurons (#9, Munin 1; #12, subesophageal zone into brain neuron [SiB]), and they receive most of their inputs from the enteric region. Furthermore, all the interneurons are also part of pathways that target several RPNs. For example, interneuron #10 targets all neurons of the PL, whereas interneuron #12 targets all neurons of the PI. For DH44, the strongest upstream partners are the same thoracic interneurons that respond to CO2 (Figure 5D, bottom hive plot).
Currently, one chemosensory receptor, gustatory receptor 21a (Gr21a), has been shown to be responsive to CO2 (Faucher et al., 2006). It is expressed in the terminal organ, which is located in the anterior part of the larvae, but not in the TD neurons (Figure 3—figure supplement 2). Although we cannot determine the precise projections of the Gr21a-expressing neurons in the EM volume, a connectivity analysis of the chemosensory projections of the terminal and ventral organs (we cannot differentiate between projections originating from TO and VO in the EM volume) reveals only very weak connections to the DH44 or CRZ neurons, suggesting that CO2-responsive Gr21a terminal organ and TD neuronal pathways are largely independent (Figure 5—figure supplement 3).
In sum, this illustrates the distinct sensory-to-neuroendocrine connectivity profiles (which sensory origins onto which set of RPNs) of the different interneurons.
Interneurons that direct sensory information to distinct sets of neuroendocrine outputs
We next extended the connectivity hub analysis to the other interneurons of the neuroendocrine system (Figure 6). In the first approach, we plotted the sensory-to-interneuron-to-target paths for each RPN (Figure 6A). Shown are examples from RPNs located at different regions of the CNS, and one can see the large variation in the number and type of interneurons present that are directly connected to the sensory neurons. For instance, the IPCs receive inputs from the largest number of such interneurons, and from these, interneuron #11 (HuginPC, hugin neurons innervating protocerebrum) provides the largest input. At the other extreme, HugRG neurons receive inputs from the least number of such interneurons; however, one of these, namely #17 (Dpilp7), provides 8% of total input that the HugRG neurons receive. The analysis also illustrates the wide range of differences in synaptic strength between sensory neurons and interneurons as compared to between interneurons and target RPNs. For example, interneuron #1 has strong connections to sensory neurons but weak connections to the IPCs; by contrast, interneuron #16 has weak connections to sensory neurons but strong connections to the IPCs. A similar situation is observed between the interneurons #5 (one of the thoracic interneurons) and #10 (Munin 2) in terms of targeting CRZ.
Figure 6 with 3 supplements see all
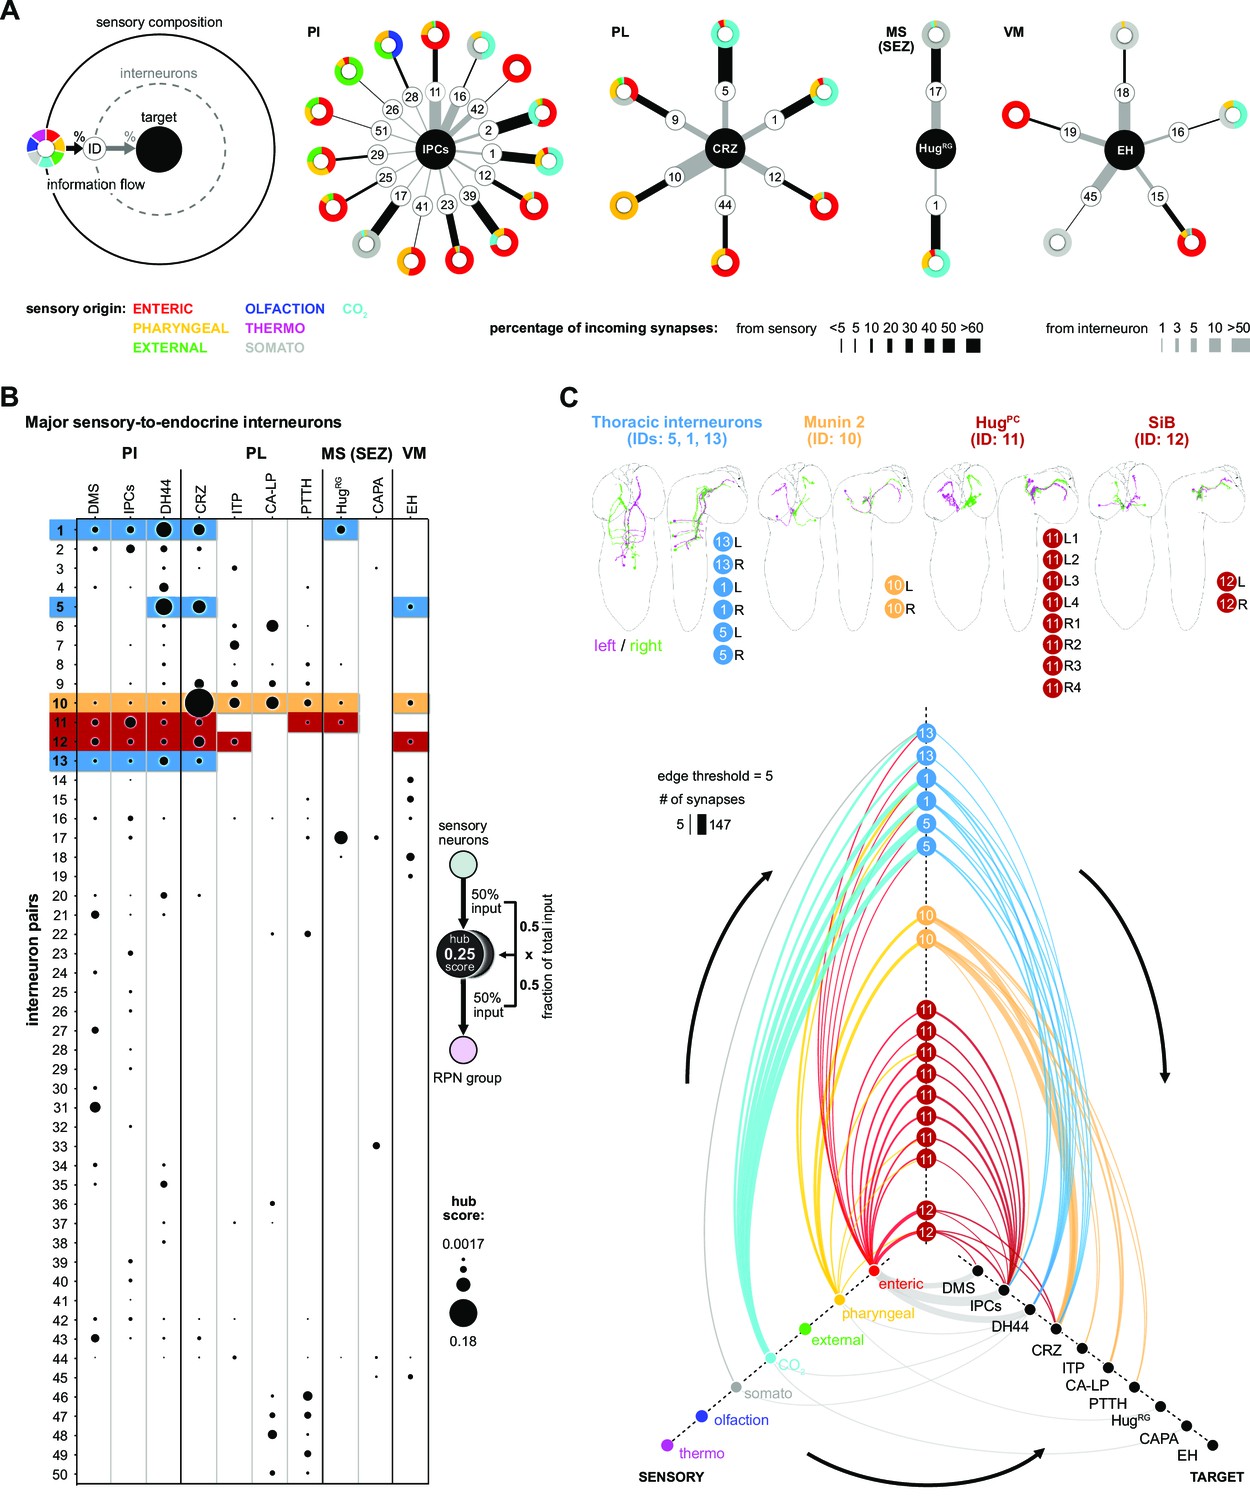
Interneurons and hub analysis of sensory to endocrine pathways.
(A) Schematic of graph representation. Outer ring represents the sensory composition of neurons targeting upstream neurons of RPNs. Synaptic threshold for upstream neurons of RPNs = 3. Line thickness to interneurons and targets represents the percentage of synaptic input. Striped ring represents the interneuron layer (black lined white circle). Inner ring represents target neurons (RPN peptide clusters). Sensory-interneuron circuits of neurons within the PI region. IPCs integrate mainly information from enteric sensory areas. Sensory-interneuron circuits within the PL region. CRZ integrates mainly CO2 and pharyngeal sensory information. Peptides of the MS (SEZ) or VM cluster show least number of sensory-interneuron input. HugRG neurons receive sensory information from two interneuron pairs integrating mainly somatosensory and CO2 sensory information. Please note different scaling for strength of connections between sensory origin to interneurons (black lines) and interneurons to target peptide groups (gray lines). (B) Dot plot showing the importance of interneurons acting as sensory to endocrine hub. Dot size was calculated using the fraction of total input an interneuron receives from sensory neurons multiplied by the fraction of total input this interneuron gives to an RPN output group. Colored backgrounds of dots are highlighted for (C). (C) Selected interneurons (highlighted in B) connecting the sensory system with RPNs. Thoracic interneurons receive sensory information from TD (CO2) neurons and target IPCs, DH44 and CRZ (hive plot, strongest connection = 147 synapses). Munin 2 interneurons connect CRZ, ITP, PTTH, and CA-LP RPNs with pharyngeal sensory neurons. HugPC connect the IPCs with enteric sensory neurons. SiB neurons also receive information from enteric origins but target DMS, IPCs, and CRZ. Edge threshold for hive plot = 5 synapses. CA-LP: corpus allatum innervating neurosecretory neurons of the lateral protocerebrum; CAPA: capability neurons; CO2: carbon dioxide; CRZ: corazonin neurons; DH44: diuretic hormone 44 neurons; DMS: Drosophila myosuppressin neurons; EH: eclosion hormone neurons; HugPC: hugin neurons innervating protocerebrum; HugRG: hugin neurons innervating ring gland; IPCs: insulin-producing cells; ITP: ion transport peptide neurons; MS (SEZ): medial subesophageal ganglion; PI: pars intercerebralis; PL: pars lateralis; PTTH: prothoracicotropic hormone neurons; RPNs: ring gland projection neurons; SiB: subesophageal zone into brain neurons; VM: ventromedial.
In the second approach, we calculated the fraction of sensory inputs to given interneurons and multiplied it with the fraction of inputs of the RPN (Figure 6B). This analysis revealed interneurons that play a major role in the sensory pathways to the neuroendocrine system. Selected notable interneurons are illustrated in Figure 6C. For example, both #11 (HugPC) and #12 (SiB) interneurons have their strongest inputs from the enteric sensory neurons; however, whereas HugPC interneurons strongly target just the IPCs (edge threshold of minimum five synapses), SiB interneurons target DMS, IPCs, and CRZ (Figure 6C).
There are also intriguing unique groups, for example, the interneurons (#s 46–50), which are highly specialized for CA-LP and PTTH (Figure 6B, Figure 6—figure supplement 2); these receive strong sensory inputs from the olfactory system (for a comprehensive connectivity map, see Figure 6—figure supplement 3). In adult Drosophila, it was shown that the release of juvenile hormone from the CA potentiates sensitivity of a pheromone sensing olfactory receptor OR47b (Lin et al., 2016) to maximize courtship success of male flies. In larvae, we found several previously appetitive and aversive assigned olfactory receptor neurons (Kreher et al., 2008) being connected via multiglomerular projection neurons to the CA-LP and PTTH neurons. This might be relevant for larvae where ecdysone or juvenile hormone would be secreted in response to olfactory cues, although the function of such a pathway is not known. We also reveal parallel paths from sensory to the mushroom body and lateral horn, through additional layers of interneurons (which include mushroom body output neurons), and onto the CA-LP and PTTH neuroendocrine targets (Figure 6—figure supplement 3).
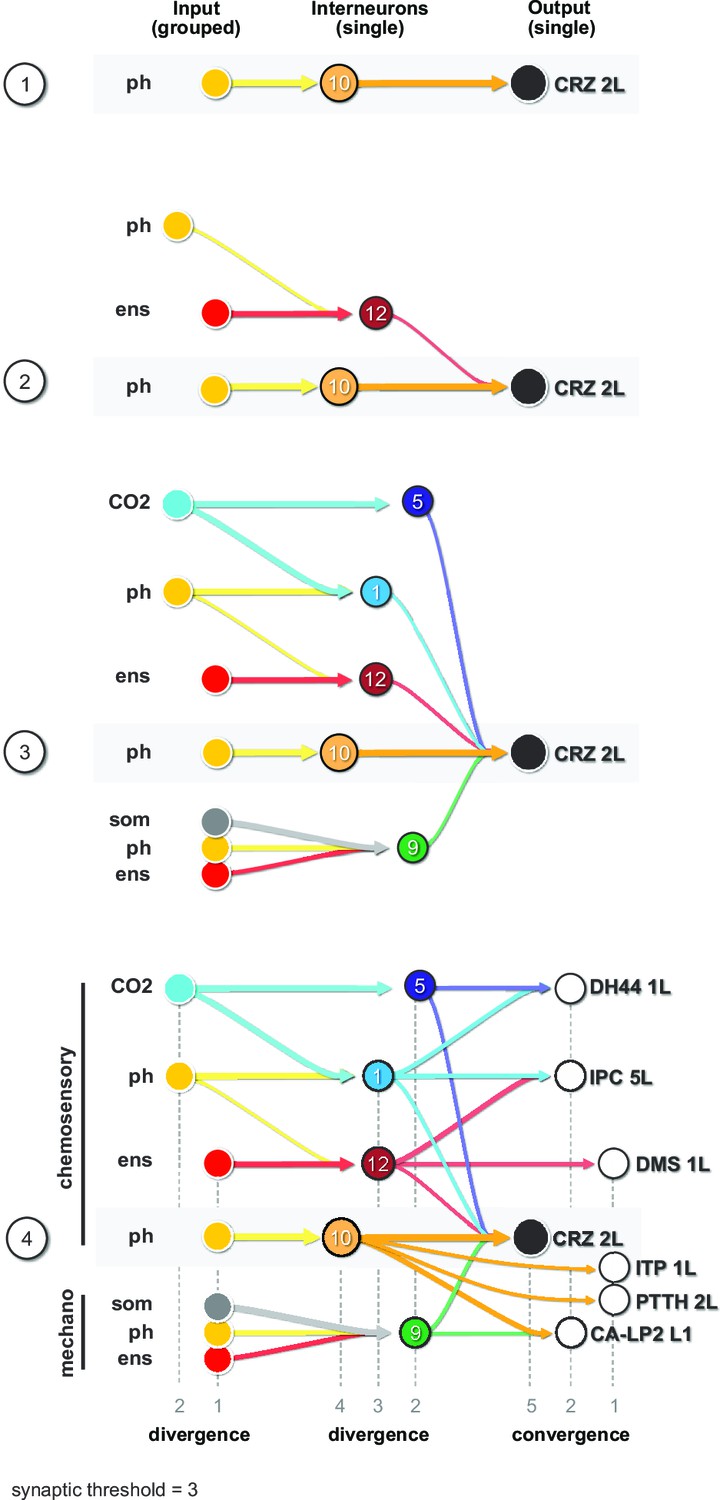
Finally, we illustrate the key features of the neuronal circuit architecture that underlie the neuroendocrine system, which can be constructed using CRZ as an exemplary RPN (single output cell) (Figure 7). We start with the strongest connection from interneuron Munin 2 (#10), which receives input from a group of pharyngeal sensory neurons (Figure 7, panel 1). A second interneuron SiB (#12) receives input from a group of enteric sensory neurons (Figure 7, panel 2); this interneuron also receives inputs from a different class of pharyngeal sensory neurons. More interneurons are added to build a series of parallel paths (diverging sensory signals) that all converge on a common RPN (Figure 7, panel 3). These interneurons concurrently target different RPNs (Figure 7, panel 4; see also figure legend for details). At this point, then, a set of distinct RPNs becomes inexorably linked as the interneurons that converge onto the single CRZ neuron are also monosynaptically connected to other RPNs. Thus, the parallel paths that converge on a single RPN (e.g., CRZ) additionally target multiple RPNs, thereby forming a set of linked outputs. For single-cell networks of all RPNs, see Figure 7—figure supplement 1.
Figure 7 with 1 supplement see all
Diverging sensory and interneuronal paths converge onto a linked set of output neurons.
Circuit architecture common for all RPNs (CRZ single-cell example). 1: the strongest polysynaptic path based on hub analysis from pharyngeal sensory origin to CRZ output neuron via interneuron 10. 2: second interneuron (12) integrating enteric information and different pharyngeal information, converging onto CRZ output neuron. 3: all interneurons of one CRZ output neuron integrating multiple sensory origins and converging onto one single output. 4: concept of divergence and convergence in the neuroendocrine connectome. Sensory neurons diverge/converge onto distinct sets of interneurons. Interneurons diverge in varying synaptic strength onto distinct sets of linked RPN output neurons. Numbers at bottom show degree of convergence and divergence (e.g., interneuron 10 diverges to CRZ, ITP, PTTH, and CA-LP; all interneurons converge to CRZ; synaptic threshold = 3 for all connections). CA-LP: corpus allatum innervating neurosecretory neurons of the lateral protocerebrum; CO2: carbon dioxide; CRZ: corazonin neurons; DH44: diuretic hormone 44 neurons; DMS: Drosophila myosuppressin neurons; ens: enteric nervous system; IPCs: insulin-producing cells; ITP: ion transport peptide neurons; ph: pharynx; PTTH: prothoracicotropic hormone neurons; som: somatic; RPNs: ring gland projection neurons.
Discussion
The neuroendocrine connectome of Drosophila larvae
Organisms differ in their adaptive capacity to deal with external and internal changes, but the essential goal remains the same: ensuring homeostasis in a changing environment. Evolution of neuroendocrine systems led to the separation of sensory systems, neuroendocrine cells, and specialized glands (Hartenstein, 2006). We show in this paper how the central neuroendocrine system is synaptically organized. A general feature of the ring gland projection neurons (RPNs) is the absence of synaptic outputs within the CNS. The exception are the EH-producing neurons, which have synaptic outputs in the protocerebrum, SEZ, and VNC. This unique feature of EH neurons might be due to their function in coordinating movements during larval cuticle shedding (Baker et al., 1999; Krüger et al., 2015). Another feature is that the RPNs of the PL are connected with the sensory organs exclusively via polysynaptic paths, which is in contrast to the numerous monosynaptic connections found for RPNs of the PI (Miroschnikow et al., 2018; Schlegel et al., 2016). It is also noteworthy that peptides known for their roles in metabolic and stress regulation in general receive large amounts of their inputs from interneurons with direct contacts to the sensory system, that is, these paths are short, with only a single hop between the interneurons and sensory neurons. This might be due to the need for rapid action compared to those (e.g., PTTH and CA-LP neurons) involved in gradual, long-term and irreversible events such as larval growth and maturation.
Novel CO2-responsive sensory to endocrine pathways: from connectomic-based modeling to in vivo testing
Numerous previously unknown synaptic pathways from the sensory organs to the RPNs were revealed from our connectomic analysis, including a new set of sensory neurons, namely the TD (CO2) neurons that respond to CO2 levels. This might be due to the stress associated with high levels of CO2, which is observed in humans as well (Permentier et al., 2017). These sensory neurons target, via thoracic interneurons, RPNs that express two peptides known to play a dominant role in metabolic stress regulation in Drosophila: Dh44 and Crz (Cannell et al., 2016; Dus et al., 2015; Kubrak et al., 2016). From a neuronal network perspective, it was possible to predict this modulation with a feed forward network (FFN). Both peptide groups display homology to mammalian neuroendocrine axes known to regulate stress (HPA axis) and reproductive behavior (HPG axis). Dh44 is a homolog of vertebrate CRH, which is released in the hypothalamus in response to external and internal stressors like hypoxia or hypoglycemia (Flanagan et al., 2003). A role for Dh44 in glucose and amino acid sensing has been reported (Dus et al., 2015; Yang et al., 2018), but its role in CO2-dependent response was not previously known. CO2 activation of Crz, a homolog to GnRH, adds to the repertoire of stress sensors ascribed to these neurons that include their roles in glucose and fructose sensing (Dus et al., 2015; Kubrak et al., 2016; Miyamoto and Amrein, 2014; Oh et al., 2019; Veenstra, 2009). Interestingly, this sensory pathway, which originates in the trachea, appears to be largely distinct from the CO2 sensing pathway that originates in the terminal organ (Faucher et al., 2006). The physiological and behavioral consequences of CO2-dependent response in the trachea, for example, whether it is appetitive or aversive, remain to be investigated. The connectome analysis further indicates that CRZ and DH44 neurons have the strongest synaptic connections with the sensory system (i.e., greatest number of paths that are connected monosynaptically or via single interneurons), suggesting a critical role of these neurosecretory cells in rapid sensory integration.
Combinatorial parallel pathways enable variability and flexibility in the central neuroendocrine system
Sensory pathways are often studied based on a single type of sensory organ or modality, in most cases for technical reasons. In a natural environment, it is unlikely that an animal will encounter a situation where it needs to react to only a single sensory input and secrete a single type of hormone. For the fly larvae, two broad types of actions have to be taken into account: immediate action to an acute stress (e.g., due to toxic smoke, predator wasp, or starvation), and a slower action that enables tissue and organismal growth (e.g., accumulation of biosynthetic resources for cell growth and progression onto the next moulting or puparium stage). Even an acute response takes place within the existing physiological state of the organism. For the endocrine organs, this requires the secretion of different combinations, and most likely different concentrations, of hormones and neuropeptides into the circulation or target tissues.
At the core of the neuroendocrine network is a parallel set of interneurons that target distinct combinations of neuroendocrine outputs (e.g., the RPNs, each expressing certain neuropeptides). Each of the interneurons in turn receive sensory inputs from distinct sets of sensory neurons (e.g., CO2 sensitive in trachea or different type and modality within the pharyngeal region). This can be also seen in the pathways from olfactory sensory neurons to CA-LP and PTTH endocrine targets. Multiglomerular projection neurons integrate olfactory as well as gustatory information, and as one proceeds deeper into the neuronal circuitry, interneurons that have originally been classified as interneurons without sensory input can be connected by additional hops to sensory neurons (such as through mushroom body and lateral horn in the protocerebrum). These then converge together with the multiglomerular projection neurons onto the common set of interneurons that target the CA-LP and PTTH output neurons. The different converging paths can be seen to represent distinct types of sensory information, including a stored form from the mushroom body (Eichler et al., 2017; Eschbach and Zlatic, 2020; Miroschnikow et al., 2020), where a positive or negative valence has been attached to an existing sensory cue. Additionally, there are a significant number of synaptic connections among the interneurons. Such architecture would enable variability and flexibility in the combination and concentrations of neuropeptides that become released in response to the flood of multisensory inputs that act on all parts of the neuroendocrine network. Subsequently cross-regulatory interactions at the receptor level would then determine the final neuropeptide/hormone composition that is released within the CNS or into the circulation. Our work provides a neuronal architectural blueprint of how this is constructed at the synaptic level for the neuroendocrine system in the brain and may also be of general relevance in understanding other complex neuroendocrine systems.
As a concluding remark, the neuroendocrine connectome of the Drosophila larva presented here (i.e., the ‘ring gland connectome’) represents the first complete synaptic map of sensory to endocrine pathways in a neuroendocrine system of this complexity and adds another level of insight on the known humoral functions of the released neuropeptides and hormones. Together with the large amount of knowledge on the function of neurosecretory cells targeting the CC, CA, PG, and AO over the past years (Nässel and Zandawala, 2020), the current analysis increases our understanding of how the neuroendocrine system receives information about external and internal sensory cues. A future challenge in this context is the identification of specific sensory neurons of different origin and modality to define the valence of sensory integration, and the function of the interneurons that enable different pathways to the endocrine organs.
Materials and methods
Flies
All larvae used for experiments and stainings were 96 ± 4 hr (after egg laying) of age and were grown on standard cornmeal medium under a 12 hr light/dark cycle if not otherwise stated. The following driver and effector lines were used (also see Table 1 for genotypes of experimental flies):
Ilp2-Gal4 (IPC neurons, BL#37516), Ms-Gal4 (DMS neurons, Park et al., 2008), Dh44-Gal4 (DH44 neurons, BL#51987), Crz-Gal4 (CRZ neurons, BL#51977), CrzR-Gal4T11A (Sha et al., 2014), Ptth-Gal4 (PTTH neurons, McBrayer et al., 2007), Burs-Gal4 (BL#51980), Burs-Gal4 (BL#40972, this line shows expression in CA-LP neurons of the PL, data not shown), Eh-Gal4 (EH neurons, BL#6301), 17B03-Gal4 (HugRG neurons, Jenett et al., 2012), 714-Gal4 (CAPA neurons, Gohl et al., 2011), ITP-T2A:Gal4 (ITP neurons, used in CaMPARI experiments, unspecific expression in CNS glia observed BL#84702), ITP-T2A:LexA (ITP neurons, for generation see below, used in stainings – clean expression of ITP in the CNS), 260-Gal4 (TD CO2 neurons, BL#62743), Gr21a-Gal4 (BL#23890, BL#24147), Gr21a-GFP (BL#52619), UAS-mRFP (BL#27398), UAS-CaMPARI-1 (BL#58761), UAS-CaMPARI-2 (BL#78316), UAS-GFP (BL#32184), trans-Tango (BL#77124), and lexAop2-myrGFP (BL#32209).
Table 1
Genotypes of experimental flies.
| Figure | Genotypes | Chr. |
|---|---|---|
| Figure 3C (antibody staining, from left to right) | w; P{UAS-mCD8.mRFP.LG}18a; P{Ms-GAL4.P} | X; 2; 3 |
| w; P{Ilp2-GAL4.R}2/ P{UAS-mCD8.mRFP.LG}18a | X; 2 | |
| w; P{UAS-mCD8.mRFP.LG}18a; P{Dh44-GAL4.TH}2 M | X; 2; 3 | |
| w; P{UAS-mCD8.mRFP.LG}18a; P{Crz-GAL4.391}4 M | X; 2; 3 | |
| w; TI{2A-lexA::QF}ITP2A-lexA.no1; P{13XLexAop2-IVS-myr::GFP}attP2 | X; 2; 3 | |
| w; P{Burs-GAL4.TH}4 M/ P{UAS-mCD8.mRFP.LG}18a | X; 2 | |
| w; P{UAS-mCD8.mRFP.LG}18a; P{Ptth-GAL4.M}45, P{Ptth-GAL4.M}117b | X; 2; 3 | |
| w; P{UAS-mCD8.mRFP.LG}18a; P{GMR17B03-GAL4}attP2 | X; 2; 3 | |
| w; PBac{IT.GAL4}CG79970714-G4/ P{UAS-mCD8.mRFP.LG}18a | X; 2 | |
| w; P{GAL4-Eh.2.4}C21P/ {UAS-mCD8.mRFP.LG}18a | X; 2 | |
| Figure 4B (CaMPARI analysis, from top left to bottom right) | w; P{Ms-GAL4.P}/ PBac{UAS-CaMPARI2}VK00005 | X; 3 |
| w; P{Ilp2-GAL4.R}2; PBac{UAS-CaMPARI2}VK00005 | X; 2; 3 | |
| w; P{Dh44-GAL4.TH}2 M/ PBac{UAS-CaMPARI2}VK00005 | X; 3 | |
| w; P{Crz-GAL4.391}4 M/ PBac{UAS-CaMPARI2}VK00005 | X; 3 | |
| w; TI{2A-GAL4}ITP2A-D.GAL4; PBac{UAS-CaMPARI2}VK00005 | X; 2; 3 | |
| w; P{Ptth-GAL4.M}45, P{Ptth-GAL4.M}117b/ PBac{UAS-CaMPARI2}VK00005 | X; 3 | |
| w; P{GMR17B03-GAL4}attP2/ PBac{UAS-CaMPARI2}VK00005 | X; 3 | |
| w; PBac{IT.GAL4}CG79970714-G4; PBac{UAS-CaMPARI2}VK00005 | X; 2; 3 | |
| w; P{GAL4-Eh.2.4}C21P; PBac{UAS-CaMPARI2}VK00005 | X; 2; 3 | |
| Figure 2—figure supplement 1B,C | Same genotypes as in Figure 3C | |
| Figure 2—figure supplement 2B | w; TI{2A-lexA::QF}ITP2A-lexA.no1; P{13XLexAop2-IVS-myr::GFP}attP2 | X; 2; 3 |
| Figure 2—figure supplement 3B | w; P{UAS-mCD8.mRFP.LG}18a; P{Crz-GAL4.391}4 M | X; 2; 3 |
| Figure 2—figure supplement 3C | w; P{CrzR-GAL4.3.5.S}T11A/ P{UAS-mCD8.mRFP.LG}18a | X; 2 |
| Figure 2—figure supplement 3D | y, w, P{UAS-myrGFP.QUAS-mtdTomato-3xHA}su(Hw)attP8; P{trans-Tango}attP40; P{Crz-GAL4.391}4 M | X; 2; 3 |
| Figure 3—figure supplement 2A | w; P{UAS-mCD8.mRFP.LG}18a; PBac{IT.GAL4}lqfR0260-G4 | X; 2; 3 |
| Figure 3—figure supplement 2B,C | w; P{UAS-CaMPARI}attP40; PBac{IT.GAL4}lqfR0260-G4 | X; 2; 3 |
| Figure 3—figure supplement 2D (antibody staining, from left to right) | w; P{Gr21a-Mmus\Cd8a.GFP}2 | X; 2 |
| w; P{Gr21a-GAL4.C}133t52.1/ P{10XUAS-mCD8::GFP}attP2 | X; 3 | |
| w; P{Gr21a-GAL4.C}133t1.2/ P{10XUAS-mCD8::GFP}attP2 | X; 3 |
Generation of ITP-T2A-LexA transgenic fly lines
Request a detailed protocolFirst, we generated T2A-LexA:QF knock-in constructs that can be targeted to genomic loci by homology-directed repair using the CRISPR/Cas system. Therefore, splice acceptor-T2A-LexA:QF fragments for all three intron phases were amplified by PCR (Q5 polymerase, New England Biolabs) from pBS-KS-attB2-SA(0/1/2)-T2A-LexA::QFAD-Hsp70 plasmids (Addgene #62947, #62,948, and #62949) (Diao et al., 2015) with primers CGTACTCCACCTCACCCATC and ctcgagAAGCTTCTGAATAAGCCCTCGT. PCR products were sub-cloned into pCRII-TOPO vector (Invitrogen) to create plasmids TOPO-T2A-LexA:QF(0), TOPO-T2A-LexA:QF(1), and TOPO-T2A-LexA:QF(2). Next splice acceptor-T2A-Gal4 cassette from pT GEM(0) (Addgene #62891) (Diao et al., 2015) was removed by XbaI/SalI digest and replaced with XbaI/XhoI fragments from TOPO-T2A-LexA:QF(0), TOPO-T2A-LexA:QF(1), and TOPO-T2A-LexA:QF(2) harboring splice acceptor T2A-LexA:QF cassettes (T-LEM, T2A-LexA expression module) for all three intron phases. All restriction enzymes used and T4 DNA ligase are from New England Biolabs. We named these T2A-LexA:QF knock-in plasmids pT-LEM(0), pT-LEM(1), and pT LEM(2).
Two CRISPR target sites (no1 and no2) in the intron downstream of the first coding exon shared by all five predicted transcripts of the Ion transport peptide gene (ITP) to insert T-LEM were chosen using flyCRISPR Optimal Target Finder (Gratz et al., 2014). By ligating annealed oligonucleotides, two guide RNA expression constructs were inserted into BbsI-linearized pCFD3 vector (Port et al., 2014). Sequences of oligonucleotides were.
(no1) gtcgGTGTTCCTTACAGCGTTCA aaacTGAACGCTGTAAGGAACAC.
(no2) gtcgAAAATGATCGCGGGACCTT aaacAAGGTCCCGCGATCATTTT.
Next, 5prime and 3prime homology arms (5´HA, 3´HA) for both targeted sites were introduced into pT-LEM(2). Therefore, target site flanking sequences of approximately 1 kb size were amplified by PCR (Q5 polymerase, New England Biolabs) from genomic DNA of nos-Cas9[attP2] fly line used for embryo injection. See Table 2 for primer sequences. PCR products were subcloned into pCRII-TOPO vector (Invitrogen). Then 5´HAs were ligated as SphI/NotI fragments from TOPO plasmids into SphI/NotI-linearized pT-LEM(2) vector, resulting in pT-LEM(2)–5´HA-no1 and pT-LEM(2)–5´HA-no2. Finally, 3´HA no1 was inserted as AscI/KpnI fragment from TOPO plasmid into AscI/KpnI-digested pT-LEM(2)–5´HA-no1 and 3´HA no2 as KpnI/SpeI fragment into KpnI/SpeI-cut pT-LEM(2)–5´HA-no2, resulting in pT-LEM(2)-ITP-no1 and pT-LEM(2)-ITP-no2, respectively. Plasmid microinjections to generate ITPT2A-LexA-no1 and ITPT2A-LexA-no2 lines were performed by BestGene Inc By using Cre-loxP system, the 3xP3-DsRed cassette was removed from ITPT2A-LexA-no1 and ITPT2A-LexA-no2.
Table 2
Primer sequences to generate homology arms.
| Forward primer sequence | Revers primer sequence | |
|---|---|---|
| 5´HA no1 | gcatgcACGCGCTGTTAATCAAAT | gcggccgcACGCTGTAAGGAACACTGATG |
| 5´HA no2 | gcatgcCGCTGTCATCGCTGTAATTC | gcggccgcGTCCCGCGATCATTTTCC |
| 3´HA no1 | ggcgcgccTCAAGGCAAGGCCGTCC | ggtaccCGAATTAAATTTGGGCGTTT |
| 3´HA no2 | ggtaccCTTCGGTTGTTTCTGAACTTTATG | actagtTCTCCCACTCCCCAATTATG |
EM reconstruction
Request a detailed protocolNeuron reconstruction was done on an ssTEM volume of a 6-hr-old first instar larva (Ohyama et al., 2015). We identified the RPNs by reconstruction of all axons originating in the CNS and targeting the ring gland through the NCC nerve. The mNSCs including neurons producing insulin-like peptides, DMS and DH44, have been previously reconstructed and described (Miroschnikow et al., 2018; Ohyama et al., 2015; Schlegel et al., 2016). We reconstructed all neurons to completion (tracing 100% and at least 95% reviewed). Downstream targets were not synaptically connected to RPNs (except for EH downstream partners, being reconstructed with a synaptic threshold of 3). Therefore, membrane-fused DCVs were marked as connectors without direction. DCVs within the CNS were not marked due to technical issues with the common synapse annotation system. No synaptic connections were observed in the larval ring gland. The ring gland was reconstructed with all cells and tissue areas were assigned based on tissue boundaries, color (CA area was slightly darker, CC cells showed dendritic arborizations into the CC), and cell soma position. All synaptic up- and downstream partners of the RPNs were reconstructed to completion with a synaptic threshold to each of the RPNs of three synapses.
For sensory neurons included here, we made use of earlier published data (Berck et al., 2016; Miroschnikow et al., 2018; Ohyama et al., 2015; Schlegel et al., 2016). A subset of 12 TD neurons were already described (Schlegel et al., 2016). We reconstructed for this study all 26 TD neurons.
Sensory neuron pie charts
Request a detailed protocolPie charts in Figure 3 and following: Pie charts of sensory profiles were calculated using the percentage of total synaptic input of interneurons and RPNs (in case of monosynaptic connections) as fraction (thereby ignoring other inputs to show distribution of sensory origins). Percentages then give the percentage of total sensory synaptic input to interneurons or RPNS.
Hub score
Request a detailed protocolCalculation of hub score in Figure 5A: Fraction of total synaptic input from all sensory neurons to defined interneurons (see IDs) was multiplied by the total fraction of input of the RPN group from this interneuron. For example, interneuron #10 (Munin 2) receives 32.33% (fraction: 0.3233) of their total synaptic input from sensory neurons. In turn, corazonin neurons receive 56.52% (fraction: 0.5652) of their total synaptic inputs from interneuron #10 (Munin 2). Multiplying the fractions of this path (sensory via interneuron to CRZ) leads to a hub score of 0.3233 × 0.5652 = 0.18272916 (hub score).
Immunohistochemistry
Request a detailed protocolDissected larval brains were fixed for 1 hr in paraformaldehyde (4%) in 1× phosphate-buffered saline (PBS), rinsed three times (20 min) with 1% PBS-T (1% Triton X-100 in 1× PBS), and blocked in 1% PBS-T containing 5% normal goat serum (ThermoFisher) for 1 hr. Primary antibody was added to the solution (for concentrations, see below). Brains rotated overnight at 4°C. On the second day, larval brains were washed three times (20 min) with 1% PBS-T and subsequently secondary antibody was applied. Brains rotated overnight at 4°C. After three times washing with 1% PBS-T, brains were dehydrated through an ethanol-xylene series and mounted in DPX Mountant (Sigma-Aldrich). Imaging was carried out using a Zeiss LSM 780 confocal microscope with 25× or 63× objective (oil). For antibody stainings of peptide> mRFP, the primary antibody was anti-RFP (1:500, mouse, Abcam, ab65856). Secondary antibody was anti-Mouse Alexa Fluor 568 (1:500, goat, Invitrogen, A-11031). For ITP>myr GFP stainings, primary antibody was anti-GFP (1:500, chicken, Abcam, ab13970) and secondary antibody was anti-Chicken Alexa Fluor 488 (1:500, goat, Invitrogen, A-11039). For Crz staining, primary antibody was anti-Crz (1:500, rabbit, gift from C. Wegener), secondary antibody was anti-Rabbit Alexa Fluor 568 (1:500, goat, Invitrogen, A-11011). For Trans-Tango stainings, primary antibodies were anti-GFP (1:500, chicken, Abcam, ab13970) and anti-HA (1:250, mouse, BioLegend, 901501). Secondary antibodies were anti-Chicken Alexa Fluor 488 (1:500, goat, Invitrogen, A-11039) and anti-Mouse Alexa Fluor 568 (1:500, goat, Invitrogen, A-11031), respectively. For Gr21a>GFP stainings, primary antibodies were anti-GFP (1:500, chicken, Abcam, ab13970) and anti-Futsch/22C10 (1:500, mouse, DSHB, AB528403). 22C10 was deposited to the DSHB by S. Benzer and N. Colley. Secondary antibodies were anti-Chicken Alexa Fluor 488 (1:500, goat, Invitrogen, A-11039) and anti-Mouse Alexa Fluor 633 (1:500, goat, Invitrogen, A-21046), respectively. DAPI (1:1,000) was used for staining of RG nuclei.
Functional imaging with CaMPARI
Request a detailed protocolFor experiments with TD-neuron line 260-Gal4, we used UAS-CaMPARI1 (Fosque et al., 2015). A larva was placed inside the Petri dish and fixed with duct tape for 60 s. 405 nm UV light (M405L2_UV, Thorlabs) was placed 12 cm above the larva and illuminated with a LED controller (LEDD1B, Thorlabs at max intensity) for 15 s. Afterwards the larval brain was dissected and put onto a poly-L-lysine-coated coverslip and covered with 1× PBS for imaging at low Ca2+ conditions. Caudal dendrites of TD neurons that project to the SEZ were imaged. For defined concentrations of CO2 stimulation, we used a CO2 incubator (CB 53, Binder) at CO2 concentrations of 0, 10, and 20% CO2 at 24–27°C. Stimulation protocol was the same as described before.
For experiments with different peptide-Gal4 lines, we used UAS-CaMPARI2 with improved baseline fluorescence and improved integration dynamics (Moeyaert et al., 2018). In our hands, photoconversion ratios were lower in general but more defined when neurons were not active, lowering the number of false-positive photoconversion (own observations). We used the CO2 incubator to set CO2 concentration to 20% and compared neuronal photoconversion with 0% CO2 concentration in the incubator. Larvae were placed on duct tape in the middle of a 5 cm Petri dish for 60 s and afterwards illuminated for 30 s with 405 nm at max intensity. Following steps were the same as described before.
Statistics
For CaMPARI experiments, green to red ratios of single cells of peptide-Gal4 lines were analyzed with a custom-made script for FIJI (ImageJ), and the mean was calculated per animal (each cell was analyzed and a mean build). Animal means were then analyzed and plotted with Prism 6 software using the Mann–Whitney rank-sum test, *p<0.05, **p<0.01, ***p<0.001, ****p<0.0001.
FFN diffusion model
Request a detailed protocolThe FFN was implemented in Python as a simple artificial neural network without backpropagation. Synaptic weights were normalized by the total number of postsynapses such that they represented fractions of inputs for a given neuron. Neurons were implemented as rectified linear units using a ReLu activation function that starts responding at 5% and reaches saturation at 50% of their synaptic inputs being active:
with x being the sum activity of all inputs weighted by their synaptic weights, constants a and b controlling the response onset and saturation, respectively. a and b were chosen such that neurons start responding at 5% and reach saturation at 50% of their synaptic inputs being active: a = 0.05, b = 0.5. These values were chosen to maximize the response range of the network. The code for the FFN and the generation of the figures can be found at https://github.com/Pankratz-Lab/FFN_Hueckesfeld-et-al.-2020 (Schoofs and Schlegel, 2020; copy archived at swh:1:rev:494220124eb79f5ed0b5eebe585b796e18729b47).
Analysis of single-cell transcriptomic data from Brunet Avalos et al., 2019
Request a detailed protocolIn order to analyze peptide receptor interaction between RPN groups, we sought out to use the data generated in the lab of Simon Sprecher describing the single-cell transcriptomic atlas of the Drosophila larval brain (Brunet Avalos et al., 2019). Advantage of this dataset was the exclusive analysis of SEZ and brain lobes, which helped in finding the RPN-specific peptidergic cell groups. We used R analysis similar to the described workflow in Brunet Avalos et al., 2019 based on Seurat v3 workflow (Butler et al., 2018; Stuart et al., 2019). In brief, we used seurat processing pipeline from Satija lab (https://satijalab.org/seurat/) to process the integrated datasets of fed and starved conditions (GEO accession number GSE134722 Brunet Avalos et al., 2019). This combined dataset consists of 9346 cells and 14,064 analyzed features. In order to cluster the RPNs into the specific groups, the following parameters were used: dataset: fed and starved integrated and log normalized | scale = 10,000 | 2000 variable genes | Seurat v3 processing: cells with unique features: 200–4500 | genes expressed in at least one cell | 31 PCs were used to assess cell clusters | resolution was 1 | cluster 12 was identified as peptidergic cells | peptidergic cells were separated with the following parameters (expression profiles):
IPCs: Ilp2 ≥ 3 & Ilp5 & Ilp3 (26 cells)
DMS: Ms ≥ 6 (9 cells)
DH44: Dh44 ≥ 2.8 (12 cells)
CRZ: Crz ≥ 1 &sNPF ≥ 1 (13 cells)
ITP: ITP ≥ 1 & Lk ≥ 0.8 (17 cells)
PTTH: Ptth ≥ 2 (9 cells)
CA-LP: FMRFa >3.5 (14 cells)
HugRG: Hug >4 & Mip > 1 (7 cells)
CAPA: Capa ≥ 2 (6 cells)
EH: Eh ≥ 4 (4 cells)
For CA-LP neurons, FMRFamide was used based on the description in de Velasco et al., 2007. Hugin-RG cells were separated based on Coexpression of Mip neuropeptide (unpublished observation, staining with Mip-Gal4 line and Hugin-antibody).
Graphical representation and visualization
Request a detailed protocolNeurons were rendered in Blender 3D (ver2.79b) using the CATMAID to Blender interface described by Schlegel et al., 2016 (https://github.com/elifesciences-publications/Catmaid-to-Blender) and edited in Affinity Designer (Serif) for MAC. Staining images were processed with FIJI (ImageJ) and CaMPARI images were analyzed using a custom-made FIJI script to be subsequently edited in Affinity Designer. Hive Plots were generated by using the CATMAID software for spatial distribution of nodes and subsequently made in Gephi 0.92 with rescaled edge weights (e.g., 1–200 synapses were rescaled for line thickness 1–20). Edges with less than five synapses were ignored in Gephi. To visualize peptide receptor connectivity, we used Circos tableviewer (http://mkweb.bcgsc.ca/tableviewer/).
Data availability
All data generated or analysed during this study are included in the manuscript and supporting files. We used the same EM volume reported in Ohyama et al. 2015 (Nature) and available at https://neurodata.io/data/acardona_0111_8. To access the dataset, users need to first create a free account on the neurodata site: the data is then subsequently available to download (further details can be found in the guide https://neurodata.io/help/download/). There are no restrictions on availability. The following previously published data sets were used: Ohyama T Schneider-Mizell CM Fetter RD Valdes Aleman J Franconville R Rivera-Alba M Mensh BD Branson KM Simpson JH Truman JW (2015) NeuroData EM volume from: A multilevel multimodal circuit enhances action selection in Drosophila. https://neurodata.io/data/acardona_0111_8.
-
NeurodataA multilevel multimodal circuit enhances action selection in Drosophila.
References
-
The hormonal coordination of behavior and physiology at adult ecdysis in Drosophila melanogasterThe Journal of Experimental Biology 202:3037–3048.
-
Endocrinology of the stress responseAnnual Review of Physiology 67:259–284.https://doi.org/10.1146/annurev.physiol.67.040403.120816
-
Useful road maps: studying Drosophila larva’s central nervous system with the help of connectomicsCurrent Opinion in Neurobiology 65:129–137.https://doi.org/10.1016/j.conb.2020.09.008
-
Behavioral responses of Drosophila to biogenic levels of carbon dioxide depend on life-stage, sex and olfactory contextThe Journal of Experimental Biology 209:2739–2748.https://doi.org/10.1242/jeb.02297
-
MECHANISMS IN ENDOCRINOLOGY: Beyond the fixed setpoint of the hypothalamus–pituitary–thyroid axisEuropean Journal of Endocrinology 171:R197–R208.https://doi.org/10.1530/eje-14-0285
-
60 YEARS OF NEUROENDOCRINOLOGY: The hypothalamo-prolactin axisThe Journal of Endocrinology 226:T101–T122.https://doi.org/10.1530/JOE-15-0213
-
Peptides in the nervous systems of cnidarians: structure, function, and biosynthesisInternational Review of Cytology 167:37–89.https://doi.org/10.1016/s0074-7696(08)61345-5
-
The neuroendocrine system of invertebrates: a developmental and evolutionary perspectiveThe Journal of Endocrinology 190:555–570.https://doi.org/10.1677/joe.1.06964
-
The roles of central and peripheral eclosion hormone release in the control of ecdysis behavior in Manduca sextaJournal of Comparative Physiology. A, Sensory, Neural, and Behavioral Physiology 168:697–707.https://doi.org/10.1007/BF00224359
-
The juvenile hormone signaling pathway in insect developmentAnnual Review of Entomology 58:181–204.https://doi.org/10.1146/annurev-ento-120811-153700
-
Stressed-out insects: Hormonal actions and behavioral modificationsHormones, Brain and Behavior 10:465–481.https://doi.org/10.1016/b978-008088783-8.00031-0
-
Molecular and cellular organization of the taste system in the Drosophila larvaThe Journal of Neuroscience 31:15300–15309.https://doi.org/10.1523/JNEUROSCI.3363-11.2011
-
Characterization of a RFamide-positive subset of ganglionic cells in the hydrozoan planular nerve netCell and Tissue Research 269:431–438.https://doi.org/10.1007/BF00353898
-
Making Feeding Decisions in the Drosophila Nervous SystemCurrent Biology 30:R831–R840.https://doi.org/10.1016/j.cub.2020.06.036
-
Improved methods for marking active neuron populationsNature Communications 9:4440.https://doi.org/10.1038/s41467-018-06935-2
-
Drosophila neuropeptides in regulation of physiology and behaviorProgress in Neurobiology 92:42–104.https://doi.org/10.1016/j.pneurobio.2010.04.010
-
Substrates for Neuronal Cotransmission With Neuropeptides and Small Molecule Neurotransmitters inFrontiers in Cellular Neuroscience 12:83.https://doi.org/10.3389/fncel.2018.00083
-
Hormonal axes in Drosophila: regulation of hormone release and multiplicity of actionsCell and Tissue Research 382:233–266.https://doi.org/10.1007/s00441-020-03264-z
-
Carbon dioxide poisoning: a literature review of an often forgotten cause of intoxication in the emergency departmentInternational Journal of Emergency Medicine 10:14.https://doi.org/10.1186/s12245-017-0142-y
-
A Review of Theory in Physiological PsychologyAnnual Review of Psychology 11:1–40.https://doi.org/10.1146/annurev.ps.11.020160.000245
-
Learning from connectomics on the flyCurrent Opinion in Insect Science 24:96–105.https://doi.org/10.1016/j.cois.2017.09.011
-
Serotonergic pathways in the Drosophila larval enteric nervous systemJournal of Insect Physiology 69:118–125.https://doi.org/10.1016/j.jinsphys.2014.05.022
-
Multi-sensory integration in the mouse cortical connectome using a network diffusion modelNetwork Neuroscience 4:1030–1054.https://doi.org/10.1101/832485
-
Innervation of the ring gland of Drosophila melanogasterThe Journal of Comparative Neurology 431:481–491.https://doi.org/10.1002/1096-9861(20010319)431:4<481::aid-cne1084>3.0.co;2-7
-
Connectomics and function of a memory network: the mushroom body of larval DrosophilaCurrent Opinion in Neurobiology 54:146–154.https://doi.org/10.1016/j.conb.2018.10.007
-
The neuroendocrine System: Organization and homeostatic roleJournal of Endocrinological Investigation 27:35–47.
-
The Evolution of Insect MetamorphosisCurrent Biology 29:R1252–R1268.https://doi.org/10.1016/j.cub.2019.10.009
-
Does corazonin signal nutritional stress in insects?Insect Biochemistry and Molecular Biology 39:755–762.https://doi.org/10.1016/j.ibmb.2009.09.008
-
Towards a functional connectomeJournal of Neurogenetics 34:156–161.https://doi.org/10.1080/01677063.2020.1712598
Article and author information
Author details
Sebastian Hückesfeld

Anton Miroschnikow
Casey M Schneider-Mizell
Michael J Pankratz
Funding
Deutsche Forschungsgemeinschaft (DFG PA 787/9-1)
- Sebastian Hückesfeld
- Philipp Schlegel
- Anton Miroschnikow
- Andreas Schoofs
- Ingo Zinke
- André N Haubrich
- Michael J Pankratz
Howard Hughes Medical Institute
- Casey M Schneider-Mizell
- James W Truman
- Richard D Fetter
- Albert Cardona
Wellcome Trust (205038/Z/16/Z)
- Albert Cardona
Deutsche Forschungsgemeinschaft (EXC 2151 - 390873048)
- Sebastian Hückesfeld
- Philipp Schlegel
- Anton Miroschnikow
- Andreas Schoofs
- Ingo Zinke
- André N Haubrich
- Michael J Pankratz
The funders had no role in study design, data collection and interpretation, or the decision to submit the work for publication.
Acknowledgements
We thank the whole Pankratz lab for fruitful discussions on earlier versions of this manuscript. We thank Anna Pepanian, Christina Georgopoulou, and Stephan Nottelmann for help with cloning of the ITP-T2A-LexA line. We thank Dick Nässel, Michael B O´Connor, Jae Park, Yi Rao, Jan Veenstra, Christian Wegener, and Benjamin White for sharing fly lines and resources. We thank the Fly EM Project Team at HHMI Janelia for the gift of the EM volume, the HHMI visa office, and HHMI Janelia for funding. We also thank all 'tracers' for their contribution to the EM reconstruction.
Copyright
© 2021, Hückesfeld et al.
This article is distributed under the terms of the Creative Commons Attribution License, which permits unrestricted use and redistribution provided that the original author and source are credited.
Metrics
-
- 5,148
- views
-
- 440
- downloads
-
- 62
- citations
Views, downloads and citations are aggregated across all versions of this paper published by eLife.
Citations by DOI
-
- 62
- citations for umbrella DOI https://doi.org/10.7554/eLife.65745
Download links
A two-part list of links to download the article, or parts of the article, in various formats.
Downloads (link to download the article as PDF)
Open citations (links to open the citations from this article in various online reference manager services)
Cite this article (links to download the citations from this article in formats compatible with various reference manager tools)
Unveiling the sensory and interneuronal pathways of the neuroendocrine connectome in Drosophila
eLife 10:e65745.
https://doi.org/10.7554/eLife.65745


