A sustained type I IFN-neutrophil-IL-18 axis drives pathology during mucosal viral infection
- Department of Medicine/Division of Infectious Diseases, Washington University School of Medicine, United States
- Department of Pathology and Immunology, Washington University School of Medicine, United States
- Department of Medicine/Division of Rheumatology, Washington University School of Medicine, United States
- Department of Pediatrics/Division of Critical Care Medicine, Washington University School of Medicine, United States
- Department of Pediatrics/Hematology and Oncology, Washington University School of Medicine, United States
Figures
Figure 1 with 4 supplements
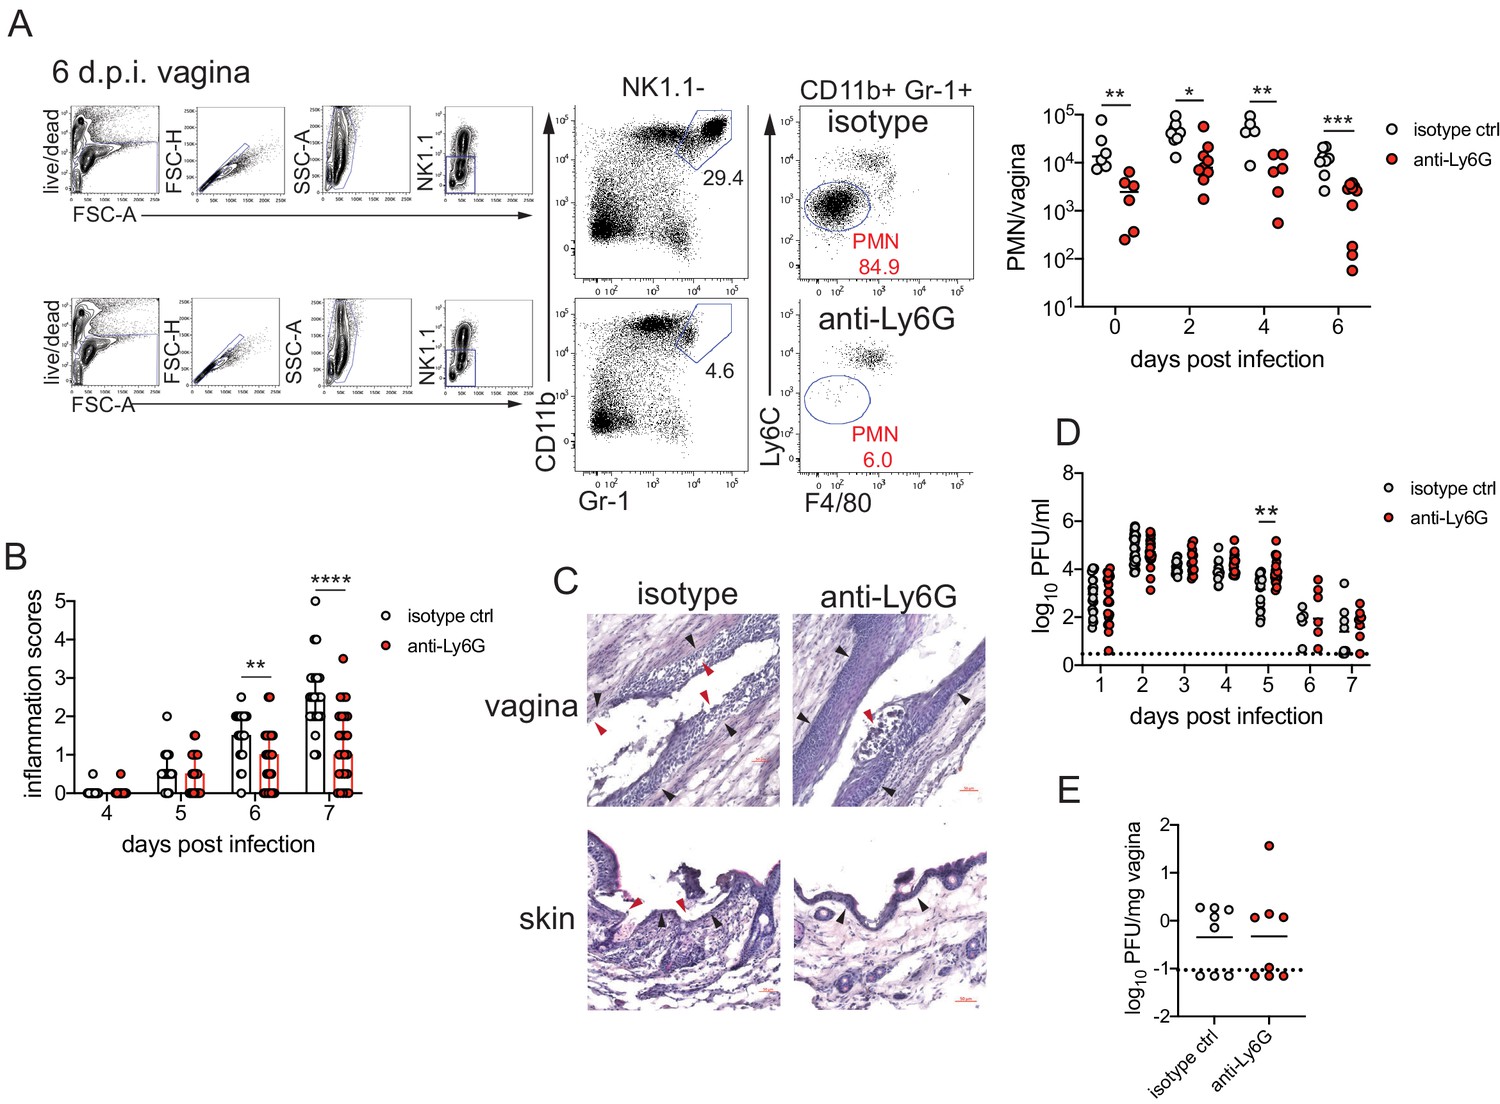
Neutrophil depletion reduces disease severity after HSV-2 vaginal infection.
Female C57BL/6J mice were treated with depot medroxyprogestrone (DMPA) and inoculated intravaginally (ivag) with 5000 plaque forming units (PFU) of herpes simplex virus-2 (HSV-2). One day prior to HSV-2 inoculation, mice were injected intraperitoneally (i.p.) with 500 μg of rat IgG2a isotype control or anti-Ly6G monoclonal antibody (mAb). (A) Plots show gating strategy to identify neutrophils in the vagina. Numbers in plots refer to percent of parent population for gated cells (d0, d2: n = 6, d2: n = 9, d6 isotype: n = 8, d6 anti-Ly6G: n = 10). Depletion was confirmed by flow cytometry in the vagina on the indicated days. (B) Inflammation scores over the first 7 d.p.i. of mice treated with anti-Ly6G antibody (n = 25) or isotype control (n = 23). Mice showed no signs of disease prior to 4 d.p.i. (C) Histology of the vagina (top) or genital skin (bottom) at 6 d.p.i. from isotype control (left) or anti-Ly6G antibody-treated mice (right). Red arrows point to areas of epithelial denuding or damage, black arrows denote the basement membrane. (D) Infectious virus as measured by plaque assay in vaginal washes collected daily (both groups d1: n = 22, d2: n = 28, d3: n = 15, d4: n = 16, d5: n = 19, d6: n = 6, d7: n = 8). (E) Viral load was measured in homogenized vaginal tissue collected at 7 d.p.i. from the indicated groups (n = 8). Data in A and E are pooled from two independent experiments, and data in B and D are pooled from two to four independent experiments. Data in C is representative of two independent experiments. Bars in B show median with interquartile range. Horizontal bars in A, D, and E show mean. Scale bars show 50 mm. Statistical analysis was performed by two-way ANOVA on log-transformed data with Bonferroni's multiple comparisons test (A), repeated measures two-way ANOVA with Geisser-Greenhouse correction and Bonferroni's multiple comparisons test (B) repeated measures two-way ANOVA with Bonferroni's multiple comparison's test (D) or Mann-Whitney test (E). *p<0.05, **p<0.01, ***p<0.005, ****p<0.001. Raw values for each biological replicate, epsilon values, and specific p values are provided in Figure 1—source data 1.
-
Figure 1—source data 1
Excel file with individual inflammation scores, viral titers, tissue weights, description of statistical tests, epsilon values and actual p values for Figure 1.
- https://cdn.elifesciences.org/articles/65762/elife-65762-fig1-data1-v1.xlsx
-
Figure 1—source data 2
Excel file with individual cell numbers and frequencies, inflammation scores, viral titers, description of statistical tests, epsilon values and actual p values for Figure 1—figure supplements 1–4.
- https://cdn.elifesciences.org/articles/65762/elife-65762-fig1-data2-v1.xlsx
Figure 1—figure supplement 1
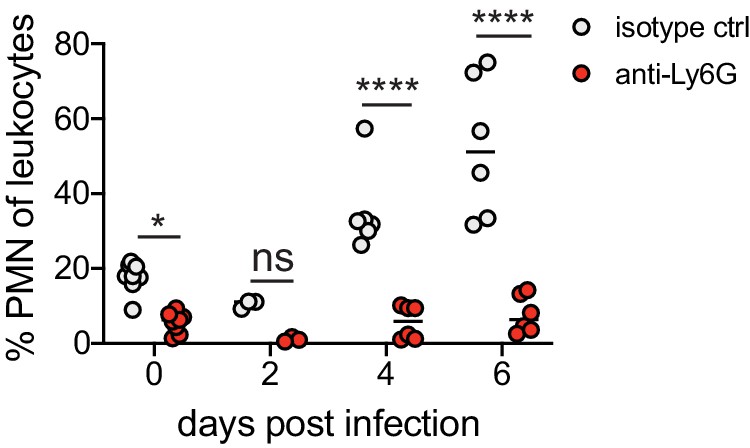
Depletion of neutrophils in the blood after anti-Ly6G mAb treatment.
Female C57BL/6J mice were treated with isotype control or anti-Ly6G mAb and infected as described in Figure 1. The percentage of neutrophils per total live leukocytes in the blood was measured at the indicated days post-infection. Data is pooled from two independent experiments (d0: n = 9, d2: n = 2, d4, d6: n = 6). Statistical significance was measured by two-way ANOVA with Bonferroni's multiple comparisons test. *p<0.05, ****p<0.0001. Raw values for each biological replicate and specific p values are provided in Figure 1—source data 2.
Figure 1—figure supplement 2
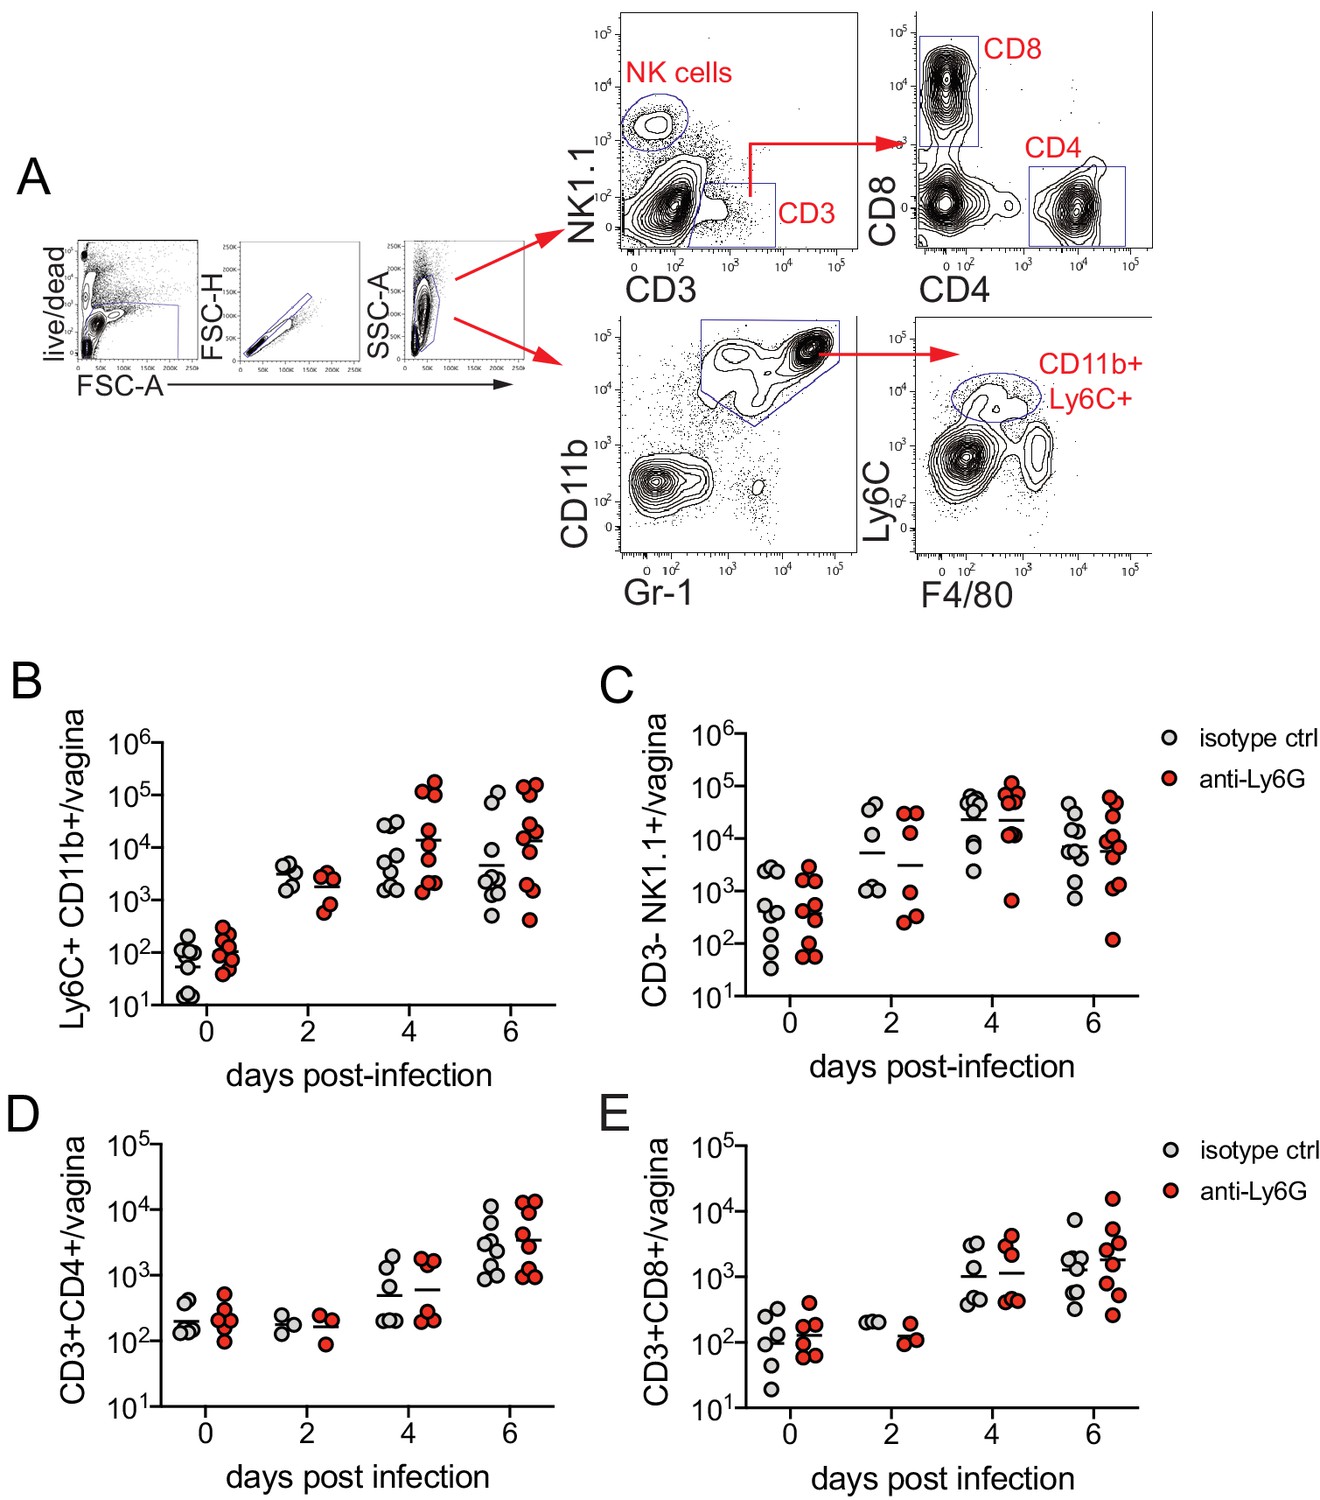
Neutrophil depletion does not affect magnitude of the immune cell response after HSV-2 infection.
Mice were infected and treated as described in Figure 1. (A) Representative flow plots showing gating strategy for the indicated subsets. On the indicated d.p.i., immune cell infiltrates were measured in the vagina by flow cytometry. Ly6C + CD11b + monocytes (B), CD3-NK1.1+ NK cells (C), CD3 +CD4+ T cells (D), and CD3 +CD8+ T cells (E) were enumerated in perfused tissue. (B, C) Isotype controls: n = 6–9, anti-Ly6G: n = 6–10. (D, E) Isotype controls: n = 3–8, anti-Ly6G: n = 3–9. All data are pooled from two independent experiments. Horizontal bars show mean. Statistical analysis was performed by two-way ANOVA with Bonferroni's multiple comparisons test. All comparisons were not significant. Raw values for each biological replicate and specific p values are provided in Figure 1—source data 2.
Figure 1—figure supplement 3
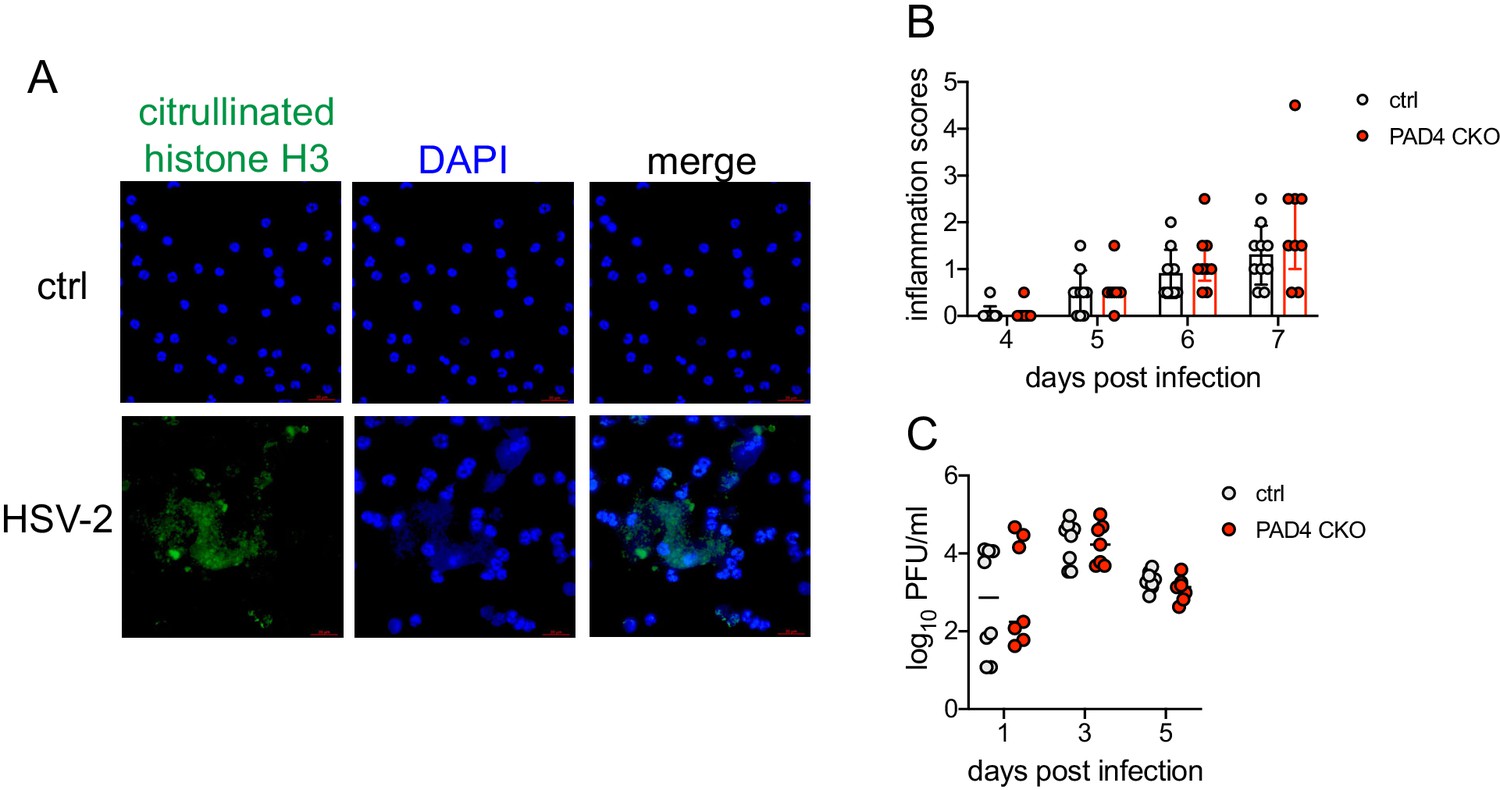
PAD4 is not required for development of genital inflammation during HSV-2 infection.
(A) Neutrophils were isolated from the bone marrow of naive C57BL/6 female mice and stimulated with heat-killed HSV-2 at a multiplicity of infection (MOI) of 1 for 4 hr (bottom row) or left unstimulated (top row). NETs are identified by areas of diffuse 4′,6-diamidino-2-phenylindole (DAPI) staining (blue) that overlap with citrullinated histone H3 (green). Data are representative of two independent experiments. (B-C) Padi4fl/fl x S100a8-Cre (PAD4 CKO) or Cre- littermate controls were infected with HSV-2 as described in Figure 1. Inflammation scores were monitored for 7 d.p.i. (Ctrl: n = 10, KO: n = 9) (B), and infectious virus was measured by plaque assay in vaginal washes collected on the indicated d.p.i. (Ctrl: n = 8, CKO: n = 8) (C). Data in (B-C) are pooled from two independent experiments. Statistical significance was analyzed by repeated measures two-way ANOVA with (B) or without (C) Geisser-Greenhouse correction and Bonferroni's multiple comparisons test; all comparisons were not significant. Raw values for each biological replicate, epsilon values, and specific p values are provided in Figure 1—source data 2.
Figure 1—figure supplement 4
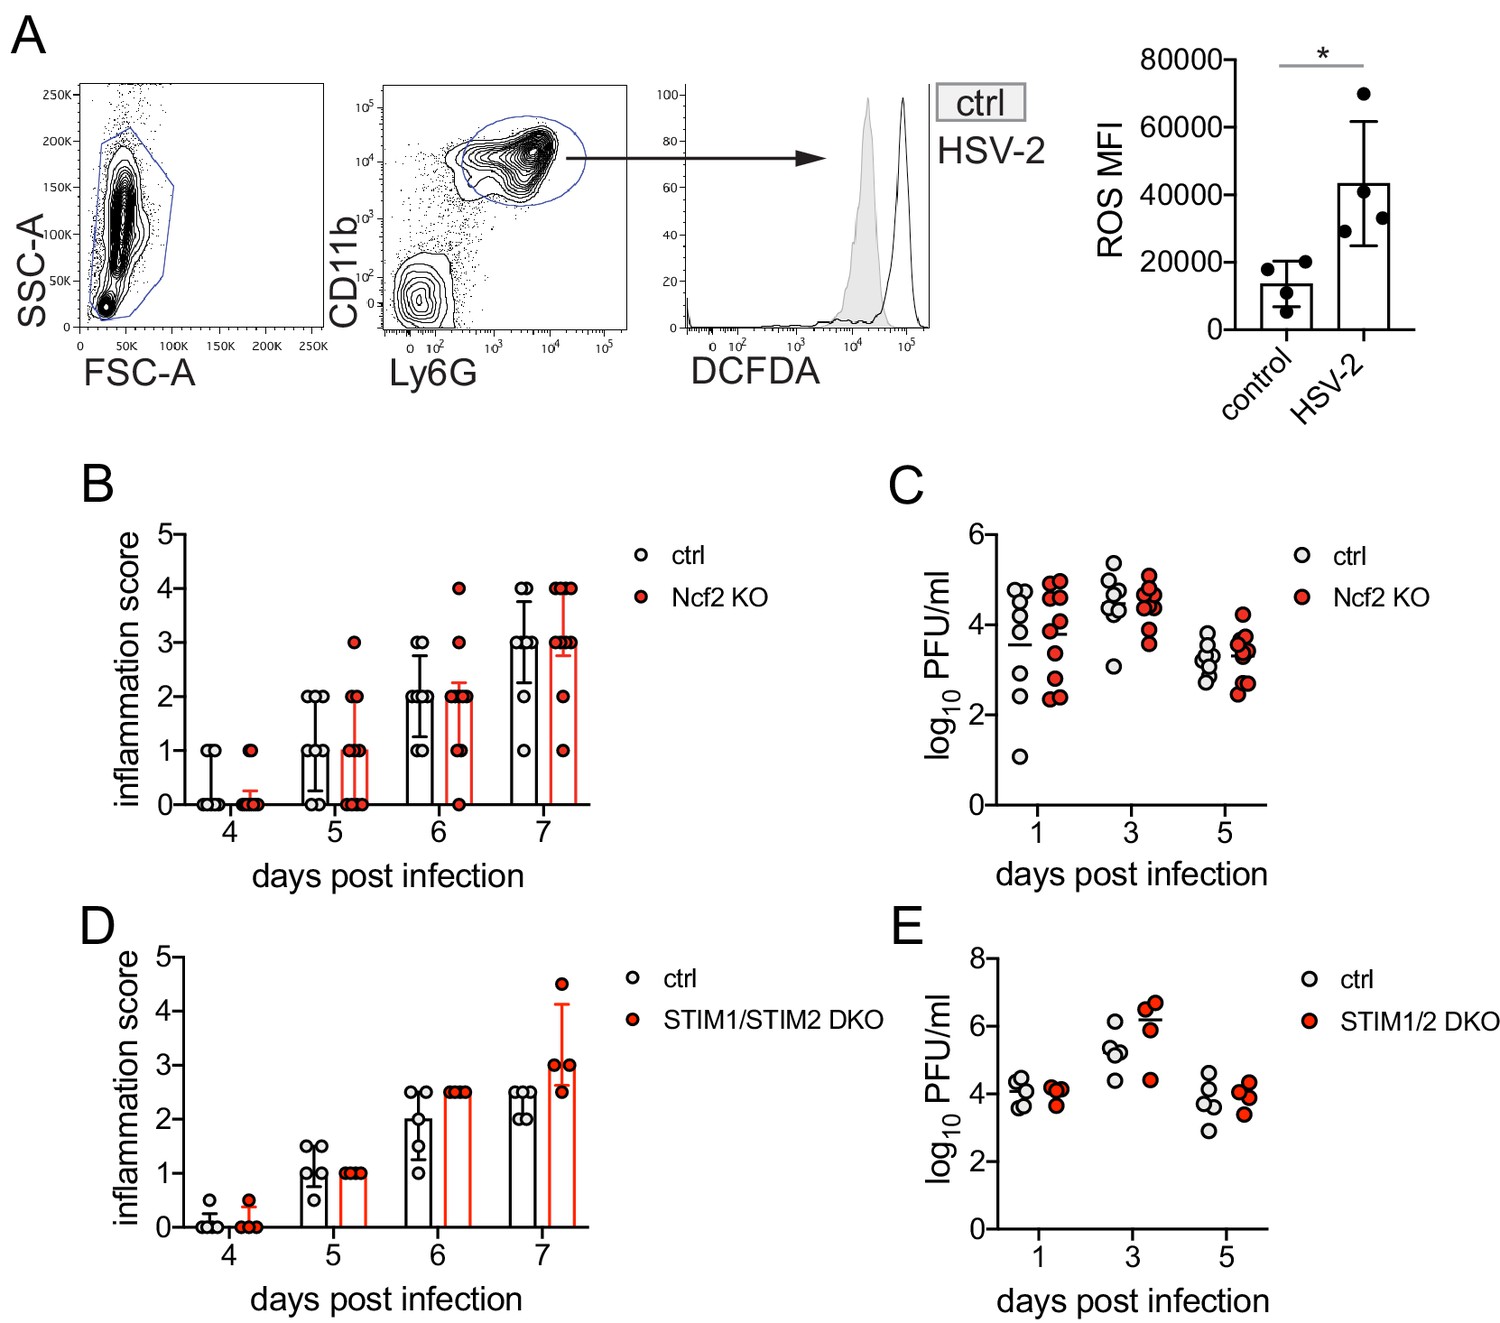
ROS production and STIM1/STIM2 expression in neutrophils are not required for genital inflammation after HSV-2 infection.
(A) Neutrophils were isolated from the bone marrow using a Histopaque gradient and stimulated with heat-killedHSV-2 at an MOI of 5 for 16 hr (n = 4) of left unstimulated (n = 4) and then incubated with DCFDA. Plots show gating for leukocytes (left) and CD11b + Ly6G + neutrophils (middle). DCFDA fluorescence was measured by flow cytometry in unstimulated (shaded histogram) or HSV-2 stimulated (open histogram) neutrophils. Graph shows mean fluorescence intensity (MFI) of DCFDA (reactive oxygen species [ROS]). Ncf2 KO (n = 10) or littermate controls (n = 8) (B–C) or Stim1fl/fl x Stim2fl/fl x S100a8-Cre (STIM1/STIM2 DKO) (n = 4) or littermate controls (n = 5) (D–E) were infected as described in Figure 1. Mice were monitored for genital inflammation for 1 week after infection (B, D). Infectious virus was measured by plaque assay in vaginal washes collected on the indicated days (C, E). Bars in A show mean with SD. Bars in B and D show median with interquartile range. Bars in C and E show mean. Data in A-C are pooled from two independent experiments; data in D-E were performed once. Statistical significance was analyzed by unpaired Student's t-test (A), repeated measures two-way ANOVA with (B, D) or without (C, E) Geisser-Greenhouse correction and Bonferroni's multiple comparisons test, *p<0.05. Comparisons in B-E were not significant. Raw values for each biological replicate, epsilon values, and specific p values are provided in Figure 1—source data 2.
Figure 2 with 1 supplement
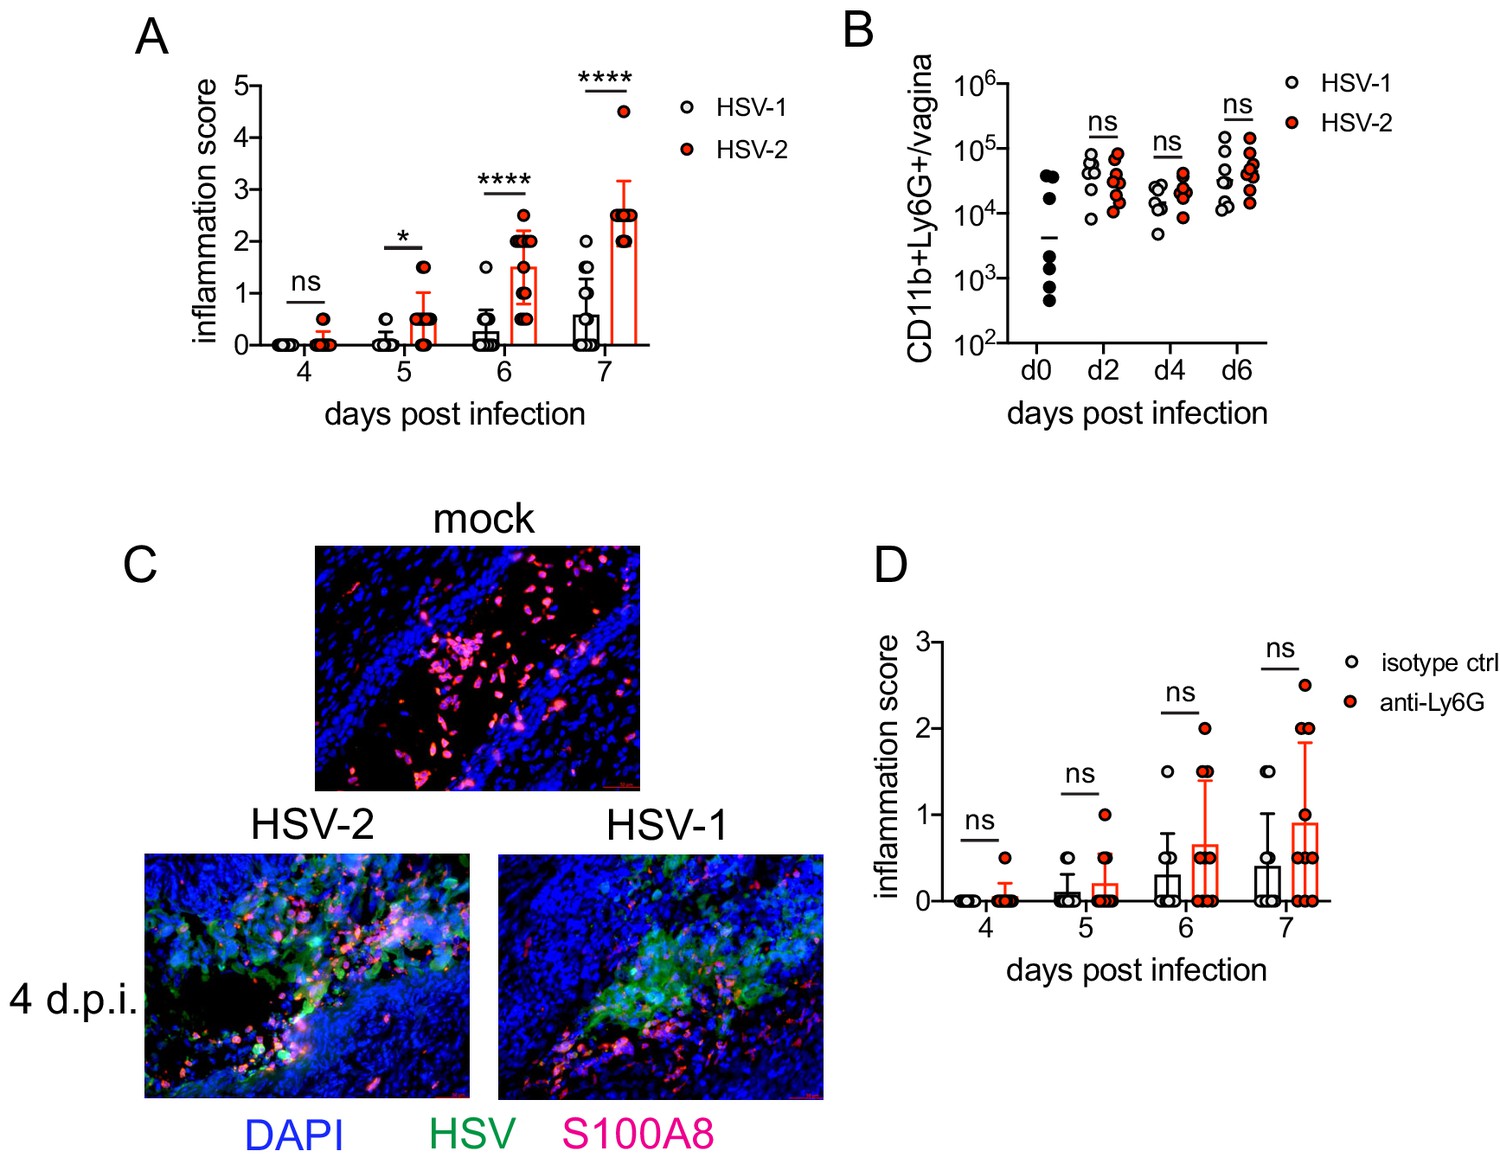
Neutrophils are non-pathogenic in a less inflammatory model of vaginal HSV-1 infection.
Female C57BL/6J mice were treated with DMPA and inoculated ivag with 104 PFU HSV-1 McKrae or HSV-2. (A) Inflammation scores were monitored for 7 d.p.i. (HSV-1: n = 14, HSV-2: n = 13). (B) Neutrophils were counted by flow cytometry in vaginal tissues at the indicated days after HSV-1 or HSV-2 infection (d0: n = 7, day 2: n = 8, day 4: n = 7, day 6: n = 8). (C) Vaginas were harvested from phosphate buffered saline (PBS)-inoculated (mock), HSV-1- or HSV-2-inoculated mice at 4 d.p.i., and tissue sections were probed with antibodies against HSV proteins (green) or S100A8 (red). 4′,6-diamidino-2-phenylindole (DAPI) (blue) was used to detect cell nuclei. Images are representative of six mice per group. (D) Mice were treated with isotype control or anti-Ly6G mAb as described in Figure 1 and then inoculated ivag with 104 PFU HSV-1 McKrae. Inflammation scores were monitored for 7 d.p.i. (isotype, anti-Ly6G mAb: n = 10). Data are pooled from three (A) or two (B–D) independent experiments. Data in C is representative of two independent experiments. Bars show median with interquartile range (A, D) or mean (B). Scale bars show 50 mm. Statistical significance was measured by repeated measures two-way ANOVA with Geisser-Greenhouse correction and Bonferroni's multiple comparisons test (A, D) or two-way ANOVA with Bonferroni's multiple comparisons test (B). *p<0.05, ****p<0.001, ns = not significant. Raw values for each biological replicate, epsilon values, and specific p values are provided in Figure 2—source data 1.
-
Figure 2—source data 1
Excel file with individual inflammation scores, cell numbers, description of statistical tests, epsilon values and actual p values for Figure 2.
- https://cdn.elifesciences.org/articles/65762/elife-65762-fig2-data1-v1.xlsx
Figure 2—figure supplement 1
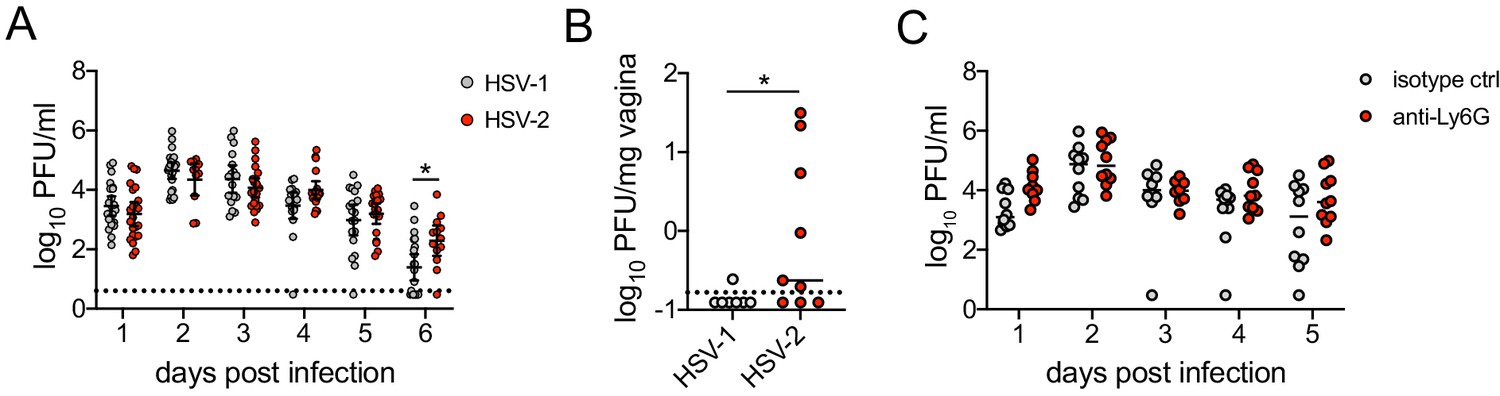
Neutrophil depletion prior to HSV-1 genital infection has minimal impact on viral control.
(A) C57BL/6J females were infected ivag with HSV-1 or HSV-2 as described in Figure 2. Viral titers were measured in vaginal washes collected at the indicated d.p.i. (HSV-1 d1, d2: n = 23, d3: n = 17, d4: n = 18, d5: n = 19, d6: n = 21; HSV-2 d1, d3: n = 22, d2: n = 13, d4, d5: n = 19, d6: n = 13) (Lee et al., 2020). (B) C57BL/6J females were treated with neutrophil-depleting antibodies as described in Figure 1 and infected ivag with 104 pPFU HSV-1 McKrae. Viral titers were measured in vaginal washes collected at the indicated d.p.i. (Isotype d1, d2, d4, d5: n = 10, d3: n = 8; Anti-Ly6G d1: n = 9, d2, d4, d5: n = 10, d3: n = 8). Bars show mean. Data are pooled from at least three (A) or two (B) independent experiments. Statistical significance was measured by repeated measures two-way ANOVA on log-transformed values and Bonferroni's multiple comparisons test (A, C) or Mann-Whitney test (B). *p<0.05. Raw values for each biological replicate and specific p values are provided in Figure 2—figure supplement 1—source data 1.
-
Figure 2—figure supplement 1—source data 1
Excel file with individual viral titers, tissue weights, description of statistical tests and actual p values for Figure 2—figure supplement 1.
- https://cdn.elifesciences.org/articles/65762/elife-65762-fig2-figsupp1-data1-v1.xlsx
Figure 3 with 3 supplements
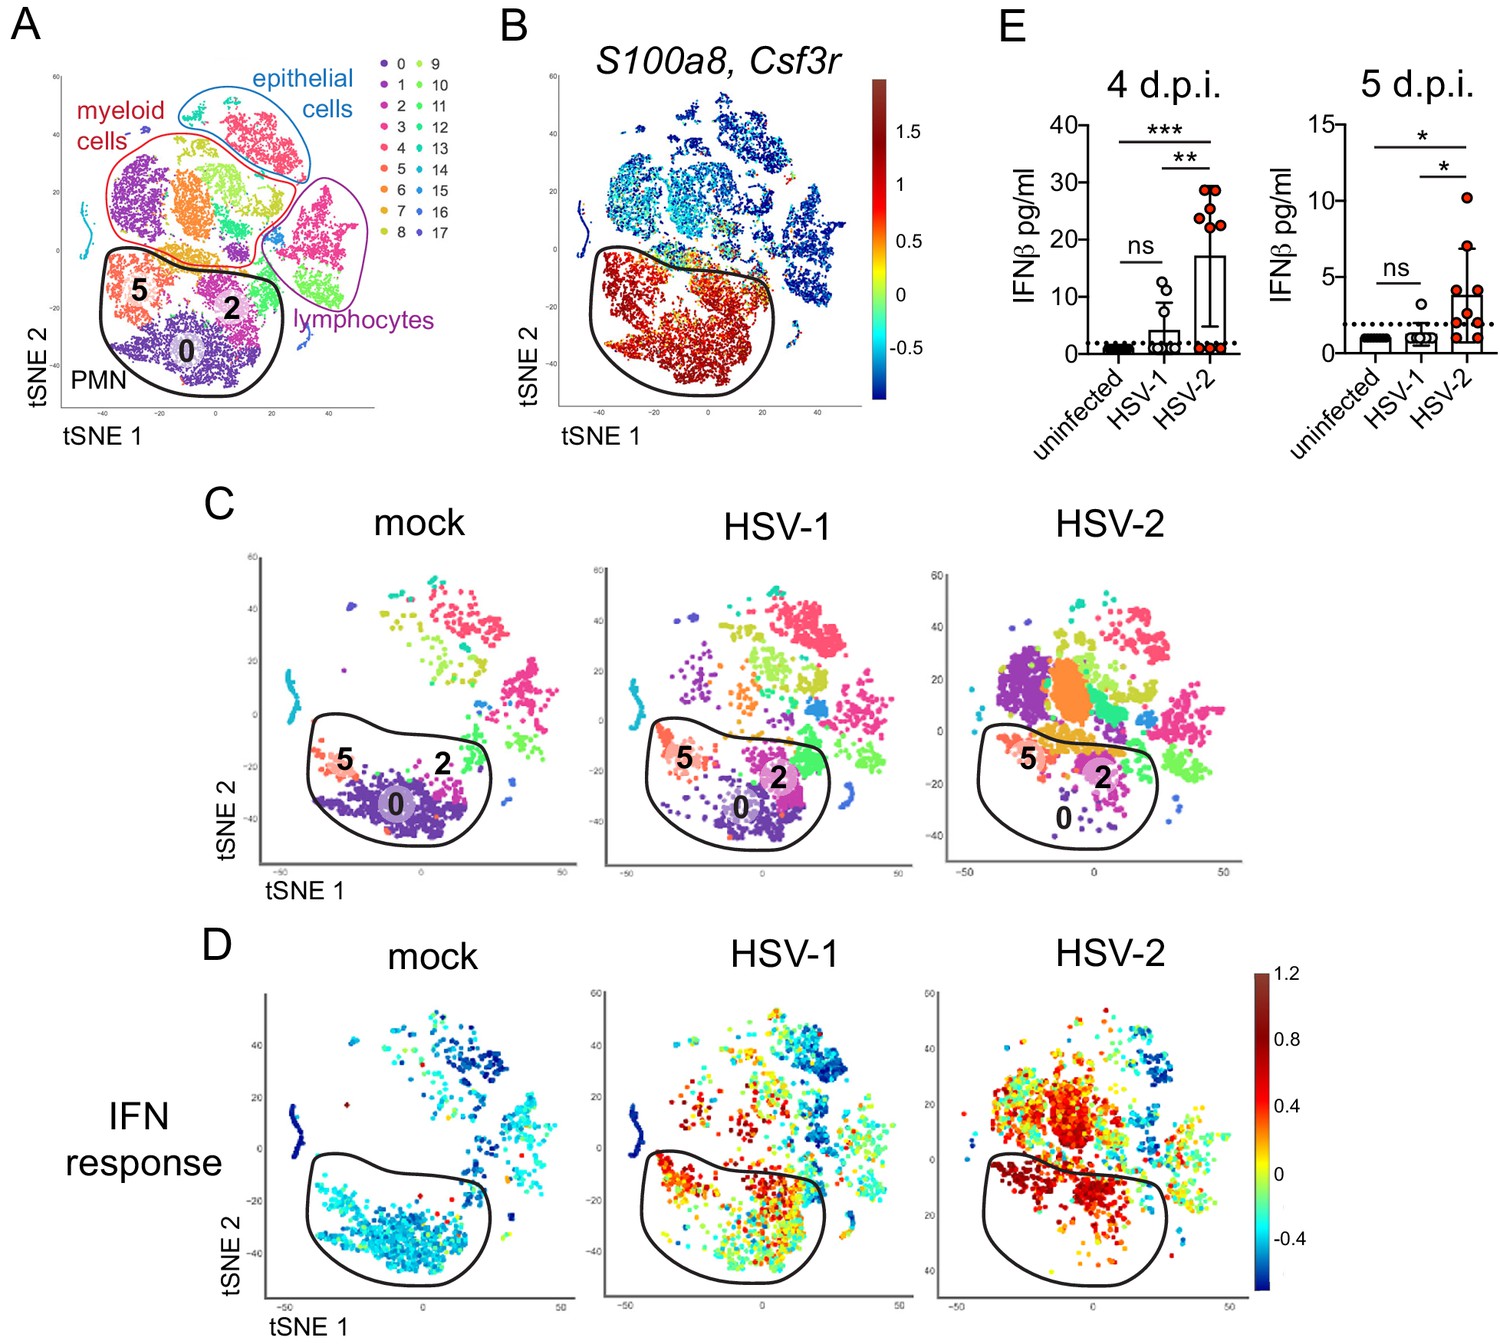
Single cell transcriptome analysis reveals a sustained IFN signature in the neutrophil response against HSV-2.
Mice were infected as described in Figure 2. Vaginas were harvested at 5 d.p.i., and live cells were flow sorted and subjected to high-throughput single-cell RNA sequencing (scRNA-seq). (A) A t-Distributed Stochastic Neighbor Embedding (tSNE) visualization of 21,633 cells across all mice resolves 17 distinct clusters in the vaginal tissue. Clusters can be identified as myeloid cells (red border), epithelial cells (blue border), or lymphocytes (purple border). Neutrophils are encircled in black and contain three distinct clusters (0, 2, and 5). (B) Neutrophils are defined by high expression of S100a8 and Csf3r (G-SCFR). (C) tSNE plots of vaginal cell clusters from mock-inoculated or HSV-infected mice. Neutrophil populations are circled in black. (D) Distribution of expression for genes within the Hallmark IFNa Response gene set. (E) Production of IFNβ in vaginal washes collected at 4 and 5 d.p.i. as measured by ELISA (uninfected: n = 8, HSV-1: n = 9, HSV-2: n = 9). scRNA-seq in A-D was performed once. Data in E are pooled from two independent experiments. Statistical significance was measured by one-way ANOVA with Tukey's multiple comparisons test. *p<0.05, **p<0.01, ***p<0.005. Raw values for each biological replicate, specific p values, and complete lists of differentially expressed genes between clusters 0, 2, and 5 are provided in Figure 3—source data 1.
-
Figure 3—source data 1
Excel file with individual ELISA measurements, lists of differentially expressed genes between different neutrophil clusters, description of statistical tests and actual p values for Figure 3.
- https://cdn.elifesciences.org/articles/65762/elife-65762-fig3-data1-v1.xlsx
-
Figure 3—source data 2
Excel file with lists of differentially expressed genes between neutrophils between HSV-1 and HSV-2 infected mice, individual delta Cq values, ELISA measurements, description of statistical tests and actual p values for Figure 3—figure supplements 1–3.
- https://cdn.elifesciences.org/articles/65762/elife-65762-fig3-data2-v1.xlsx
Figure 3—figure supplement 1
ISGs are differentially expressed in neutrophils during HSV-1 and HSV-2 infection.
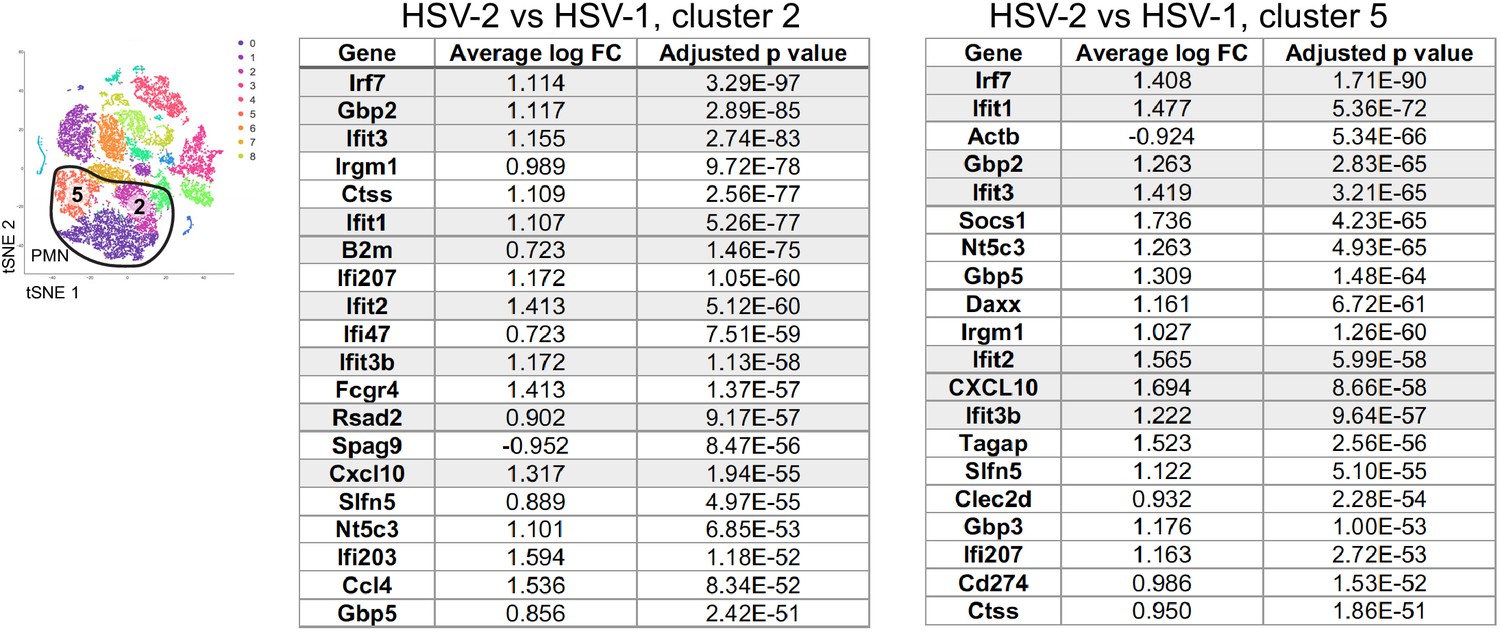
The t-Distributed Stochastic Neighbor Embedding (tSNE) plot shows clusters 5 and 2 within the neutrophil population. Tables show the top 20 differentially expressed genes in cluster 2 (left) and cluster 5 (right) at 5 d.p.i. between HSV-2 and HSV-1 infection. Interferon-stimulated genes (ISGs) listed in the Hallmark IFNα Response gene set are highlighted in gray. Complete lists of differentially expressed genes are provided in Figure 3—source data 2.
Figure 3—figure supplement 2
Validation of ISG expression in the vagina.
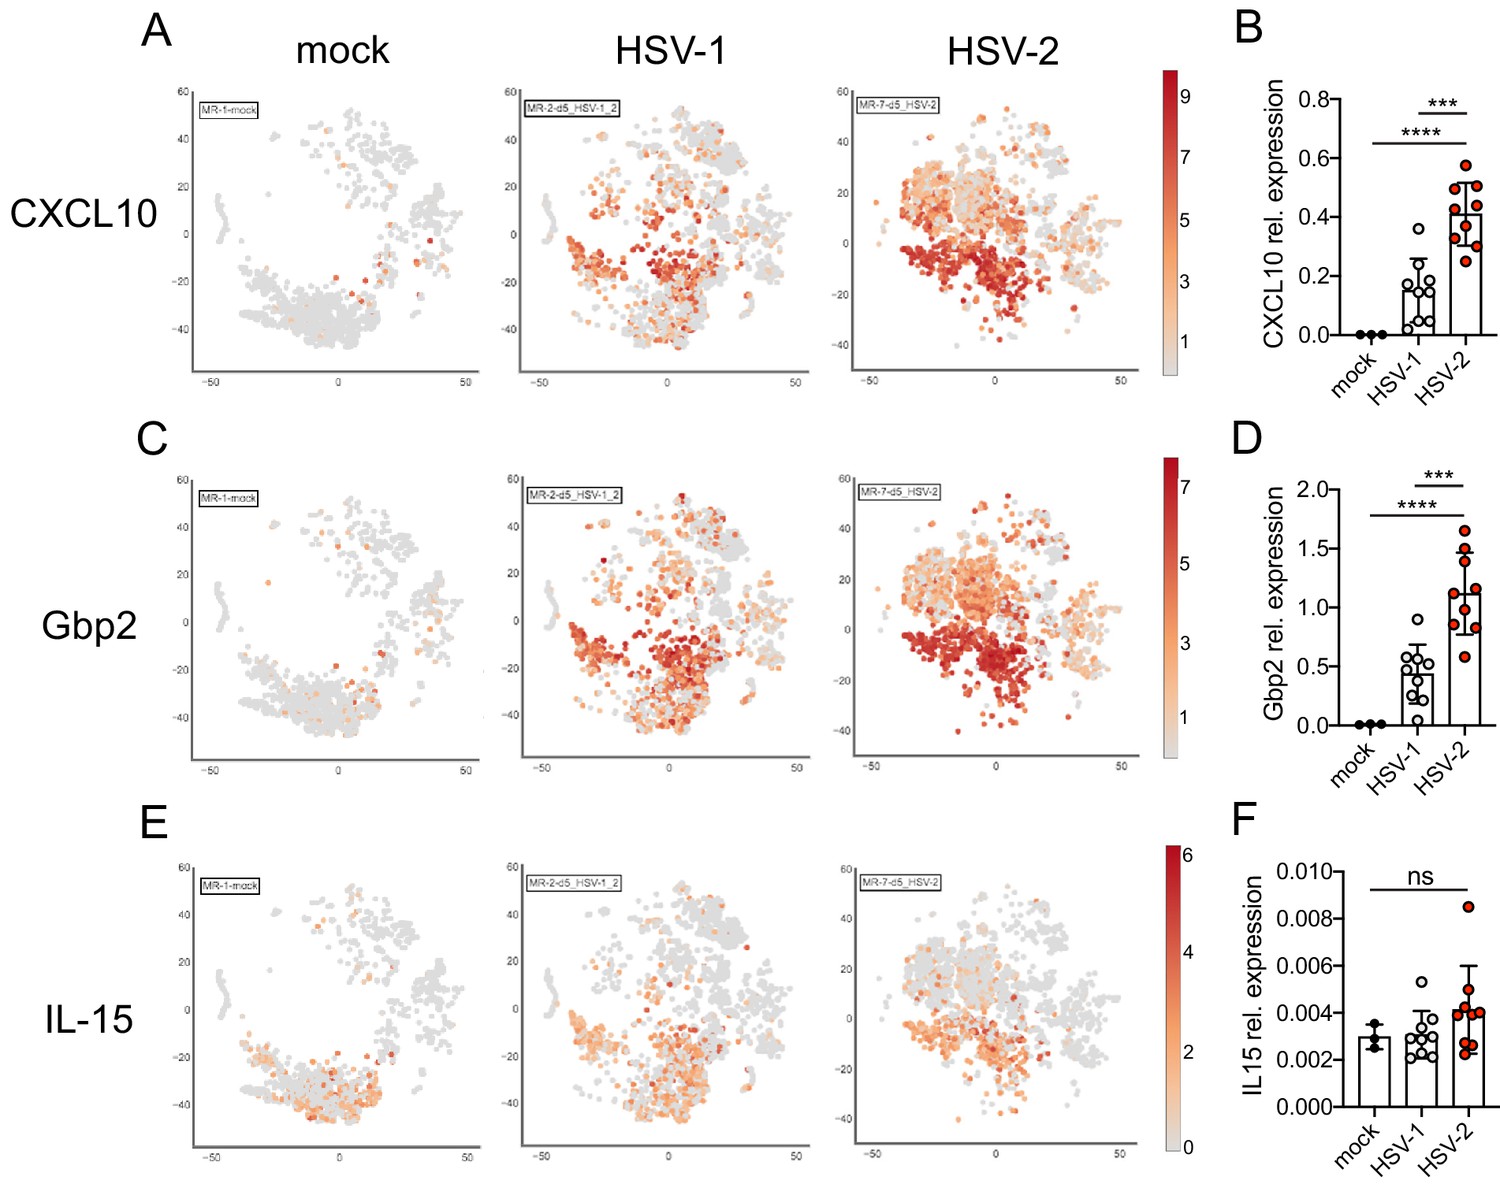
Expression of CXCL10 (A, B), Gbp2 (C, D), or IL-15 (E, F) in the vagina of mock-inoculated mice or mice at 5 d.p.i. with HSV-1 or HSV-2. tSNE visualization of select ISG transcripts in live vaginal cells profiled by scRNA-seq (A, C, E). Expression of the same ISGs relative to Rpl13 was measured by quantitative RT-PCR (qRT-PCR) in whole vaginal tissue harvested from mock-inoculated mice (n = 3) or mice at 5 d.p.i. with HSV-1 (n = 9) or HSV-2 (n = 9) (B, D, F). Bars in B, D, and F show mean and SD. Data are pooled from two independent experiments. Statistical significance was measured by one-way ANOVA with Tukey's multiple comparisons test. ***p<0.005, ****p<0.001, ns = not significant. Raw values for each biological replicate and specific p values are provided in Figure 3—source data 2.
Figure 3—figure supplement 3

Type I IFN is produced early in the vagina and resolves by 1 week after acute HSV-1 or HSV-2 infection.
C57BL/6J mice were infected as described in Figure 2. Type I IFN was measured by ELISA in vaginal washes collected from uninfected mice (n = 8), or mice infected with HSV-1 (n = 7–9) or HSV-2 (n = 9) at 2 (A) and 7 d.p.i. (B). (C) IFNβ was measured by ELISA from vaginal tissue homogenates collected at 7 d.p.i. Bars show mean with SD. All data are pooled from two independent experiments. Statistical significance was measured by one-way ANOVA with Tukey's multiple comparisons test. *p<0.05, ***p<0.005. Raw values for each biological replicate and specific p values are provided in Figure 3—source data 2.
Figure 4 with 1 supplement
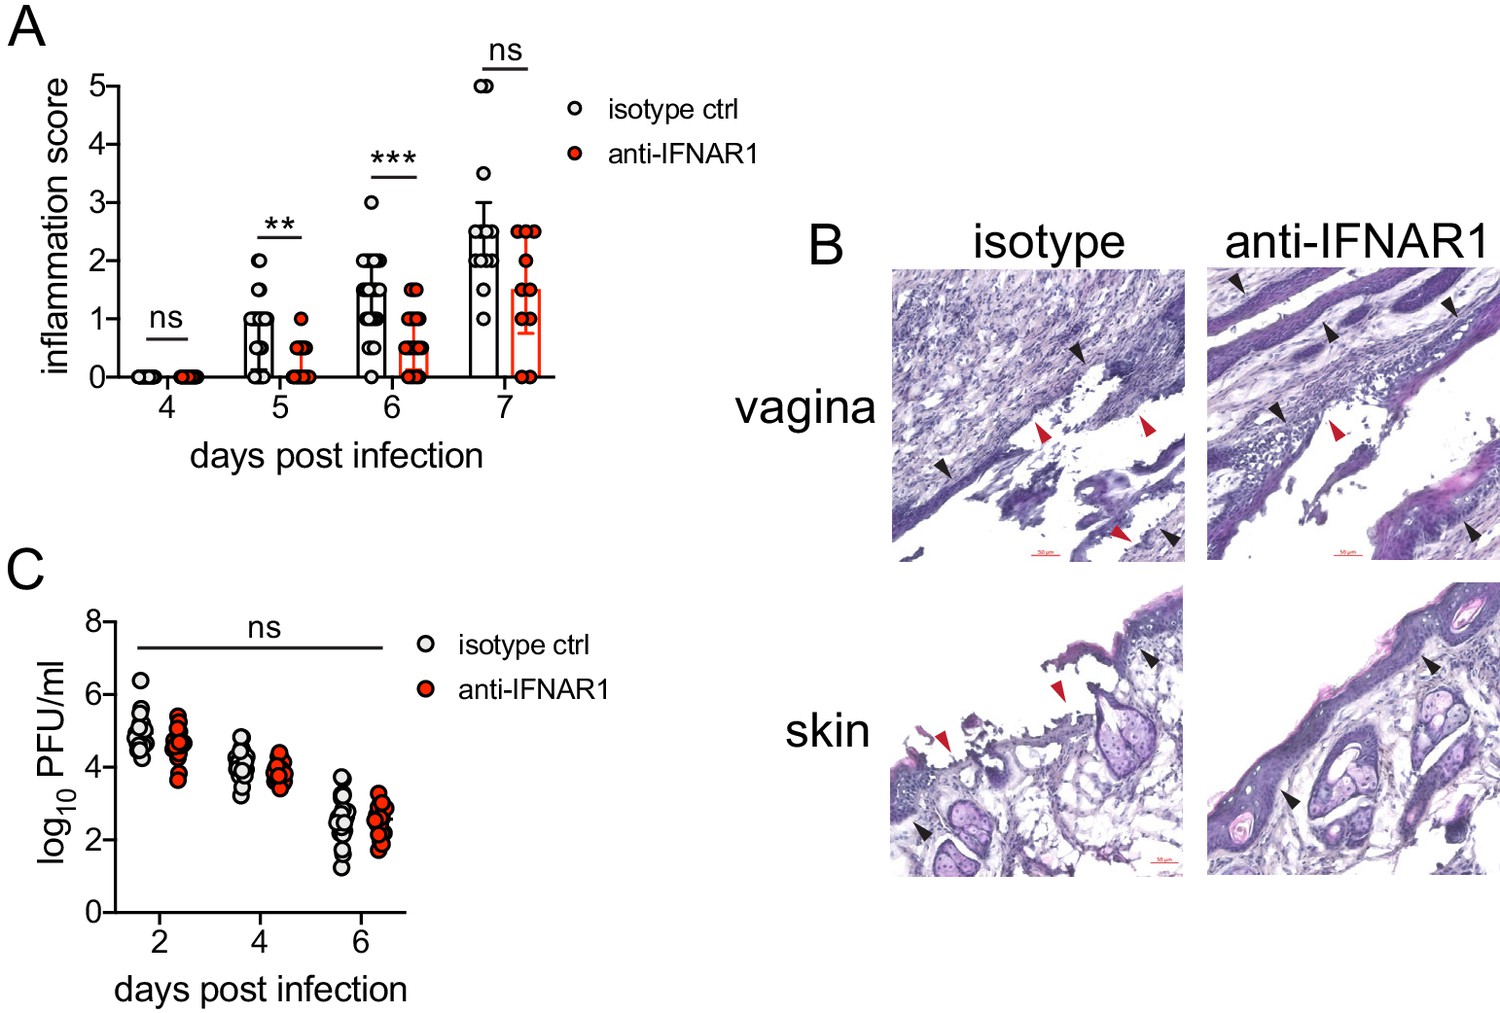
Inhibition of type I IFN signaling during the resolution phase of infection reduces inflammation after HSV-2 infection.
Mice were infected as described in Figure 2. At 4 d.p.i., mice were injected i.p. with either 1 mg of anti-IFNAR1 antibody (n = 10–13) or isotype control (n = 7–9) and monitored for disease progression. Mice showing overt signs of genital inflammation at the time of antibody injection (4 d.p.i.) were excluded from the study. (A) Inflammation scores of antibody-treated mice over the first 7 d.p.i. (B) Histology of the vagina (top) or genital skin (bottom) at 6 d.p.i. Red arrows point to areas of epithelial denuding or damage. Black areas denote the basement membrane. (C) Infectious virus as measured by plaque assay in vaginal washes collected on the indicated days. Data are pooled from (A, C) or representative of three independent experiments. Bars in A show median with interquartile range; bars in C show mean. Scale bars show 50 mm. Statistical significance was measured by repeated measures two-way ANOVA with Geisser-Greenhouse correction and Bonferroni's multiple comparisons test (A) or two-way ANOVA with Bonferroni's multiple comparisons test (C). *p<0.05, **p<0.01, ***p<0.005, ns = not significant. Raw values for each biological replicate, epsilon values, and specific p values are provided in Figure 4—source data 1.
-
Figure 4—source data 1
Excel file with indiviual inflammation scores, viral titers, description of statistical tests, epsilon values and actual p values for Figure 4.
- https://cdn.elifesciences.org/articles/65762/elife-65762-fig4-data1-v1.xlsx
Figure 4—figure supplement 1
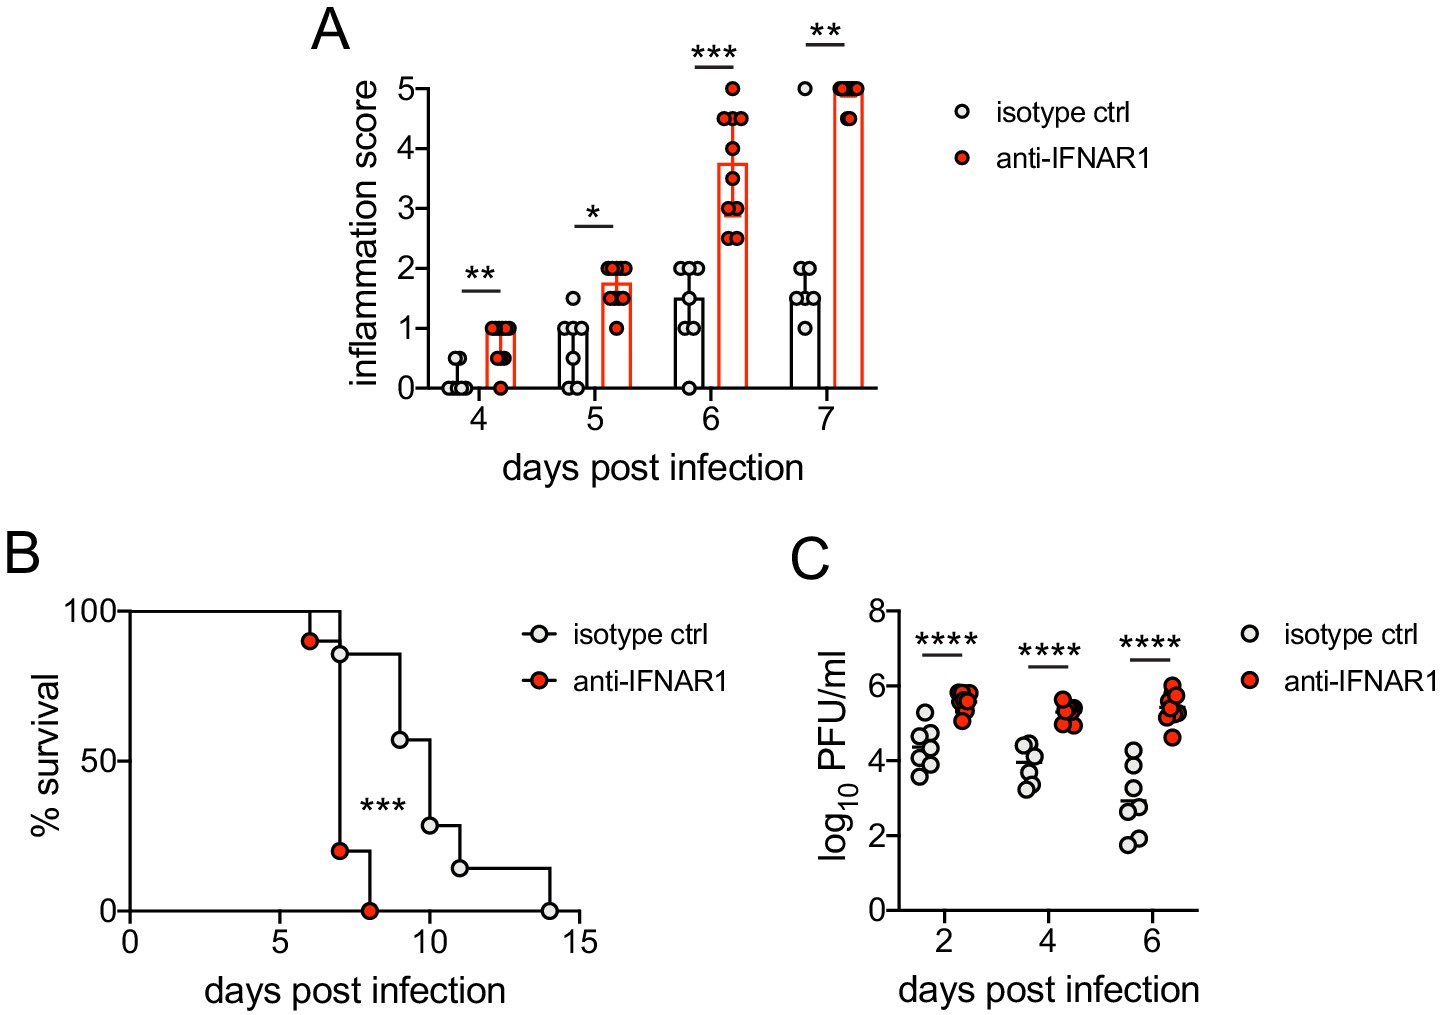
Early blockade of IFNAR1 leads to accelerated disease and loss of viral contol after HSV-2 infection.
C57BL/6J mice were infected as described in Figure 1. On the day of inoculation, mice were injected i.p. with 1mg anti-IFNAR1 antibody (n=10) or an isotype control (n=7). (A) Inflammation scores of anti-IFNAR antibody or isotype control treated mice for the first 7 d.p.i. (B) Survival of mice over the course of two weeks. (C) Infectious virus as measured by plaque assay in vaginal washes collected at the indicated d.p.i. Bars in A show median and interquartile range, bars in C show mean. Data are pooled from 3 independent experiments. Statistical significance was measured by repeated measured two-way ANOVA with Geisser-Greenhouse correction and Bonferroni's multiple comparisons test (A), log-rank test (B) and mixed-effects analysis with Bonferroni's multiple comparisons test (C). *p<0.05, **p<0.01, ***p<0.005, ****p<0.001. Raw values for each biological replicate, epsilon values and specific p values are provided in Figure 4—figure supplement 1—source data 1.
-
Figure 4—figure supplement 1—source data 1
Excel file with individual inflammation scores, raw survival data, viral titers, description of statistical tests, epsilon values and actual p values for Figure 4—figure supplement 1.
- https://cdn.elifesciences.org/articles/65762/elife-65762-fig4-figsupp1-data1-v1.xlsx
Figure 5

Type I IFN signaling in neutrophils promotes genital inflammation after HSV-2 infection.
(A) IFNAR1 expression on neutrophils and non-neutrophil hematopoietic cells from the bone marrow of naive Ifnar1fl/fl x S100a8-Cre (IFNAR1 CKO) or Cre- littermate controls. Plot is gated on live CD45 + cells. CD11b + Ly6G + cells are neutrophils, Ly6G- cells are non-neutrophils. Gray histogram shows isotype staining, black open histogram is Cre- control, and red open histogram is IFNAR1 CKO. (B) Neutrophils were counted by flow cytometry in vaginal washes collected at the indicated days from IFNAR1 CKO (n = 4) or Cre- controls (n = 7) that were infected with HSV-2 as described in Figure 1. (C) Inflammation scores for the first 7 d.p.i. of IFNAR1 CKO (n = 10–13) or Cre- controls (n = 8–11). (D) Histology of the vagina and genital skin at 6 d.p.i. Red arrows point to areas of epithelial denuding or damage, black arrows denote basement membrane (E) Infectious virus as measured by plaque assay from vaginal washes collected on the indicated days from IFNAR1 CKO (n = 5–8) or Cre- controls (n = 7–10). Data in C and E are pooled from three independent experiments; data in B are pooled from two independent experiments; and data in D are representative of two independent experiments. Bars in C show median with interquartile range, bars in B and E show mean. Scale bars show 50 mm. Statistical significance was measured by mixed-effects analysis with (C) or without (B, E) Geisser-Greenhouse correction and Bonferroni's multiple comparisons test. *p<0.05, **p<0.01, ns = not significant. Raw values for each biological replicate, epsilon values and specific p values are provided in Figure 5—source data 1.
-
Figure 5—source data 1
Excel file with individual cell numbers, inflammation scores, viral titers, description of statistical tests, epsilon values and actual p values for Figure 5.
- https://cdn.elifesciences.org/articles/65762/elife-65762-fig5-data1-v1.xlsx
Figure 6 with 1 supplement

Sustained type I IFN signaling and neutrophils regulate pathogenic IL-18 levels in the vagina.
C57BL/6 mice were treated with anti-Ly6G (n = 11) or isotype control (n = 12) as described in Figure 1 (A), therapeutically treated with anti-IFNAR1 (n = 12) or isotype control (n = 14) as described in Figure 5 (B) and infected with HSV-2, or IFNAR1 CKO (n = 7) and Cre- controls (n = 7) were infected with HSV-2 as described in Figure 5 (C). (A-C) Vaginal IL-18 levels were measured by ELISA in washes collected at 5 d.p.i. 100 μg of anti-IL-18 neutralizing antibody (n = 18) or isotype control (n = 16) was administered ivag at 3, 4, and 5 d.p.i. (D) Inflammation scores of antibody-treated mice over the first 7 d.p.i. (E) Infectious virus as measured by plaque assay in vaginal washes collected on the indicated days (n = 9–14). (F) Immunofluorescent staining of vaginal tissues collected at 6 d.p.i. or from mock-inoculated mice. Green shows S100A8 (neutrophil), red shows IL-18 or isotype, blue is DAPI. Top row shows HSV-2-infected tissue probed with isotype control, and bottom two rows show representative images of tissues probed with anti-IL-18 antibody (middle = mock-infected, bottom = HSV-2-infected). White arrows point to IL-18 + neutrophils. Yellow square demarcates area shown in the inset. Data in A-C, D, and E are pooled from four independent experiments for each experimental setup. Data in F is representative of two independent experiments. Bars in A-C show mean and SD, bars in D show median with interquartile range, and bars in E show mean. Scale bars show 50 mm. Statistical significance was measured by unpaired t-test (A–C), repeated measures two-way ANOVA with (D) Geisser-Greenhouse correction and Bonferroni's multiple comparisons test, or mixed-effects analysis with Bonferroni's multiple comparisons test (D). *p<0.05, ***p<0.005, ns = not significant. Raw values for each biological replicate, epsilon values, and specific p values are provided in Figure 6—source data 1.
-
Figure 6—source data 1
Excel file with individual ELISA measurements, inflammation scores, viral titers, description of statistical tests, epsilon values and actual p values for Figure 6.
- https://cdn.elifesciences.org/articles/65762/elife-65762-fig6-data1-v1.xlsx
Figure 6—figure supplement 1
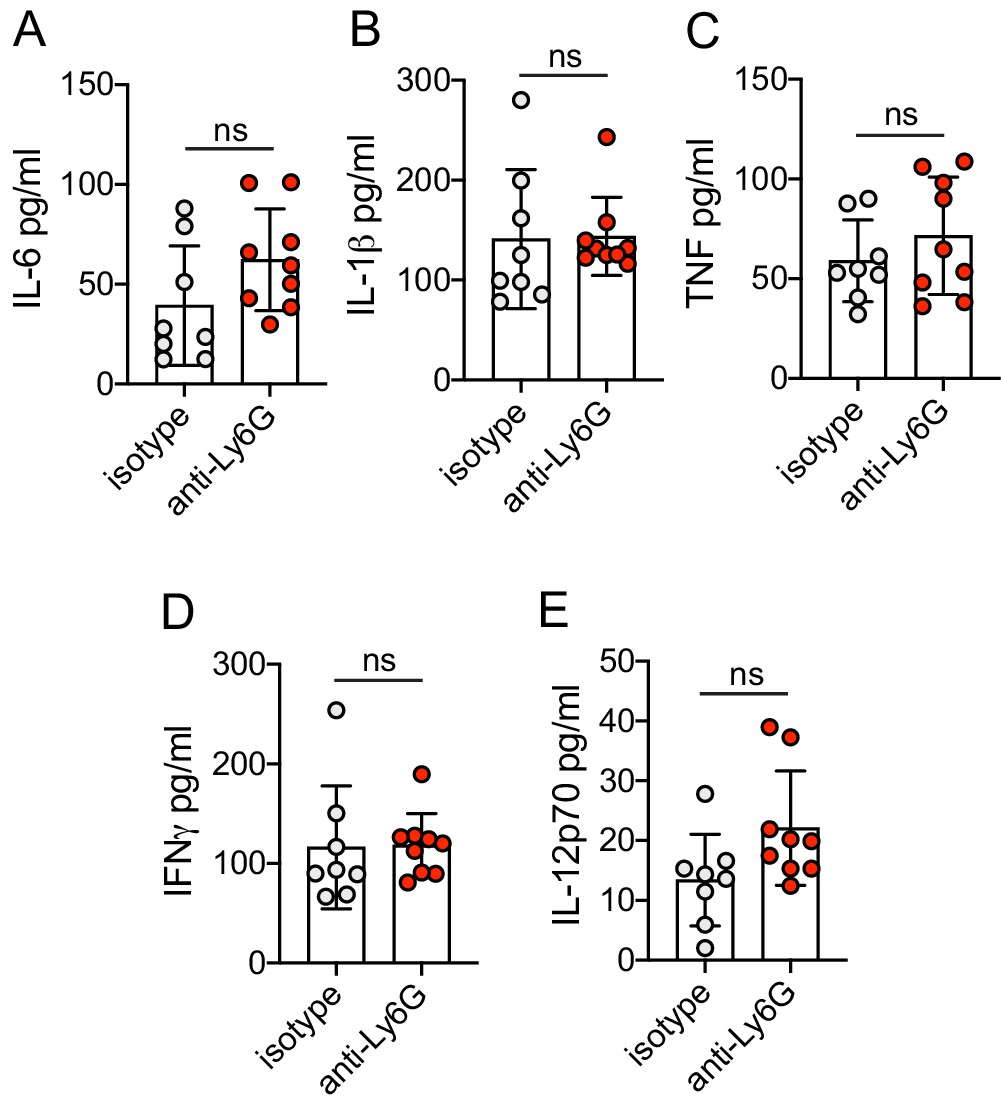
Neutrophils do not control production of common pro-inflammatory and antiviral cytokines during HSV-2 infection.
Vaginal washes were collected at 5 d.p.i. from mice that were infected and treated as described in Figure 1. IL-6 (A), IL-1b (B), TNF (C), IFNg (D) and IL-12p70 (E) were measured by multiplexed Bioplex assay. Isotype controls: n=8, anti-Ly6G: n=9. All data are pooled from 2 independent experiments. Statistical analysis was performed by unpaired t-test. ns = not significant. Raw values for each biological replicate and specific p values are provided in Figure 6—figure supplement 1—source data 1.
-
Figure 6—figure supplement 1—source data 1
Excel file with individual Bioplex assay values, description of statistical tests and actual p values for Figure 6—figure supplement 1.
- https://cdn.elifesciences.org/articles/65762/elife-65762-fig6-figsupp1-data1-v1.xlsx
Author response image 1
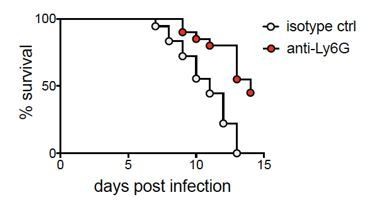
Mice depleted of neutrophils have a higher survival rate compared to controls.
Survival was monitored over 14 days after infection in isotype control or anti-Ly6G mAb-treated mice. Curves are significantly different by log-rank test (p<0.0001).
Tables
Appendix 1—key resources table
| Reagent type (species) or resource | Designation | Source or reference | Identifiers | Additional information |
|---|---|---|---|---|
| strain, strain background (Herpes Simplex Virus) | HSV-2 186 syn+ | PMID:6296440 | ||
| strain, strain background (Herpes Simplex Virus) | HSV-1 McKrae | PMID:14223669 | ||
| strain, strain background (Mus musculus) | C57BL/6J | Jackson Laboratory | Cat#000664; RRID:IMSR_JAX:000664 | |
| strain, strain background (Mus musculus) | Ncf2 KO | PMID:28471497 (Provided by M.C. Dinauer) | N/A | |
| strain, strain background (Mus musculus) | Stim1fl/fl x Stim2fl/flx S100a8-Cre | PMID:28724541 (Provided by G.A. Clemens) | N/A | |
| strain, strain background (Mus musculus) | Padi4fl/fl | Jackson Laboratory | B6(Cg)-Padi4tm1.2Kmow/J, RRID:IMSR_JAX:026708 | |
| strain, strain background (Mus musculus) | Ifnar1fl/fl | PMID:27327515, PMID:16868248 | MGI:2655303 (Provided by H.W. Virgin) | |
| strain, strain background (Mus musculus) | S100a8-Cre | Jackson Laboratory | B6.Cg-Tg(S100A8-cre,-EGFP)1Ilw/J, RRID:IMSR_JAX:021614 | |
| strain, strain background (Mus musculus) | Ifnar1fl/fl x S100a8-Cre | This paper | MGI:2655303 (Provided by H.W. Virgin) and B6.Cg-Tg(S100A8-cre,-EGFP)1Ilw/J, RRID:IMSR_JAX:021614 | We crossed Ifnar1fl/fl mice obtained from H.W. Virgin with commercially available S100a8-Cre mice. |
| strain, strain background (Mus musculus) | Padi4fl/fl x S100a8-Cre | This paper | B6(Cg)-Padi4tm1.2Kmow/J, RRID:IMSR_JAX:026708 and B6.Cg-Tg(S100A8-cre,-EGFP)1Ilw/J, RRID:IMSR_JAX:021614 | We crossed commercially available Padi4fl/fl mice with S100a8-Cre mice. |
| cell line (Cercopithecus aethiops) | Vero Cells (CCL81) | ATCC | (CCL-81; RRID:CVCL_0059) | |
| biological sample (Mus musculus) | Primary mouse bone marrow neutrophils | C57BL/6J (Jackson Laboratory) | N/A | Freshly isolated using a histopaque gradient. |
| antibody | anti-mouse Ly6G (1A8) (Rat monoclonal) | Leinco Technologies | Cat# L280, RRID:AB_2737551 | 500 µg/ mouse by intraperitoneal injection |
| antibody | anti-mouse IFNAR1 (MAR1-5A3) (Mouse monoclonal) | Leinco Technologies | Cat# I-401, RRID:AB_2491621 | 1mg/mouse by intraperitoneal injection |
| antibody | IgG2a (1-1) (Rat monoclonal) | Leinco Technologies | Cat# R1367, RRID:AB_2831721 | 500 µg/ mouse by intraperitoneal injection |
| antibody | IgG1 (HKSP84) (Mouse monoclonal) | Leinco Technologies | Cat# I-117, RRID:AB_2830510 | 1mg/mouse by intraperitoneal injection |
| antibody | BV605 anti-mouse CD3ε (145–2 C11) (Armenian Hamster monoclonal) | Biolegend | Cat# 100351, RRID:AB_2565842 | (1:200) |
| antibody | Pacific Blue anti-mouse CD4 (GK1.5) (Rat monoclonal) | Biolegend | Cat# 100427, RRID:AB_493646 | (1:200) |
| antibody | PE/Dazzle 594 anti-mouse CD4 (GK1.5) (Rat monoclonal) | Biolegend | Cat# 100455, RRID:AB_2565844 | (1:500) |
| antibody | APC anti-mouse CD8a (53–6.7) (Rat monoclonal) | Biolegend | Cat# 100712, RRID:AB_312751 | (1:800) |
| antibody | APC anti-mouse/human CD11b (M1/70) (Rat monoclonal) | Biolegend | Cat# 101211, RRID:AB_312794 | (1:2000) |
| antibody | PerCPCy5.5 anti-mouse Gr-1 (RB6-8C5) (Rat monoclonal) | Biolegend | Cat# 108427, RRID:AB_893561 | (1:400) |
| antibody | BV605 anti-mouse Gr-1 (RB6-8C5) (Rat monoclonal) | Biolegend | Cat# 108439, RRID:AB_2562333 | (1:100) |
| antibody | BV605 anti-mouse Ly-6C (HK1.4) (Rat monoclonal) | Biolegend | Cat# 128035, RRID:AB_2562352 | (1:600) |
| antibody | Pacific Blue anti-mouse Ly-6C (HK1.4) (Rat monoclonal) | Biolegend | Cat# 128013, RRID:AB_1732090 | (1:200) |
| antibody | PerCPCy5.5 anti-mouse Ly6G (1A8) (Rat monoclonal) | Biolegend | Cat# 127616, RRID:AB_1877271 | (1:400) |
| antibody | FITC anti-mouse NK1.1 (PK136) (Mouse monoclonal) | Biolegend | Cat# 108706, RRID:AB_313393 | (1:200) |
| antibody | AF700 anti-mouse CD45 (30-F11) (Rat monclonal) | Biolegend | Cat# 103127; RRID:AB_493714 | (1:1000) |
| antibody | PE anti-mouse IFNAR1 (MAR1-5A3) (Mouse monoclonal) | Leinco Technologies | Cat# I-1033-6717-1400, RRID:AB_2830368 | (1:20) |
| antibody | PE IgG1 (HKSP) (Mouse monoclonal) | Leinco Technologies | Cat# I-104-475-1800, RRID:AB_2830371 | (1:20) |
| antibody | anti-mouse CD16/32 (Fc block) (Rat monoclonal) | Biolegend | Cat# 101320, RRID:AB_1574975 | (1:100) |
| antibody | Live/Dead Fixable Aqua Dead Cell Stain kit | Molecular Probes | Cat# L34957 | (1:500) |
| antibody | anti-HSV primary antibody (Rabbit polyclonal) | Dako | Cat# B0116, RRID:AB_2335703 | (1:1500) |
| antibody | anti-mouse S100A8 (63N13G5) (Rat monoclonal) | Novus Biologicals | Cat# NBP2-27067 | (1:200) |
| antibody | anti-mouse biotinylated IL-18 (93–10C) (Rat monoclonal) | MBL International | Cat# D048-6, RRID:AB_592012 | (1:200) |
| antibody | biotinylated IgG1 Isotype Control (eBRG1) (Rat monoclonal) | Thermo Fisher Scientific | Cat# 13-4301-81, RRID:AB_470080 | (1:200) |
| antibody | anti-Histone H3 (citrulline R2) IgG (Rabbit polyclonal) | Abcam | Cat# ab80075, RRID:AB_1603562 | (1:200) |
| antibody | Anti-Rabbit IgG H and L (Alexa Fluor 488) (Goat Polyclonal) | Life Technologies | Cat# ab150077, RRID:AB_2630356 | (1:1000) |
| antibody | anti-Rat IgG H and L (Alexa Fluor 568) (Goat Polyclonal) | Life Technologies | Cat# A-11077, RRID:AB_2534121 | (1:1000) |
| antibody | anti-rat IgG-H and L (Alexa Fluor 488) (Donkey polyclonal) | Life Technologies | Cat# A-21208, RRID:AB_2535794 | (1:1000) |
| antibody | anti-rabbit IgG-HRP antibody (Donkey polyclonal) | Jackson Immunoresearch | Cat# 711-005-152, RRID:AB_2340585 | (1:1000) |
| antibody | Human Serum IgG- Fractionated Purified 1G | Innovative Research | Cat# 50643486 | 10 µg/mL |
| antibody | IgG2a Isotype control (2A3) (Rat monoclonal) | BioXCell | Cat# BE0089, RRID:AB_1107769 | 100 µg/ mouse by intravaginal administration |
| antibody | anti-mouse IL-18 (YIGIF74-1G7) (Rat monoclonal) | BioXCell | Cat# BE0237, RRID:AB_2687719 | 100 µg/ mouse by intravaginal administration |
| sequence-based reagent | Ifnb1_F | PMID:30559377, IDT | PCR Primers | 5'-AACCTCACCTACAGGGCGGACTTCA-3' |
| sequence-based reagent | Ifnb1_R | PMID:30559377, IDT | PCR Primers | 5'-TCCCACGTCAATCTTTCCTCTTGCTTT-3' |
| sequence-based reagent | Il15_F | IDT | PCR Primers | 5'-AGACTTGCAGTGCATCTCCTTA-3' |
| sequence-based reagent | Il15_R | IDT | PCR Primers | 5'-CTTTCCTGACCTCTCTGAGCTGTT-3' |
| sequence-based reagent | Cxcl10_F | IDT | PCR Primers | 5'-GATGACGGGCCAGTGAGAAT-3' |
| sequence-based reagent | Cxcl10_R | IDT | PCR Primers | 5'-TCGTGGCAATGATCTCAACA-3' |
| sequence-based reagent | Gbp2_F | PMID:26216123, IDT | PCR Primers | 5'-ACCTGGAACATTCCCTGACC-3' |
| sequence-based reagent | Gbp2_R | PMID:26216123, IDT | PCR Primers | 5'-ACAGCTCCTCCTCCCGCAGAG-3' |
| sequence-based reagent | Rpl13_F | IDT | PCR Primers | 5'-GCGGATGAATACCAACCCCT-3' |
| sequence-based reagent | Rpl13_R | IDT | PCR Primers | 5'-ACCACCATCCGCTTTTTCTTG-3' |
| commercial assay or kit | Bio-Plex Pro Mouse Cytokine 23-Plex Immunoassay | Bio-Rad | Cat# M60009RDPD, RRID:AB_2857368 | |
| commercial assay or kit | DCFDA/H2 DCFDA - Cellular ROS Assay Kit | Abcam | Cat# ab113851 | |
| commercial assay or kit | Fast DAB tablet set | Sigma-Aldrich | Cat# D4293-5SET | |
| commercial assay or kit | AlexaFluor 647 Tyramide Signal Amplification kit | Invitrogen | Cat# T20951 | |
| commercial assay or kit | LEGEND MAX Mouse IFNb ELISA kit | Biolegend | Cat# 439407 | |
| commercial assay or kit | Mouse IL-18 ELISA Kit | MBL International Corporation | Cat# 7625 | |
| commercial assay or kit | RNeasy Mini kit | Qiagen | Cat# 74106 | |
| commercial assay or kit | iTaq Universal SYBR one-step kit | Biorad | Cat# 172–5151 | |
| commercial assay or kit | 10 × 3' v3 Single Cell Library | 10x Genomics | ||
| chemical compound, drug | Paraformaldehyde | Fisher Scientific | Cat# 04042–500 | |
| chemical compound, drug | Sodium Azide | Sigma-Aldrich | Cat# S2002-25G | |
| chemical compound, drug | Calcium Chloride Dihydrate (CaCl₂·2H₂O) | AMRESCO, Inc. | Cat# 0556–500G | |
| chemical compound, drug | Magnesium Chloride Hexahydrate (MgCl2 · 6H2O) | Sigma-Aldrich | Cat# M9272-500G | |
| chemical compound, drug | Sodium (meta)periodate (NaIO4) | Sigma-Aldrich | Cat# S1878-25G | |
| chemical compound, drug | Triton X-100 | Sigma-Aldrich | Cat# T8787-100ML | |
| chemical compound, drug | L-Lysine (Hydrochloride) | MP Biomedicals | Cat# 194697 | |
| chemical compound, drug | Sodium Phosphate monobasic monohydrate (NaH2PO4 · H2O) | Sigma-Aldrich | Cat# S9638-500G | |
| chemical compound, drug | Sodium Phosphate Dibasic (Na2HPO4) | Sigma-Aldrich | Cat# 795410–500G | |
| chemical compound, drug | D-(+)-Glucose | Sigma-Aldrich | Cat# G5767-500G | |
| chemical compound, drug | Sucrose | Sigma-Aldrich | Cat# S5016-500G | |
| chemical compound, drug | Depot Medroxyprogestrone (DMPA, Depo-Provera) | Pfizer | Cat# 421035 | 2mg/mouse by subcutaneous injection. |
| chemical compound, drug | Dispase II | Roche | Cat# 4942078001 | |
| chemical compound, drug | Collagenase D | Roche | Cat# 11088866001 | |
| chemical compound, drug | DNase I | Roche | Cat# 10104159001 | |
| chemical compound, drug | Fetal Bovine Serum (FBS) | Corning | lot reserve# 35010125 | |
| chemical compound, drug | Dulbecco's Modified Eagle Medium (DMEM) | Gibco | Cat# 11965084 | |
| chemical compound, drug | RPMI-1640 Medium | Gibco | Cat# 11875093 | |
| chemical compound, drug | Hanks’ Balanced Salt solution (HBSS) | Gibco | Cat# H6648-500ML | |
| chemical compound, drug | Dulbecco’s Phosphate Buffered Saline (sterile use) | Sigma-Aldrich | Cat# D8537-500L | |
| chemical compound, drug | Dulbecco’s Phosphate Buffered Saline (non-sterile use) | Sigma-Aldrich | Cat# D5652-10L | |
| chemical compound, drug | Penicillin-Streptomycin (10,000 U/mL) | Gibco | Cat# 15140122 | |
| chemical compound, drug | HEPES (1M) | Gibco | Cat# 15630080 | |
| chemical compound, drug | Percoll | GE Healthcare | Cat# GE17-0891-02 | |
| chemical compound, drug | Histopaque 1119 | Sigma-Aldrich | Cat# 11191–100 ML | |
| chemical compound, drug | Histopaque 1077 | Sigma-Aldrich | Cat# 10771–100 ML | |
| chemical compound, drug | bovine serum albumin | Sigma-Aldrich | Cat# A9418-10G | |
| chemical compound, drug | Normal goat serum | Jackson Immunoresearch | Cat# 005-000-121 | |
| chemical compound, drug | Normal donkey serum | Jackson Immunoresearch | Cat# 017-000-001 | |
| chemical compound, drug | NP40 substitute | Sigma-Aldrich | Cat# 492016 | |
| chemical compound, drug | Protease Inhibitor Cocktail | Sigma-Aldrich | Cat# P8340 | |
| software, algorithm | GraphPad Prism8 | GraphPad Software | RRID:SCR_002798 | http://www.graphpad.com/ |
| software, algorithm | FlowJo | FlowJo | RRID:SCR_008520 | https://www.flowjo.com/solutions/flowjo |
| software, algorithm | R | open source | RRID:SCR_001905 | https://www.r-project.org/ |
| software, algorithm | Cell Ranger | 10x Genomics | RRID:SCR_017344 | https://support.10xgenomics.com/single-cell-gene-expression/software/pipelines/latest/what-is-cell-ranger |
| software, algorithm | Seurat package | Satija lab | RRID:SCR_016341 | https://satijalab.org/seurat/get_started.html |
| software, algorithm | ZEN Digital Imaging for Light Microscopy Software | Zeiss | RRID:SCR_013672 | https://www.zeiss.com/microscopy/us/products/microscope-software/zen.html#introduction |
| software, algorithm | Photoshop | Adobe | RRID:SCR_014199 | https://www.adobe.com/products/photoshop.html |
| software, algorithm | Image J | National Institutes of Health | RRID:SCR_003070 | https://imagej.nih.gov/ |
| other | 4′,6-diamidino-2-phenylindole | Life Technologies | Cat# D1306 | |
| other | Hematoxylin | Thermo Scientific | Cat# 6765007 | |
| other | Eosin | Sigma-Aldrich | Cat# 102439 | |
| other | Dry Milk (Instant non fat) | Nestlé Carnation | N/A |
Additional files
Download links
A two-part list of links to download the article, or parts of the article, in various formats.
Downloads (link to download the article as PDF)
Open citations (links to open the citations from this article in various online reference manager services)
Cite this article (links to download the citations from this article in formats compatible with various reference manager tools)
A sustained type I IFN-neutrophil-IL-18 axis drives pathology during mucosal viral infection
eLife 10:e65762.
https://doi.org/10.7554/eLife.65762


