Heterogeneity in transmissibility and shedding SARS-CoV-2 via droplets and aerosols
- Department of Chemical Engineering & Applied Chemistry, University of Toronto, Canada
- Temerty Faculty of Medicine, University of Toronto, Canada
- Department of Critical Care Medicine, Cumming School of Medicine, University of Calgary, Canada
- O'Brien Institute of Public Health, University of Calgary, Canada
- Libraries & Cultural Resources, University of Calgary, Canada
- Department of Viroscience, Erasmus University Medical Center, Netherlands
- Division of Epidemiology, Dalla Lana School of Public Health, University of Toronto, Canada
- Division of Infectious Diseases, Temerty Faculty of Medicine, University of Toronto, Canada
- Institute of Biomedical Engineering, University of Toronto, Canada
Figures
Figure 1
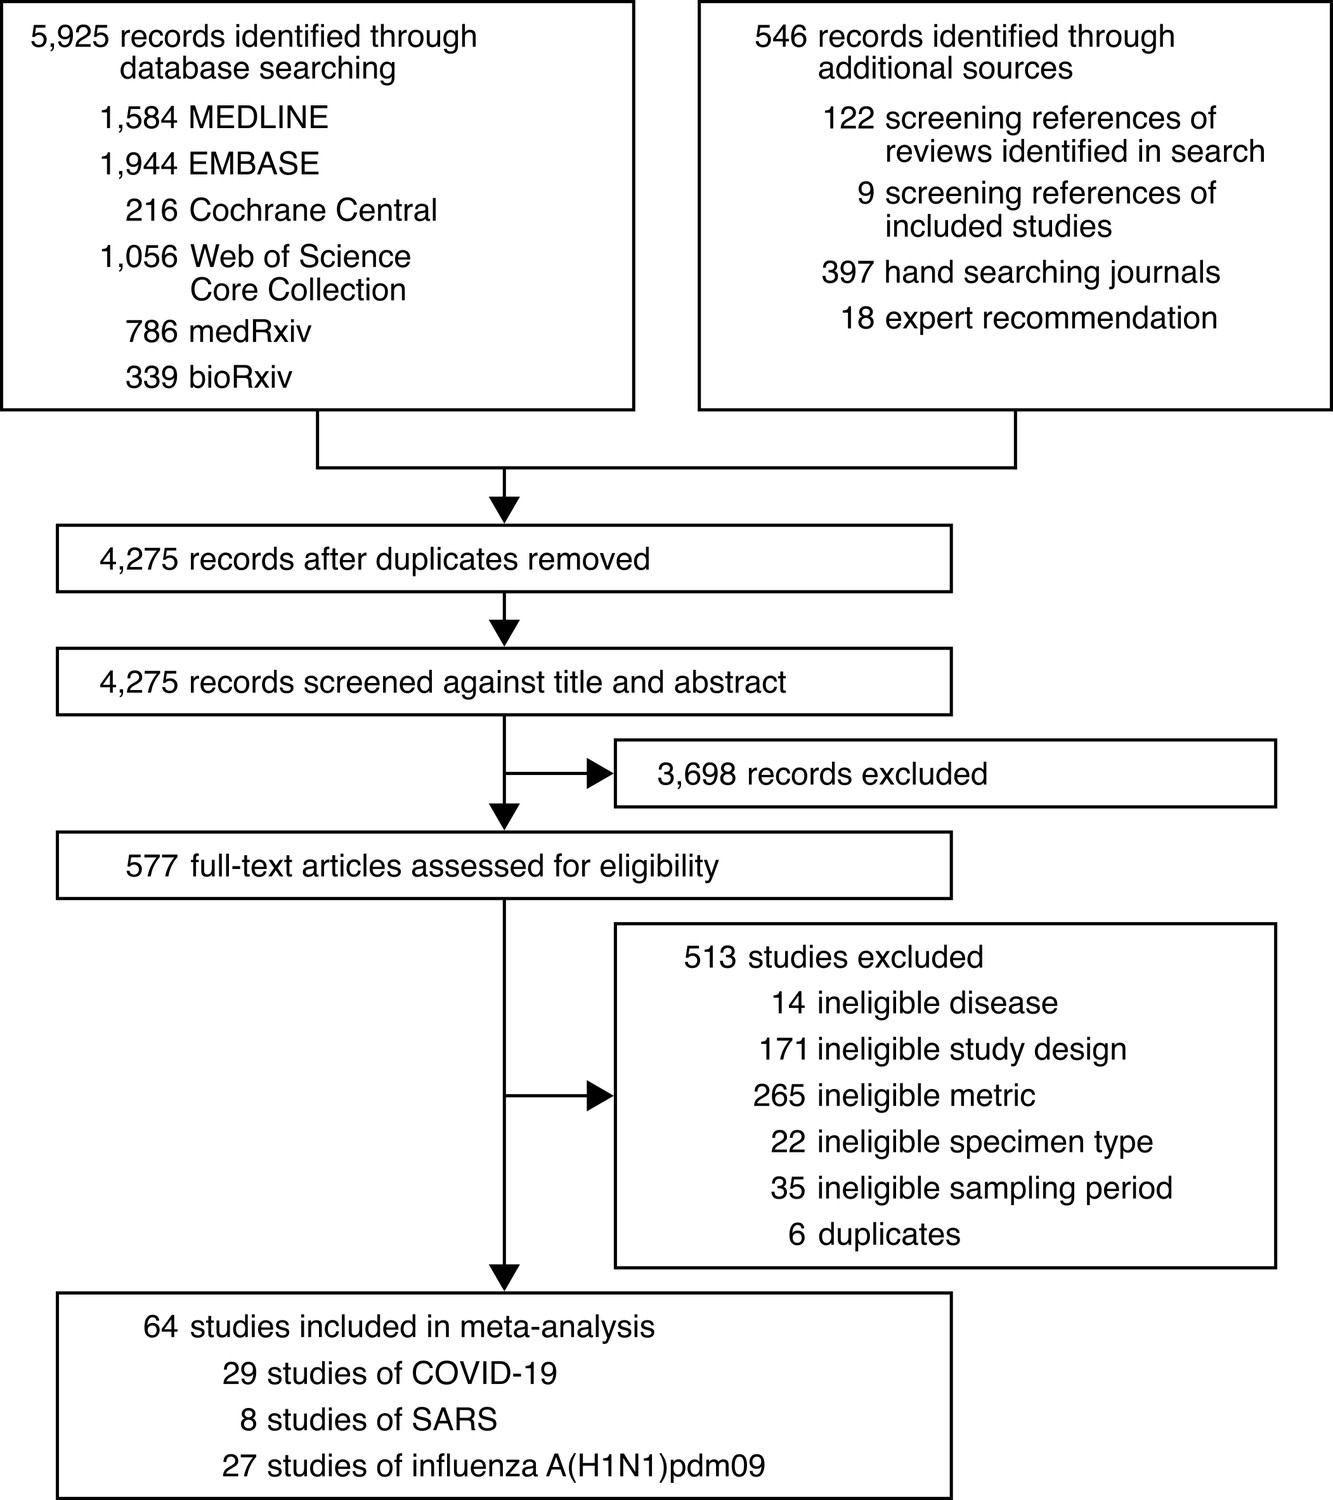
Development of the systematic dataset.
-
Figure 1—source data 1
Search strategy used for MEDLINE.
- https://cdn.elifesciences.org/articles/65774/elife-65774-fig1-data1-v2.docx
-
Figure 1—source data 2
Search strategy used for EMBASE.
- https://cdn.elifesciences.org/articles/65774/elife-65774-fig1-data2-v2.docx
-
Figure 1—source data 3
Search strategy used for Cochrane Central.
- https://cdn.elifesciences.org/articles/65774/elife-65774-fig1-data3-v2.docx
-
Figure 1—source data 4
Search strategy used for Web of Science Core Collection.
- https://cdn.elifesciences.org/articles/65774/elife-65774-fig1-data4-v2.docx
-
Figure 1—source data 5
Search strategy used for medRxiv and bioRxiv.
- https://cdn.elifesciences.org/articles/65774/elife-65774-fig1-data5-v2.docx
Figure 2 with 2 supplements
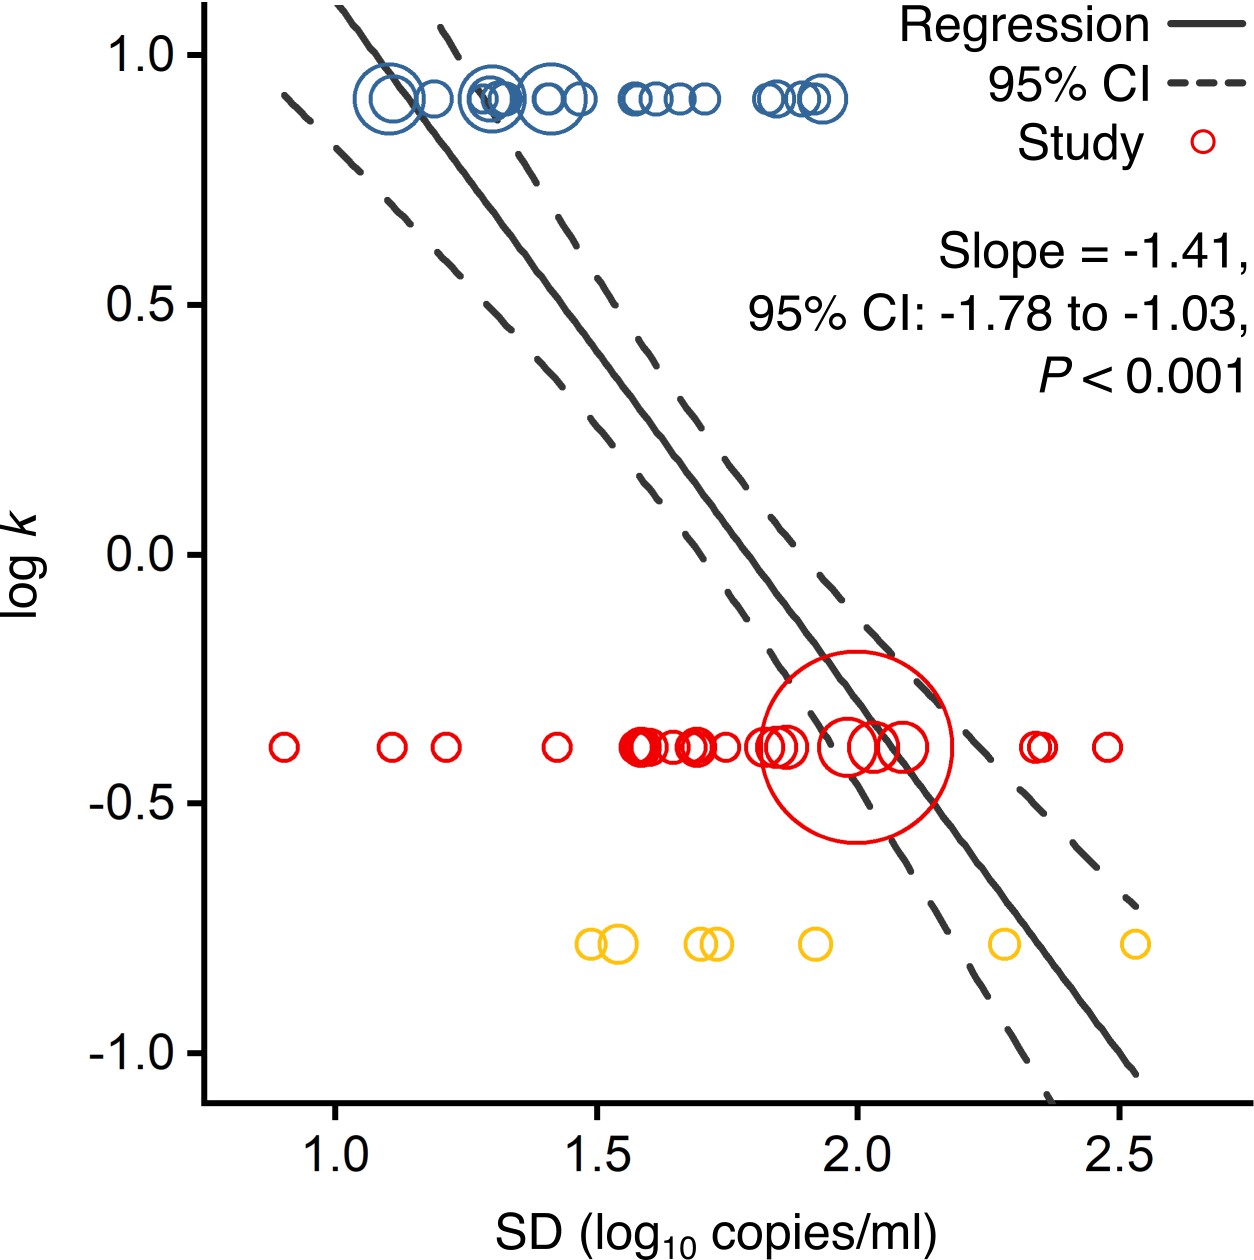
Association of overdispersion in SARS-CoV-2, SARS-CoV-1 and A(H1N1)pdm09 transmissibility with heterogeneity in respiratory viral load (rVL).
Meta-regression of dispersion parameter (k) with the standard deviation (SD) of rVLs from contributing studies with low risk of bias (Pearson’s r = −0.73). Pooled estimates of k were determined from the literature for each infection. Blue, red and yellow circles denote A(H1N1)pdm09 (N = 22), COVID-19 (N = 24) and SARS (N = 7) studies, respectively. Circle sizes denote weighting in the meta-regression. The p-value was obtained using the meta-regression slope t-test.
Figure 2—figure supplement 1
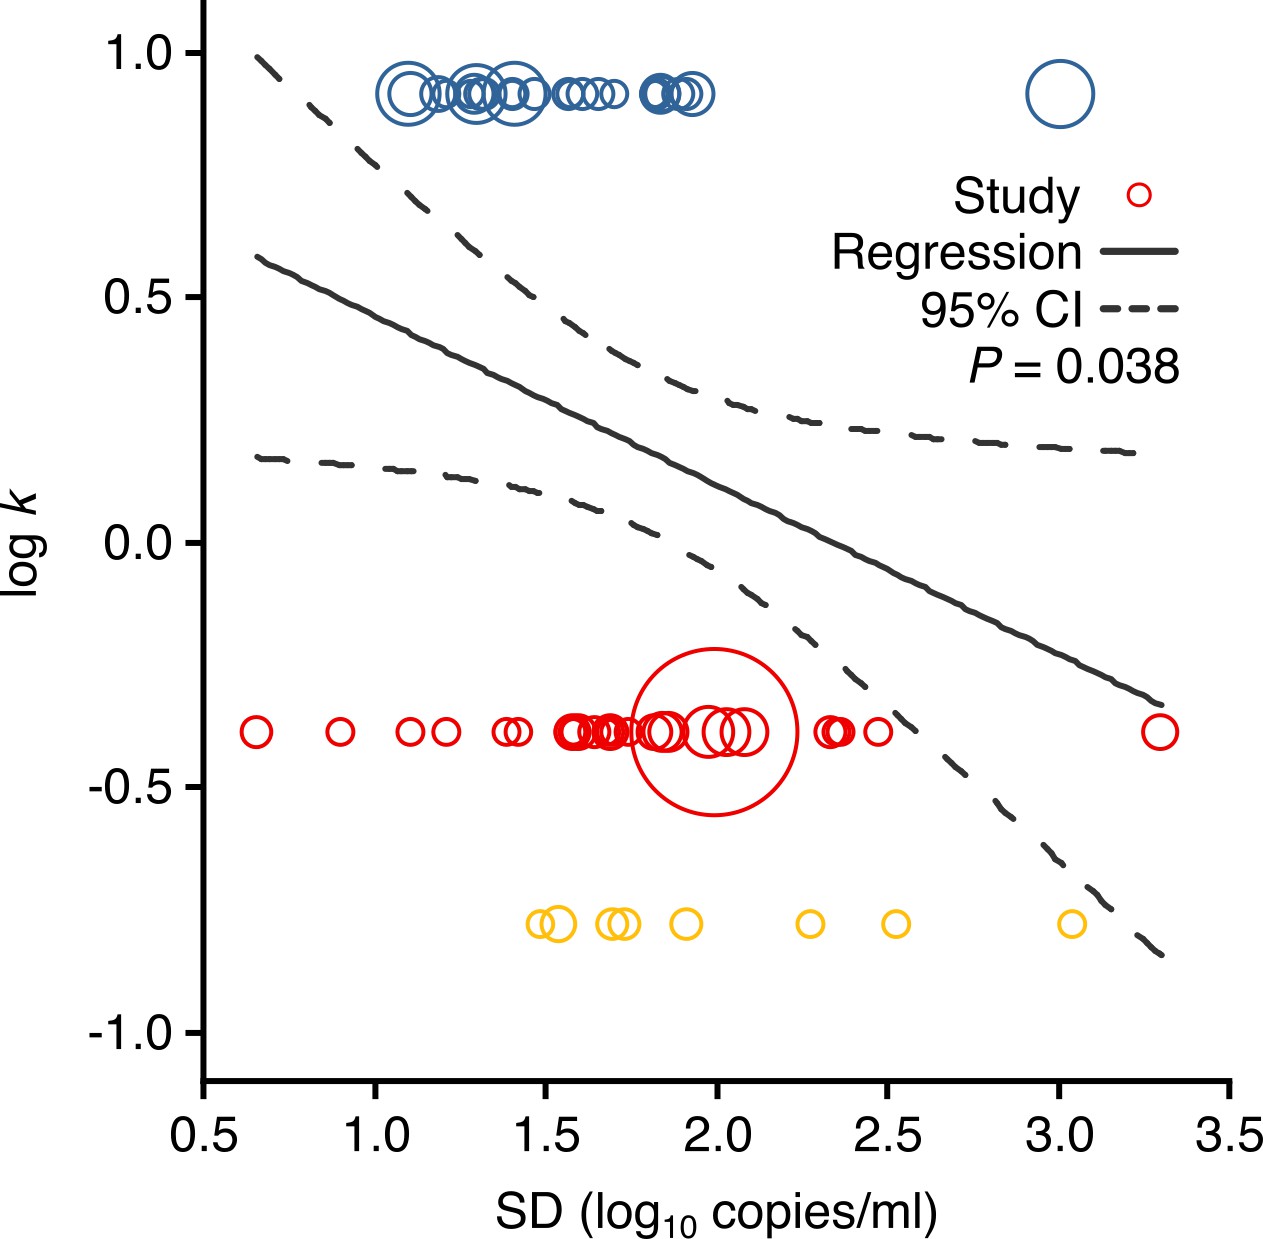
Meta-regression between dispersion in SARS-CoV-2, SARS-CoV-1 and A(H1N1)pdm09 transmissibility and heterogeneity in respiratory viral load (rVL).
Meta-regression of dispersion parameter (k) with the standard deviation (SD) of rVLs from all contributing studies (Pearson’s r = −0.26). Pooled estimates of k were determined from the literature. Blue, red and yellow circles denote A(H1N1)pdm09 (N = 27), COVID-19 (N = 29) and SARS (N = 8) studies, respectively. Circle sizes denote weighting in the meta-regression. The p-value was obtained using the meta-regression slope t-test.
Figure 2—figure supplement 2

Meta-analysis of respiratory viral loads (rVLs) of SARS-CoV-2, SARS-CoV-1 and influenza A(H1N1)pdm09 during the estimated infectious period.
Random-effects meta-analyses comparing the expected rVLs for COVID-19, SARS and A(H1N1)pdm09 cases during the infectious period. Quantitative specimen measurements were used to estimate rVLs, which refer to virus concentrations in the respiratory tract. Case types: hospitalized (H), not admitted (N), community (C), adult (A), pediatric (P), symptomatic (S), presymptomatic (Ps) and asymptomatic (As). Specimen types: endotracheal aspirate (ETA), nasopharyngeal aspirate (NPA), nasopharyngeal swab (NPS), oropharyngeal swab (OPS), posterior oropharyngeal saliva (POS) and sputum (Spu). Dashes denote case numbers that were not obtained. Box sizes denote weighting in the overall estimates. Between-study heterogeneity was assessed using the p-value from Cochran’s Q test and the I2 statistic. One-sided Welch’s t-tests compared the expected SARS-CoV-2 rVL with those of SARS-CoV-1 and A(H1N1)pdm09 (non-significance, p>0.05).
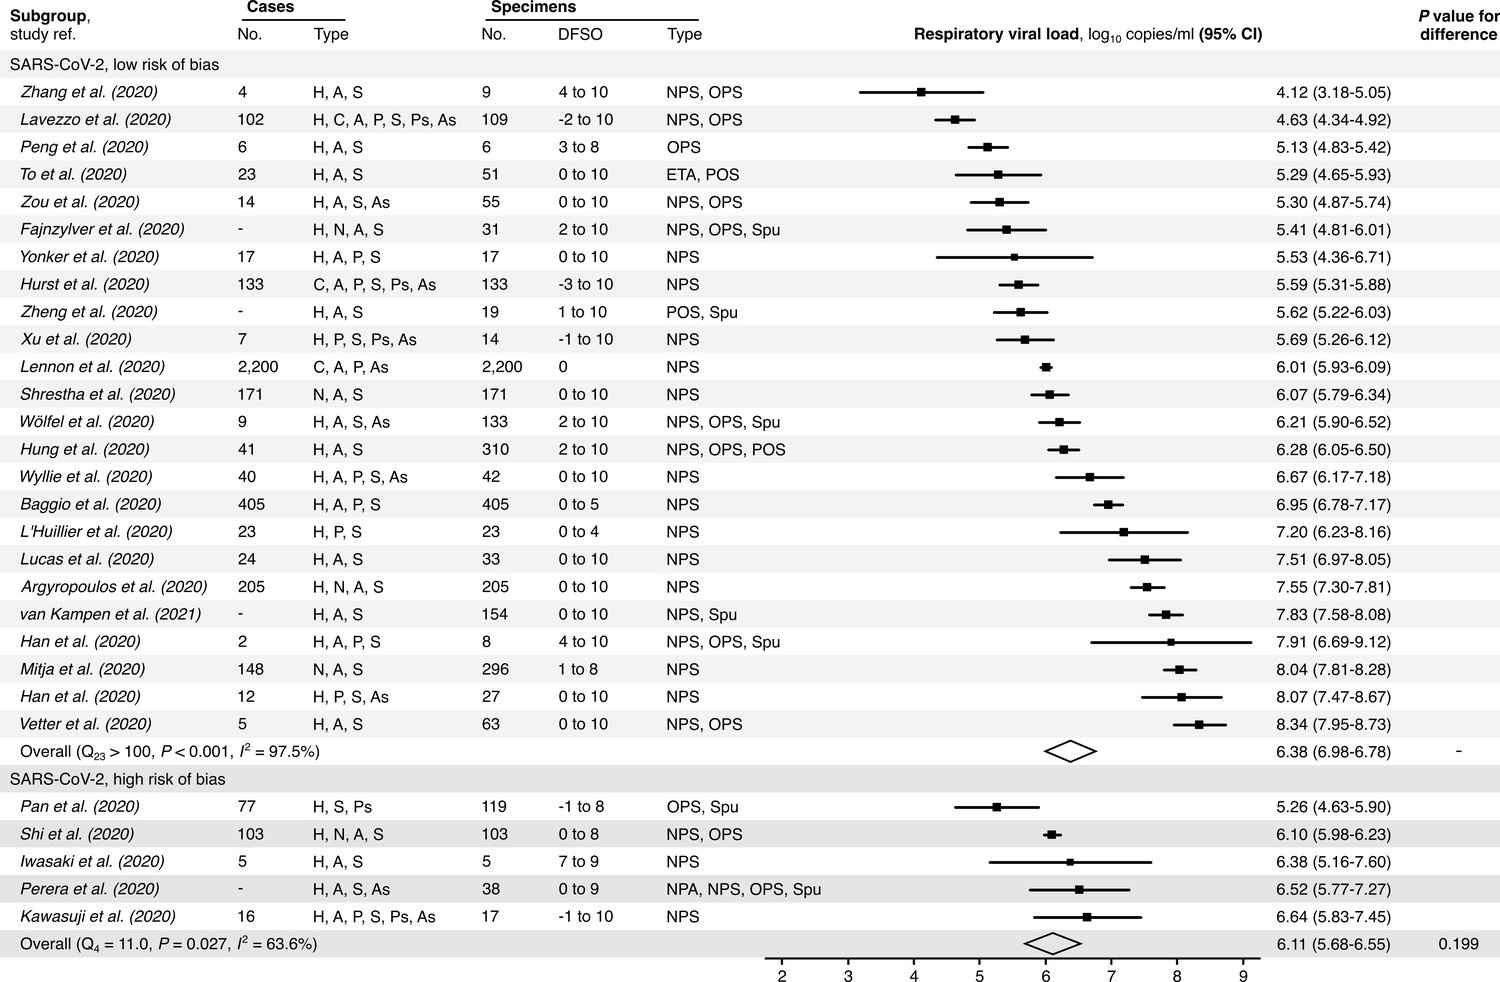
Figure 3 with 5 supplements

Subgroup analyses of SARS-CoV-2 respiratory viral load (rVL) during the infectious period.
Random-effects meta-analyses comparing the expected rVLs of adult (≥18 years old) COVID-19 cases with pediatric (<18 years old) ones (top) and symptomatic/presymptomatic infections with asymptomatic ones (bottom) during the infectious period. Quantitative rVLs refer to virus concentrations in the respiratory tract. Case types: hospitalized (H), not admitted (N), community (C), adult (A), pediatric (P), symptomatic (S), presymptomatic (Ps) and asymptomatic (As). Specimen types: endotracheal aspirate (ETA), nasopharyngeal aspirate (NPA), nasopharyngeal swab (NPS), oropharyngeal swab (OPS), posterior oropharyngeal saliva (POS) and sputum (Spu). Dashes denote case numbers that were not obtained. Box sizes denote weighting in the overall estimates. Between-study heterogeneity was assessed using the p-value from Cochran’s Q test and the I2 statistic. One-sided Welch’s t-tests compared expected rVLs between the COVID-19 subgroups (non-significance, p>0.05).
Figure 3—figure supplement 1
Risk-of-bias sensitivity analysis of between-study heterogeneity for SARS-CoV-2 respiratory viral load (rVL) during the estimated infectious period.
Random-effects meta-analyses, based on the risk of bias of contributing studies, of the expected rVLs of COVID-19 cases during the infectious period. Quantitative rVLs refer to virus concentrations in the respiratory tract. Case types: hospitalized (H), not admitted (N), community (C), adult (A), pediatric (P), symptomatic (S), presymptomatic (Ps) and asymptomatic (As). Specimen types: endotracheal aspirate (ETA), nasopharyngeal aspirate (NPA), nasopharyngeal swab (NPS), oropharyngeal swab (OPS), posterior oropharyngeal saliva (POS) and sputum (Spu). Dashes denote case numbers that were not obtained. Box sizes denote weighting in the overall estimates. One-sided Welch’s t-test for difference (non-significance, p>0.05). Between-study heterogeneity was assessed using the p-value from Cochran’s Q test (non-significance, p>0.05) and the I2 statistic (I2 < 30% indicates low between-study heterogeneity).
Figure 3—figure supplement 2
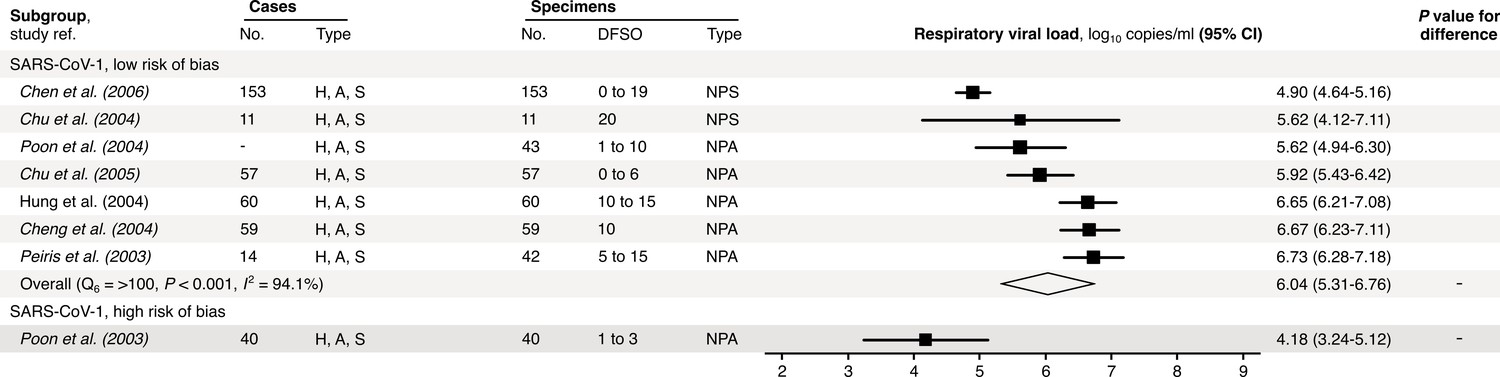
Risk-of-bias sensitivity analysis of between-study heterogeneity for SARS-CoV-1 respiratory viral load (rVL) during the estimated infectious period.
Random-effects meta-analyses, based on the risk of bias of contributing studies, of the expected rVLs of SARS cases during the infectious period. Quantitative rVLs refer to virus concentrations in the respiratory tract. Case types: hospitalized (H), adult (A) and symptomatic (S). Specimen types: nasopharyngeal aspirate (NPA) and nasopharyngeal swab (NPS). Dashes denote case numbers that were not obtained. Box sizes denote weighting in the overall estimates. One-sided Welch’s t-test for difference, non-significance (p>0.05). Between-study heterogeneity was assessed using the p-value from Cochran’s Q test (non-significance, p>0.05) and the I2 statistic (I2 < 30% indicates low between-study heterogeneity).
Figure 3—figure supplement 3
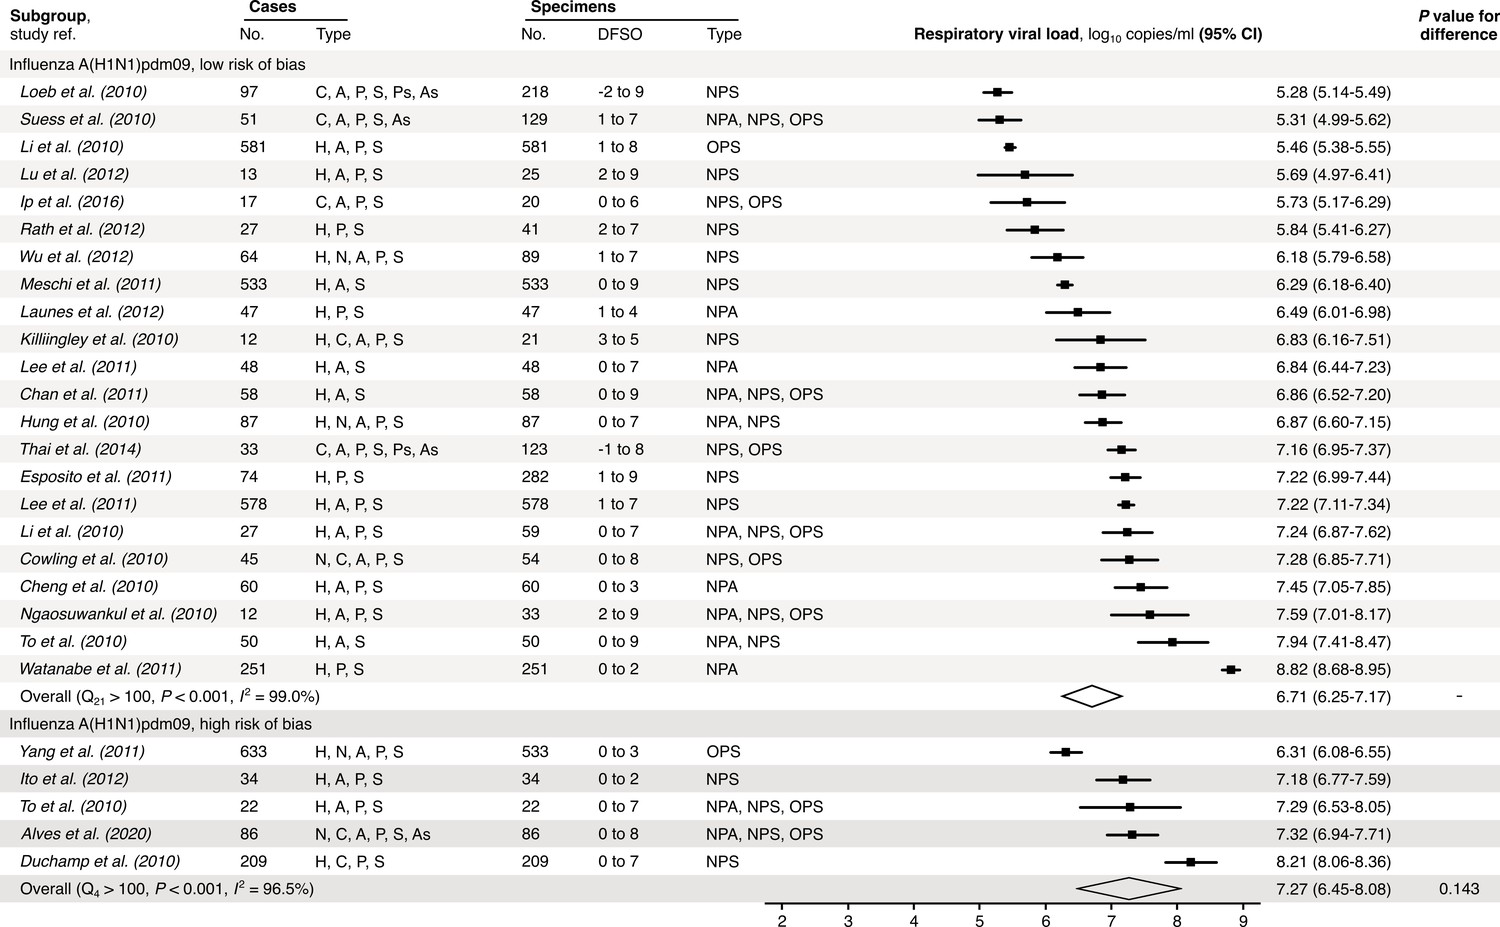
Risk-of-bias sensitivity analysis of between-study heterogeneity for A(H1N1)pdm09 respiratory viral load (rVL) during the estimated infectious period.
Random-effects meta-analyses, based on the risk of bias of contributing studies, of the expected rVLs of A(H1N1)pdm09 cases during the infectious period. Quantitative rVLs refer to virus concentrations in the respiratory tract. Case types: hospitalized (H), not admitted (N), community (C), adult (A), pediatric (P), symptomatic (S), presymptomatic (Ps) and asymptomatic (As). Specimen types: nasopharyngeal aspirate (NPA), nasopharyngeal swab (NPS) and oropharyngeal swab (OPS). Dashes denote case numbers that were not obtained. Box sizes denote weighting in the overall estimates. One-sided Welch’s t-test for difference (non-significance, p>0.05). Between-study heterogeneity was assessed using the p-value from Cochran’s Q test (non-significance, p>0.05) and the I2 statistic (I2 < 30% indicates low between-study heterogeneity).
Figure 3—figure supplement 4
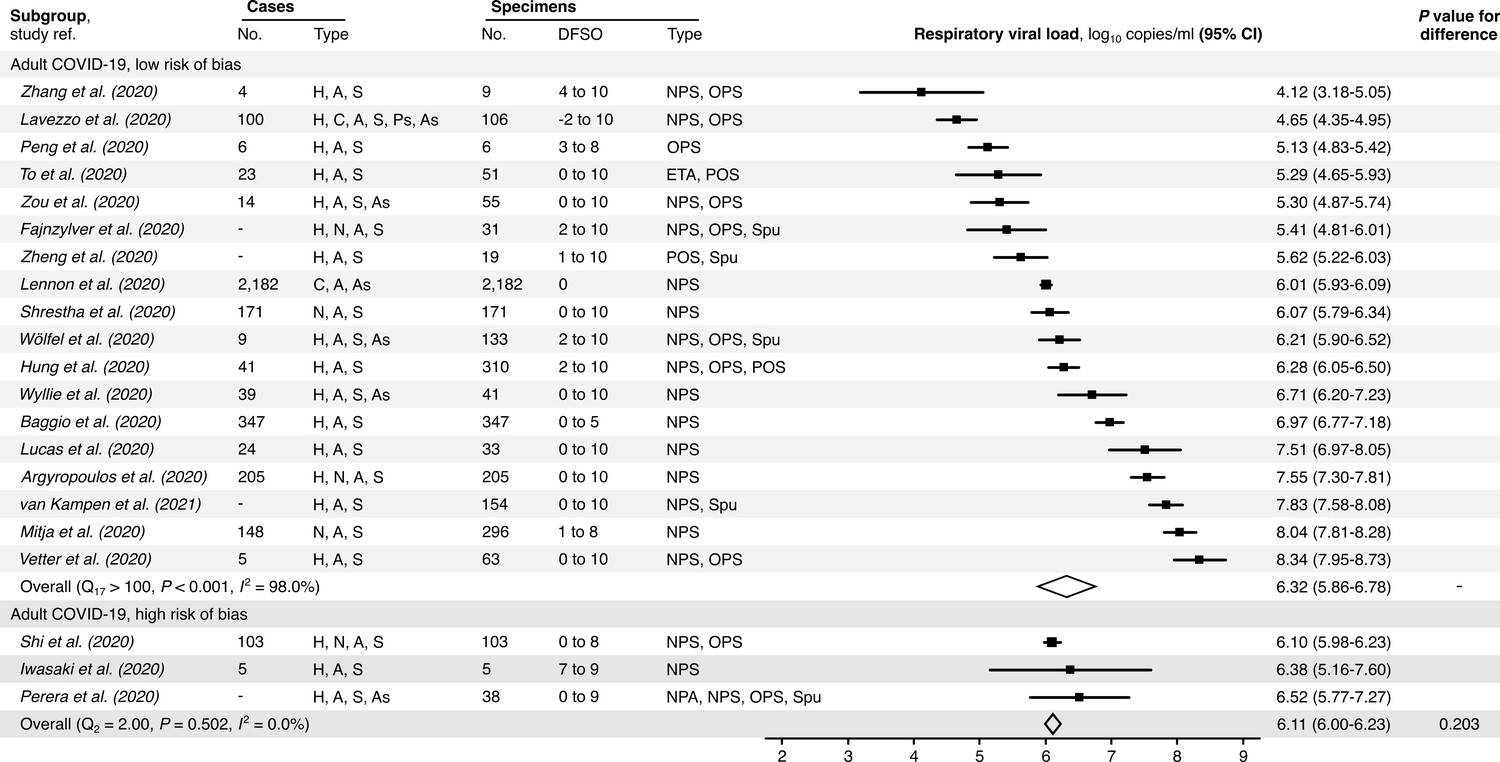
Risk-of-bias sensitivity analysis of between-study heterogeneity for SARS-CoV-2 respiratory viral load (rVL) for adult COVID-19 cases during the estimated infectious period.
Random-effects meta-analyses, based on the risk of bias of contributing studies, of the expected rVLs of adult (≥18 years old) COVID-19 cases during the infectious period. Quantitative rVLs refer to virus concentrations in the respiratory tract. Case types: hospitalized (H), not admitted (N), community (C), adult (A), pediatric (P), symptomatic (S), presymptomatic (Ps) and asymptomatic (As). Specimen types: endotracheal aspirate (ETA), nasopharyngeal aspirate (NPA), nasopharyngeal swab (NPS), oropharyngeal swab (OPS), posterior oropharyngeal saliva (POS) and sputum (Spu). Dashes denote case numbers that were not obtained. Box sizes denote weighting in the overall estimates. One-sided Welch’s t-test for difference (non-significance, p>0.05). Between-study heterogeneity was assessed using the p-value from Cochran’s Q test (non-significance, p>0.05) and the I2 statistic (I2 <30% indicates low between-study heterogeneity).
Figure 3—figure supplement 5
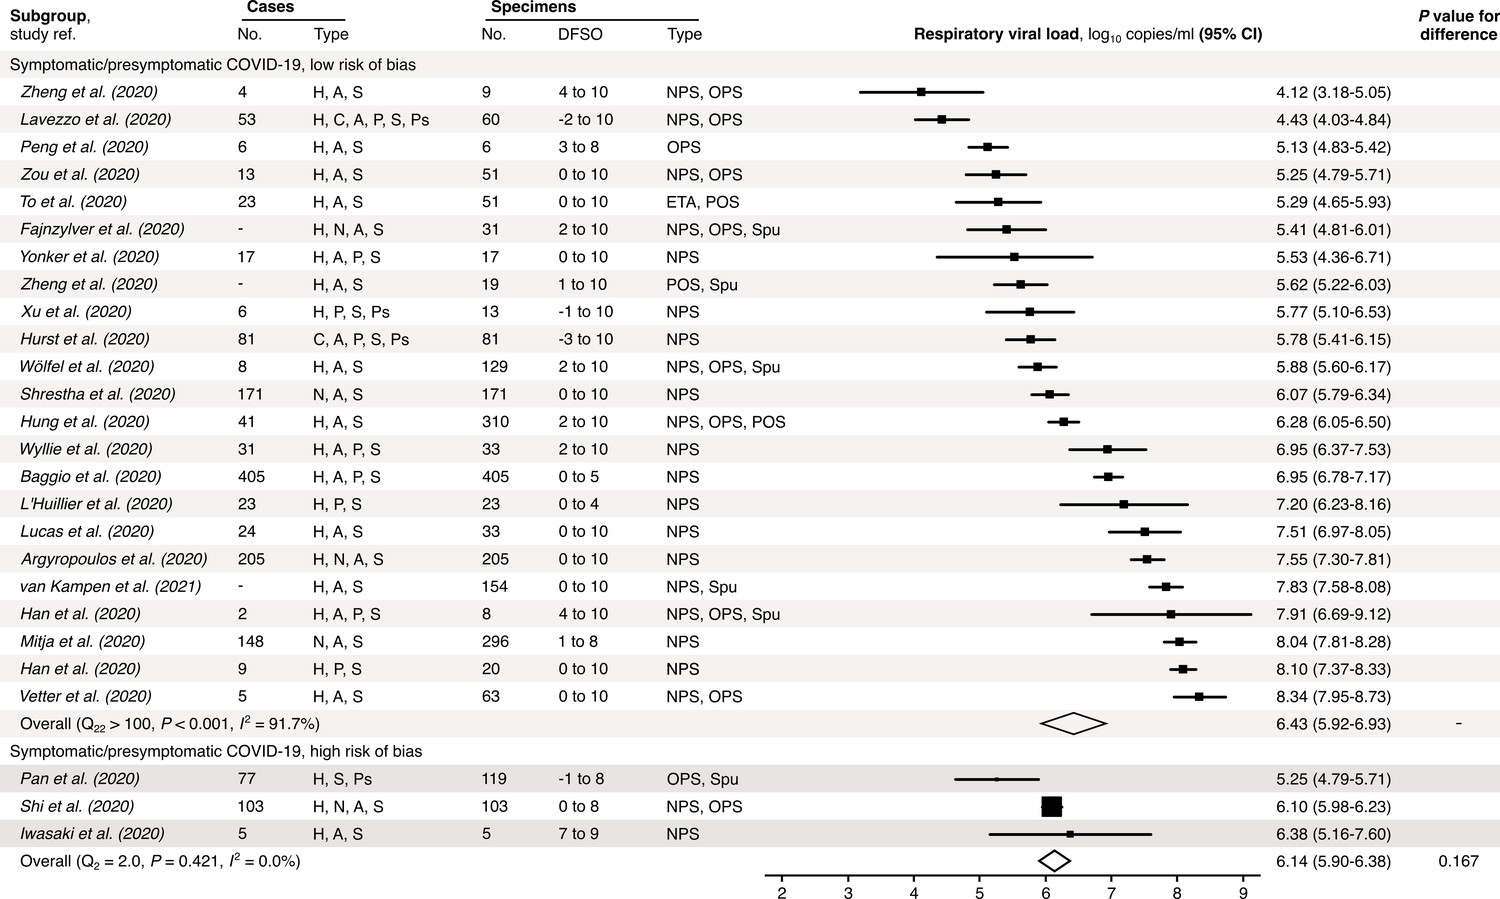
Risk-of-bias sensitivity analysis of between-study heterogeneity for SARS-CoV-2 respiratory viral load (rVL) for symptomatic/presymptomatic COVID-19 cases during the estimated infectious period.
Random-effects meta-analyses, based on the risk of bias of contributing studies, of the expected rVLs of symptomatic/presymptomatic (≥18 years old) COVID-19 cases during the infectious period. Quantitative rVLs refer to virus concentrations in the respiratory tract. Case types: hospitalized (H), not admitted (N), community (C), adult (A), pediatric (P), symptomatic (S), presymptomatic (Ps) and asymptomatic (As). Specimen types: endotracheal aspirate (ETA), nasopharyngeal swab (NPS), oropharyngeal swab (OPS), posterior oropharyngeal saliva (POS) and sputum (Spu). Dashes denote case numbers that were not obtained. Box sizes denote weighting in the overall estimates. One-sided Welch’s t-test for difference (non-significance, p>0.05). Between-study heterogeneity was assessed using the p-value from Cochran’s Q test (non-significance, p>0.05) and the I2 statistic the I2 statistic (I2 < 30% indicates low between-study heterogeneity).
Figure 4 with 5 supplements

Heterogeneity and kinetics of SARS-CoV-2 respiratory viral load (rVL).
(A) Estimated distribution of rVL for SARS-CoV-2 (N = 3834 samples from N = 26 studies) and A(H1N1)pdm09 (N = 512 samples from N = 10 studies) throughout the infectious periods. (B, C) Estimated distribution of SARS-CoV-2 rVL for adult (N = 3575 samples from N = 20 studies) and pediatric (N = 198 samples from N = 9 studies) (B) and symptomatic/presymptomatic (N = 1574 samples from N = 22 studies) and asymptomatic (N = 2221 samples from N = 7 studies) (C) COVID-19 cases. (D) SARS-CoV-2 rVLs fitted to a mechanistic model of viral kinetics (black curve, r2 = 0.84 for mean estimates). Filled circles and bars depict mean estimates and 95% confidence intervals. Open circles show the entirety of individual sample data over days from symptom onset (DFSO) (left to right, N = 3, 15, 50, 63, 71, 75, 85, 93, 105, 136, 123, 128 and 115 samples from N = 21 studies). (E) Estimated distributions of SARS-CoV-2 rVL across DFSO. Weibull distributions were fitted on the entirety of individual sample data for the virus, subgroup or DFSO in the systematic dataset. Arrows denote 90th case percentiles for SARS-CoV-2 rVL distributions.
Figure 4—figure supplement 1
Respiratory viral loads for SARS-CoV-2, SARS-CoV-1 and A(H1N1)pdm09 best conform to Weibull distributions.
(A–D) Normal (p≤0.01) (A), lognormal (p≤0.01) (B), gamma (p≤0.005) (C) and Weibull (p>0.10, not significant [NS]) (D) probability plots for individual sample data of SARS-CoV-2 respiratory viral loads (rVLs) across days from symptom onset in the systematic dataset (N = 941 samples from N = 20 studies). (E–H) Normal (p>0.05, NS) (E), lognormal (p≤0.01) (F), gamma (p>0.05, NS) (G) and Weibull (p>0.10, NS) (H) probability plots for individual sample data of SARS-CoV-1 rVLs in the systematic dataset (N = 303 samples from N = 5 studies). (I– L) Normal (p≤0.01) (I), lognormal (p≤0.01) (J), gamma (p≤0.005) (K) and Weibull (p>0.10, NS) (L) probability plots for individual sample data of A(H1N1)pdm09 rVLs in the systematic dataset (N = 512 samples from N = 10 studies). These categories included rVL data from positive (above the detection limit) assay measurements. The p-values were determined using the modified Kolmogorov–Smirnov test for the goodness of fit of each distribution. When the null hypothesis is accepted (NS at p>0.05), the probability density function cannot be rejected to describe the distribution of the data. Blue circles, black lines and red lines represent individual sample data, expected distributions and 95% confidence intervals, respectively. (M–O) Histograms and fitted Weibull distributions of the above data for SARS-CoV-2 (M), SARS-CoV-1 (N) and A(H1N1)pdm09 (O).
Figure 4—figure supplement 2

Case heterogeneity in respiratory viral loads (rVLs) across viruses, COVID-19 subgroups and disease course.
(A–C) Estimated rVLs of SARS-CoV-2 (A), SARS-CoV-1 (B) and A(H1N1)pdm09 (C) across case percentile (cp) throughout the infectious periods. (D–G) Estimated SARS-CoV-2 rVLs for adult (D), pediatric (E), symptomatic/presymptomatic (F) and asymptomatic (G) cases across cp throughout the infectious period. (H–S) Estimated SARS-CoV-2 rVLs across cp on different days from symptom onset (DFSO) during the infectious period. Earlier DFSO were excluded based on limited data. Data ranged between the 1st and 99th cps. Lines and bands represent estimates and 95% confidence intervals, respectively.
Figure 4—figure supplement 3
Descriptive parameters for respiratory viral loads based on individual sample data.
-
Figure 4—figure supplement 3—source data 1
Editable version of Figure 4—figure supplement 3.
- https://cdn.elifesciences.org/articles/65774/elife-65774-fig4-figsupp3-data1-v2.docx
Figure 4—figure supplement 4
Model parameters describing SARS-CoV-2 kinetics during respiratory infection.
-
Figure 4—figure supplement 4—source data 1
Editable version of Figure 4—figure supplement 4.
- https://cdn.elifesciences.org/articles/65774/elife-65774-fig4-figsupp4-data1-v2.docx
Figure 4—figure supplement 5

Kinetics of SARS-CoV-2 and airway epithelial cells during respiratory infection.
(A, B) Estimated kinetics of uninfected (blue) and productively infected (red) airway epithelial cells (left axis) and SARS-CoV-2 (right axis) in the respiratory tract, as shown in linear (A) and logarithmic (B) scales.
Figure 5 with 5 supplements
Heterogeneity in shedding SARS-CoV-2 via droplets and aerosols.
(A, B) Estimated likelihood of respiratory particles containing viable SARS-CoV-2 when expelled by the mean (top) or 98th case percentile (cp) (bottom) COVID-19 cases at −1 (A) or 1 (B) days from symptom onset (DFSO). For higher number of virions, some likelihood curves were omitted to aid visualization. When the likelihood for zero virions approaches 0%, particles are expected to contain at least one viable copy. (C–F) Rate that the mean and 98th cp COVID-19 cases at 1 DFSO shed viable SARS-CoV-2 by talking, singing, breathing or coughing over particle size. (G) Relative contributions of droplets and aerosols to shedding virions for each respiratory activity (left). Relative contribution of buoyant, long-range and short-range aerosols to shedding virions via aerosols for each respiratory activity (right). (H) Case heterogeneity in the total shedding rate (over all particle sizes) of virions via singing across the infectious period. Earlier presymptomatic days were excluded based on limited data. Data range between the 1st and 99th cps. Lines and bands represent estimates and 95% confidence intervals, respectively, for estimated likelihoods or Poisson means.
Figure 5—figure supplement 1
Likelihood of respiratory particles containing SARS-CoV-2 or A(H1N1)pdm09.
(A–E) Estimated likelihood that droplets and aerosols contain viable SARS-CoV-2 when expelled by the 25th case percentile (cp) (A), mean (B), 65th cp (C), 80th cp (D) or 90th cp (E) for COVID-19 cases during the infectious period. (F–J) Estimated likelihood that droplets and aerosols contain viable A(H1N1)pdm09 when expelled by the 25th cp (F), mean (G), 65th cp (H), 80th cp (I) or 90th cp (J) for A(H1N1)pmd09 cases during the infectious period. For higher number of virions, some likelihood curves were omitted to aid visualization. Equilibrium particle diameters were taken to be 0.3 times the hydrated diameter during atomization. When the likelihood for zero virions approaches 0%, particles are expected to contain at least one viable copy. Lines and bands represent estimates and 95% confidence intervals, respectively, for estimated likelihoods.
Figure 5—figure supplement 2
Rate profiles for particle expelled by respiratory activities.
(A–D) Rate profiles of particles expelled while talking (A), singing (B), breathing (C) and coughing (D). (E) Comparison of the rate profiles of aerosol emission from singing and different amplitudes of talking. The rate profiles were calculated from the normalized concentrations in Johnson et al., 2011 (A, B, D and E) and Morawska et al., 2009 (C) or collected from Asadi et al. (2019) (E). Equilibrium particle diameters were taken to be 0.3 times the hydrated diameter during atomization. Breathing was taken to expel negligible quantities of larger particles based on the bronchiolar fluid film burst mechanism.
Figure 5—figure supplement 3
Heterogeneity in shedding SAR-CoV-2 via talking, breathing and coughing.
(A–C) Case heterogeneity in the total SARS-CoV-2 shedding rate (over all particle sizes) by talking at a moderate amplitude (A), breathing (B) or coughing (C) for COVID-19 cases across the infectious period. Earlier presymptomatic days were excluded based on low specimen numbers. Data represent estimated rates for viable virus and range between the 1st and 99thcase percentiles. Lines and bands represent estimates and 95% confidence intervals, respectively.
Figure 5—figure supplement 4

Heterogeneity in infectiousness for COVID-19 and A(H1N1)pmd09 cases during the infectious period.
(A, B) Estimated time for a A(H1N1)pdm09 case to expel one virion via only aerosols (A) or either droplets or aerosols (B) by talking, singing, breathing or coughing. (C, D) Estimated time for a COVID-19 case to expel one SARS-CoV-2 virion via only aerosols (C) or either droplets or aerosols (D) by talking, singing, breathing or coughing. Data represent estimated times to expel viable virus and range between the 1st and 99th case percentiles (cps). Vertical arrows depict the cp expected to shed one virion in 24 hr (talking, singing or breathing) or 100 coughs. Lines and bands represent estimates and 95% confidence intervals, respectively.
Figure 5—figure supplement 5

Heterogeneity in shedding A(H1N1)pdm09 via droplets and aerosols.
(A–D) Case heterogeneity in the total A(H1N1)pdm09 shedding rates while talking (A), singing (B), breathing (C) and coughing (D) during the infectious period. Data represent estimated rates for viable virus and range between the 1st and 99thcase percentiles. Lines and bands represent estimates and 95% confidence intervals, respectively.
Tables
Appendix 1—table 1
Characteristics of contributing studies.
| Study* | Country | No. of cases included (no. of specimens) | No. of pediatric cases (no. of specimens) | No. of asymptomatic cases (no. of specimens) | Disease caused by virus (WHO case definition) | Treatments given (type)† | Individual data extracted (diluent volume reported)‡ | Adjusted viral load§ (type of specimen) | Weight, % (meta-analysis category)|| | Weight, % (meta-regression) | Risk of bias¶ |
|---|---|---|---|---|---|---|---|---|---|---|---|
| Argyropoulos et al., 2020 | USA | 205 (205) | 0 | 0 | COVID-19 (confirmed) | N/A | No (no) | Yes (NPS) | 3.80 (V), 5.09 (A), 3.98 (S/Ps) | 2.13 | ******** |
| Baggio et al., 2020 | Switzerland | 405 (405) | 58 (58) | 0 | COVID-19 (confirmed) | N/A | Yes (no) | Yes (NPS) | 3.84 (V), 5.14 (A), 13.9 (P), 3.88 (S/Ps) | 4.20 | ******* |
| Fajnzylber et al., 2020 | USA | - (31) | 0 | 0 | COVID-19 (confirmed) | Yes (remdesivir) | Yes (yes) | Yes (NPS, OPS) No (Spu) | 3.45 (V), 4.62 (A), 3.76 (S/Ps) | 0.32 | ******** |
| Hung et al., 2020 | South Korea | 2 (8) | 1 (6) | 0 | COVID-19 (confirmed) | N/A | Yes (no) | Yes (NPS, OPS) | 2.53 (V), 4.06 (S/Ps) | 0.08 | ****** |
| Hung et al., 2020 | South Korea | 12 (27) | 12 (27) | 3 (7) | COVID-19 (confirmed) | N/A | Yes (no) | Yes (NPS) | 3.43 (V), 17.5 (P), 4.10 (S/Ps), 14.3 (As) | 0.28 | ******** |
| Hung et al., 2020 | China | 41 (310) | 0 | 0 | COVID-19 (confirmed) | Yes (control group: lopinavir ritonavir, antimicrobial treatment for secondary bacterial infection as indicated clinically, hydrocortisone for those requiring oxygen support) | No (no) | Yes (NPS, OPS, POS) | 3.81 (V), 5.10 (A), 3.81 (S/Ps) | 3.22 | ********* |
| Hurst et al., 2020 | USA | 133 (133) | 54 (54) | 52 (52) | COVID-19 (confirmed) | Yes (remdesivir) | Yes (no) | Yes (NPS) | 3.77 (V), 15.3 (P), 3.88 (S/Ps), 21.6 (As) | 1.38 | ******** |
| Iwasaki et al., 2020 | Japan | 5 (5) | 0 | 0 | COVID-19 (confirmed) | N/A | Yes (no) | Yes (NPS) | 2.53 (V), 3.37 (A), 4.12 (S/Ps) | 0.05 | **** |
| Kawasuji et al., 2020 | Japan | 16 (16) | - | - | COVID-19 (confirmed) | Yes (antivirals, antibiotics – specifics not reported) | Yes (no) | Yes (NPS) | 3.15 (V) | 0.18 | ***** |
| L'Huillier et al., 2020 | Switzerland | 23 (23) | 23 (23) | 0 | COVID-19 (confirmed) | N/A | Yes (no) | Yes (NPS) | 2.91 (V), 14.7 (P), 3.73 (S/Ps) | 0.24 | ******** |
| Lavezzo et al., 2020 | Italy | 103 (110) | 2 (3) | 49 (49) | COVID-19 (confirmed) | N/A | Yes (yes) | Yes (NPS, OPS) | 3.77 (V), 5.03 (A), 11.57 (P), 3.57 (S/Ps), 21.8 (As) | 1.14 | ******* |
| Lennon et al., 2020 | USA | 2200 (2,200) | 18 (18) | 2200 (2200#) | COVID-19 (confirmed) | N/A | No (yes) | Yes (NPS) | 3.88 (V), 5.20 (A), 24.0 (As) | 22.84 | ********* |
| Lucas et al., 2020 | USA | 24 (33) | 0 | 0 | COVID-19 (confirmed) | Yes (tocilizumab for moderate and severe patients, glucocorticoid and vasopressor for severe patients) | Yes (yes) | Yes (NPS) | 3.51 (V), 4.69 (A), 4.08 (S/Ps) | 0.34 | ******* |
| Mitjà et al., 2020 | Spain | 148 (296) | 0 | 0 | COVID-19 (confirmed) | N/A | No (no) | Yes (NPS) | 3.81 (V), 5.10 (A), 3.93 (S/Ps) | 3.07 | ********* |
| Pan et al., 2020 | China | 75 (104) | - | 0 | COVID-19 (confirmed) | N/A | Yes (no) | Yes (OPS) No (Spu) | 3.45 (V), 2.50 (S/Ps) | 1.24 | **** |
| Peng et al., 2020 | China | 6 (6) | 0 | 0 | COVID-19 (confirmed) | Yes (arbidol, lopinavir, ritonavir, interferon alfa-2b inhalation) | Yes (no) | Yes (OPS) | 3.03 (V), 4.05 (A), 4.02 (S/Ps) | 0.06 | ******** |
| Perera et al., 2020 | China | - (36) | 0 | - | COVID-19 (confirmed) | Yes lopinavir-ritonavir alone, combination lopinavir-ritonavir and ribavirin, ribavirin and β interferon, β interferon alone, combination ribavirin, β interferon, and tocilizumab, and corticosteroid | Yes (no) | Yes (NPA, NPS, OPS, Spu) | 3.23 (V), 4.32 (A) | 0.39 | **** |
| Shi et al., 2020 | China | 103 (103) | 0 | 0 | COVID-19 (confirmed) | No (samples drawn before antivirals given) | Yes (no) | Yes (NPS, OPS) | 3.87 (V), 5.18 (A), 4.34 (S/Ps) | 1.07 | ***** |
| Shrestha et al., 2020 | USA | 171 (171) | 0 | 0 | COVID-19 (confirmed) | Yes (indicated no hydroxychloroquine or other COVID-19-related treatments were used) | Yes (no) | Yes (NPS) | 3.79 (V), 5.07 (A), 3.86 (S/Ps) | 1.78 | ******* |
| To et al., 2020 | China | 23 (51) | 0 | 0 | COVID-19 (confirmed) | N/A | Yes (yes) | Yes (ETA, POS) | 3.37 (V), 4.51 (A), 3.25 (S/Ps) | 0.53 | ********* |
| van Kampen et al., 2021 | The Netherlands | - (154) | 0 | 0 | COVID-19 (confirmed) | Yes (lopinavir-ritonavir with or without ribavirin and/or interferon beta 1b) | Yes (yes) | Yes (NPS, Spu) | 3.80 (V), 5.09 (A), 4.10 (S/Ps) | 1.60 | ******** |
| Vetter et al., 2020 | Switzerland | 5 (63) | 0 | 0 | COVID-19 (confirmed) | Yes (paracetamol, alfuzosin, ibuprofen, enoxaparin, amoxicillin clarithromycin, piperacillin, tazobactam, lopinavir, ritonavir, folic acid) | Yes (yes) | Yes (NPS, OPS) | 3.68 (V), 4.93 (A), 4.14 (S/Ps) | 0.65 | ********* |
| Wölfel et al., 2020 | Germany | 9 (136) | 0 | 1 (4) | COVID-19 (confirmed) | N/A | Yes (yes) | Yes (NPS, OPS) No (Spu) | 3.76 (V), 5.03 (A), 3.93 (S/Ps) | 1.38 | ******* |
| Wyllie et al., 2020 | USA | 40 (42) | - | 9 (9) | COVID-19 (confirmed) | N/A | Yes (yes) | Yes (NPS) | 3.55 (V), 4.75 (A), 4.00 (S/Ps), 18.3 (As) | 0.44 | ******* |
| Xu et al., 2020 | China | 7 (14) | 7 (14) | 1 (1) | COVID-19 (confirmed) | Yes (α-interferon oral spray, azithromycin) | Yes (no) | Yes (NPS) | 3.40 (V). 17.3 (P), 4.1 (S/Ps) | 0.15 | ******** |
| Yonker et al., 2020 | USA | 17 (17) | 14 (14) | 0 | COVID-19 (confirmed) | N/A | Yes (no) | Yes (NPS) | 2.58 (V), 9.79 (P), 3.28 (S/Ps) | 0.18 | ****** |
| Zhang et al., 2020b | China | 9 (9) | 0 | 0 | COVID-19 (confirmed) | N/A | Yes (no) | Yes (NPS, OPS) | 2.97 (V), 3.97 (A), 3.68 (S/Ps) | 0.09 | ******** |
| Zheng et al., 2020 | China | - (19) | 0 | 0 | COVID-19 (confirmed) | Yes (gamma globulin, glucocorticoids, antibiotics, antiviral combination of interferon α inhalation, lopinavir-ritonavir combination, arbidol, favipiravir, and darunavir-cobicistat) | Yes (no) | Yes (POS, Spu) | 3.66 (V), 4.90 (A), 4.23 (S/Ps) | 0.20 | ******* |
| Zou et al., 2020 | China | 14 (55) | 0 | 1 (4) | COVID-19 (confirmed) | N/A | Yes (no) | Yes (NPS, OPS) | 3.64 (V), 4.87 (A), 3.65 (S/Ps) | 0.57 | ******* |
| Chen et al., 2006 | China | 154 (154#) | 0 | 0 | SARS (confirmed) | N/A | Yes (no) | Yes (NPS) | 14.0 (V) | 1.59 | ******** |
| Chu et al., 2004** | China | 11 (11) | 0 | 0 | SARS (confirmed) | Yes (control group: ribavirin, hydrocortisone, methylprednisolone) | Yes (yes) | Yes (NPS) | 8.6 (V) | 0.11 | ********* |
| Chu et al., 2005 | China | 57 (57) | 0 | 0 | SARS (confirmed) | N/A | Yes (yes) | Yes (NPA) | 13.3 (V) | 0.59 | ********* |
| Cheng et al., 2004 | China | 59 (59) | 0 | 0 | SARS (confirmed) | Yes (amoxicillin-clavulanate, azithromycin, levofloxacin, ribavirin, hydrocortisone, prednisolone, methylprednisolone) | Yes (yes) | Yes (NPA) | 13.4 (V) | 0.61 | ********* |
| Hung et al., 2004 | China | 60 (60) | 0 | 0 | SARS (confirmed) | N/A | No (yes) | Yes (NPA) | 13.5 (V) | 0.62 | ******* |
| Peiris et al., 2003** | China | 14 (42) | 0 | 0 | SARS (confirmed) | Yes (ribavirin, hydrocortisone, prednisolone, methylprednisolone) | Yes (no) | Yes (NPA) | 13.4 (V) | 0.44 | ******** |
| Poon et al., 2003 | China | 40 (40) | 0 | 0 | SARS (confirmed) | N/A | No (yes) | Yes (NPA) | 11.3 (V) | 0.42 | ***** |
| Poon et al., 2004 | China | - (43) | 0 | 0 | SARS (confirmed) | N/A | No (yes) | Yes (NPA) | 12.5 (V) | 0.45 | ******* |
| Rodrigues Guimarães Alves et al., 2020 | Brazil | 86 (86) | - | 15 (15) | A(H1N1)pdm09 (confirmed) | Yes (oseltamivir) | No (yes) | Yes (NPA, NPS, OPS) | 3.7 (V) | 0.89 | ***** |
| Chan et al., 2011 | China | 58 (58) | 0 | 0 | A(H1N1)pdm09 (confirmed) | Yes (oseltamivir, zanamivir, peramivir) | Yes (no) | Yes (NPA, NPS, OPS) | 3.7 (V) | 0.60 | ****** |
| Cheng et al., 2010 | China | 60 (60) | - | 0 | A(H1N1)pdm09 (confirmed) | No (pretreatment samples) | No (no) | Yes (NPA) | 3.7 (V) | 0.62 | ****** |
| Cowling et al., 2010 | China | 45 (54) | 22 (31) | 0 | A(H1N1)pdm09 (confirmed) | Yes (oseltamivir) | Yes (yes) | Yes (NPS, OPS) | 3.7 (V) | 0.56 | ********* |
| Duchamp et al., 2010 | France | 209 (209) | 209 (209) | 0 | A(H1N1)pdm09 (confirmed) | Yes (oseltamivir, zanamivir) | No (yes) | Yes (NPS) | 3.8 (V) | 2.17 | ***** |
| Esposito et al., 2011 | Italy | 74 (282) | 74 (282) | 0 | A(H1N1)pdm09 (confirmed) | No | Yes (yes) | Yes (NPS) | 3.8 (V) | 2.93 | ******* |
| Hung et al., 2010 | China | 87 (87) | - | 0 | A(H1N1)pdm09 (confirmed) | Yes (oseltamivir) | Yes (no) | Yes (NPA, NPS) | 3.8 (V) | 0.90 | ****** |
| Ip et al., 2016 | China | 17 (20) | 7 (-) | 0 | A(H1N1)pdm09 (confirmed) | N/A | Yes (no) | Yes (NPS, OPS) | 3.6 (V) | 0.21 | ******* |
| Ito et al., 2012 | Japan | 34 (34) | - | 0 | A(H1N1)pdm09 (confirmed) | No (pretreatment samples) | Yes (yes) | Yes (NPS) | 3.7 (V) | 0.35 | ***** |
| Killingley et al., 2010 | United Kingdom | 12 (21) | - | 0 | A(H1N1)pdm09 (confirmed) | Yes (oseltamivir) | Yes (yes) | Yes (NPS) | 3.5 (V) | 0.22 | ******** |
| Launes et al., 2012 | Spain | 47 (47) | 47 (47) | 0 | A(H1N1)pdm09 (confirmed) | No (pretreatment samples) | No (no) | Yes (NPA) | 3.7 (V) | 0.49 | ******* |
| Lee et al., 2011a | China | 48 (48) | 0 | 0 | A(H1N1)pdm09 (confirmed) | No (pretreatment samples) | No (no) | Yes (NPA) | 3.7 (V) | 0.50 | ******** |
| Lee et al., 2011a | Singapore | 578 (578) | 231 (231) | 0 | A(H1N1)pdm09 (confirmed) | No (pretreatment samples) | No (no) | Yes (NPS) | 3.8 (V) | 6.00 | ********* |
| Li et al., 2010a | China | 581 (581) | 522 (522) | 0 | A(H1N1)pdm09 (confirmed) | Yes (oseltamivir) | No (no) | Yes (OPS) | 3.8 (V) | 6.03 | ******** |
| Li et al., 2010b | China | 27 (59) | - | 0 | A(H1N1)pdm09 (confirmed) | No (control group no treatment) | No (no) | Yes (NPA, NPS, OPS) | 3.7 (V) | 0.61 | ******* |
| Loeb et al., 2012 | Canada | 97 (218) | - | - (17) | A(H1N1)pdm09 (confirmed) | No | No (no) | Yes (NPS) | 3.8 (V) | 2.26 | ******* |
| Lu et al., 2012 | China | 13 (25) | - | 0 | A(H1N1)pdm09 (confirmed) | Yes (oseltamivir, zanamivir) | Yes (no) | Yes (NPS) | 3.5 (V) | 0.26 | ******* |
| Meschi et al., 2011 | Italy | 533 (533) | 0 | 0 | A(H1N1)pdm09 (confirmed) | No (pretreatment samples) | No (no) | Yes (NPS) | 3.8 (V) | 0.92 | ********* |
| Ngaosuwankul et al., 2010 | China | 12 (33) | - | 0 | A(H1N1)pdm09 (confirmed) | No (pretreatment samples) | No (yes) | Yes (NPA, NPS, OPS) | 3.6 (V) | 0.34 | ****** |
| Rath et al., 2012 | Germany | 27 (41) | 27 (41) | 0 | A(H1N1)pdm09 (confirmed) | Yes (oseltamivir) | Yes (yes) | Yes (NPS) | 3.7 (V) | 0.43 | ********* |
| Suess et al., 2010 | Germany | 51 (129) | 12 (-) | 1 (1) | A(H1N1)pdm09 (confirmed) | Yes (oseltamivir) | No (no) | Yes (NPA, NPS, OPS) | 3.8 (V) | 1.34 | ******** |
| Thai et al., 2014 | Vietnam | 33 (123) | 16 (-) | 5 (28) | A(H1N1)pdm09 (confirmed) | Yes (oseltamivir) | Yes (yes) | Yes (NPS) | 3.8 (V) | 1.28 | ********* |
| To et al., 2010a | China | 50 (50) | 0 | 0 | A(H1N1)pdm09 (confirmed) | Yes (oseltamivir, zanamivir, inotropes) | No (no) | Yes (NPA, NPS) | 3.6 (V) | 0.52 | ****** |
| To et al., 2010b | China | 22 (22) | - | 0 | A(H1N1)pdm09 (confirmed) | No (pretreatment samples) | No (no) | Yes (NPA, NPS, OPS) | 3.4 (V) | 0.23 | ***** |
| Watanabe et al., 2011 | Japan | 251 (251) | 251 (251) | 0 | A(H1N1)pdm09 (confirmed) | No (pretreatment samples) | No (yes) | Yes (NPA) | 3.8 (V) | 2.61 | ********** |
| Wu et al., 2012 | China | 64 (89) | - | 0 | A(H1N1)pdm09 (confirmed) | Yes (oseltamivir) | No (yes) | Yes (NPS) | 3.7 (V) | 5.53 | ******* |
| Yang et al., 2011 | China | 251 (251) | - | 0 | A(H1N1)pdm09 (confirmed) | N/A | No (yes) | Yes (OPS) | 3.8 (V) | 6.57 | ***** |
-
*Data shown as ‘-' were not obtained from the paper or authors.
†Responses of ‘N/A’ indicate that no details were reported on treatment for COVID-19 in the study.
-
‡For studies reporting specimen measurements as individual sample data (either in numerical or graphical formats), the sample data was extracted for analysis.
§Specimen measurements were converted to rVLs based on the dilution factor for specimens in transport media.
-
||Abbreviations for random-effects meta-analyses: virus meta-analysis (V), adult subgroup (A), pediatric subgroup (P), symptomatic/presymptomatic subgroup (S/Ps) and asymptomatic subgroup (As).
¶The hybrid JBI critical appraisal checklist was used, with more stars indicating lower risk of bias. Studies were considered to have low risk of bias if they met the majority of the items (≥6/10 items). Results from each study are shown in Appendix 1—table 2.
-
#For these studies, 2147 (Lennon et al., 2020) and 134 (Chen et al., 2006) individual specimen measurements were obtained for the individual sample datasets.
**For Chu et al., 2004, only specimen measurements at 20 DFSO were collected as 5–15 DFSO were specimens reported in Peiris et al., 2003.
-
NPS: nasopharyngeal swab; OPS, oropharyngeal swab; Spu: sputum; POS, posterior oropharyngeal saliva; NPA: nasopharyngeal aspirate; ETA: endotracheal aspirate; DFSO: days from symptom onset; rVL: respiratory viral load.
Appendix 1—table 2
Assessment of risk of bias based on the hybrid JBI critical appraisal checklist.
-
*Descriptions of each item are included in the hybrid JBI critical appraisal checklist (Appendix). Y (green), U (yellow) and N (red) represent yes, unclear and no, respectively.
Additional files
Download links
A two-part list of links to download the article, or parts of the article, in various formats.
Downloads (link to download the article as PDF)
Open citations (links to open the citations from this article in various online reference manager services)
Cite this article (links to download the citations from this article in formats compatible with various reference manager tools)
Heterogeneity in transmissibility and shedding SARS-CoV-2 via droplets and aerosols
eLife 10:e65774.
https://doi.org/10.7554/eLife.65774


