Synchronous activity patterns in the dentate gyrus during immobility
- Institute for Experimental Epileptology and Cognition Research, University of Bonn, Germany
- Machine Learning in Science, Cluster of Excellence "Machine Learning", University of Tübingen, Germany & Department Empirical Inference, Max Planck Institute for Intelligent Systems, Germany
- Deutsches Zentrum für Neurodegenerative Erkrankungen e.V, Germany
Figures
Figure 1 with 5 supplements

Synchronous dentate granule cell activations, ‘network events’, occur preferentially during immobility.
(A) Expression of GCaMP6s in granule cells (Thy1-GCaMP mouse line, GP4.12Dkim/J). jRGECO was expressed in medial entorhinal cortex neurons using rAAV mediated gene transfer, and is visible in the middle molecular layer (MML) corresponding to the medial perforant path (MPP). Upper panel: Post hoc analysis in 70 µm fixed slice. Nuclei stained with DAPI (blue). Lower panel: Imaging plane for simultaneous recording of MPP bulk and individual GC activity. Scale bar 100 µm. (B) Data of representative recording session. Bulk fluorescence signal of MPP fibers (red), extracted fluorescence signals from a subset of individual GCs (black), mouse position on linear track (blue) and diameter of mouse pupil (black). (C) Participation of granule cells in synchronous network events. Representative field of view with highlighted simultaneously active GCs. Cells active during an individual network event are depicted in the same color. A subset of neurons is active in multiple network events, recognizable as white color. (D) Raster plot of network events. Dashed lines mark network events, corresponding to simultaneous activity of > four cells. Participating cells are highlighted according to color scheme from panel C. Running speed is depicted (blue) to distinguish running and resting periods. (E) Fluorescence transients of participating granule cells from NEs in panel D. Color scheme corresponds to panel C and D. Each column shows all respective transients of the respective synchronous ensemble. Shown is a time window of ±1 s around each NE. Vertical scale bars correspond to 100% ΔF/F. (F) Mean number of network events per twenty-minute recording session during running and resting. Network events occurred mainly during immobility (repeated measures ANOVA, F(1,8)=71.80, p=2×10⁻⁷, n = 9 animals, three sessions). Gray bars depict shuffled data for each condition (n = 9 animals). (G) Average number of identified network events plotted against different thresholds for the size of network events in terms of numbers of synchronously active cells (green line, shaded area depicts SEM, n = 3 mice, three sessions). Shuffled data null-distribution is created by randomly shuffling event times for every individual cell (gray line, shaded area depicts SEM). (H) Frequencies of network events calculated from equal time intervals for locomotion and immobility (Repeated measures ANOVA, F(1,8) = 117.28, p=2×10⁻⁶). (I) Cumulative probability distribution of network event occurrence during the entire twenty-minute session for individual sessions (gray lines) and the pooled sessions (Green line, n = 9 mice, three sessions). (J) Pooled cumulative probability distribution of network event occurrence during resting periods. All resting periods of one session that were longer than 5 s were normalized to their length (n = 9 mice, three sessions).
Figure 1—figure supplement 1
Dual-color two-photon imaging in the dentate gyrus.
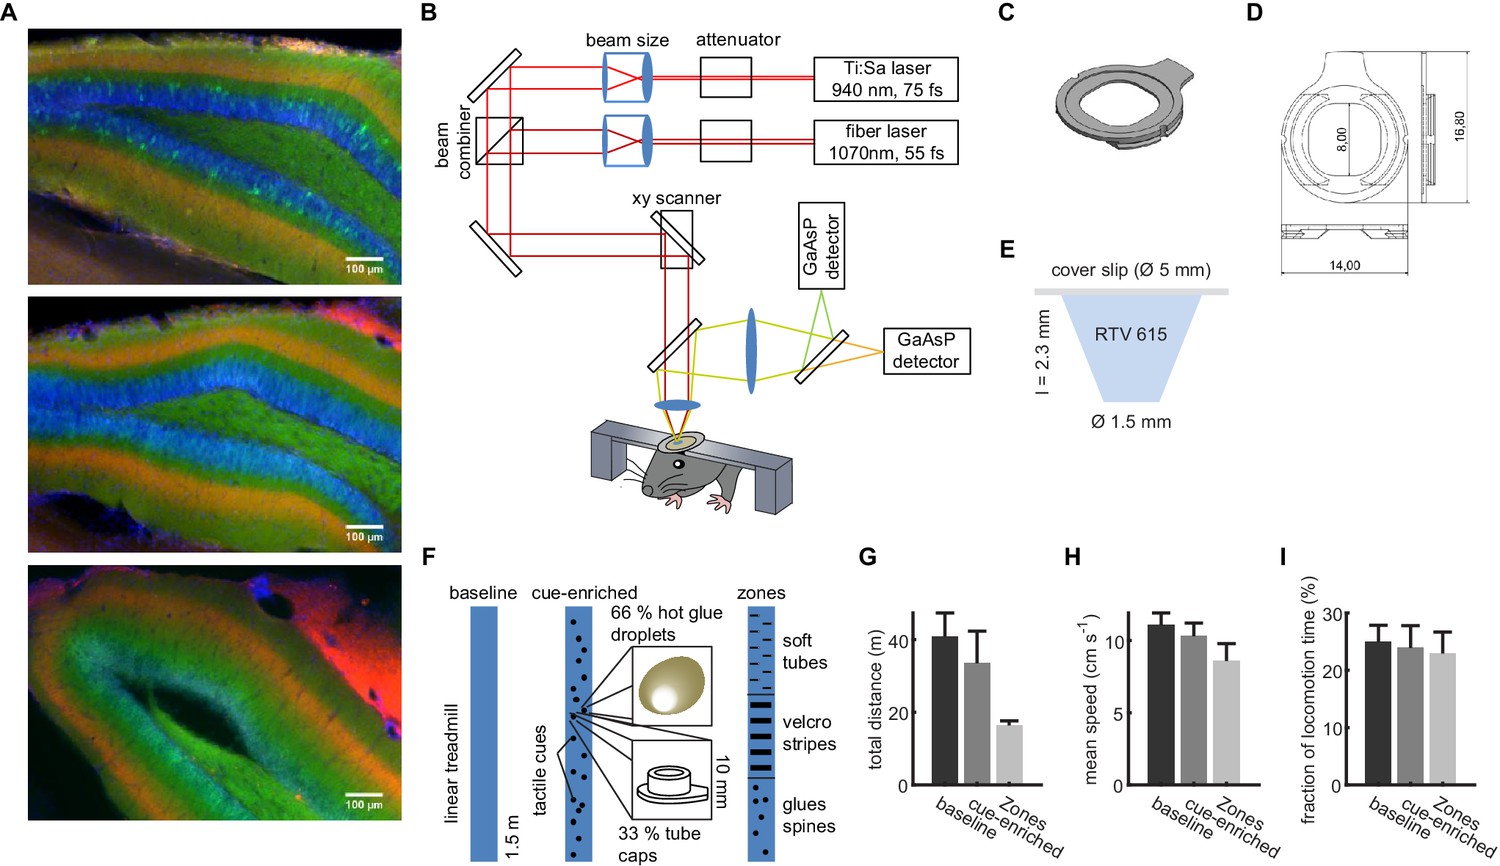
(A) Representative hippocampal sections from three different mice with expression of jRGECO in the MPP (red), GCaMP6s in granule cells (green), and DAPI as nuclear staining. (B) Setup of the two-photon microscope for dual-color two-photon imaging. To allow efficient excitation of both genetically encoded Ca2+ indicators, we established excitation with two pulsed laser sources at 940 and 1070 nm. (C, D) Dimensions of flat, custom head fixation ring. (F) Conical transparent inset used to maximize NA in deep imaging. Linked to Materials and methods. (D) Properties of the linear track designs for baseline, cue-enriched and zone configuration. (H, I, J) Locomotion on the linear track. Neither the total distance run on the linear track (D) nor the average running speed (E) nor the fraction of time spent running differed significantly between the baseline and cue-enriched and zone conditions (n.s., ANOVA, p=0.31, 0.58, and 0.67, respectively).
Figure 1—figure supplement 2
Granule cell activity during locomotion on empty textured belt.
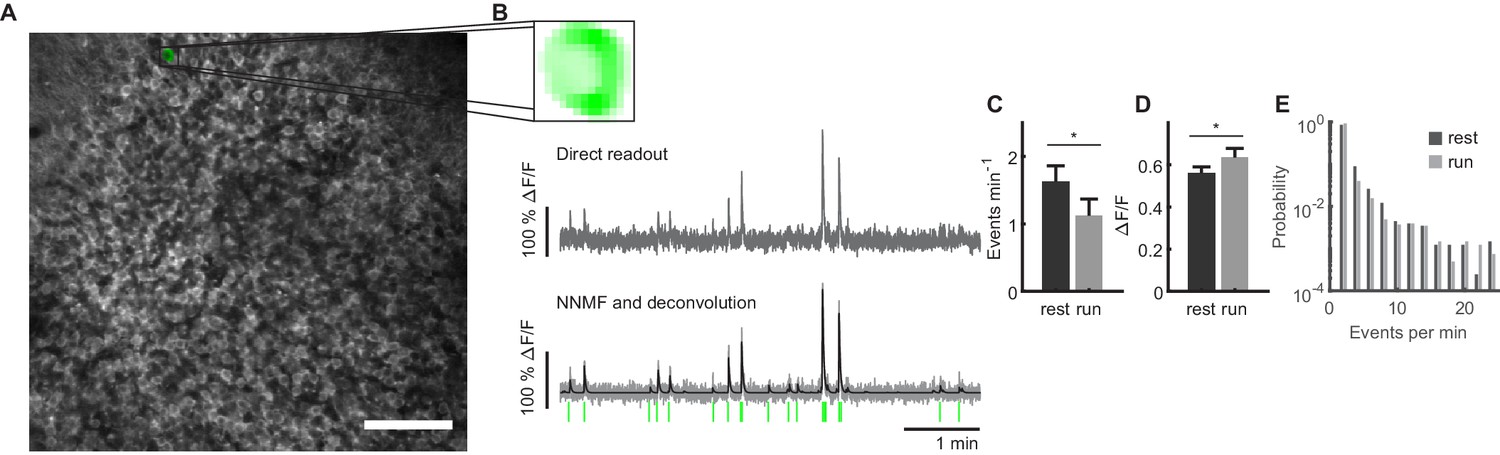
(A) Image plane for granule cell recording in the dentate gyrus. (B) One representative component of non-negative matrix factorization. Upper panel: spatial component as extracted from image stack. Middle panel: Corresponding ΔF/F trace generated from a ROI drawn around the corresponding somatic region. Lower panel: Extracted ΔF/F trace (gray) with deconvolved trace (black). Identified event onsets are depicted with vertical green lines. (C, D) Frequencies of Ca2+ events (C) and magnitude of Ca2+ transients during each recording session (D) recorded during quiet immobility (rest, dark bars) and locomotion (run, light bars) on an empty textured belt (data from three sessions per animal, n = 9 mice, comparisons between running and resting states ANOVA, n.s.). (E) Distribution of event frequencies for all cells. Black bars represent events during resting periods, gray bars represent frequencies during locomotion (data from three sessions per animal, n = 9 mice).
Figure 1—figure supplement 3

Shuffling analyses demonstrating that network events do not arise by chance.
(A) Average number of identified network events plotted against different used thresholds for the size of network events in terms of numbers of synchronously active cells (green line, shaded area depicts SEM, n = 3 mice, three sessions). Shuffled data null-distribution is created by randomly shuffling event times for every individual cell (gray line, shaded area depicts SEM). (B) Same as A, but using a shuffling approach where traces are randomly shifted with respect to each other (red line, shaded area depicts SEM). (C) Same as A and B, but using a shuffling method were event times are randomly shuffled for locomotion and immobility periods separately (Purple line, shaded area depicts SEM). (D–I) Six representative example data sets. Left panels: Raster plot of event onsets (gray dots) and identified network events (Colored dots) during episodes of locomotion and immobility (blue line). Right panels: Number of network events identified for different threshold (green lines). All three different shuffling approaches are shown in each panel gray, red, purple lines for the shuffling approaches depicted in panels (A-C) respectively. Error bars depict standard deviation. All shuffling approaches yield uniform results.
Figure 1—video 1
Video showing activity of granule cells and MPP, corresponding to Figure 1A,B.
Figure 1—video 2
Video showing network events, corresponding to Figure 1C.
Figure 2
Granule cell and MPP activity during locomotion and immobility.
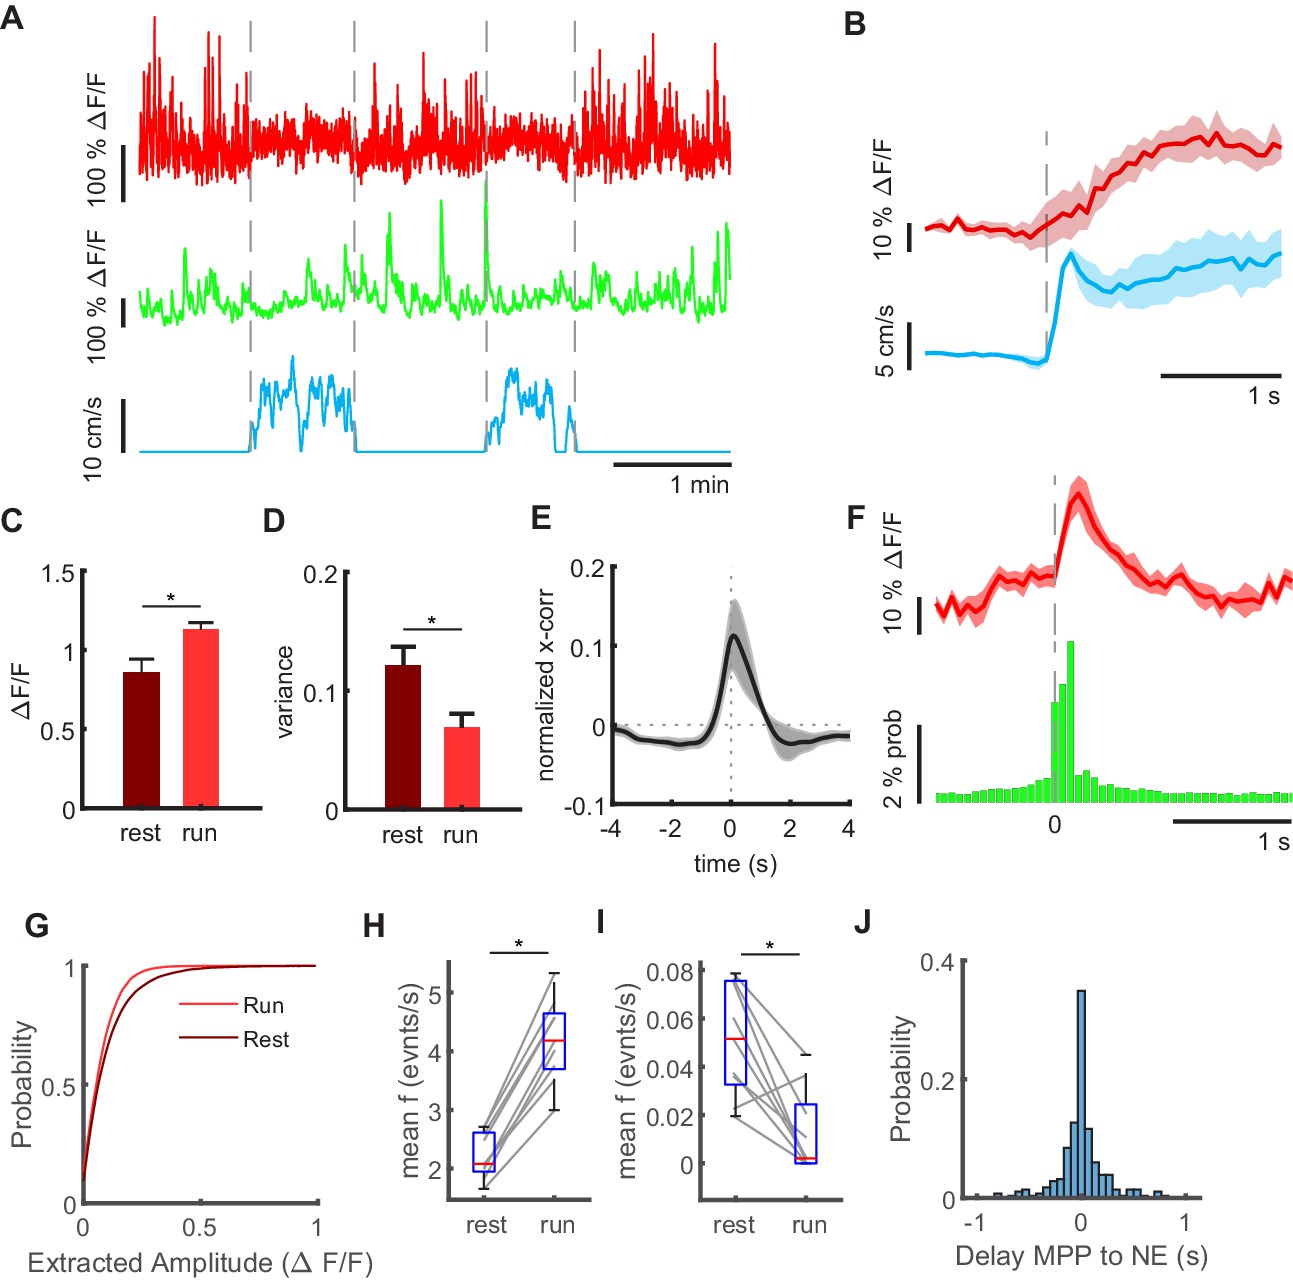
(A) Mean MPP activity (red) and the sum of all granule cell activities (green) for a representative section of a recording session in an individual mouse. Dashed lines mark transition between resting and running periods (see blue line indicating running speed). (B) Average MPP fluorescence and running speeds, both aligned to running onsets (dashed line). Shaded areas indicate standard error (n = 4 mice, one mouse had only jRGECO expression in MPP, but no granule cell signal, three sessions per mouse). (C) Mean fluorescence averaged during resting (dark red) and running (light red). Asterisk indicates 5% significance threshold (repeated measures ANOVA, F(1,3) = 7,86, p=0.032, n = 4 mice, three sessions). (D) Variance of MMP bulk signal during resting (dark red) and running (light red, n = 4). Asterisk indicates results of repeated measures ANOVA, F(1,3) = 7,07, p=0.037, n = 4 mice, three sessions. (E) Cross-correlation of MPP bulk signal and summed GC signal during resting. Shaded gray area indicates standard error. (F) Average MPP activity (red) and probability of granule cell activity across all mice, three baseline sessions each, both aligned to the time point of network events (n = 3 mice, 2008 network events, shaded red area depicts SEM). (G) Amplitudes of deconvolved events in MPP bulk data during locomotion (light red) und resting (dark red). (H) Frequencies of all deconvolved MPP bulk events during locomotion and immobility (repeated measures ANOVA, F(1,2) = 255, p=3×10⁻⁶, n = 3 mice, three sessions). (I) Frequencies of deconvolved events with amplitudes above two standard deviations (repeated measures ANOVA, F(1,2) = 27, p=2×10⁻³, n = 3 mice, three sessions). (J) Delay of NEs to the closest identified MPP event.
Figure 3
Pupil dynamics during network events.
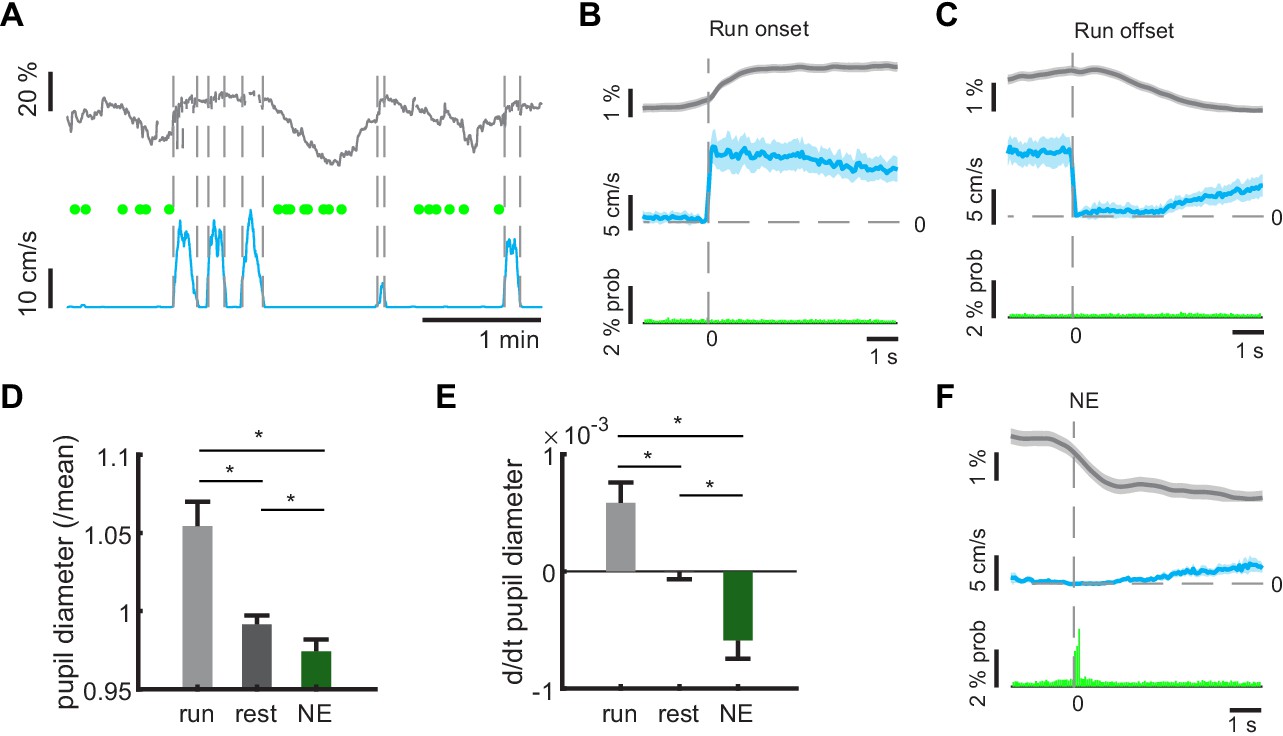
(A) Representative example of pupil size measurements during different locomotor states. Green dots indicate timepoints of network events. (B, C) Average pupil diameters (gray lines) aligned to locomotion onsets (B) or offsets (C, blue lines) reveals pupil dilation at locomotion onsets, and constriction during locomotion offset. Shaded areas indicate standard error. GC activity stays on baseline value during change of behavioral state (green). (D) Average pupil diameters during locomotion, during resting periods, and during network events. Asterisks indicate significant Bonferroni post-test at 5% level. (E) Average rate of pupil diameter change during locomotion, during resting periods, and during network events. Asterisks indicate significant Bonferroni post-test at 5% level. (F) Averaging pupil diameters aligned to NE times (green bars) reveals pupil constriction during NEs. Shaded areas indicate standard error. (n = 6 mice, three sessions). (n = 6 mice, three sessions).
Figure 4 with 1 supplement
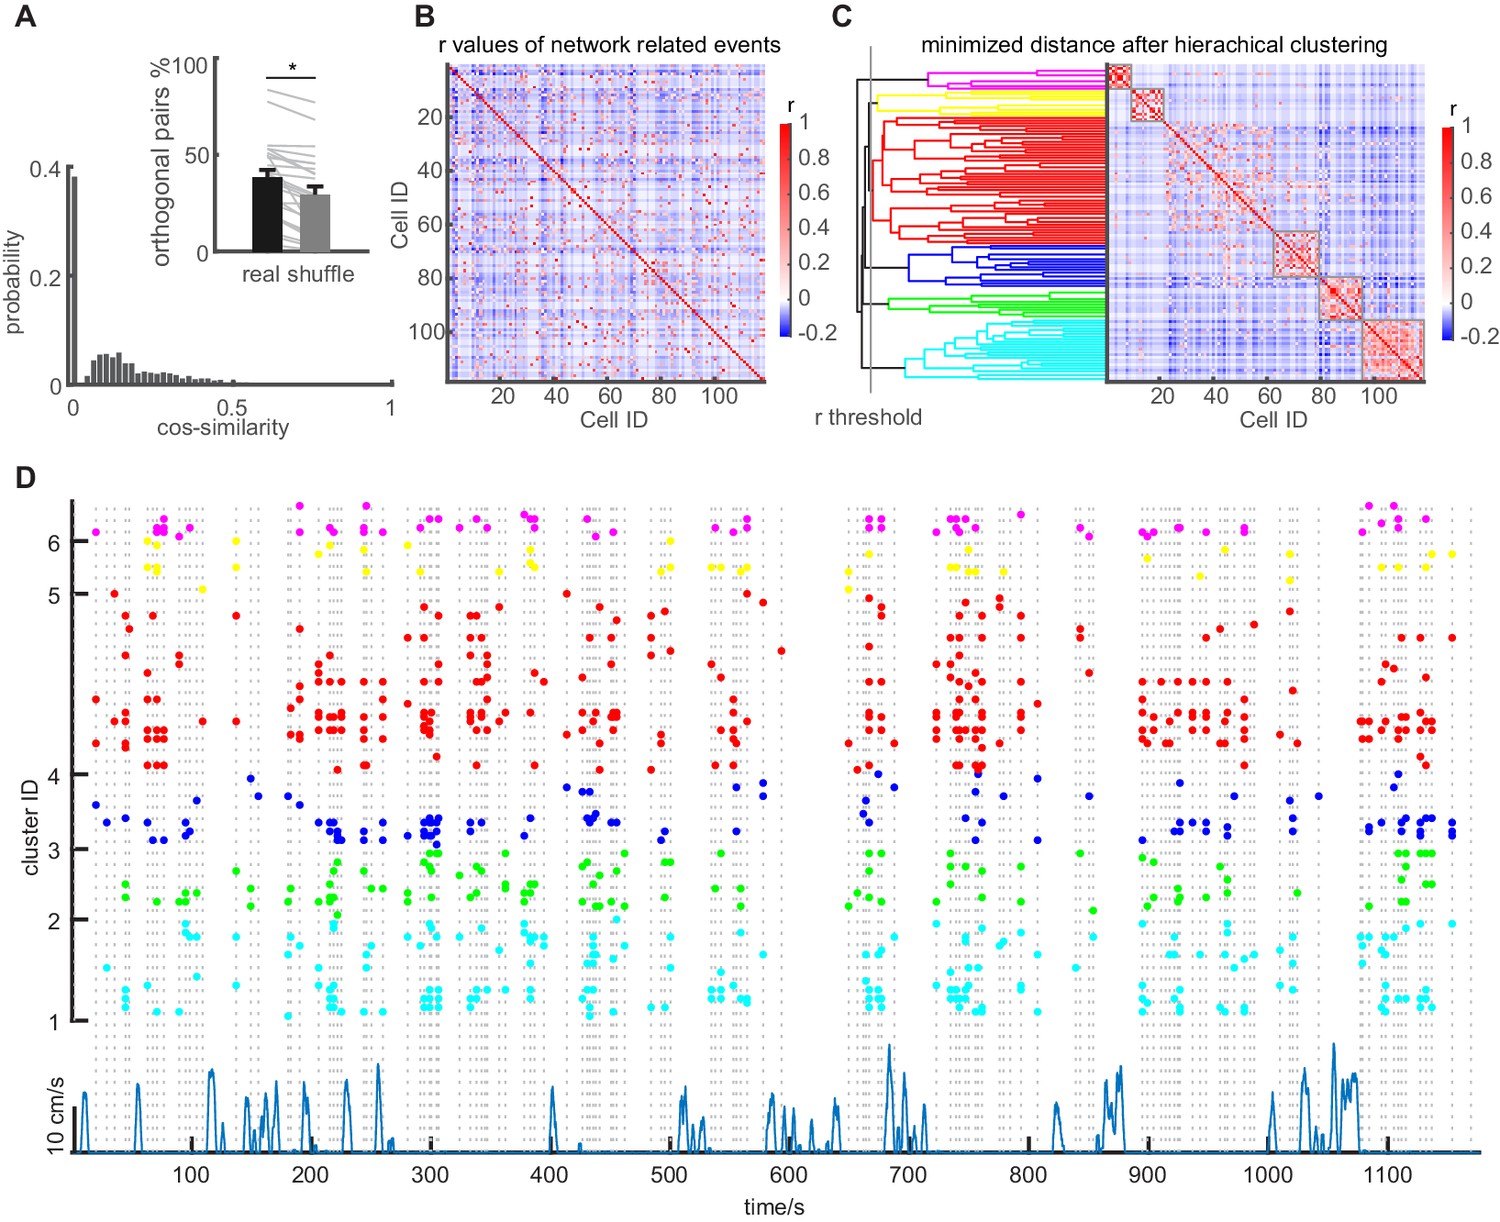
Network events are orthogonal, but repetitively recruit GC sub-ensembles.
(A) Similarity between network events. Similarity of population vectors computed for individual network events. Comparisons were carried out between all possible pairwise combinations of vectors and quantified using cosine similarity. Inset: Mean number of orthogonal NEs for baseline sessions (Black bar) compared to shuffled data (gray bar) with SEM. Gray lines depict individual sessions. (B) Graphical representation of the correlation matrix using Pearson’s r for all cell combinations, with values for r being color coded. Data from one representative session in an individual mouse. (C) Identification of clusters of correlated cells using agglomerative hierarchical clustering. Clusters were combined using a standardized Euclidean distance metric and a weighted average linkage method, until the mean of the cluster internal r-value reached a significance threshold. The 5% significance threshold was defined by creating a null-distribution of r values from randomized data sets, and is indicated for this particular experiment with a vertical line. Right panel in C depicts the reordered correlation matrix showing clusters of highly correlated cells. Only clusters whose mean intra-correlation exceeded the threshold were included in further analysis (significant clusters indicated with gray frames). (D) Raster plot showing the reactivation of clusters identified in panel C during multiple episodes of running and immobility. Individual dots indicate participation of individual cells. Clusters are color-coded according to the agglomerative tree. Network events are indicated by vertical dashed lines. Running episodes are indicated at the lower border with the running speed (blue).
Figure 4—figure supplement 1
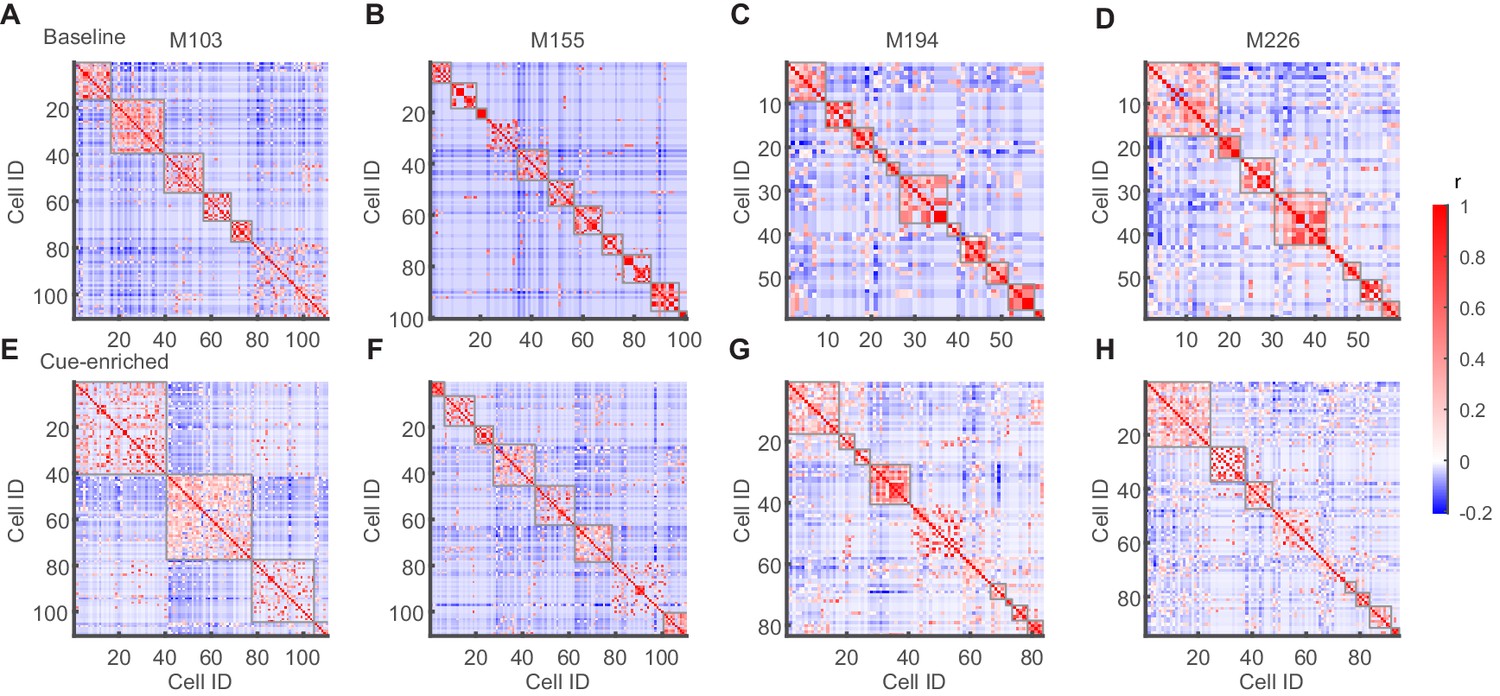
Clustering of cells active during network events into correlated sub-ensembles via a correlation matrix.
(A–H) Examples of correlation matrices after hierarchical clustering from four of the nine mice investigated. Those clusters with an intra-cluster correlation above threshold that were considered for further analysis are indicated with a gray frame. Upper row (A–D) shows baseline condition and lower row (E–H) cue-enriched condition.
Figure 5 with 1 supplement
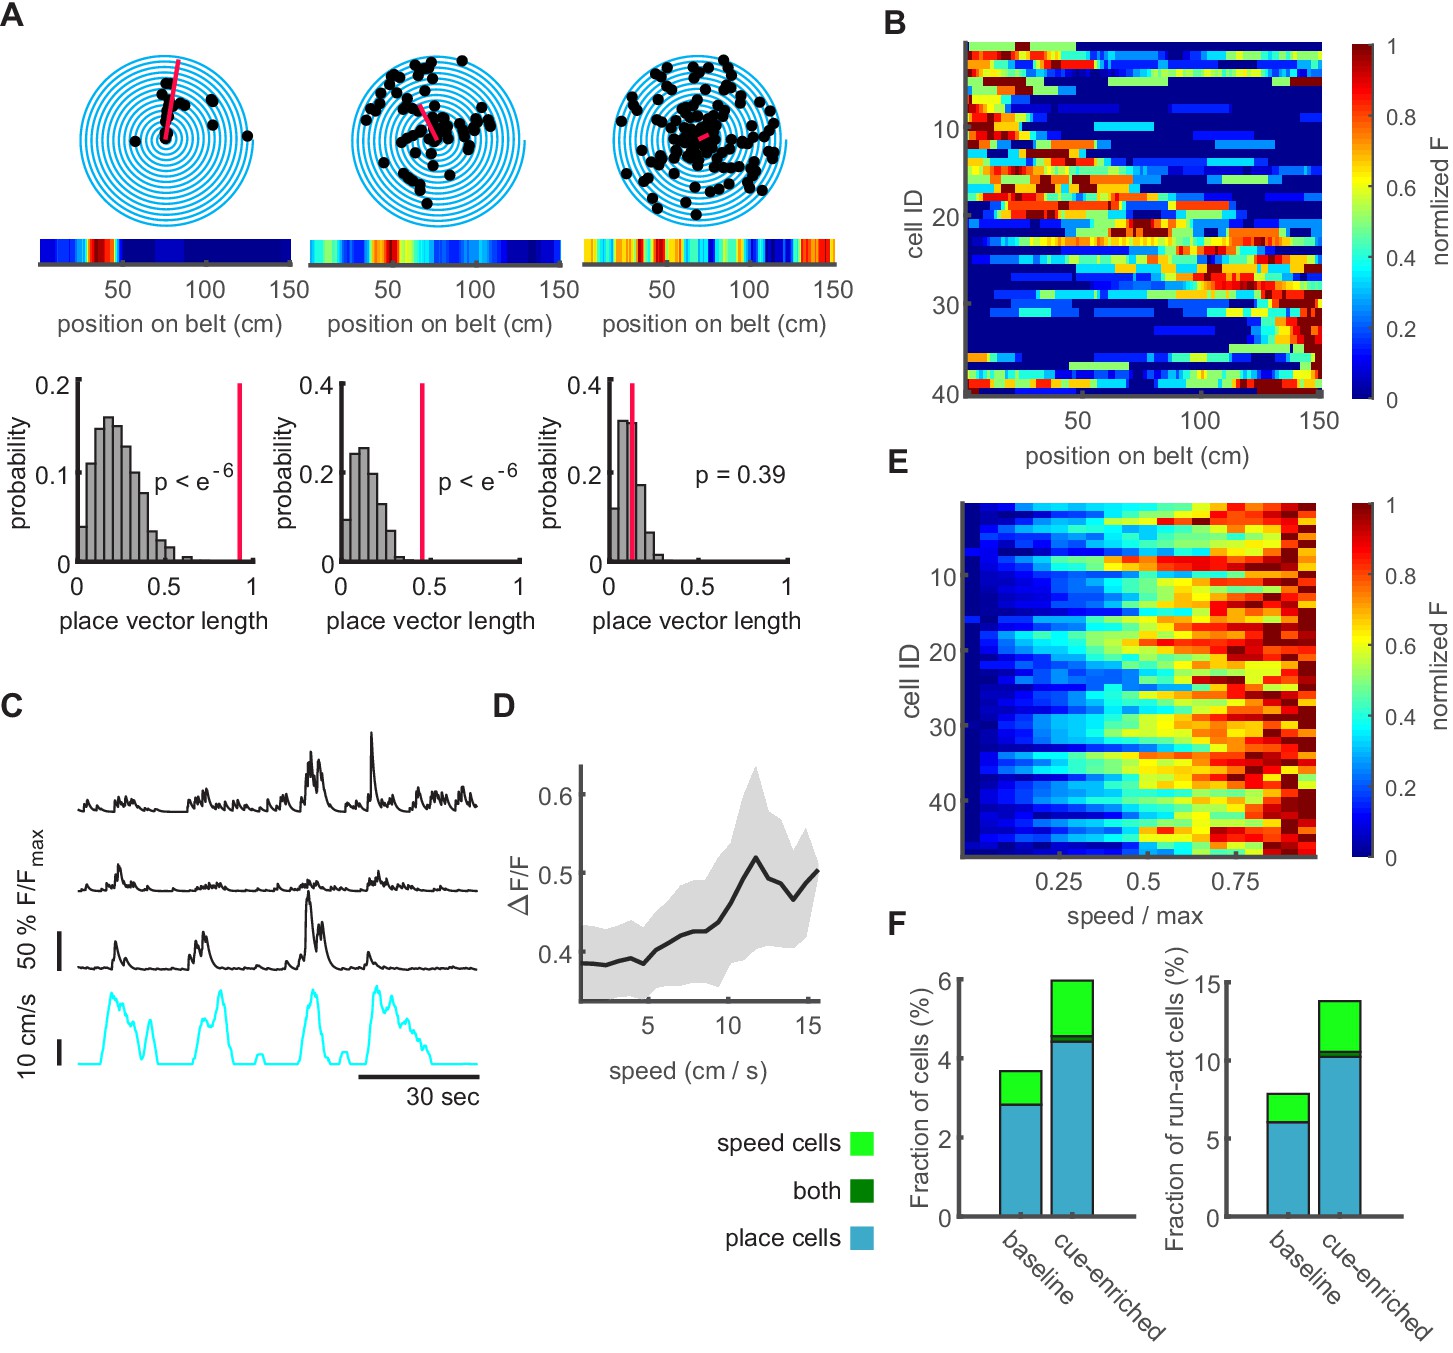
Characterization of dentate gyrus place and speed neurons.
(A B) Place cells in the dentate gyrus. (A) Representative polar plots of two significantly place-coding granule cells (left, middle), and one without significant place preference (right). Place coding is depicted as spiral plot, where each 360° turn of the spiral represents a transition through the 1.5 m linear track without additional cues (baseline condition). Detected events are shown as black dots. The red line represents the place vector. The corresponding heatmap of normalized fluorescence is shown in the inset. In lower panels, the distributions for place vector lengths generated from shuffled data (see Materials and methods) are shown (gray histograms), the place vector for the individual cell is indicated by the red line. (B) Place field heatmaps of cells showing significant place preference. (C) Representative examples of three significantly speed-modulated neurons (black traces, running speed depicted in cyan). (D) Speed-modulated mean fluorescence signal of a representative example cell. Gray area indicates standard error. (E) Mean fluorescence signals of all significantly speed-modulated cells. Normalized fluorescence is color coded and running speed is normalized to every individual mouse maximum running speed. (F) Fractions of place and speed coding cells (cyan and green bar, respectively) normalized to all active cells (left panel) and only running active cells (right panel). Only a very small number of cells carried encoded both features (dark green bar).
Figure 5—figure supplement 1

Activity of granule cells and MPP inputs in cue-enriched conditions.
(A) Average frequencies of Ca2+ events (A) for baseline and cue-enriched conditions recorded during quiet immobility (rest, dark bars) and running (run, light bars). Data from n = 9 mice, last baseline session and cue-enriched session for panels A and B (2-way ANOVA, run vs. rest: F(1,32) = 1.71, p=0.20, baseline vs cue-enriched F(1,32) = 1.80, p=0.19). (B), Same as A for the magnitude of Ca2+ transients (2-way ANOVA, run vs. rest: F(1,32) = 1.67, p=0.21, baseline vs cue-enriched F(1,32) < 0.01, p=0.99) (C), Distribution of event frequencies for all cells for the cue-enriched condition. (D) Under cue-enriched conditions, network events also occurred mainly during immobility. Mean number of network events per recording session during running (light green) and resting (dark green). Gray bars depict shuffled data for each condition. Section sign indicates ANOVA F(3,28) = 8.6, p=0.0003, asterisk indicates Bonferroni post-test resting vs. shuffled p=0.0019. (E) Cos-similarity between network events under cue-enriched conditions. Similarity of population vectors computed for individual network events. Comparisons were carried out between all possible pairwise combinations of vectors and quantified using cosine similarity. The number of orthogonal network events were significantly higher than expected by chance (Comparison shuffled vs. real data, Wilcoxon signed rank test p=0.031). (F–J) Activity of MPP inputs in the cue-enriched condition. Data from n = 4 mice, one mouse included additionally to Figure 1F that had only jRGECO expression in MPP, but no granule cell signal for panels G-J. Shaded areas indicate standard errors. (F) Mean fluorescence averaged during resting (dark red) and running (light red, n = 4) in cue-enriched trials. ANOVA for running vs. immobile states F(1,3) = 9.64, p=0.02. (G) Variance of MPP bulk signal during resting (dark red) and running (light red, n = 4) in cue-enriched trials. ANOVA for running vs. Immobile states n.s. (H) Cross correlation of MPP bulk signal and summed GC signal during resting. Gray shaded area indicates standard error. (I) In cue-enriched conditions, MPP activity also increases at transitions from immobility to running (red line, MPP activity, blue line indicates running speed, n = 4). (J) Average MPP activity (red) and probability of granule cells being active in cue-enriched trials, both aligned to the time point of network events. Red shaded areas indicate standard error.
Figure 6
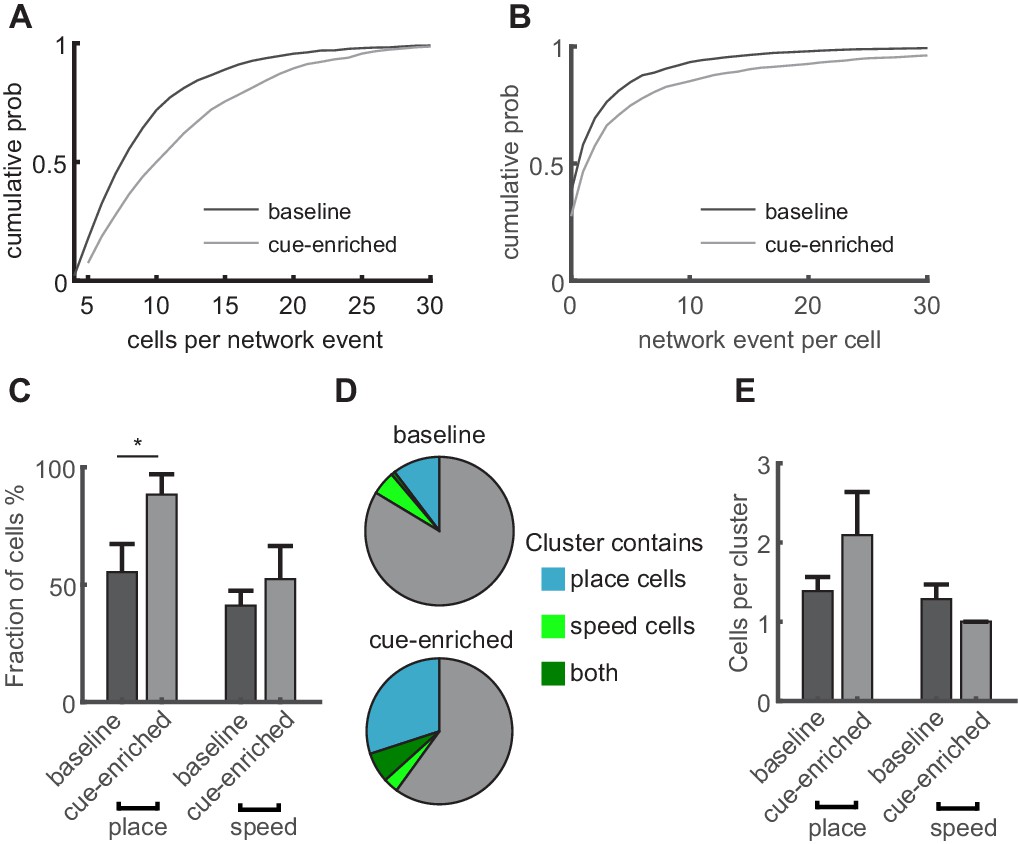
Increasing sensory cues is associated with enlargement of network events and increased incorporation of place cells.
(A) Network events comprise more granule cells in cue-enriched environments. Cumulative probability of network event size (number of cells per network event) for baseline and cue enriched condition (dark and light gray lines, respectively). (B) Cumulative probability of participation in multiple network events per cell for baseline and cue enriched condition (dark and light gray lines, respectively). (C) Fraction of place and speed cells that participate in network events (total number of place/speed cells equals 100%). (D) Relation of place and speed cells to correlated cell clusters (c.f. Figure 4). Fraction of the total number of clusters containing place cells (cyan), speed cells (light green), or both (dark green). Gray indicates clusters containing neither place nor speed cells. (E) Mean number of place and speed cells per cluster, in baseline and cue-enriched conditions, n = 9 mice.
Figure 7 with 3 supplements
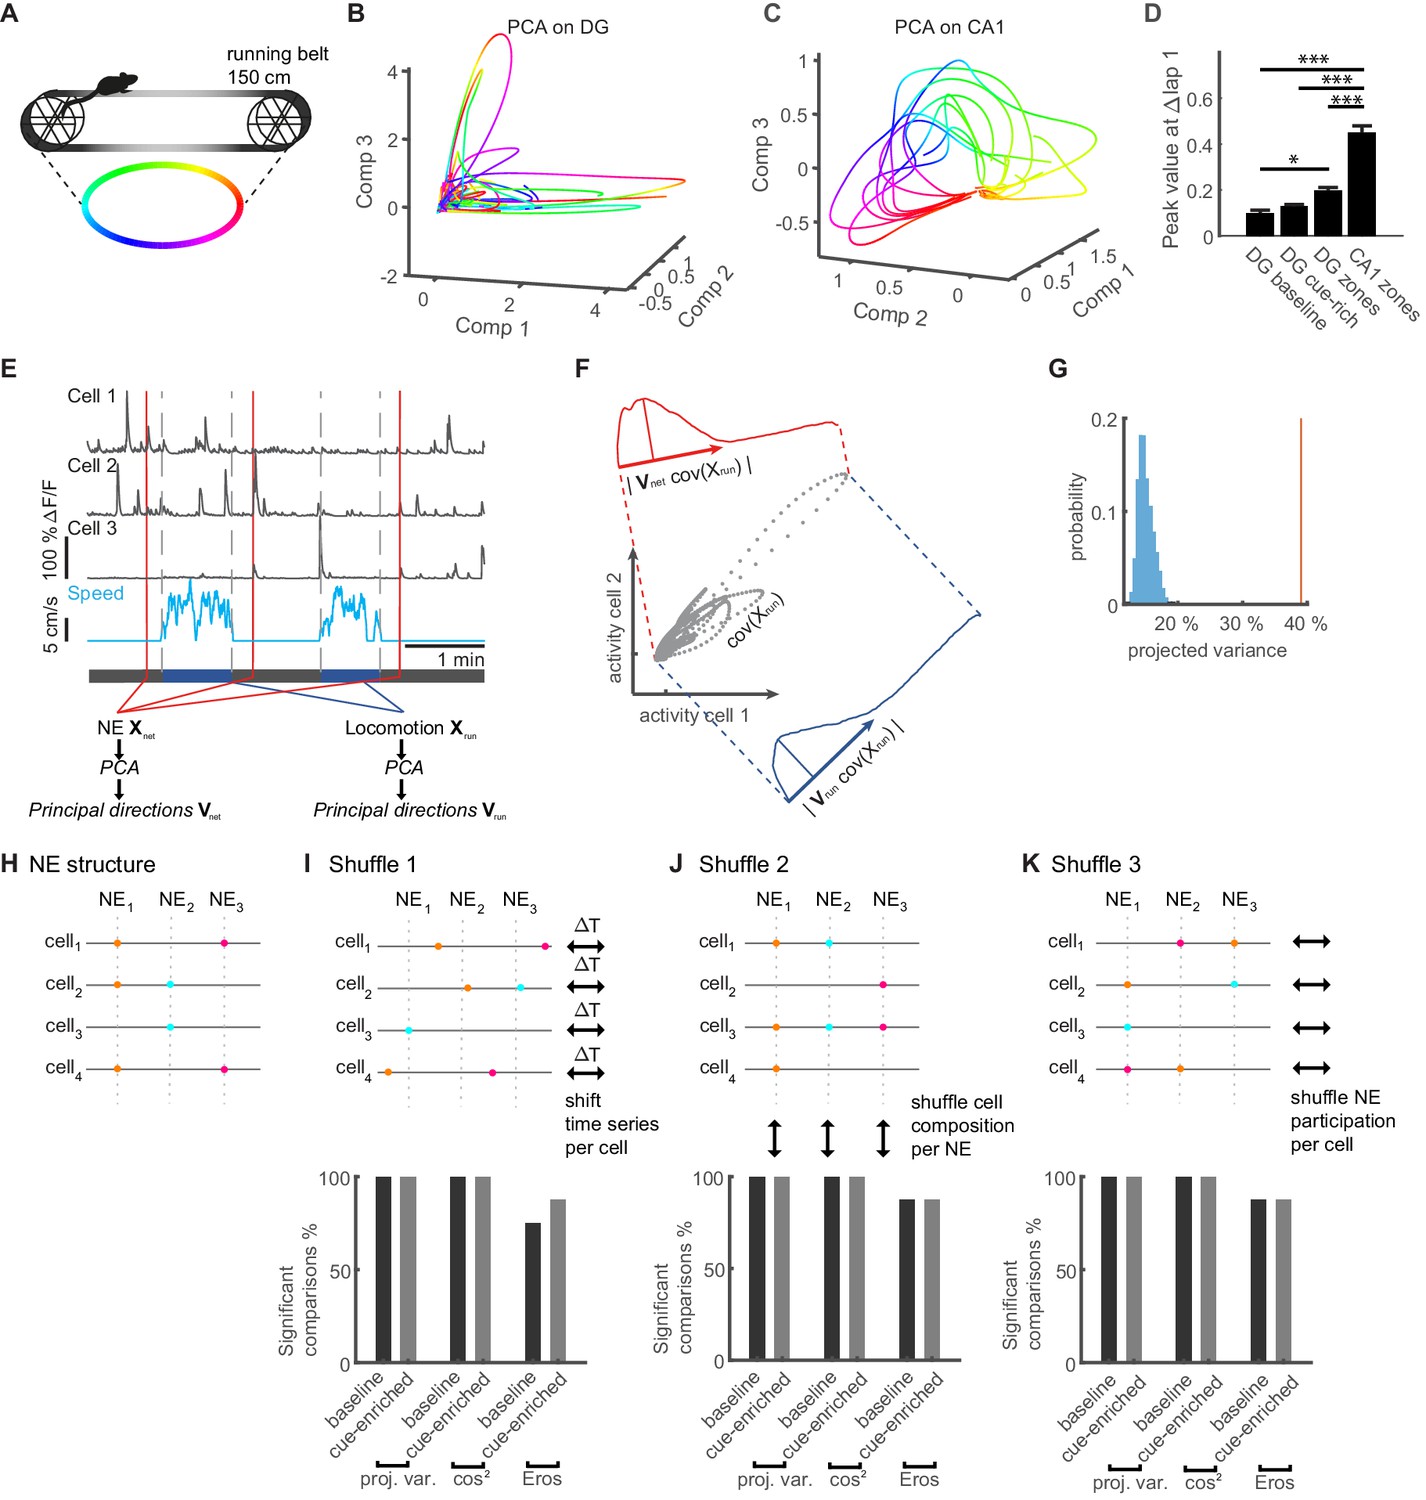
Similarity of activity patterns during network events to population patterns during locomotion.
(A) Color code for position on the linear track used in panels B. (B) Trajectories during an individual representative session plotted in a three-dimensional coordinate system corresponding to the first three PCA components (Comp 1–3). (C) Trajectories calculated from CA1 Ca2+-imaging data during an individual representative session for comparison. (D) Average peak value of weight-autocorrelations at Δlap = 1 (ANOVA, F(1,3) = 88.32, p=2×10⁻³⁰, * Bonferroni post-test at p<0.05, *** Bonferroni post-test at p<0.001). (E) Schematic of the procedure for comparing population activity during network events (NE) and locomotion. Population activity is represented by three cells (upper traces), recorded during running and quiet immobility (blue trace indicates speed). Time point of three network events is indicated schematically by red lines. Activity during network events (NE) was used to perform PCA, computing the transformation matrix Vnet. Similarly, PCA was performed on the neuronal population activity only from running periods (speed indicated in blue, bordered by vertical gray dashed lines), to generate the transformation matrix Vrun representing the covarying activity during locomotion. (F) Schematic description of the procedure for projecting co-variances of running activity into the PCA basis of network events (or shuffled data). Gray dots show covarying activity of two representative cells during running. The blue graph denotes the projection into the locomotion PCA-space using Vrun and the width of the distribution shows the projected variance. The red graph shows the same information for the network space using Vnet. (G) Individual example of shuffle analysis for a representative session. The vertical red line indicates the observed projected variance explained normalized to variance explained in the original space (50% of the overall variance). The observed variance explained is larger than the shuffled distribution (blue bars), indicating that the population activity during locomotion and network events is more similar than expected by chance (i.e. for network activity without correlations). (H) Cartoon illustrating NE structure for four cells and three synchronous events. (I) Upper panel: Cartoon illustrating the first shuffling procedure where each cells time series is shifted by a randomized time interval. Lower panel: Fraction of sessions in which comparisons of population activity were significant vs. chance level for the two cue conditions and all similarity measures (n = 8 mice, one session per condition, see Figure 7—figure supplement 3 for comparisons to shuffled datasets for all sessions). (J) Upper panel: Cartoon illustrating the second shuffling procedure where cell IDs within each NE are randomly shuffled. This approach randomizes NE-composition while maintaining the number of cells per NE. Lower panel: Analogous to I. (K) Upper panel: Cartoon illustrating the third shuffling procedure where the NE participation is randomly shuffled for each cell. This approach randomizes NE-participation while maintaining the activity level for each cell. Lower panel: Analogous to I.
Figure 7—figure supplement 1
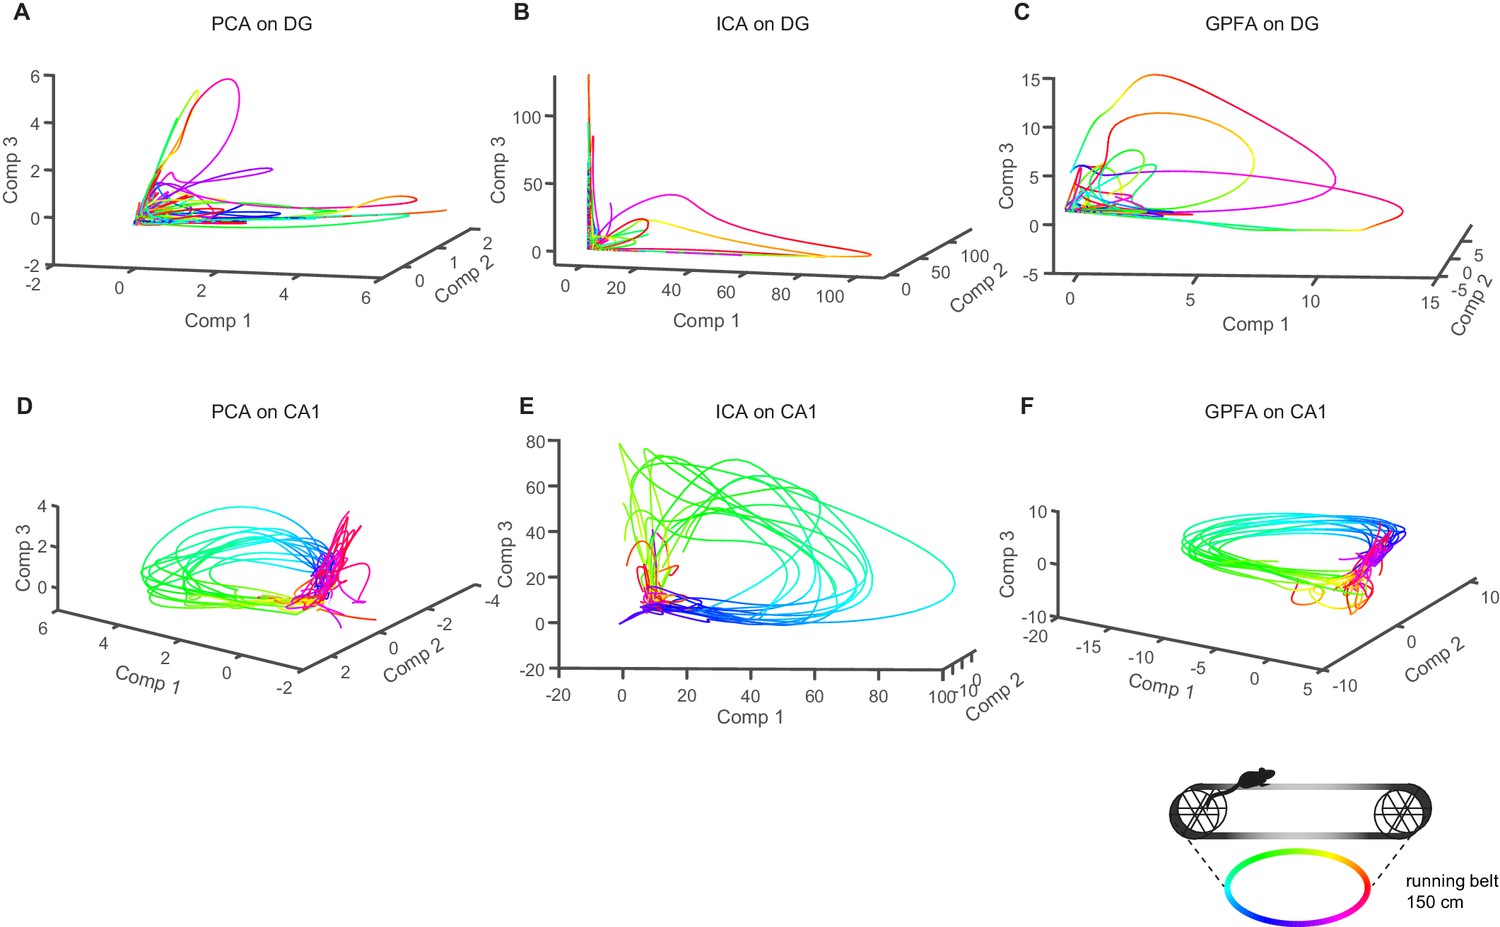
Analysis of population activity in dentate gyrus and the CA1 subfield of the hippocampus using PCA, ICA, and GPFA.
(A-C) Upper panels depict the first three components from representative sessions (A: PCA, B: ICA, C: GPFA) plotted in a coordinate system. The color code refers to the place on the linear track, with the same locations represented in the same color. (D–F) As in (A-C), but for CA1 neurons. Note the smooth and repetitive trajectories. Linked to Figure 7.
Figure 7—figure supplement 2
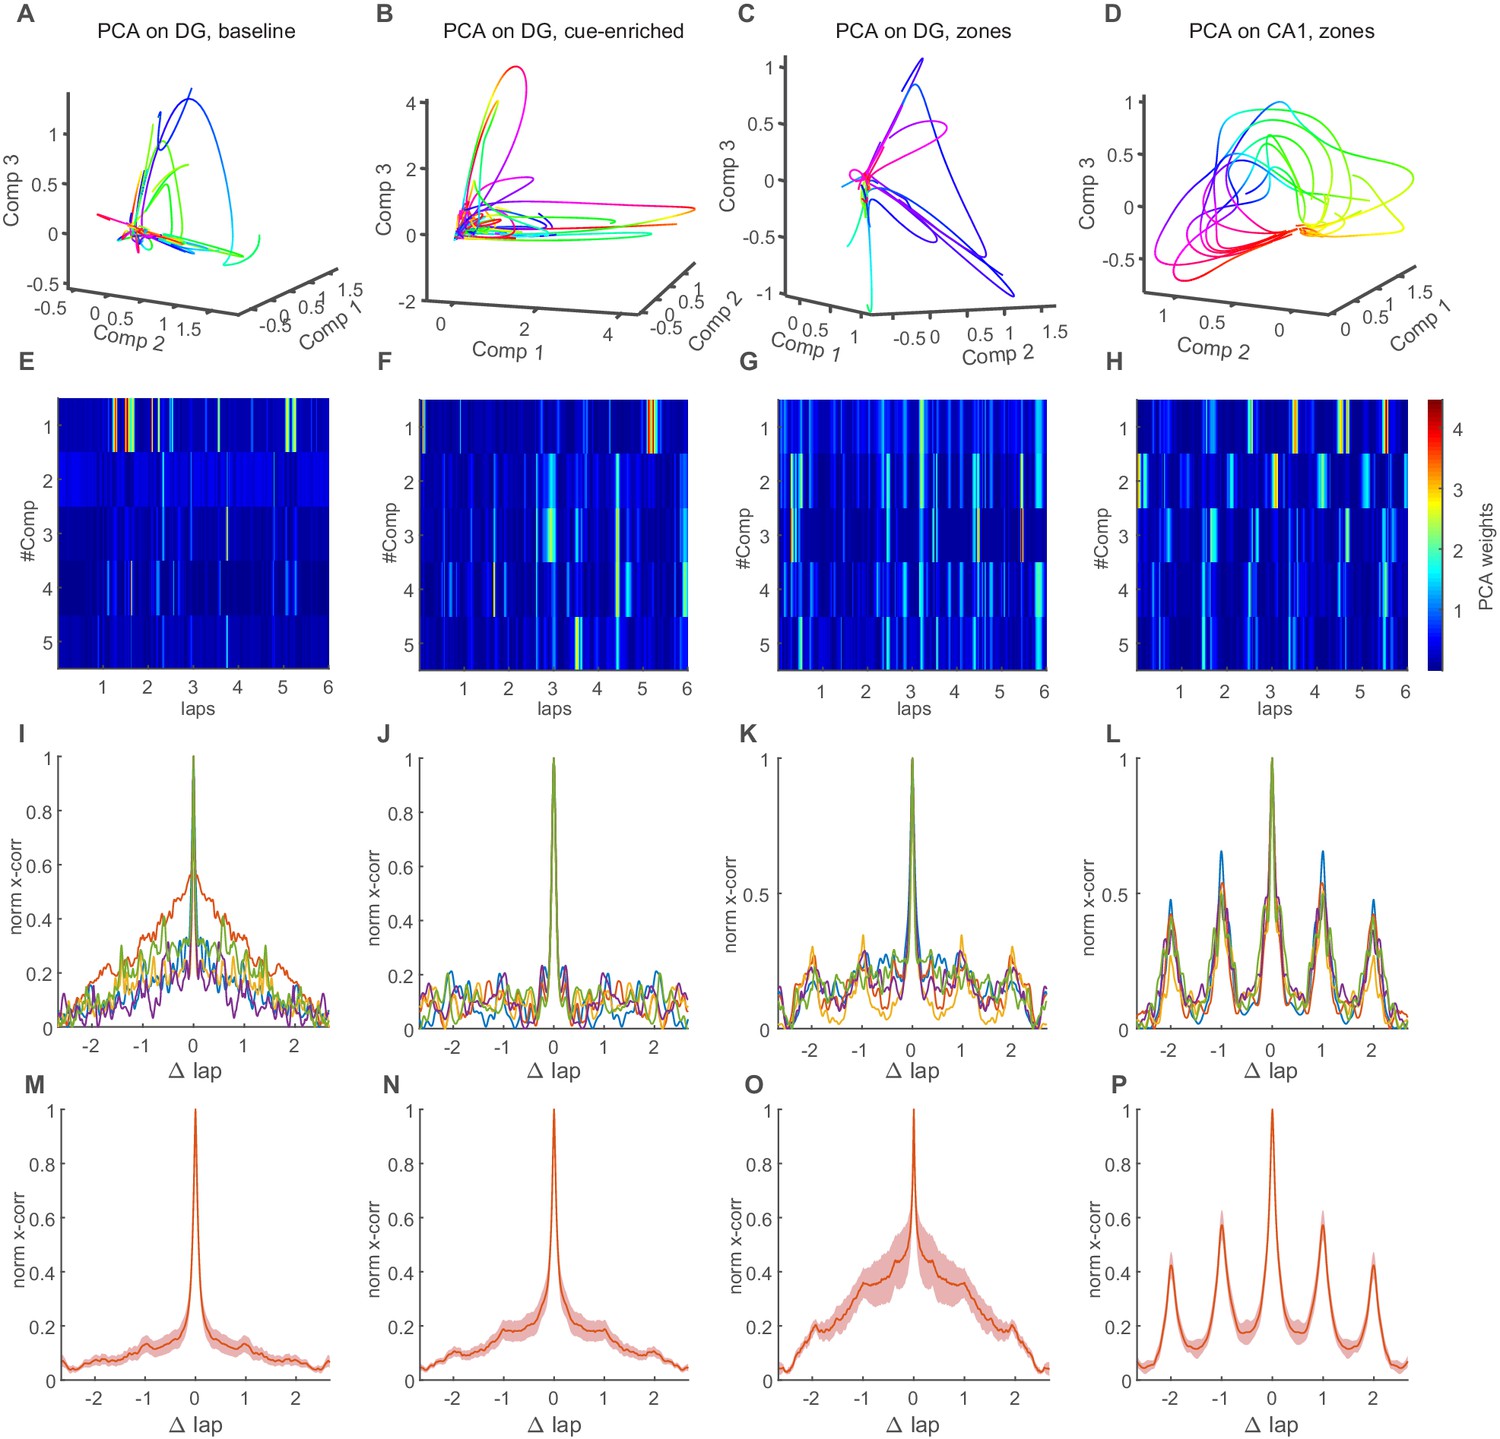
PCA-based analysis of spatial representation in DG and CA1.
(A-D) Trajectories of first three components for DG example recordings in different environments (A-C for baseline, cue-enriched and zones, respectively) and CA1 data (D). The animals’ position is color coded analogous to Figure 7—figure supplement 1. (E–H) Weights of five first principal components plotted against the animal position during the first six laps of the recording. (I–L) Normalized autocorrelation of five first PCA-weights from example data calculated with respect to different laps. Place information in weights leads to peaks at integer multiples of Δlap. (M–P) Autocorrelations from five first components averaged for all animals (n = 9 animals for baseline and cue-enriched, n = 3 animals for DG zones, n = 5 animals for CA1).
Figure 7—figure supplement 3
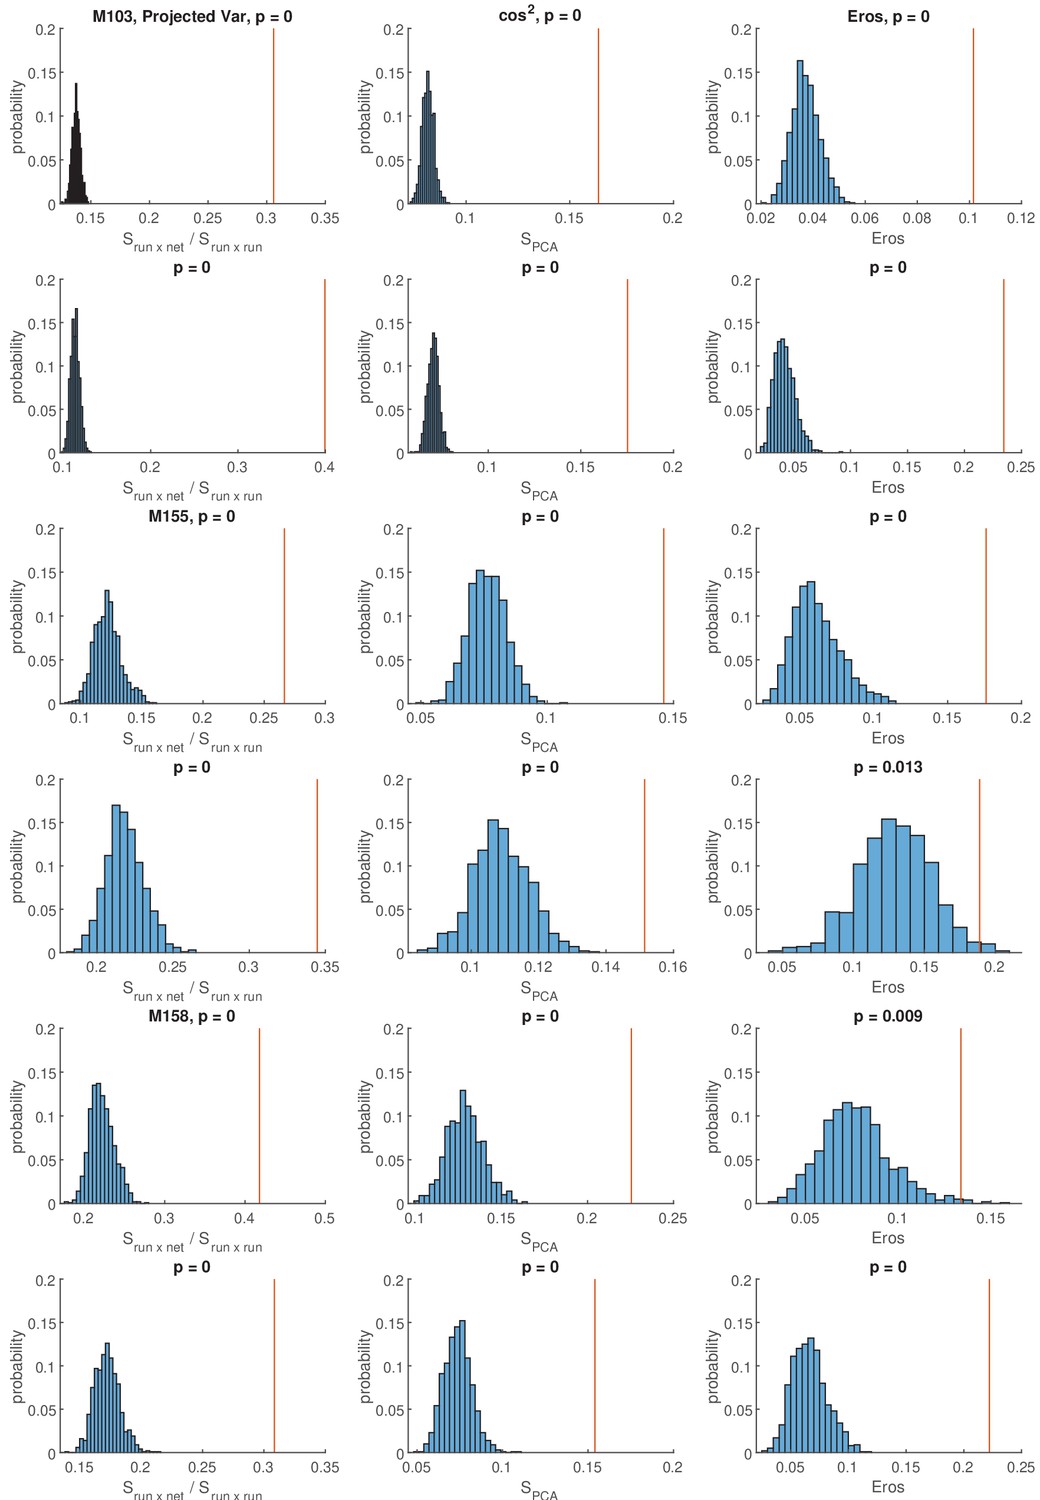
Similarity of individual network events to population activity during running.
Data from all sessions under baseline and cue-enriched conditions are depicted (as indicated on the leftmost border of the figure) for all three measures. PCA similarity using the vector projection method introduced in this paper (see Materials and methods), cosine similarity measures (Krzanowski, 1979) and EROS (Yang and Shahabi, 2004) are depicted in the leftmost, middle and rightmost columns, respectively. In all graphs, shuffled data distributions generated with shuffle method one are shown in light blue, a vertical red line indicates the observed similarity value between network and locomotion related population activity in the particular session. p-Values are indicated above each graph. In the variance projection method, values were normalized to the locomotion related variances projected into the locomotor states. As expected, this results in a high proportion of explained variance. Linked to Figure 7.
Figure 8 with 3 supplements
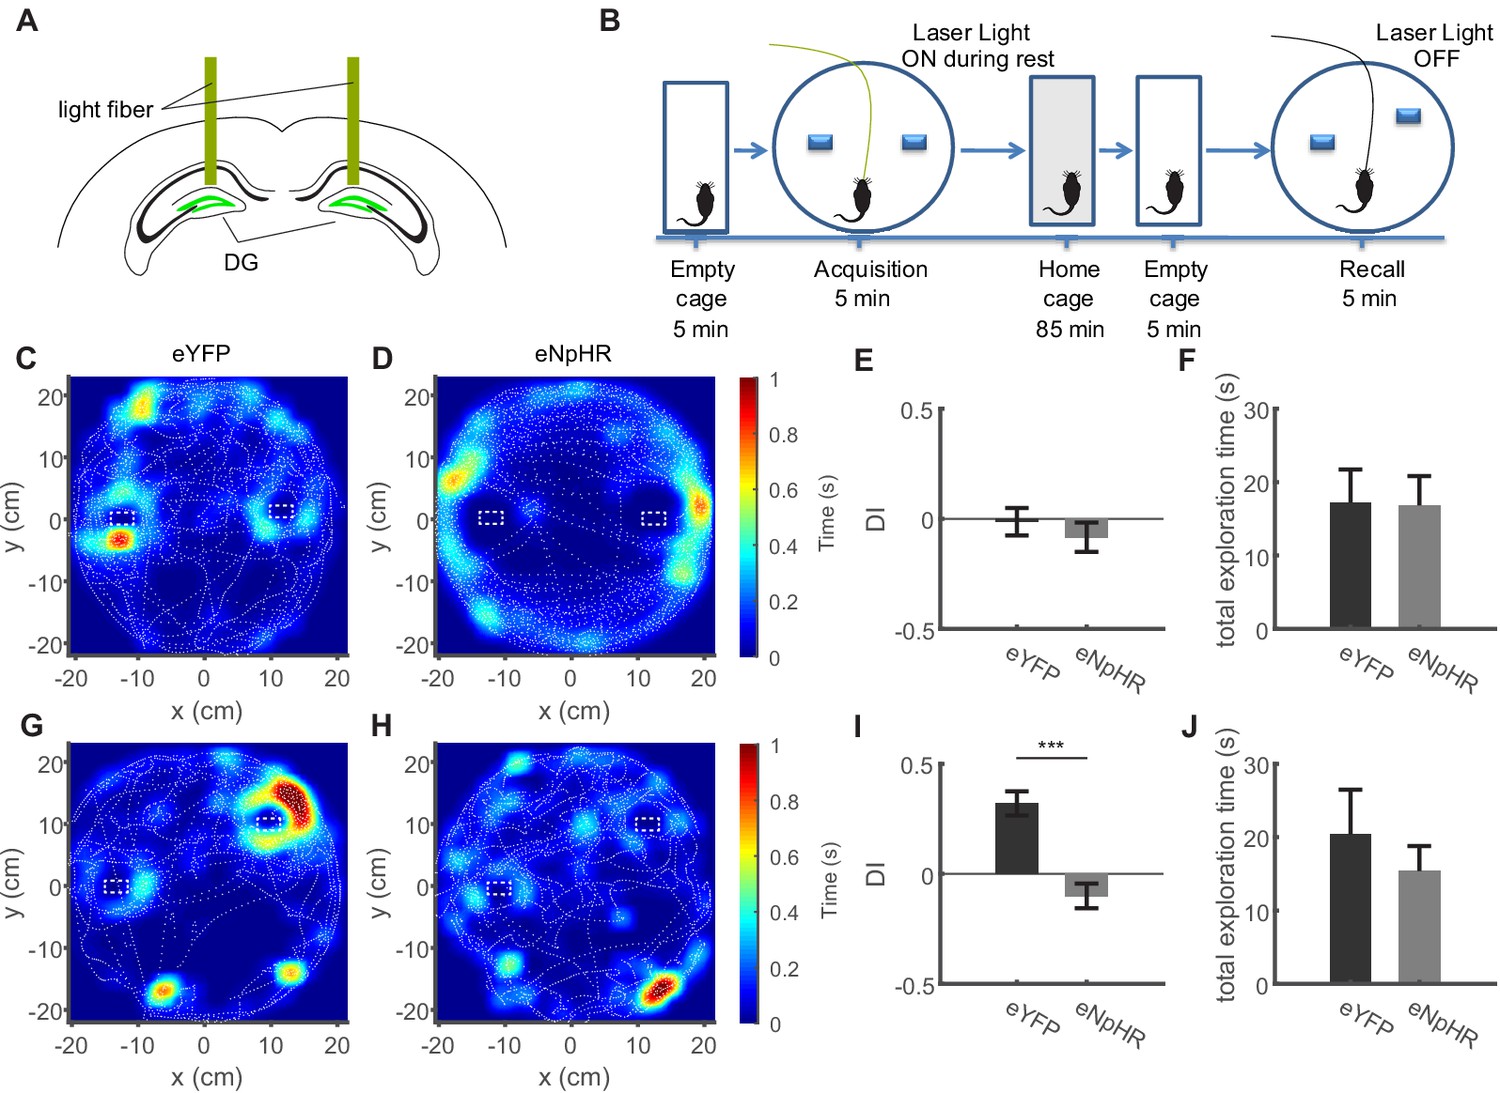
Inhibition of dentate granule cell activity during immobility prevents memory acquisition.
(A) Schematic of the bilateral optogenetic inhibition of the dentate gyrus granule cells expressing eNpHR. (B) Schematic of the experimental procedure. In the acquisition phase, mice were familiarized with an arena containing two objects. Following an intermediate period of 90 min, the mice were placed in the same arena in which one object was moved slightly. (C, D) Representative sessions from acquisition trials in control (eYFP) mice and mice expressing eNpHR in granule cells showing the tracking of the mouse center of mass (dashed white lines), as well as normalized occupancy within the arena. (E) Discrimination index from the acquisition trial quantifying the specific exploration activity of the objects relative to one another (see Materials and methods), with 0 values indicating equal exploration (see Materials and methods). (F) Total time spent exploring the objects in the eYFP and eNpHR groups during the acquisition trial. (G, H) Representative sessions from recall trials depicted as shown in B, C. (I) Discrimination index for recall trials, showing strong preference for the displaced object in the eYFP group, but not the eNpHR group if granule cell activity was inhibited during acquisition trials only during immobility. (J) Total time spent exploring the objects in the eYFP and eNpHR groups during the recall trial (n = 6 animals for eNpHR group, n = 9 animals for eYFP group).
Figure 8—figure supplement 1
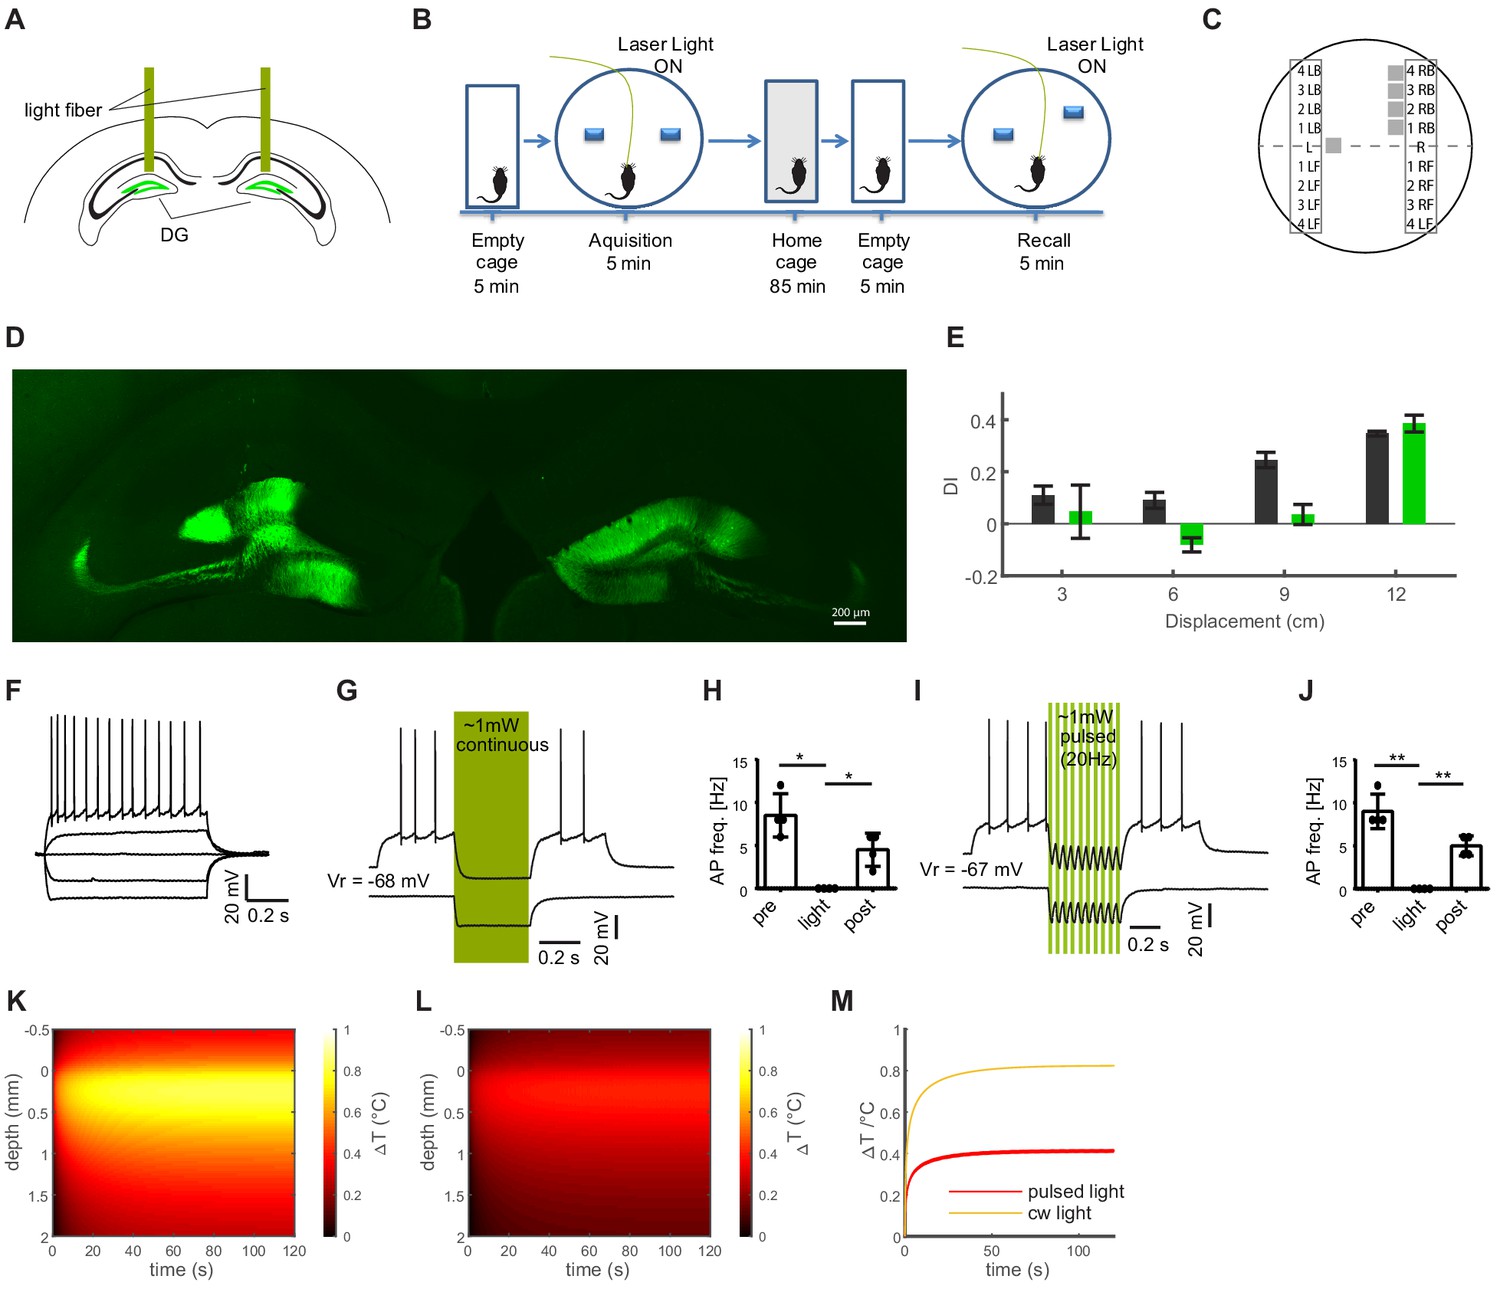
Establishing a dentate gyrus-dependent variant of the object pattern separation task.
(A) Schematic of the bilateral optogenetic inhibition of the dentate gyrus granule cells expressing eNpHR. (B) Description of the task. Following familiarization with the object location, one of the objects is moved in a subsequent recall session, and the extent to which mice explore the moved vs. stationary object is examined. These trials can be repeated allowing to explore the effects of variable movement of the objects. (C) Schematic of possible object locations for the displaced object. Displacement was randomized for each animal, such that either the left or the right object was displaced, in either a forward or back direction (LB i.e. corresponding to left, back, and RF to right, forward). The experiment used four possible new locations along a vertical axis, increasing from minor displacement (3 cm) to maximal displacement, indicated by numbers 1-4. (D) Stitched wide-field image of a hippocampal slice showing expression of NpHR-eYFP in both DGs. (E) Results of light-based inhibition of granule cells during acquisition and recall trials for different degrees of object separation indicate on the x-axis (eNpHR group, n = 4, green bars) vs. an eYFP expressing control group (n = 3, black bars). The effect of granule cell inhibition is most pronounced for intermediate degrees of object movement. (F) Representative, typical discharge behavior of a granule cell. (G) Inhibition of granule cell firing evoked with long current injections by light-based activation of NpHR (green vertical bars) with continuous stimulation. (H) Quantification of firing rates before, during and after illumination for continuous stimulation (ANOVA, F(2,5) = 28.30, p=0.001, Dunnett’s multiple comparison test, asterisks indicate 5% significance level). (I) like F with pulsed stimulation at 50% duty cycle and 20 Hz (d). (J) like G with pulsed stimulation (ANOVA, F(2,5) = 61.00, p=0.001, Dunnett’s multiple comparison test, asterisks indicate 5% significance level). (K, L) Estimation of light-induced warming within brain tissue for continuous illumination (K) or pulsed illumination at 50% duty cycle and 20 Hz (L) at intensities used for the behavioral experiments. Predicted temperature changes are plotted as a function of time and depth. (M) Analysis of warming over time, showing that the warming effects of pulsed light stimulation are asymptotic, and remain below 0.4°C at a distance of 300 µm from the fiber front end. Linked to Figure 8.
Figure 8—figure supplement 2
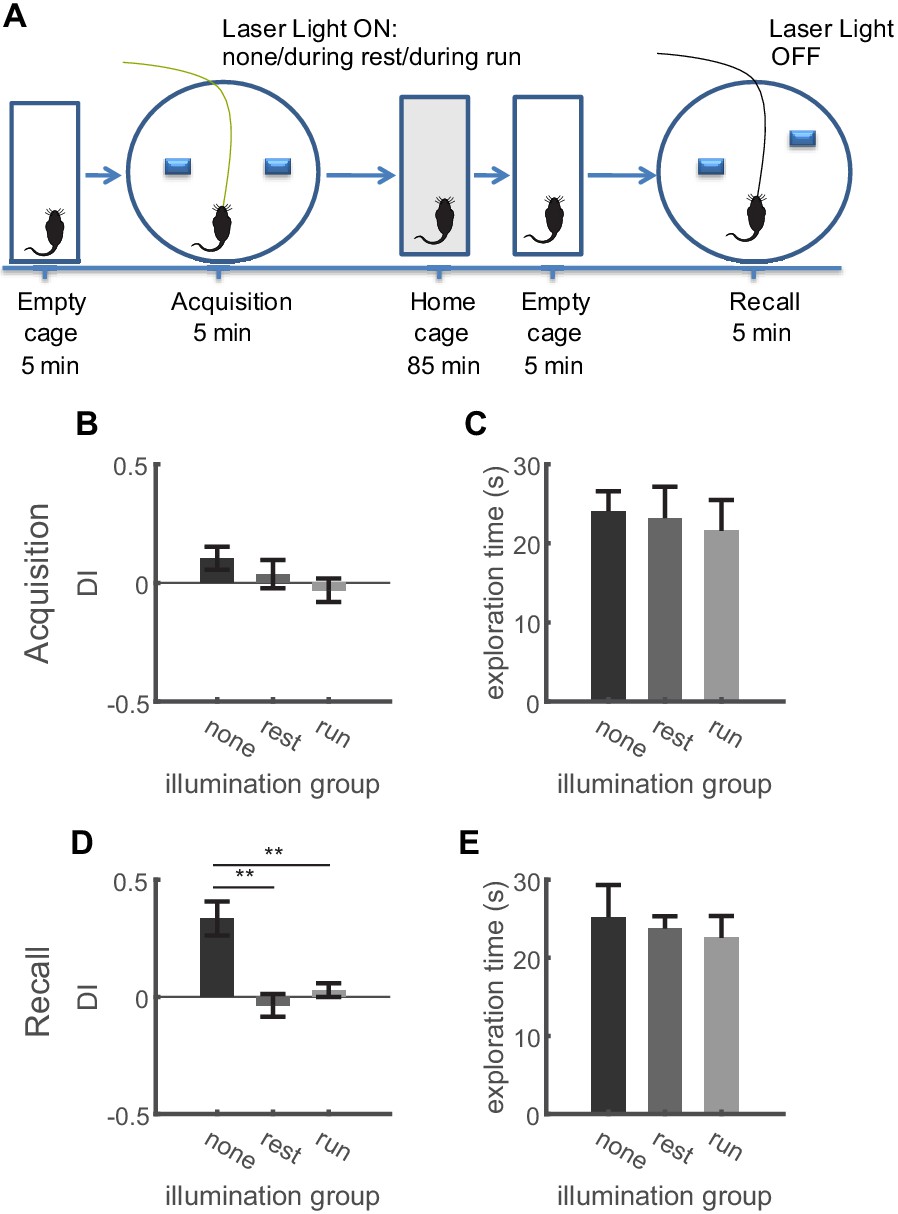
Inhibition of dentate granule cell activity during locomotion only in the acquisition trial impairs memory formation in the OPS task.
(A) Description of the experimental protocol. In the acquisition phase, mice were familiarized with an arena containing two objects. Following an intermediate period of 90 min, the mice were placed in the same arena in which one object was moved slightly. Inhibition of granule cells was carried out not at all, during periods of quiet immobility, or during periods of locomotion in the acquisition trial in three consecutive experiments. (B) Discrimination indices for animals performing the OPS task during acquisition. Experiments were performed in three conditions. First, granule cells were not inhibited. In a second run GC activity was optogenetically inhibited during resting periods. In the third run, GC activity was inhibited exclusively during running periods (Repeated measures ANOVA, F(1,14) = 1.48, p=0.28, n = 5). (C) Animals showed comparable exploration times during the acquisition trial in all three conditions (Friedmann test, p=0.69). (D) During the recall trial animals were only able to discriminate the displaced object, when no GC inhibition had happened during the acquisition trial. No difference was found for the animals depending on whether inhibition had happened during immobility or locomotion (Repeated measures ANOVA, F(1,14) = 54.58, p=0.0003. Bonferroni post-tests: none vs. rest, p=0.0026; none vs. run, p=0.0076; rest vs. run p=0.14, n = 5). (E) Exploration times did not differ with regard to the experimental condition (Friedmann test, p=0.78).
Figure 8—figure supplement 3
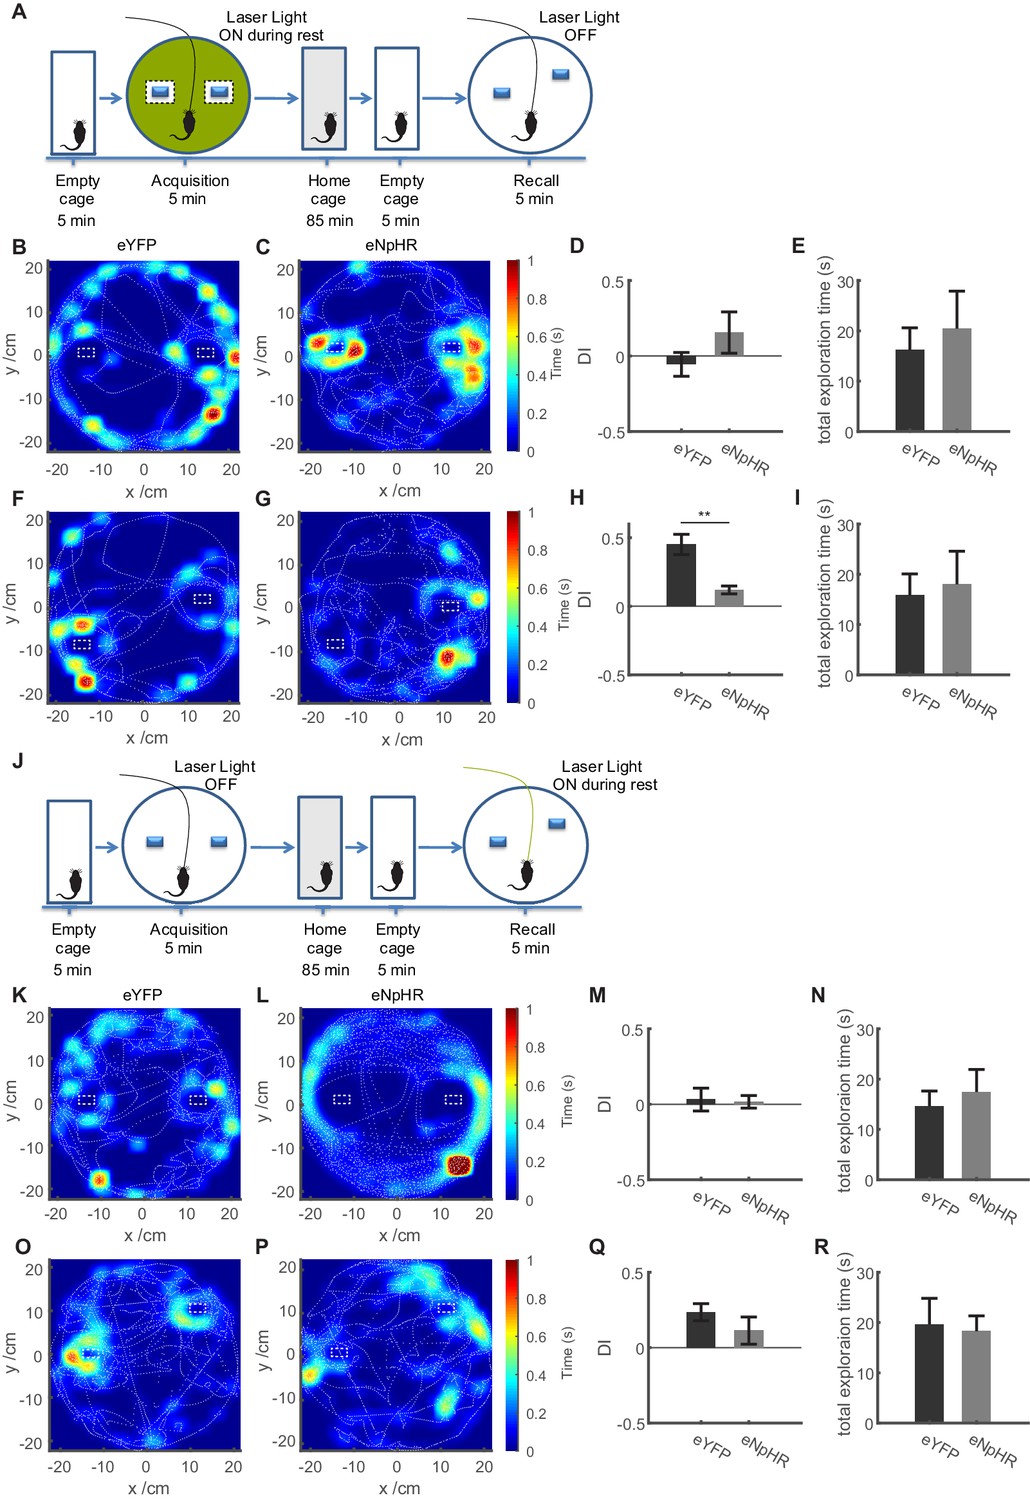
Inhibition of dentate granule cell activity during immobility in the acquisition trial only in non-object locations impairs memory formation in the OPS task.
(A) Description of the experimental protocol. In the acquisition phase, mice were familiarized with an arena containing two objects. Following an intermediate period of 90 min, the mice were placed in the same arena in which one object was moved slightly. Inhibition of granule cells was carried out only during periods of quiet immobility in the acquisition trial, and only if the periods of immobility were not adjacent to the objects. (B, C) Representative sessions from acquisition trials in control (eYFP) mice (b, n = 10) and mice expressing eNpHR in granule cells (c, n = 4) showing the tracking data (dashed white lines), as well as occupancy within the open field as a heat map. (D) Discrimination index quantifying relative exploration times of the two objects, with 0 values indicating equal exploration (see Materials and methods). Comparison between groups n.s., t-test with Welch correction p=0.3537. (E) Total time spent exploring the objects in the eYFP and eNpHR groups during the acquisition trial. Comparison between groups n.s., t-test with Welch correction p=0.6126. (F, G) Representative sessions from recall sessions. (H) Discrimination index for recall trials, showing a significant reduction in the recognition of the displaced object in the eNpHR group. t-test with Welch correction p=0.0018. (I) Total time spent exploring the objects in the eYFP and eNpHR groups during the recall trial. Comparison between groups n.s., t-test with Welch correction p=0.4285. (J) Inhibition of dentate granule cell activity during immobility only during recall trials does not significantly impair performance in the OPS task. In the acquisition phase, mice were familiarized with an arena containing two objects. Following an intermediate period of 90 min, the mice were placed in the same arena in which one object was moved slightly. Inhibition of granule cells was carried out only during periods of quiet immobility in the recall trial. (K, L) Representative sessions from acquisition trials in control (eYFP) mice (b, n = 11) and mice expressing eNpHR in granule cells (c, n = 6) showing the tracking data (dashed white lines), as well as occupancy within the open field as a heat map. (M) Discrimination index quantifying relative exploration times of the two objects, with 0 values indicating equal exploration (see Materials and methods). Comparison between groups n.s., t-test with Welch correction p=0.8613. (N) Total time spent exploring the objects in the eYFP and eNpHR groups during the acquisition trial. Comparison between groups n.s., t-test with Welch correction p=0.6097. (O, P) Representative sessions from recall sessions. (Q) Discrimination index for recall trials, showing no significant reduction in the recognition of the displaced object in the eNpHR group. Comparison between groups n.s., t-test with Welch correction p=0.2802. (R) Total time spent exploring the objects in the eYFP and eNpHR groups during the recall trial. Comparison between groups n.s., t-test with Welch correction p=0.8236.
Author response image 1

Relation of place field length/vector length to the participation of place cells in network events.
A, place field size determined by a Gaussian fit for the baseline (blue) and cue-rich condition (red). B, Plot of the place field length versus the fraction of network events in which this particular place cell participates for each cell. C, Plot of the place field length versus the fraction of calcium events associated with a network event. D-F, Same as A-C, but with the place vector length measure.
Author response image 2
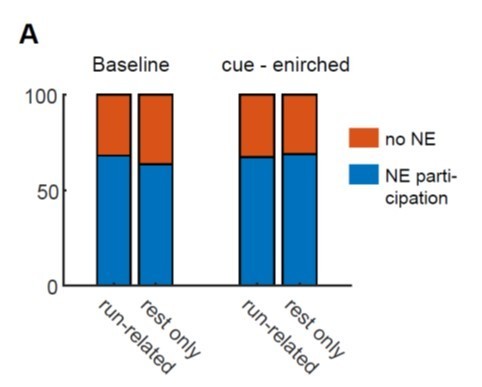
Network event participation of two groups of GCs separated according to their locomotion-related behavior.
A, Run-related: GCs that are active during both running and rest, Rest only: GCs that were not active during running but only during immobility. Fraction of network event participating cells in blue, fraction of cells not participating in orange.
Author response image 3
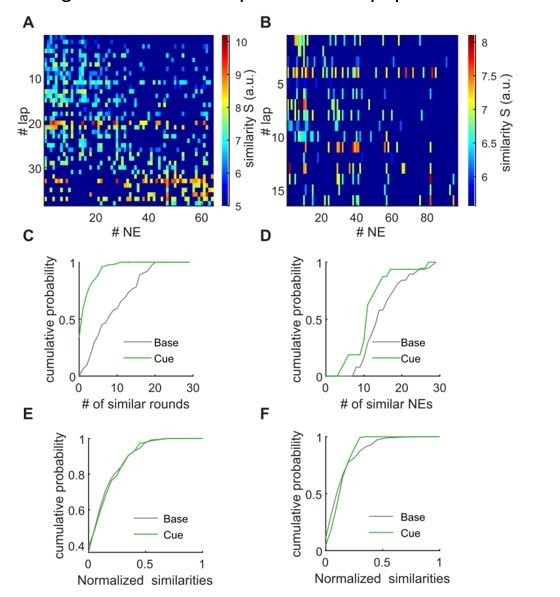
Lapwise similarity of population activity during locomotion with individual network events.
A, B, The matrix shows similarity values for the PCA-based comparison between population activity during all network events (x-axis), and during all individual laps. Nonsignificant comparisons are dark blue. A: Baseline example, B: cue-enriched example. C, D, Quantification of the amount of similarity. Panel C shows for individual network events to how many lapwise activity patterns the similarity is higher than chance. Panel D shows for individual lapwise activities to how many network events it is similar. Plots in C, D correspond to data shown in A, B. E, F, as in C, D, but x-axis normalized and averaged (n = 9 mice, 1 session per condition).
Author response image 4
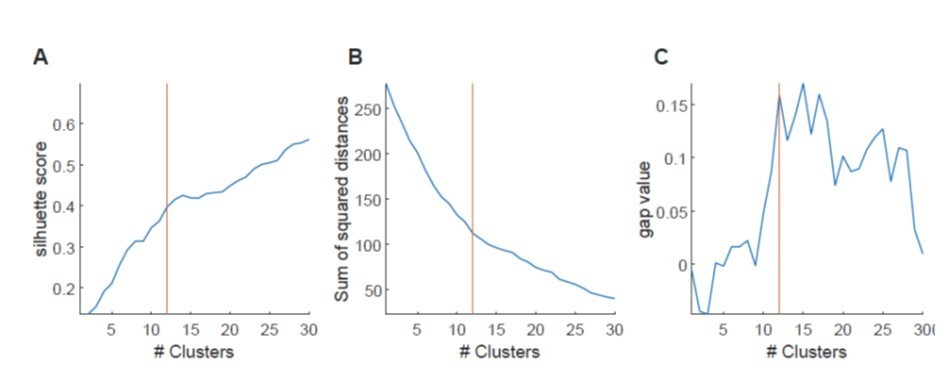
Cluster size determination with different methods.
A, Silhouette method. For our data, measured silhouettes do not form global or local maxima at certain cluster numbers, but form plateaus around certain values. Usually our determined value (orange line) fell within this plateau. B, Elbow method. Usually our method delivered values that were close to what came closest to an elbow. C, Gap method. Steps in gap value at certain cluster sizes were usually at our or close to our determined value.
Author response image 5
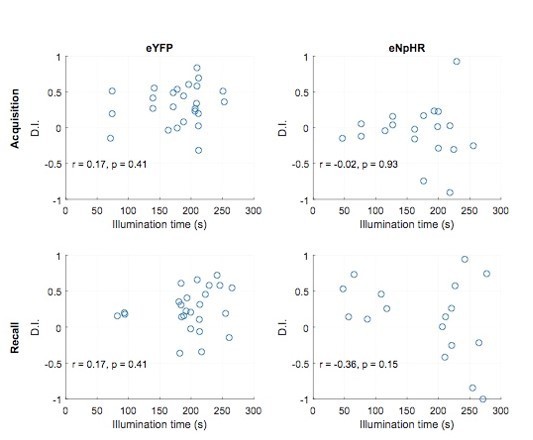
Discrimination indices are not correlated to illumination time.
Plotted are individual discrimination indices for individual sessions of recall trials against the illumination time during the respective session. This is shown for the eYFP control group (left panels) and the halorhodopsin group (right panels) for inhibition during acquisition trials (Upper panels, corresponding to data shown in Figure 9) as well as inhibition during recall trials (lower panels, corresponding to data shown in Figure 8—figure supplement 3Q).
Author response image 6
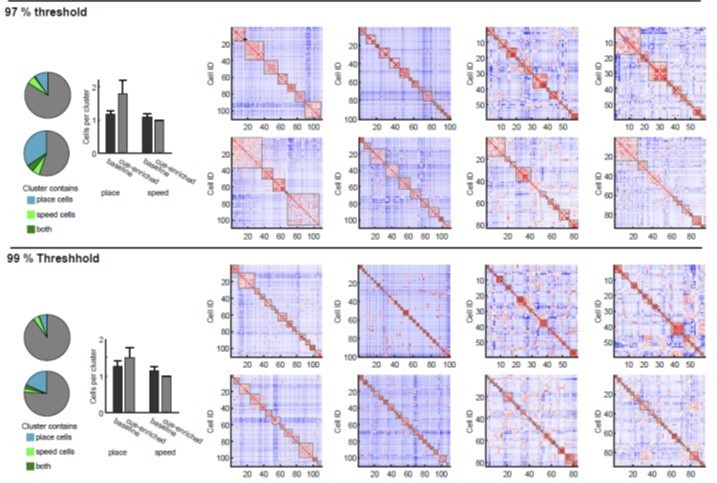
Analysis of clusters with different thresholds.
Cluster analysis was done as described in the methods. Significance values of 5%, 3% and 1% are used, determined by shuffling analysis. Clustering examples for eight sessions are depicted on the right. All clusters passing the respective significance threshold are indicated with grey frames. On the left side, we have reproduced the bar and pie charts from Figure 6D and E regarding place and speed cell participation in clusters for all different thresholds.
Additional files
-
Source code 1
Behavior apparatus LabView program.
- https://cdn.elifesciences.org/articles/65786/elife-65786-code1-v2.zip
-
Source code 2
Network detection MATLAB code.
- https://cdn.elifesciences.org/articles/65786/elife-65786-code2-v2.zip
-
Source code 3
Network cluster structure MATLAB code.
- https://cdn.elifesciences.org/articles/65786/elife-65786-code3-v2.zip
-
Source code 4
Network shuffle analysis MATLAB code.
- https://cdn.elifesciences.org/articles/65786/elife-65786-code4-v2.zip
-
Source code 5
PCA similarity MATLAB code.
- https://cdn.elifesciences.org/articles/65786/elife-65786-code5-v2.zip
-
Supplementary file 1
Spread Sheet containing statistical test results for present data with respective figure numbers.
- https://cdn.elifesciences.org/articles/65786/elife-65786-supp1-v2.xlsx
-
Transparent reporting form
- https://cdn.elifesciences.org/articles/65786/elife-65786-transrepform-v2.docx
Download links
A two-part list of links to download the article, or parts of the article, in various formats.
Downloads (link to download the article as PDF)
Open citations (links to open the citations from this article in various online reference manager services)
Cite this article (links to download the citations from this article in formats compatible with various reference manager tools)
Synchronous activity patterns in the dentate gyrus during immobility
eLife 10:e65786.
https://doi.org/10.7554/eLife.65786


