Voltage-clamp fluorometry analysis of structural rearrangements of ATP-gated channel P2X2 upon hyperpolarization
- Division of Biophysics and Neurobiology, National Institute for Physiological Sciences, Japan
- Department of Physiological Sciences, The Graduate University for Advanced Studies, School of Life Science, Japan
Figures
Figure 1 with 3 supplements
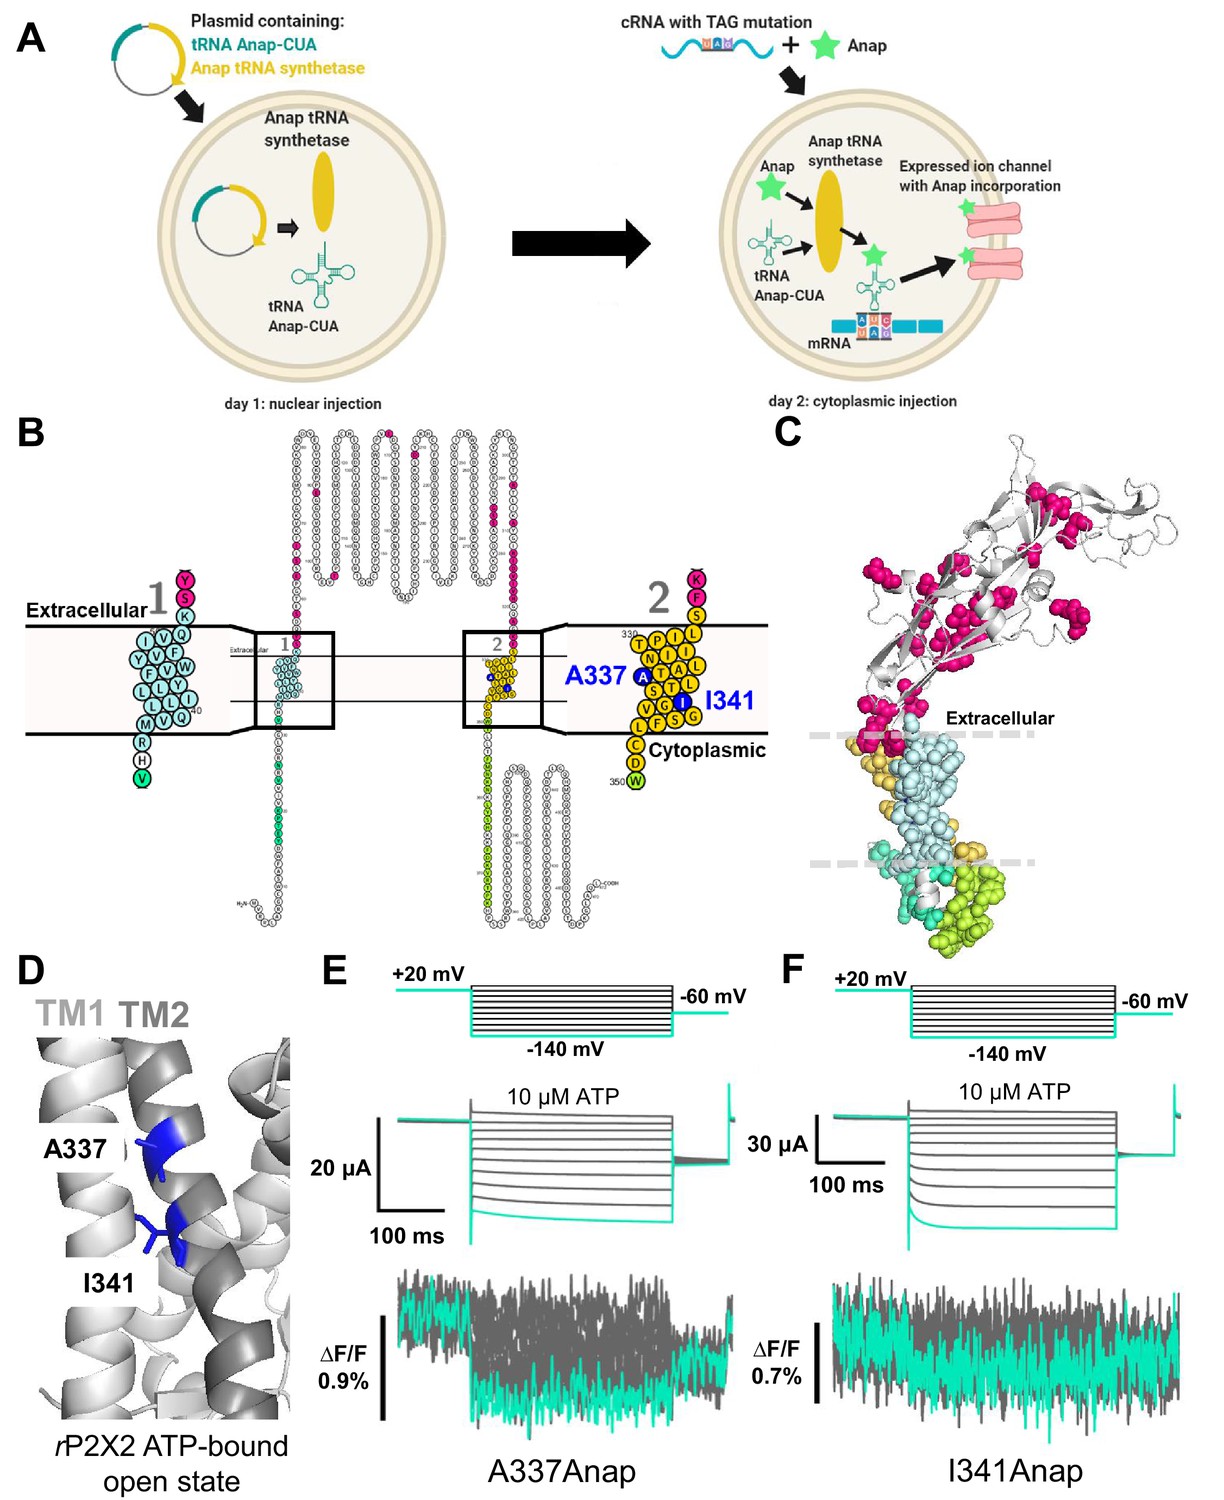
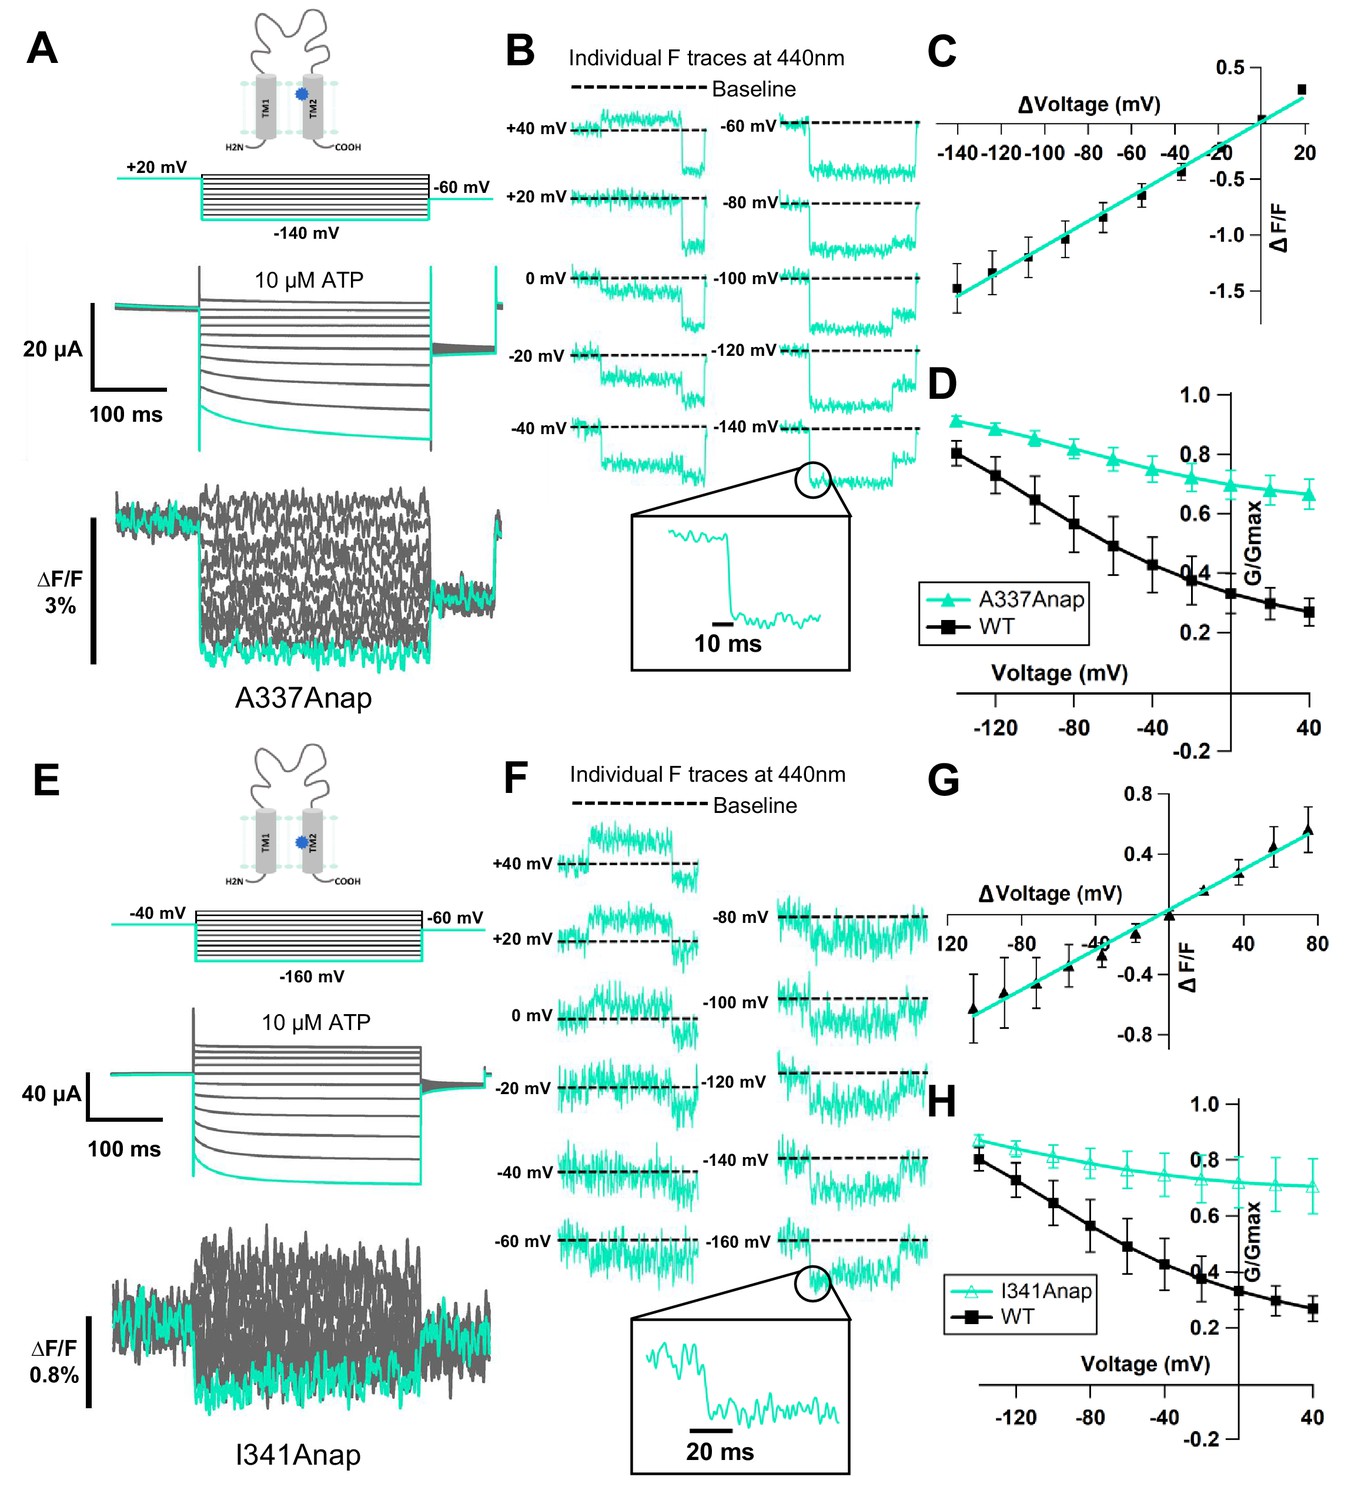
Fluorescence signal changes of Anap-incorporated P2X2 receptor evoked by ATP and voltage.
(A) A scheme depicting the principle of the direct incorporation of fUAA (Anap) into the ion channel protein. The plasmid containing tRNA Anap-CUA and tRNA synthase is injected into the nucleus of Xenopus laevis oocytes. On the following day, channel cRNA with a TAG mutation is co-injected with Anap into the cytoplasm of the oocytes. Anap-incorporated channel protein was expressed successfully after the optimum incubation period. (B, C) A scheme to visualize the Anap scanning regions by individual amino acid residue representation (B) and within the protein structure (C), respectively. Anap mutant scanning was done by introducing TAG mutation one at a time in all regions of the P2X2 receptor (a total of 96 positions), which include the N-terminus (eight positions, turquoise), TM2 (24 positions, yellow), extracellular domain (ECD, 25 positions, magenta), TM1 (20 positions, light blue), and C-terminus (19 positions, lime green). Voltage-dependent fluorescence changes of Anap were observed only at A337 and I341 in the TM2 domain (colored by dark blue). (D) The sites of the introduced TAG mutations, A337 and I341 in the TM2 domain, which gave voltage-evoked fluorescence changes. All of rP2X2 structure representations in (C) and (D) were based on homology modeling from the ATP-bound open state hP2X3 crystal structure data (PDB ID: 5SVK; Mansoor et al., 2016). (E, F) Representative current traces and fluorescence signal upon ATP and voltage application in Anap mutants (A337: ∆F/F = 0.5 ± 0.2% at 440 nm [n = 3]; I341: ∆F/F = 0.3 ± 0.2% at 440 nm [n = 3], respectively). Source data are provided in Figure 1—source data 1.
-
Figure 1—source data 1
Fluorescence signal changes of A337Anap and I341Anap evoked by ATP and voltage.
- https://cdn.elifesciences.org/articles/65822/elife-65822-fig1-data1-v2.xlsx
Figure 1—figure supplement 1
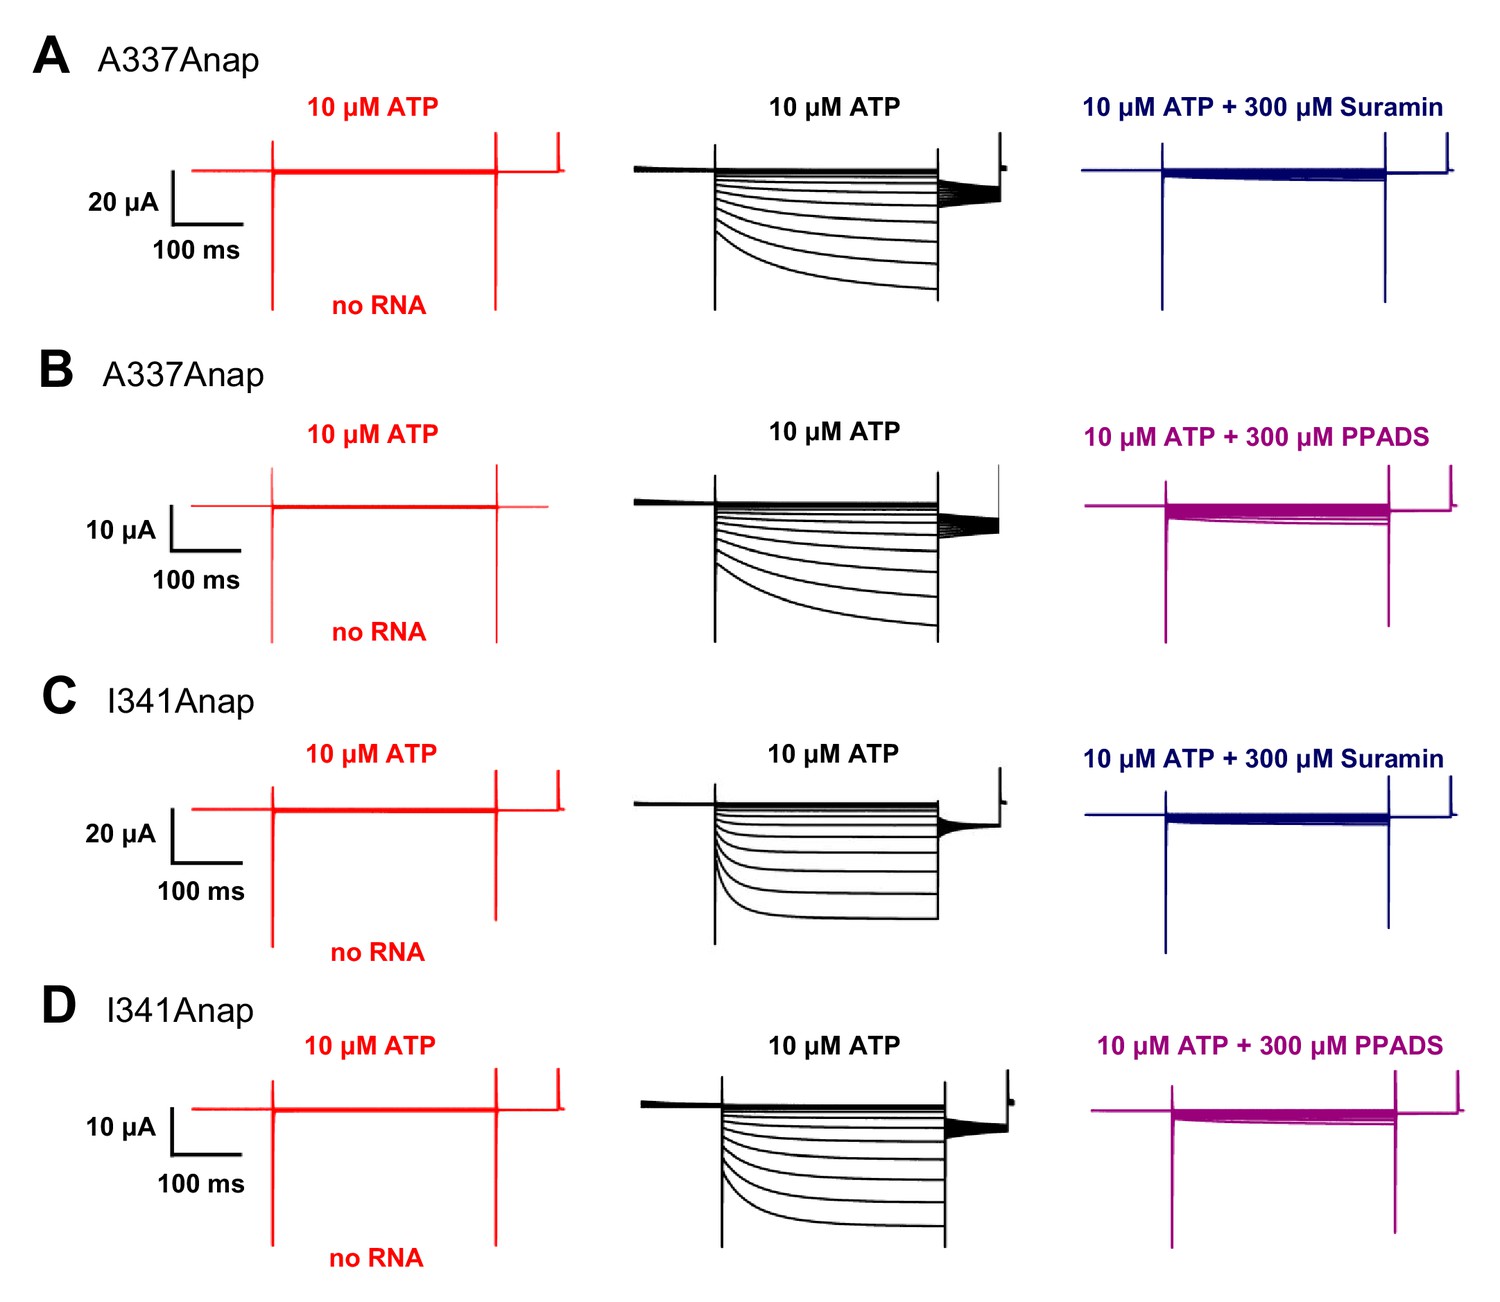
ATP-evoked currents of A337Anap and I341Anap were inhibited by P2X2 non-specific blockers: Suramin and PPADS.
(A–D) Representative current traces of P2X2 Anap constructs upon the application of 10 μM ATP (black) and 300 μM Suramin (dark blue); and 10 μM ATP (black) and 300 μM PPADS (purple), for A337Anap (A, B) and I341Anap (C, D), respectively. Red traces show non-injected oocytes as control (n = 5 for all experiments). Source data are provided in Figure 1—figure supplement 1—source data 1.
-
Figure 1—figure supplement 1—source data 1
ATP-evoked currents of A337Anap and I341Anap were inhibited by Suramin and PPADS.
- https://cdn.elifesciences.org/articles/65822/elife-65822-fig1-figsupp1-data1-v2.xlsx
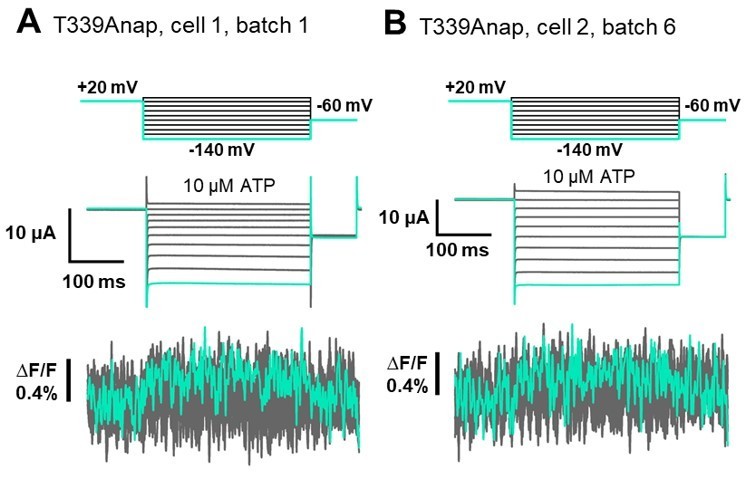
Figure 1—figure supplement 2
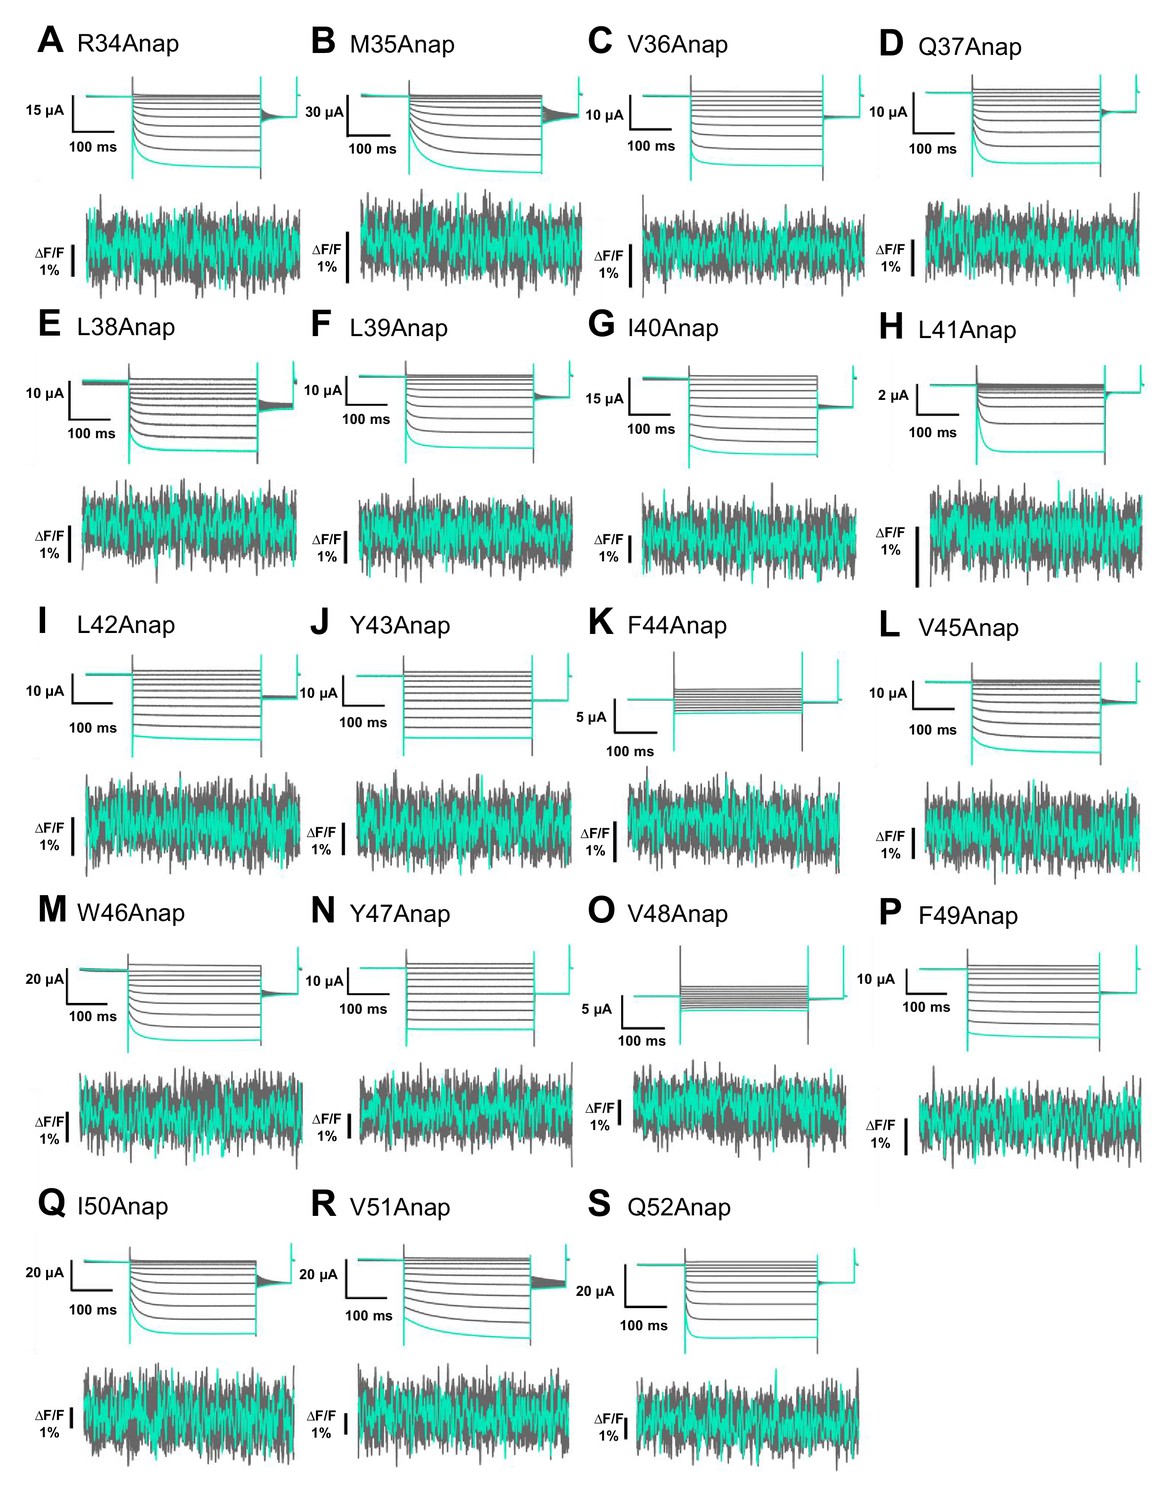
Anap mutant scanning in the TM1 domain.
(A–S) Representative current and fluorescence recordings upon ATP and voltage application in Anap mutants located in the TM1 domain (VCF recordings were performed at least in three different batches and n = 5–10 for each construct).
Figure 1—figure supplement 3
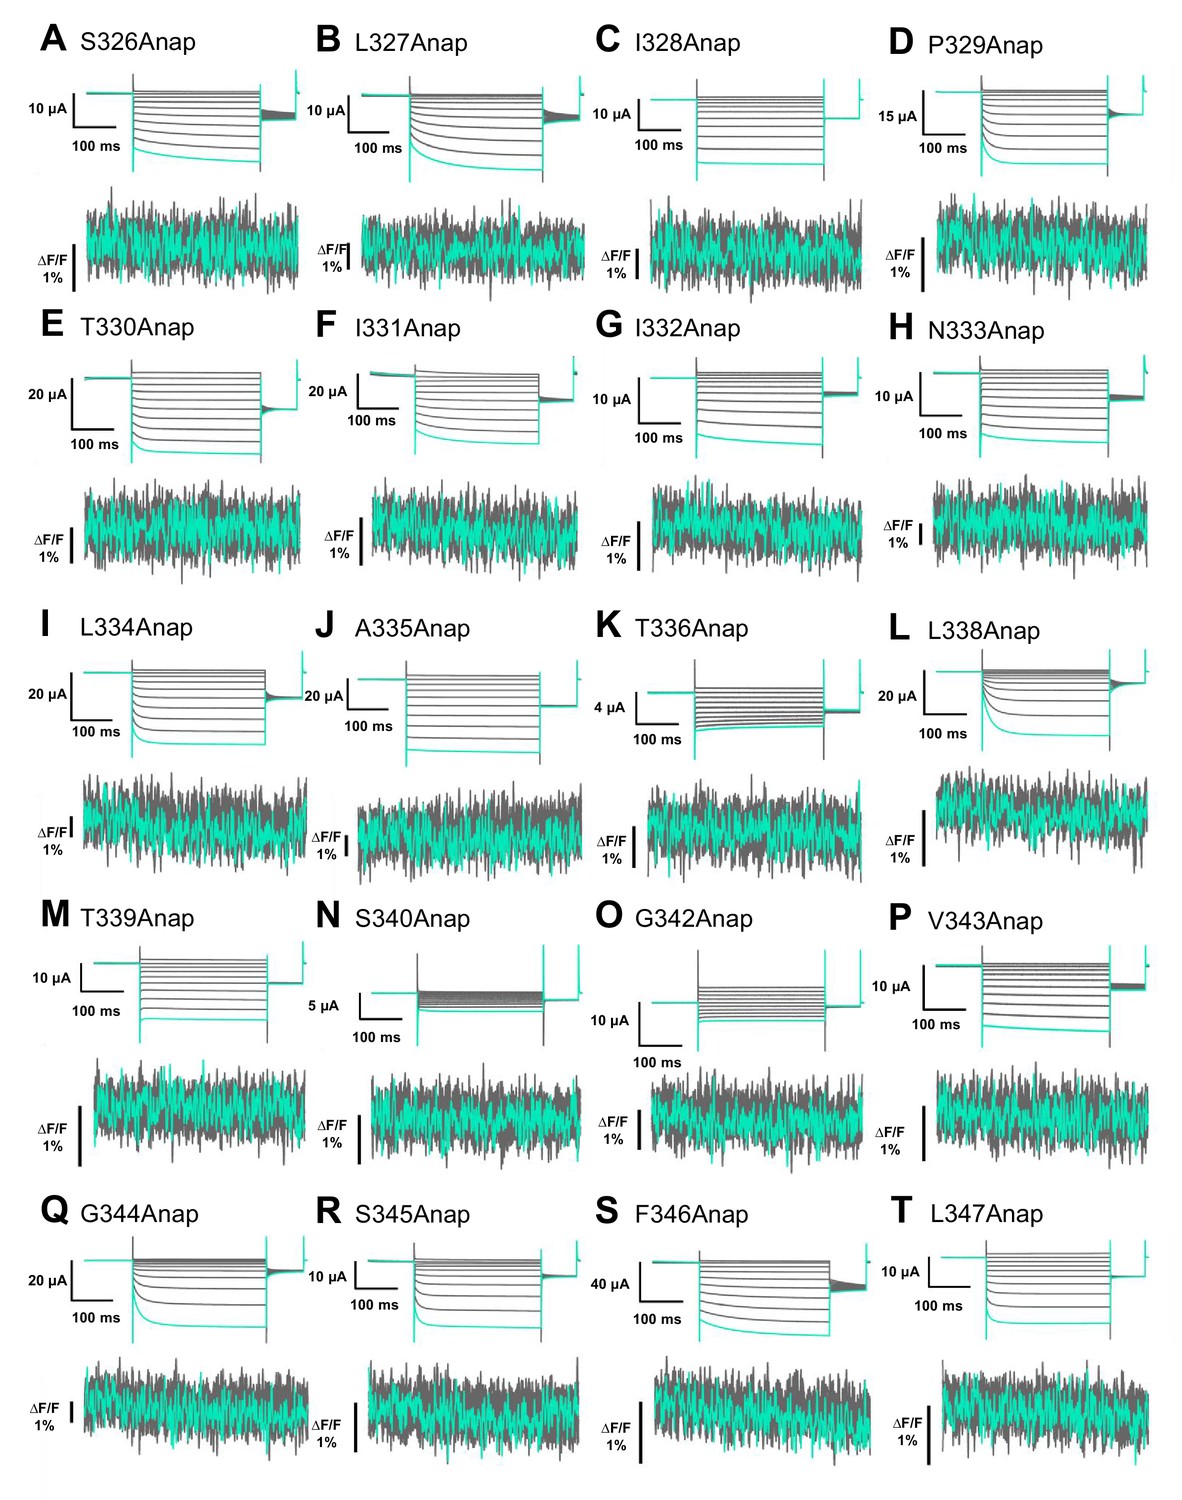
Anap mutant scanning in the TM2 domain.
(A–T) Representative current and fluorescence recordings upon ATP and voltage application in Anap mutants located in the TM2 domain (VCF recordings were performed at least in three different batches and n = 5–10 for each construct).
Figure 2 with 1 supplement
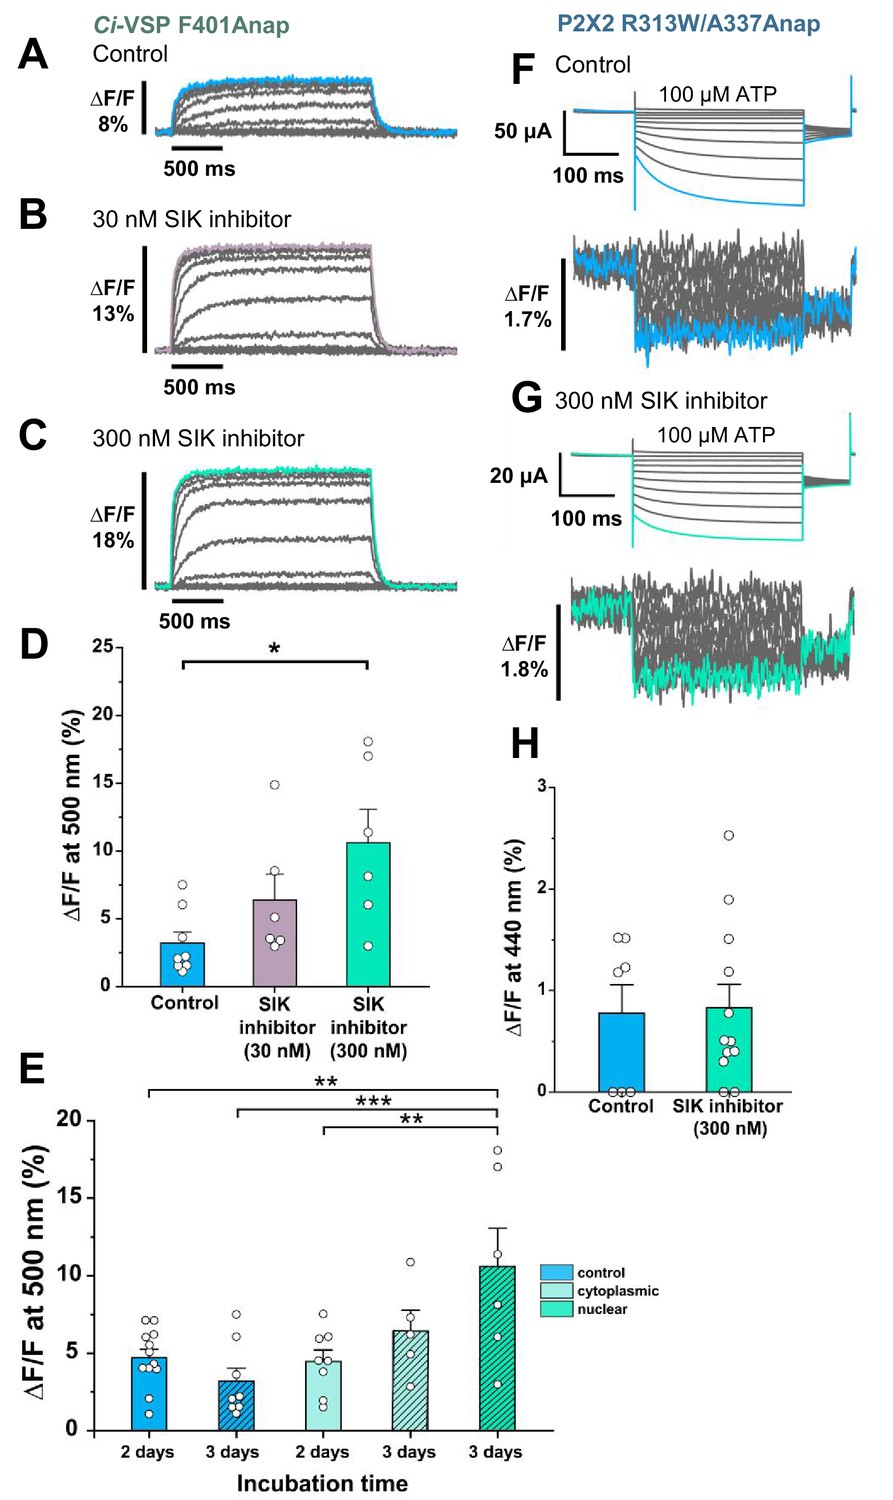
Effect of SIK inhibitor treatment in Anap-incorporated Ci-VSP and P2X2 receptor.
SIK inhibitor treatment improved the VCF optical signal. (A–C) Representative fluorescence signal of VCF recordings of Ci-VSP without SIK inhibitor treatment, with 30 nM, and with 300 nM SIK inhibitor treatment (∆F/F = 3.2% ± 0.8 at 500 nm [n = 8]; ∆F/F = 6.4% ± 1.9 [n = 6]; and ∆F/F = 10.6% ± 2.5 [n = 6], respectively). (D) Comparison of non-treated (control) group (n = 8), 30 nM (n = 6), and 300 nM SIK inhibitor application (n = 6); *p≤0.05, p=0.01639, one-way ANOVA with Tukey’s post-hoc test for 300 nM, compared to the control group. (E) Comparison of the incubation time and site of injection of SIK inhibitor treatment using 300 nM SIK inhibitor: control group, 2 days incubation (n = 12), control group, 3 days incubation (n = 8), SIK inhibitor treatment with cytoplasmic injection with 2 days incubation (n = 8), with cytoplasmic injection for 3 days (n = 5), with nuclear injection for 3 days (n = 6); **p≤0.01, ***p≤0.001, one-way ANOVA with Tukey’s post-hoc test. (F, G) Representative current traces and fluorescence signal of VCF recordings of P2X2 receptor (A337Anap/R313W) without SIK inhibitor treatment and with the application of 300 nM SIK inhibitor (∆F/F = 0.77% ± 0.3 at 440 nm [n = 7]; and ∆F/F = 0.83% ± 0.2 [n = 12], respectively). (H) A comparison of non-treated (control) group (n = 7) and 300 nM SIK inhibitor application (n = 12) (p=0.88107, two-sample t-test for 300 nM compared to the control group). All error bars are ± s.e.m. centered on the mean. Source data are provided in Figure 2—source data 1. Statistical analysis data are provided in Figure 2—source data 2, Figure 2—source data 3, and Figure 2—source data 4.
-
Figure 2—source data 1
Effect of SIK inhibitor treatment in Anap-incorporated Ci-VSP and P2X2 receptor.
- https://cdn.elifesciences.org/articles/65822/elife-65822-fig2-data1-v2.xlsx
-
Figure 2—source data 2
Statistical analysis to support graph in Figure 2D.
- https://cdn.elifesciences.org/articles/65822/elife-65822-fig2-data2-v2.pdf
-
Figure 2—source data 3
Statistical analysis to support graph in Figure 2E.
- https://cdn.elifesciences.org/articles/65822/elife-65822-fig2-data3-v2.pdf
-
Figure 2—source data 4
Statistical analysis to support graph in Figure 2H.
- https://cdn.elifesciences.org/articles/65822/elife-65822-fig2-data4-v2.pdf
Figure 2—figure supplement 1
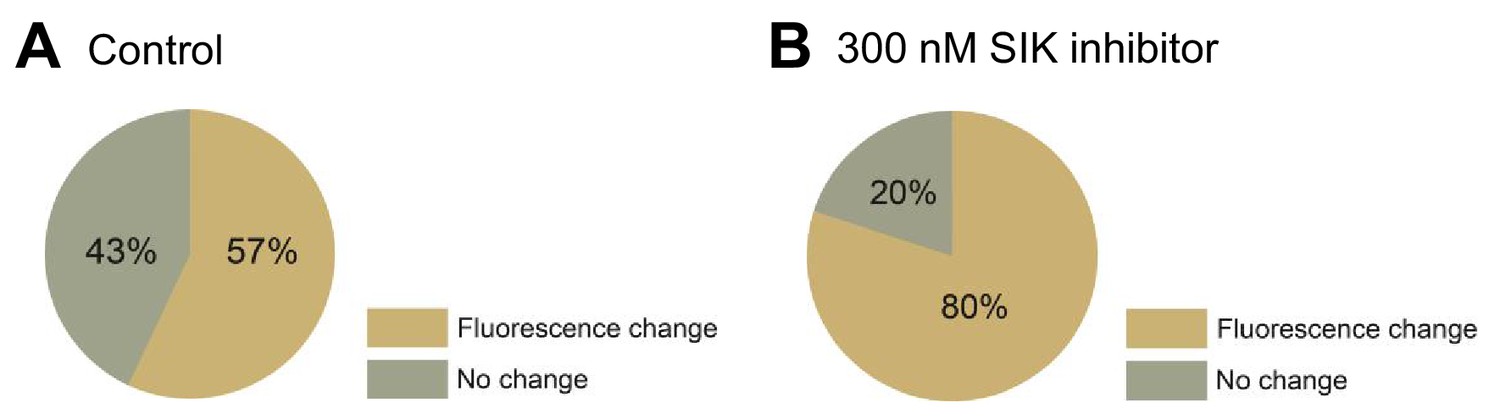
Effect of 300 nM SIK inhibitor application on the incidence of detectable Anap fluorescence signal change of P2X2 receptor.
(A, B) Incidence of detectable changes of Anap fluorescence for control group (57%, n = 7) and 300 nM SIK inhibitor application (80%, n = 12), respectively. Source data are provided in Figure 2—figure supplement 1—source data 1.
-
Figure 2—figure supplement 1—source data 1
Effect of 300 nM SIK inhibitor application on the incidence of detectable Anap fluorescence signal change of P2X2 receptor.
- https://cdn.elifesciences.org/articles/65822/elife-65822-fig2-figsupp1-data1-v2.xlsx
Figure 3 with 1 supplement
Voltage-clamp fluorometry (VCF) of Anap-incorporated P2X2 receptor in the presence of 300 nM SIK inhibitor upon ATP and voltage stimuli.
The focused electric field converged at A337 and I341 in TM2, throughout P2X2 ATP- and voltage-dependent gating. (A) Representative current traces and fluorescence signal of VCF recordings at A337, with 300 nM SIK inhibitor treatment, in the presence of 10 µM ATP (∆F/F = 1.5% ± 0.2 at 440 nm; n = 8). (B) Individual fluorescence traces during each voltage step at 440 nm. Inset shows fluorescence changes exhibiting fast kinetics in ms range. (C) F-V relationship showed a linear voltage dependence. Each X-axis for F-V relationship is ∆V from the holding potential. (D) G-V relationship comparison between A337Anap (turquoise filled triangle) and wildtype (black filled square) for 10 µM ATP (n = 8). Normalization was done based on the maximum conductance in the same concentration of ATP (10 µM) for each construct. (E) Representative current traces and fluorescence signal of VCF recordings at I341, with 300 nM SIK inhibitor treatment, in the presence of 10 µM ATP (∆F/F = 0.6% ± 0.2 at 440 nm [n = 3]). (F) Individual fluorescence traces in each voltage step at 440 nm. Inset shows fluorescence changes also exhibiting fast kinetics in ms range. (G) F-V relationship showed a linear voltage dependence. Each X-axis for F-V relationship is ∆V from the holding potential. (H) G-V relationship comparison between I341Anap (turquoise open triangle) and wildtype (black filled square) for 10 µM ATP (n = 3). Normalization was done based on the maximum conductance in the same concentration of ATP (10 µM) for each construct. All error bars are ± s.e.m. centered on the mean. Source data are provided in Figure 3—source data 1.
-
Figure 3—source data 1
VCF of A337Anap and I341Anap in the presence of 300 nM SIK inhibitor upon ATP and voltage stimuli.
- https://cdn.elifesciences.org/articles/65822/elife-65822-fig3-data1-v2.xlsx
Figure 3—figure supplement 1
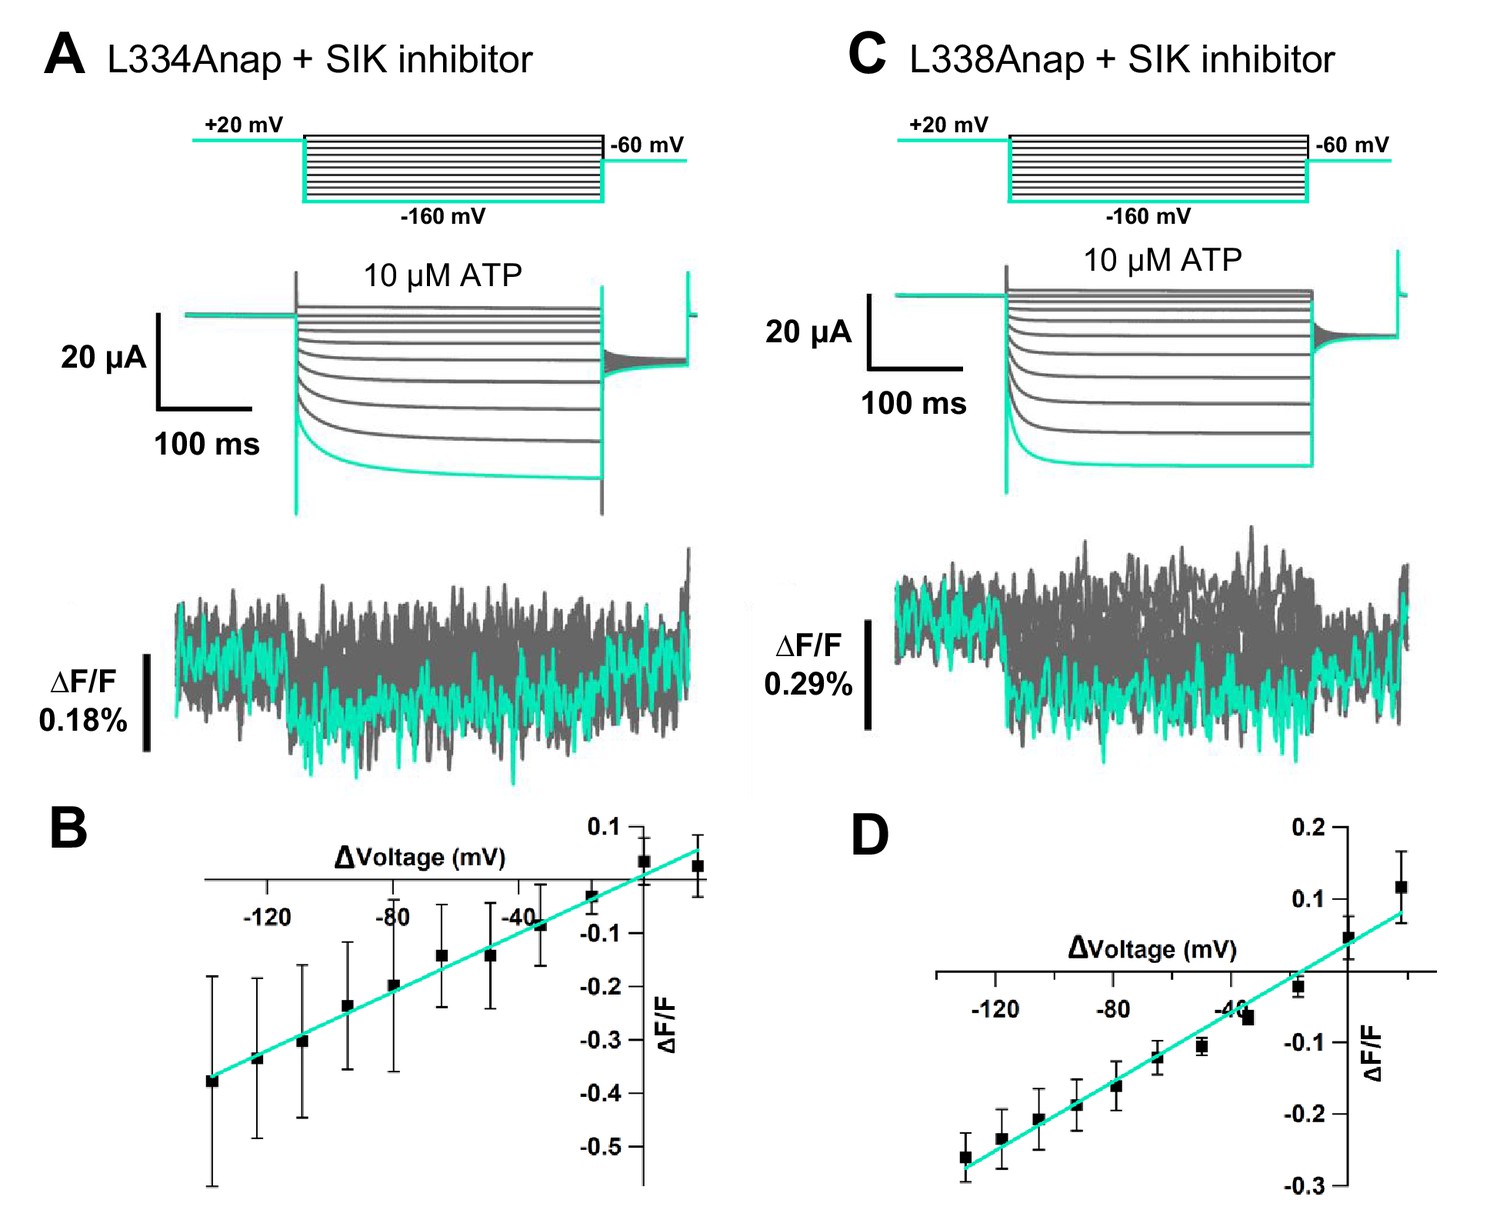
Voltage-clamp fluorometry (VCF) of L334Anap and L338Anap in the presence of 300 nM SIK inhibitor, with ATP and voltage steps.
(A, C) Representative current traces and fluorescence signal of VCF recordings at L334Anap and L338Anap, with 300 nM SIK inhibitor treatment, in the presence of 10 µM ATP (∆F/F = 0.38% ± 0.2 at 440 nm [n = 2] and ∆F/F = 0.26% ± 0.03 at 440 nm [n = 4], respectively). (B, D) F-V relationship showed a linear voltage dependence. The X-axis for F-V relationship is ∆V from the holding potential. Source data are provided in Figure 3—figure supplement 1—source data 1.
-
Figure 3—figure supplement 1—source data 1
VCF of L334Anap and L338Anap in the presence of 300 nM SIK inhibitor, with ATP and voltage steps.
- https://cdn.elifesciences.org/articles/65822/elife-65822-fig3-figsupp1-data1-v2.xlsx
Figure 4 with 1 supplement
Voltage-clamp fluorometry (VCF) of Anap-labeled P2X2 at A337 in TM2 evoked by hyperpolarization in the absence and presence of ATP.
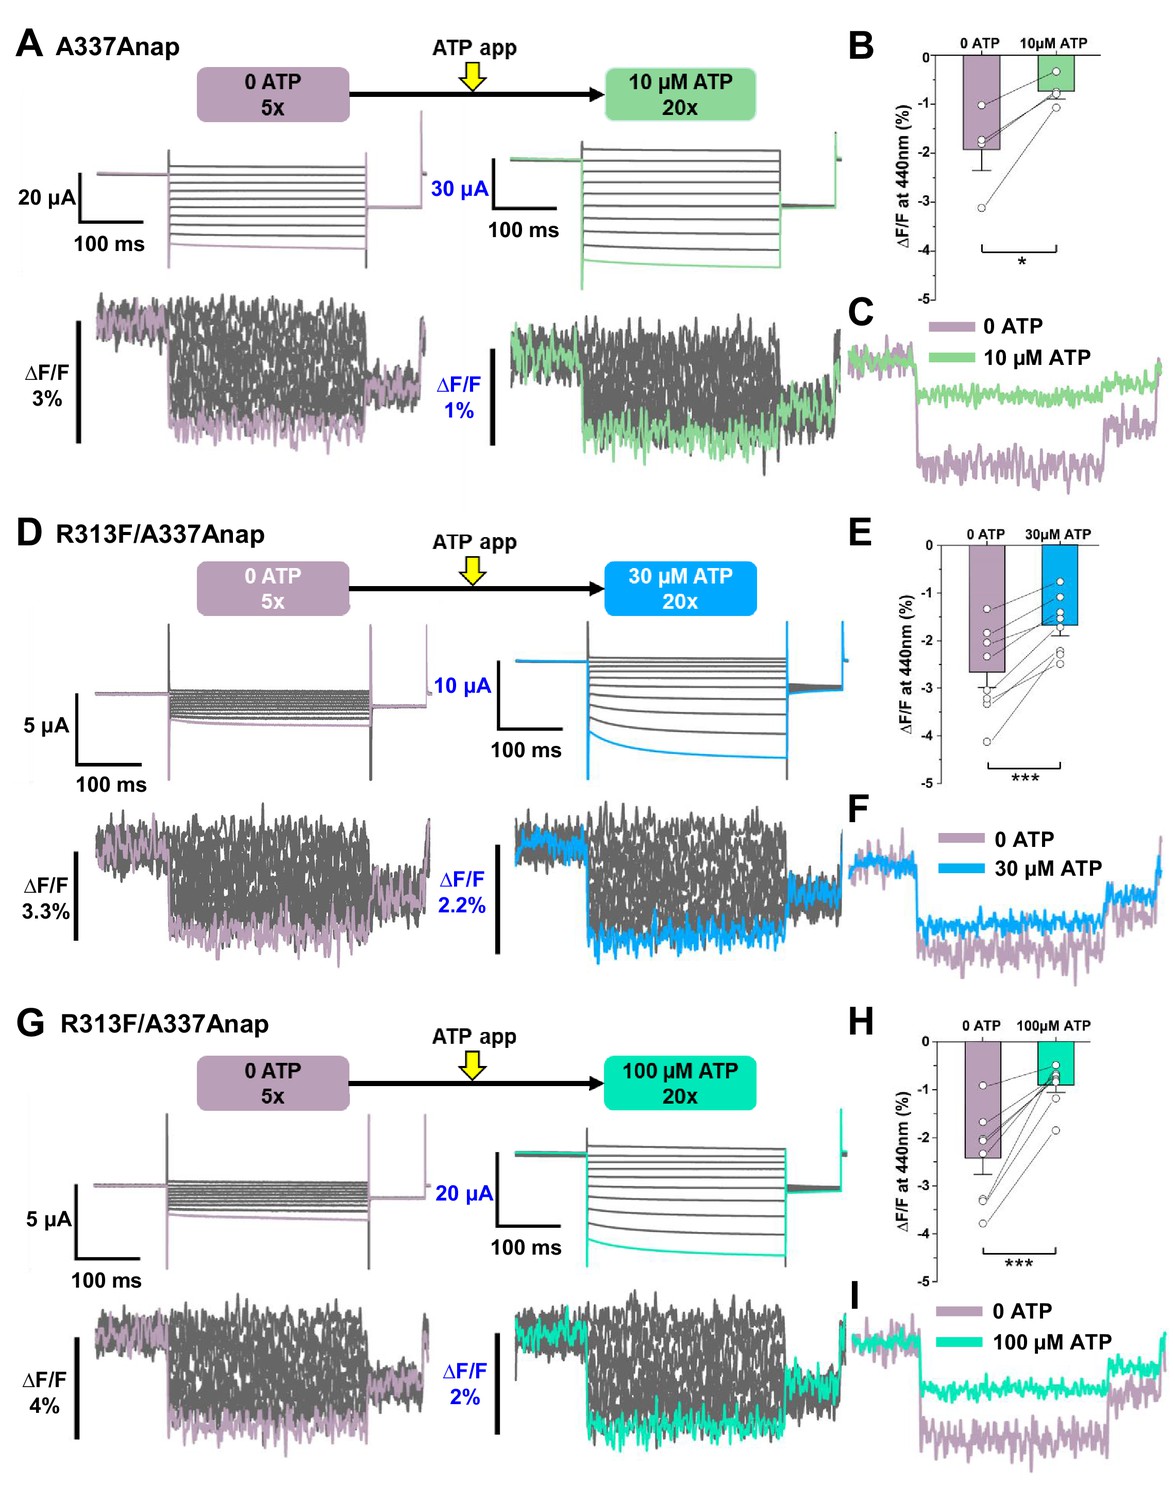
Anap fluorescence changes at A337 were observed even in the absence of ATP upon hyperpolarization. (A) Representative current traces and fluorescence signal of VCF recordings at A337 in the absence of ATP (∆F/F = 1.9% ± 0.4 at 440 nm (n = 4)) and in the presence of 10 µM ATP (∆F/F = 0.7% ± 0.1 at 440 nm (n = 4)), from the same cell. (B) Comparison of the fluorescence changes in the absence and in the presence of 10 µM ATP (*p≤0.05, p=0.02876, paired t-test; n = 4). (C) Superimposed fluorescence traces at −140 mV, in 0 ATP (light purple) and 10 µM ATP (light green), from the same cell. (D–I) An additional R313F mutation was introduced to lower the basal activity of A337Anap and stabilize the closed state. (D) Representative current traces and fluorescence signal of VCF recordings of A337/R313F in the absence of ATP (∆F/F = 2.6% ± 0.3 at 440 nm; n = 8) and in the presence of 30 µM ATP (∆F/F = 1.7% ± 0.2; n = 8) from the same cell. (E) Comparison of the fluorescence changes in the absence and in the presence of 30 µM ATP (***p≤0.001, p=0.00045, paired t-test; n = 8). (F) Superimposed fluorescence traces at −140 mV, in 0 ATP (light purple) and 30 µM ATP (blue), from the same cell. (G) Representative current traces and fluorescence signal of VCF recordings of A337/R313F in the absence of ATP (∆F/F = 2.4% ± 0.3 at 440 nm; n = 8) and in the presence of 100 µM ATP (∆F/F = 0.9% ± 0.1; n = 8). (H) Comparison of the fluorescence changes in the absence and in the presence of 100 µM ATP (***p≤0.001, p=0.0005, paired t-test; n = 8). (I) Superimposed fluorescence traces at −140 mV in 0 ATP (light purple) and 100 µM ATP (turquoise), from the same cell. All error bars are ± s.e.m. centered on the mean. Source data are provided in Figure 4—source data 1. Statistical analysis data are provided in Figure 4—source data 2, Figure 4—source data 3, and Figure 4—source data 4.
-
Figure 4—source data 1
VCF of Anap-labeled P2X2 at A337 evoked by hyperpolarization in the absence and presence of ATP.
- https://cdn.elifesciences.org/articles/65822/elife-65822-fig4-data1-v2.xlsx
-
Figure 4—source data 2
Statistical analysis to support graph in Figure 4B.
- https://cdn.elifesciences.org/articles/65822/elife-65822-fig4-data2-v2.pdf
-
Figure 4—source data 3
Statistical analysis to support graph in Figure 4E.
- https://cdn.elifesciences.org/articles/65822/elife-65822-fig4-data3-v2.pdf
-
Figure 4—source data 4
Statistical analysis to support graph in Figure 4H.
- https://cdn.elifesciences.org/articles/65822/elife-65822-fig4-data4-v2.pdf
Figure 4—figure supplement 1
VCF of Anap-labeled P2X2 at A337 in TM2 evoked by hyperpolarization in the absence and presence of ATP.
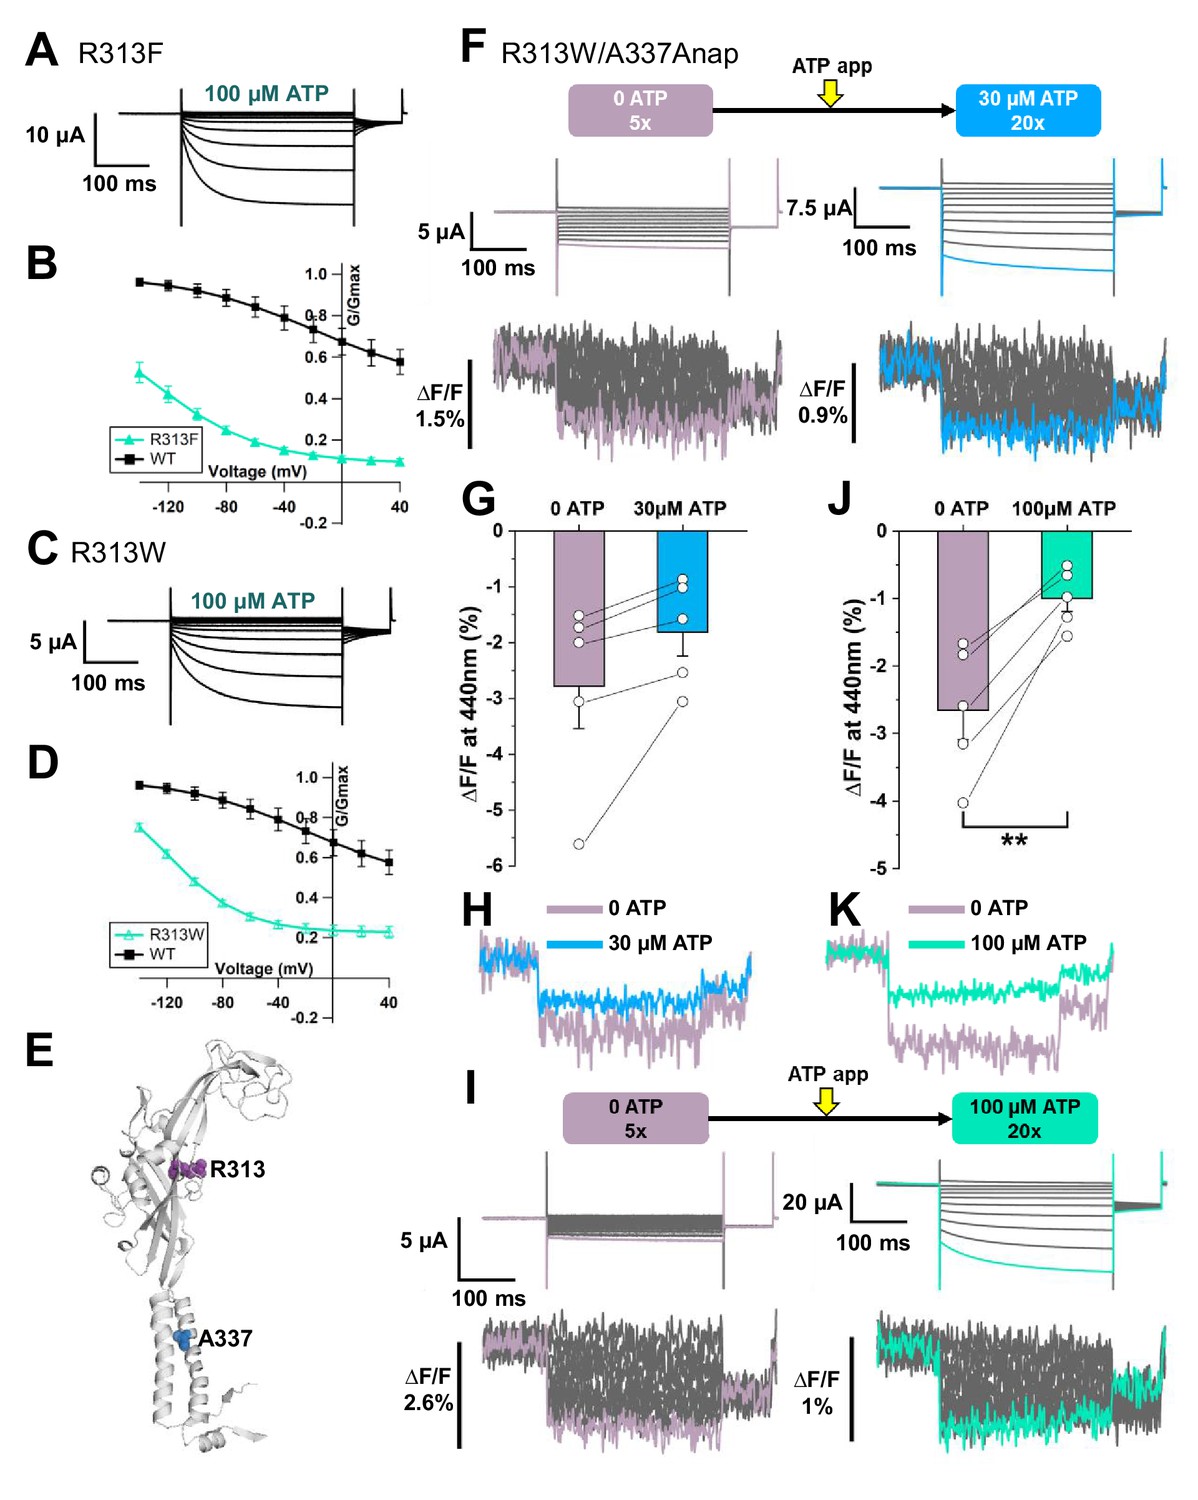
(A) Representative current traces of R313F upon application of 100 µM ATP. (B) Comparison of G-V relationships between R313F (turquoise filled triangle) and wildtype (black filled square) in 100 µM ATP (n = 3). (C) Representative current traces of R313W in 100 µM ATP. (D) G-V relationship comparison between R313W (turquoise open triangle) and wildtype (black filled square) in 100 µM ATP (n = 3). Normalization was based on the maximum conductance at the highest [ATP] (300 μM) for each construct. (E) Side view structural representation of the location of A337 (blue) and R313 (purple) in the ATP-bound open state. (F) Representative current traces and fluorescence signal of VCF recordings of A337Anap/R313W in the absence of ATP (∆F/F = 2.8% ± 0.7 at 440 nm; n = 5) and in 30 µM ATP (∆F/F = 1.8% ± 0.4 at 440 nm; n = 5). (G) Comparison of the fluorescence changes in the absence and in the presence of 30 µM ATP (p=0.07204, paired t-test; n = 5). (H) Superimposed fluorescence traces at −140 mV, in 0 ATP (light purple) and 30 µM ATP (blue). (I) Representative current traces and fluorescence signal of VCF recordings of A337/R313W, in the absence of ATP (∆F/F = 2.6% ± 0.4 at 440 nm; n = 5) and in 100 µM ATP (∆F/F = 0.9% ± 0.2 at 440 nm; n = 5). (J) Comparison of the fluorescence changes in the absence and in the presence of 100 µM ATP (**p≤0.01, p=0.00491, paired t-test; n = 5). (K) Superimposed fluorescence traces at −140 mV, in 0 ATP (light purple) and 100 µM ATP (turquoise). All error bars are ± s.e.m. centered on the mean. Source data are provided inFigure 4—figure supplement 1—source data 1. Statistical analysis data are provided in Figure 4—figure supplement 1—source data 2 and Figure 4—figure supplement 1—source data 3.
-
Figure 4—figure supplement 1—source data 1
VCF of Anap-labeled P2X2 at A337 evoked by hyperpolarization in the absence and presence of ATP.
- https://cdn.elifesciences.org/articles/65822/elife-65822-fig4-figsupp1-data1-v2.xlsx
-
Figure 4—figure supplement 1—source data 2
Statistical analysis to support graph in Figure 4—figure supplement 1G.
- https://cdn.elifesciences.org/articles/65822/elife-65822-fig4-figsupp1-data2-v2.pdf
-
Figure 4—figure supplement 1—source data 3
Statistical analysis to support graph in Figure 4—figure supplement 1J.
- https://cdn.elifesciences.org/articles/65822/elife-65822-fig4-figsupp1-data3-v2.pdf
Figure 5 with 2 supplements

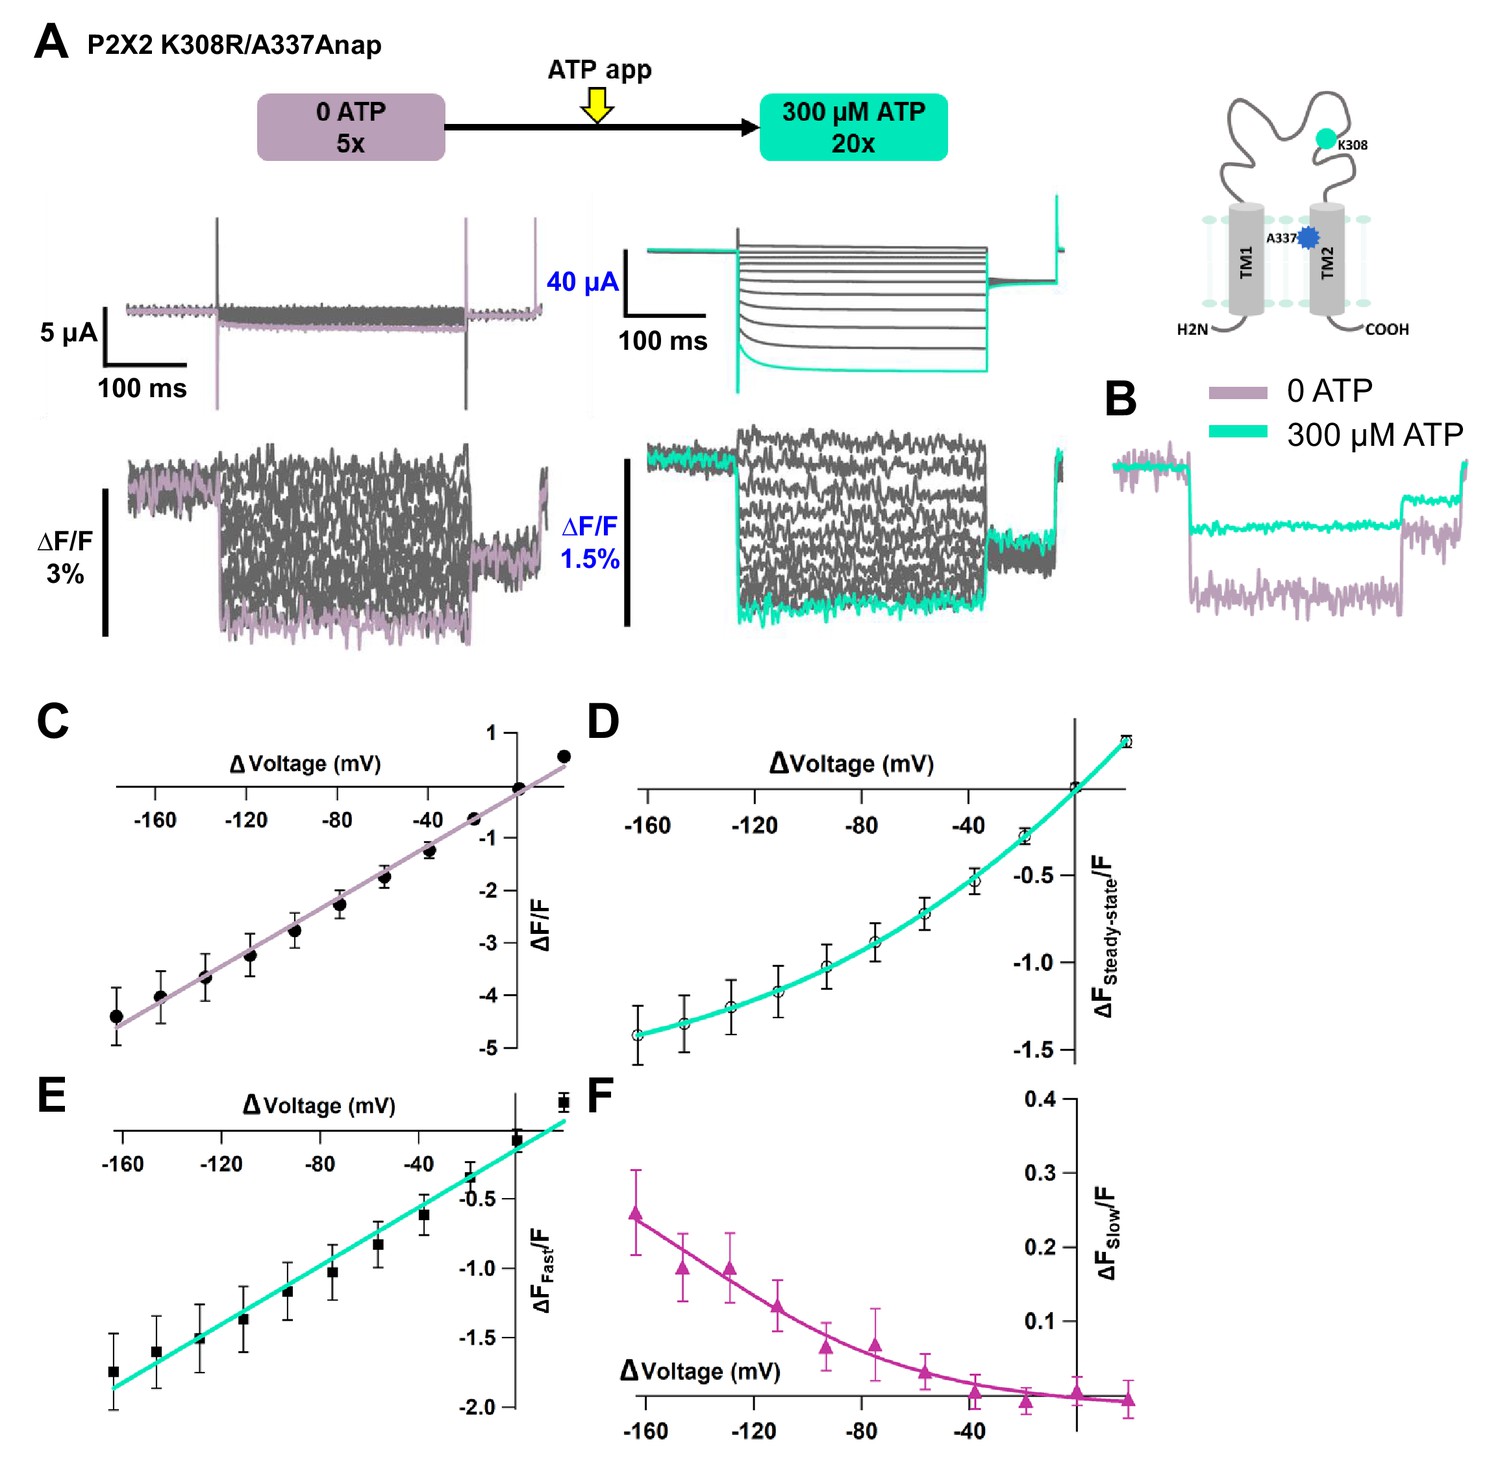
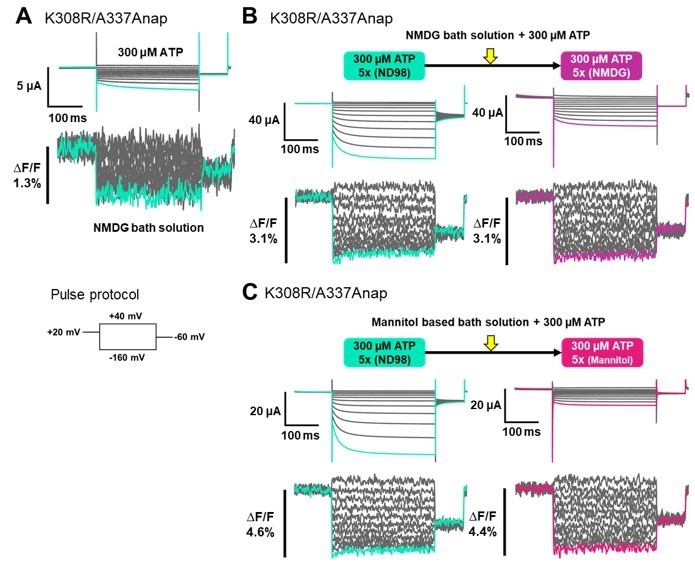
Voltage-clamp fluorometry (VCF) of Anap-labeled P2X2 at A337 in TM2 with the additional mutation of K308R evoked by hyperpolarization in the presence of ATP.
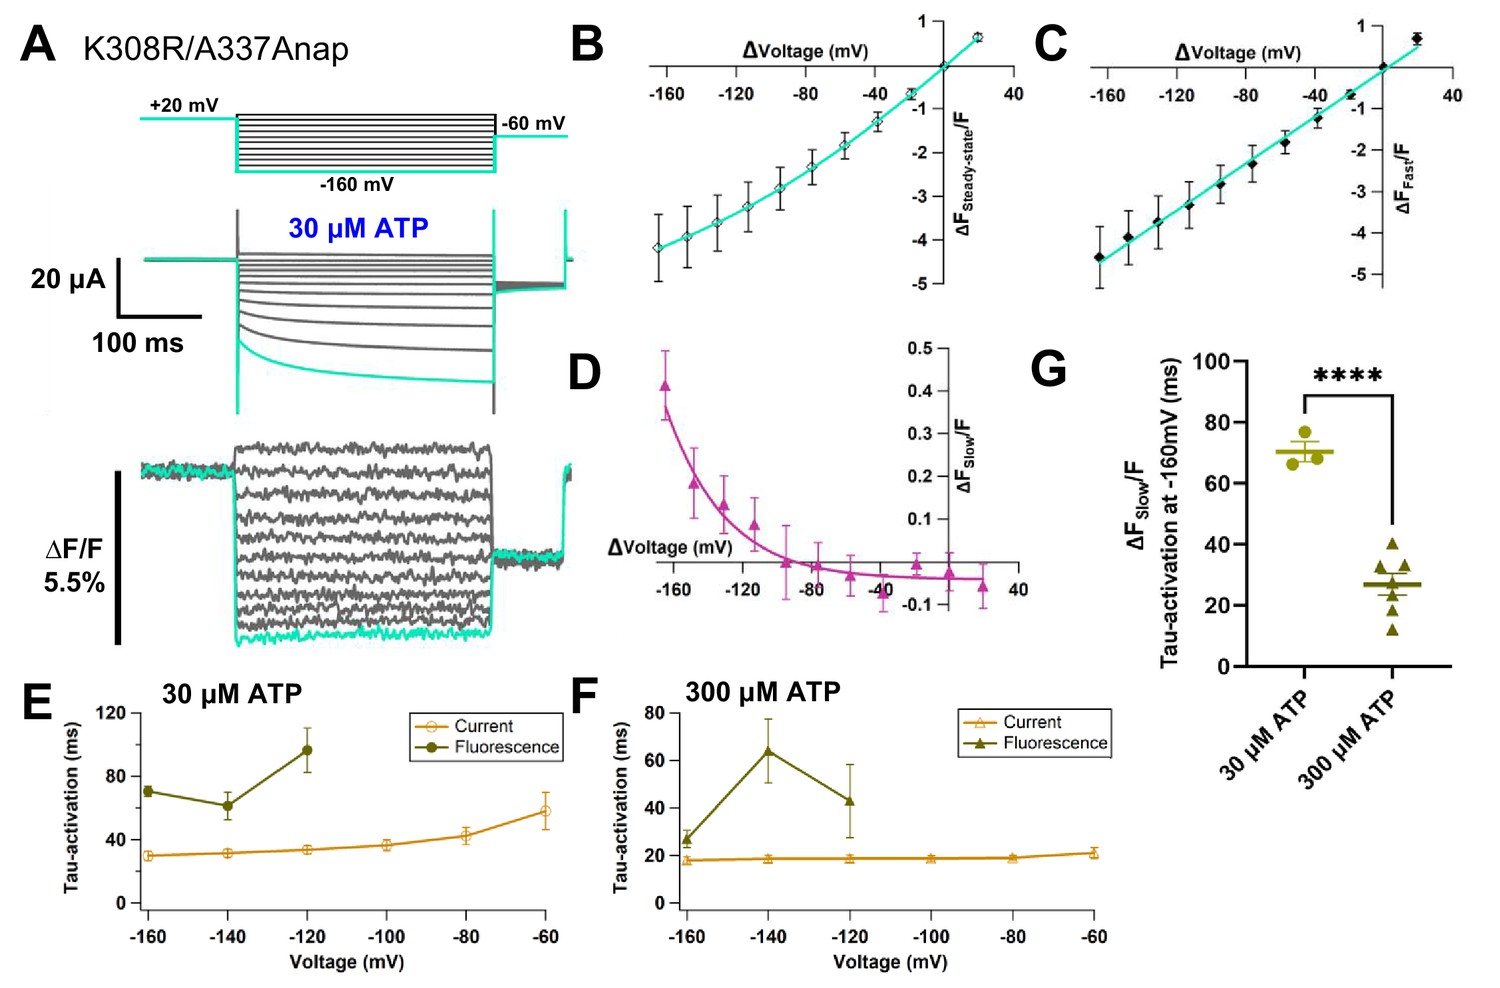
(A) Representative current traces and fluorescence signal of VCF recordings of K308R/A337Anap with 300 nM SIK inhibitor treatment in the presence of 300 µM ATP, from +40 mV to −160 mV with a holding potential of +20 mV (∆FSteady-state/F = 3.4% ± 0.3 at 440 nm, n = 8). (B) Individual fluorescence traces at each voltage step. Inset shows that the fluorescence signal of K308R/A337Anap consists of two components, instantaneous downward change (∆FFast/F) and slow upward change (∆FSlow/F). (C) F-V relationship of the mixed component (∆FSteady-state/F) was calculated from the last 50 ms of fluorescence signal. Component of ∆FSteady-state/F is shown in inset of (B). FSteady-state-V relationship shows that it consists of only a linear component at depolarized potentials, and there are mixed components at hyperpolarized potentials. (D) FFast-V relationship was taken from the first 5 ms of the fluorescence signal. FFast-V relationship showed almost linear voltage dependence (∆FFast/F = 3.9% ± 0.4 at 440 nm; n = 8). (E) Comparison of FSlow-V and G-V relationships. Purple filled triangle trace shows FSlow-V relationship extracted from the fluorescence traces depicted in inset (B), as shown by purple arrow, from the equation ∆Fsteady-state/F = ∆Ffast/F + ∆Fslow/F. Normalization was based on the maximum ∆Fslow/F (at −160 mV). Black filled square trace shows G-V relationship in the presence of 300 µM ATP. Normalization was based on the maximum conductance in the same concentration of ATP (300 µM). (F) Representative current traces and fluorescence signal of VCF recordings of K308R/A337Anap with 300 nM SIK inhibitor treatment, in the presence of 300 µM ATP, at more depolarized potentials from up to +80 mV to −160 mV, with a holding potential of +20 mV (∆FSteady-state/F = 4.1% ± 0.5 at 440 nm; n = 5). (G) Individual fluorescence traces at each depolarized voltage step and some hyperpolarized voltage steps. (H) FSteady-state-V relationship further confirms that it consists of a linear component and a slow component generated only upon hyperpolarization. (I) FFast-V relationship shows almost linear voltage dependence (∆FFast/F = 4.7% ± 0.5 at 440 nm; n = 5). (J) Comparison of FSlow-V and G-V relationships. Purple open triangle trace shows FSlow-V relationship extracted from the fluorescence traces depicted in (F). Normalization was based on the maximum ∆Fslow/F (at −160 mV). Black filled square trace shows G-V relationship in the presence of 300 µM ATP. Normalization was based on the maximum conductance in the same concentration of ATP (300 µM). All error bars are ± s.e.m. centered on the mean. (K) Side view structure of the position of K308 and A337 in the ATP-bound open state. Source data are provided in Figure 5—source data 1.
-
Figure 5—source data 1
VCF of K308R/A337Anap evoked by hyperpolarization in the presence of ATP.
- https://cdn.elifesciences.org/articles/65822/elife-65822-fig5-data1-v2.xlsx
Figure 5—figure supplement 1
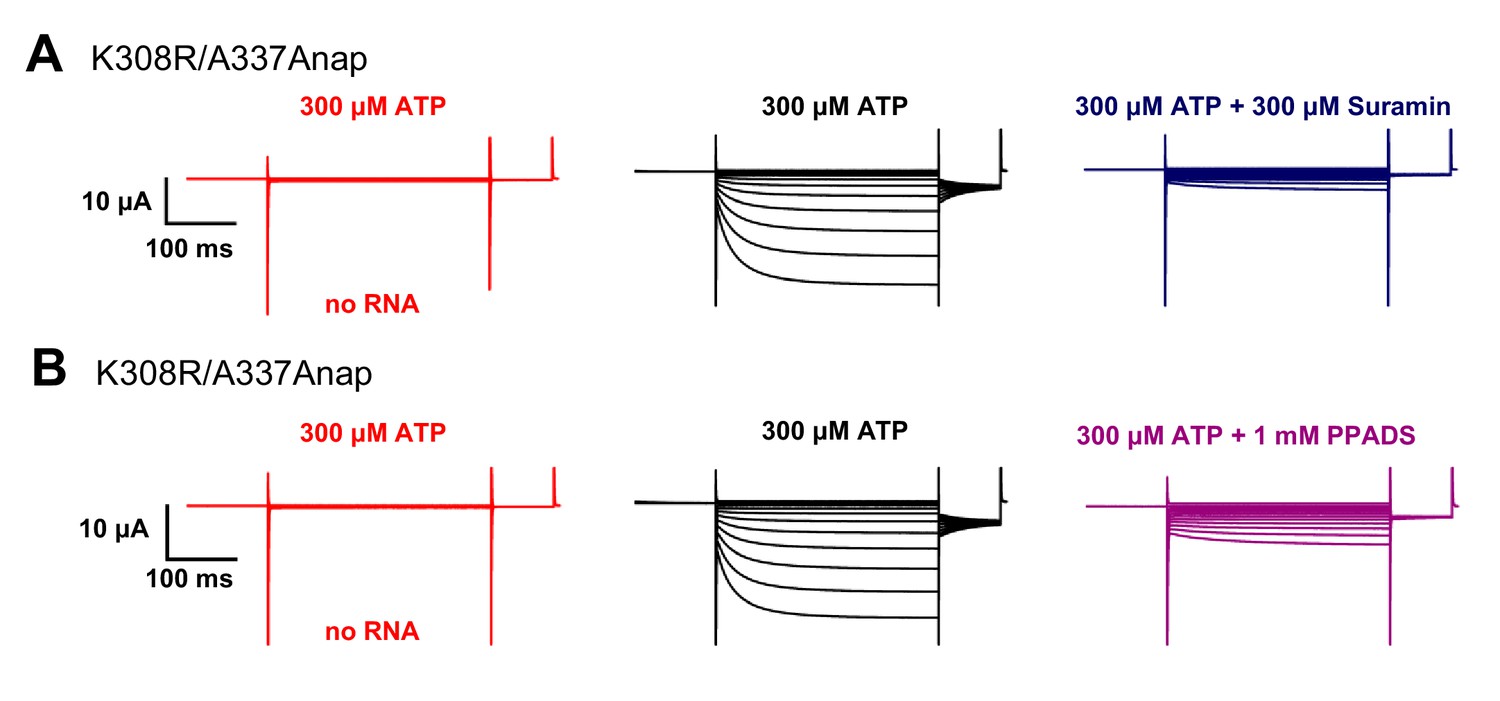
ATP-evoked currents in K308R/A337Anap were inhibited by P2X2 non-specific blockers: Suramin and PPADS.
(A–B) Representative current traces of P2X2 Anap constructs upon the application of 10 μM ATP (black) and 300 μM Suramin (dark blue); and 10 μM ATP (black) and 300 μM PPADS (purple), respectively. Red traces show non-injected oocytes as control (n = 5 for all experiments). Source data are provided in Figure 5—figure supplement 1—source data 1.
-
Figure 5—figure supplement 1—source data 1
ATP-evoked currents of K308R/A337Anap were inhibited by Suramin and PPADS.
- https://cdn.elifesciences.org/articles/65822/elife-65822-fig5-figsupp1-data1-v2.xlsx
Figure 5—figure supplement 2
Slow fraction of fluorescence changes at A337 in TM2 with the additional mutation of K308R, evoked by hyperpolarization, was [ATP]-dependent.
(A) Representative current traces and fluorescence signal of VCF recordings of K308R/A337Anap with 300 nM SIK inhibitor treatment in the presence of 30 µM ATP, from +40 mV to −160 mV with a holding potential of +20 mV (∆FSteady-state/F = 4.2% ± 0.8 at 440 nm; n = 3). (B) FSteady-state-V relationship shows that it consists of only a linear component at depolarized potentials, and there are mixed components at hyperpolarized potentials. (C) FFast-V relationship was taken from the first 5 ms of the fluorescence signal. FFast-V relationship showed almost linear voltage dependence (∆FFast/F = 4.6% ± 0.7 at 440 nm; n = 3). (D) FSlow-V relationship (∆FSlow/F = 0.4 ± 0.08 at 440 nm; n = 3). The X-axis for the F-V relationship is ∆V from the holding potential. (E) Activation kinetics of current (gold) and ∆FSlow/F (olive) in the presence of 30 µM ATP. (F) Activation kinetics of current (gold) and ∆FSlow/F (olive) in the presence of 300 µM ATP. (G) Dependence of activation kinetics of ∆FSlow/F on [ATP] concentration. Statistical analyses were by unpaired Student t-test (p<0.0001). All error bars are ± s.e.m. centered on the mean. Source data are provided in Figure 5—figure supplement 2—source data 1. Statistical analysis data are provided in Figure 5—figure supplement 2—source data 2.
-
Figure 5—figure supplement 2—source data 1
Slow fraction of fluorescence changes at K308R/A337Anap, evoked by hyperpolarization, was [ATP] dependent.
- https://cdn.elifesciences.org/articles/65822/elife-65822-fig5-figsupp2-data1-v2.xlsx
-
Figure 5—figure supplement 2—source data 2
Statistical analysis to support the graph in Figure 5—figure supplement 2G.
- https://cdn.elifesciences.org/articles/65822/elife-65822-fig5-figsupp2-data2-v2.pdf
Figure 6 with 1 supplement
Voltage-clamp fluorometry (VCF) of Anap-labeled P2X2 at A337 in TM2 with the additional mutation of K308R, evoked by hyperpolarization in the absence and presence of ATP.
Fluorescence signal changes at K308R/A337Anap exhibited only a fast component in the absence of ATP and consisted of two components in the presence of ATP. (A) Representative current traces and fluorescence signal of VCF recordings of K308R/A337Anap in the absence of ATP (∆F/F = 4.4% ± 0.5 at 440 nm; n = 6) and in the presence of 300 µM ATP (∆FSteady-state/F = 1.4% ± 0.2; n = 6), from the same cell. (B) Superimposed fluorescence traces at −160 mV in 0 ATP (light purple) and 300 µM (turquoise). (C) F-V relationship, in the absence of ATP, taken from the last 100 ms of the fluorescence signals, shows a linear voltage dependence (R² = 0.99); therefore, it has only the fast component (∆FFast/F). (D) F-V relationship, in the presence of 300 µM ATP, taken from the last 50 ms (∆FSteady-state/F) of the fluorescence signals shows mixed components. (E–F) F-V relationship from two separate components of the fluorescence signal change, in the presence of 300 µM ATP. (E) FFast-V relationship (∆FFast/F = 1.7 ± 0.3 at 440 nm; n = 6) shows almost linear voltage dependence (R² = 0.98). (F) FSlow-V relationship (∆FSlow/F = 0.25 ± 0.05 at 440 nm; n = 6). The X-axis for the F-V relationship is ∆V from the holding potential. All error bars are ± s.e.m. centered on the mean. Source data are provided in Figure 6—source data 1.
-
Figure 6—source data 1
VCF of K308R/A337Anap evoked by hyperpolarization in the absence and presence of ATP.
- https://cdn.elifesciences.org/articles/65822/elife-65822-fig6-data1-v2.xlsx
Figure 6—figure supplement 1
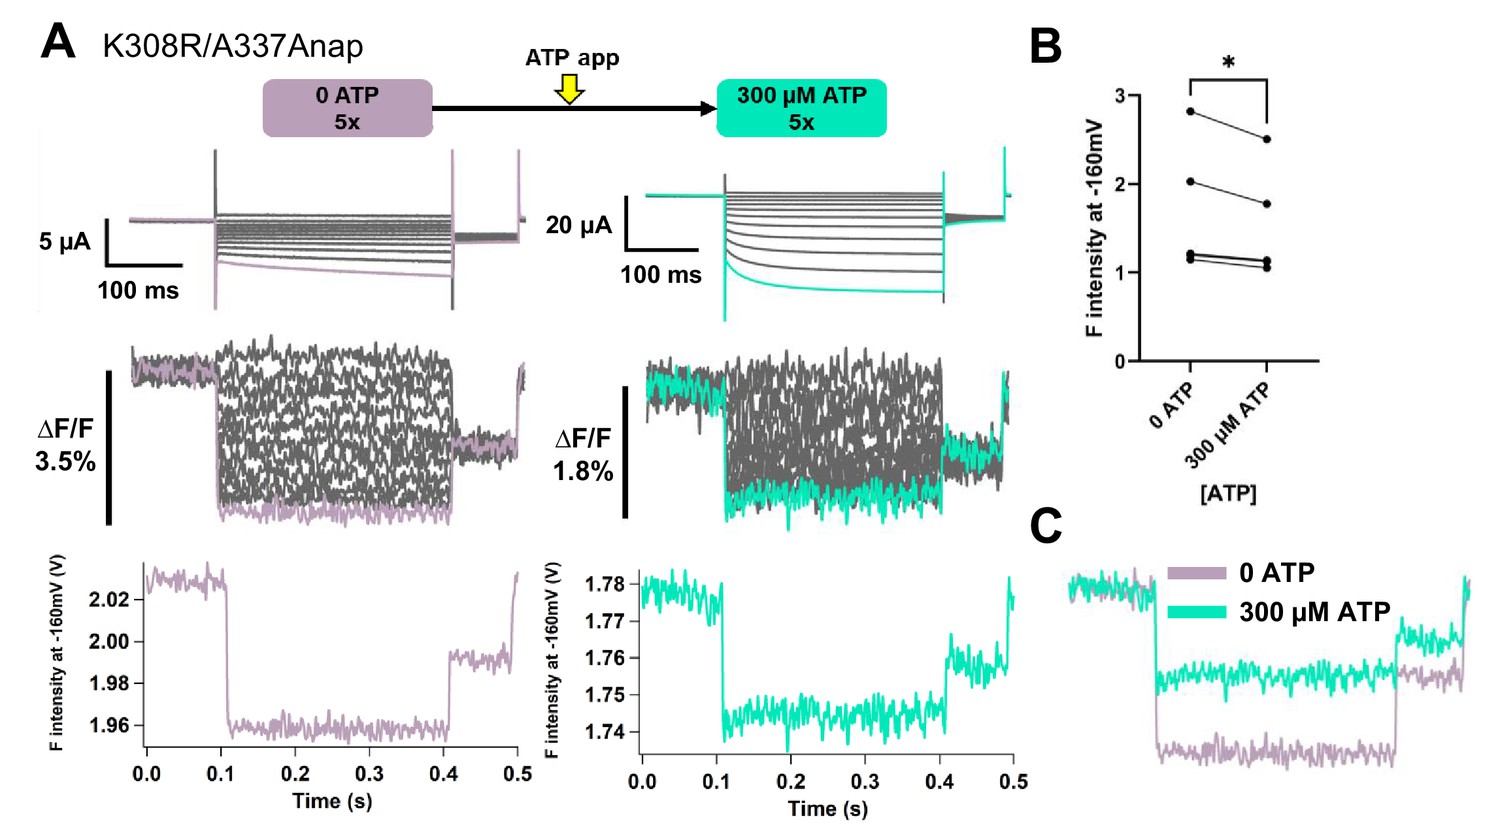
Voltage-clamp fluorometry (VCF) of Anap-labeled P2X2 at A337 in TM2 with the additional mutation of K308R, evoked by hyperpolarization in the absence and presence of ATP.
(A) Representative current traces and fluorescence signal of VCF recordings of K308R/A337Anap in the absence of ATP (∆F/F = 4.2% ± 1.01 at 440 nm; n = 5) and 300 µM ATP (∆F/F = 2.1% ± 0.5; n = 5). (B) Comparison of the absolute F intensity in the absence and the presence of 300 µM ATP (*p≤0.05, p=0.0327, paired t-test, n = 5). (C) Superimposed fluorescence traces at −160 mV, in 0 ATP (light purple) and 30 µM ATP (turquoise). Source data are provided in Figure 6—figure supplement 1—source data 1. Statistical analysis data are provided in Figure 6—figure supplement 1—source data 2.
-
Figure 6—figure supplement 1—source data 1
VCF of K308R/A337Anap evoked by hyperpolarization in the absence and presence of ATP.
- https://cdn.elifesciences.org/articles/65822/elife-65822-fig6-figsupp1-data1-v2.xlsx
-
Figure 6—figure supplement 1—source data 2
Statistical analysis to support graph in Figure 6—figure supplement 1B.
- https://cdn.elifesciences.org/articles/65822/elife-65822-fig6-figsupp1-data2-v2.pdf
Figure 7 with 1 supplement
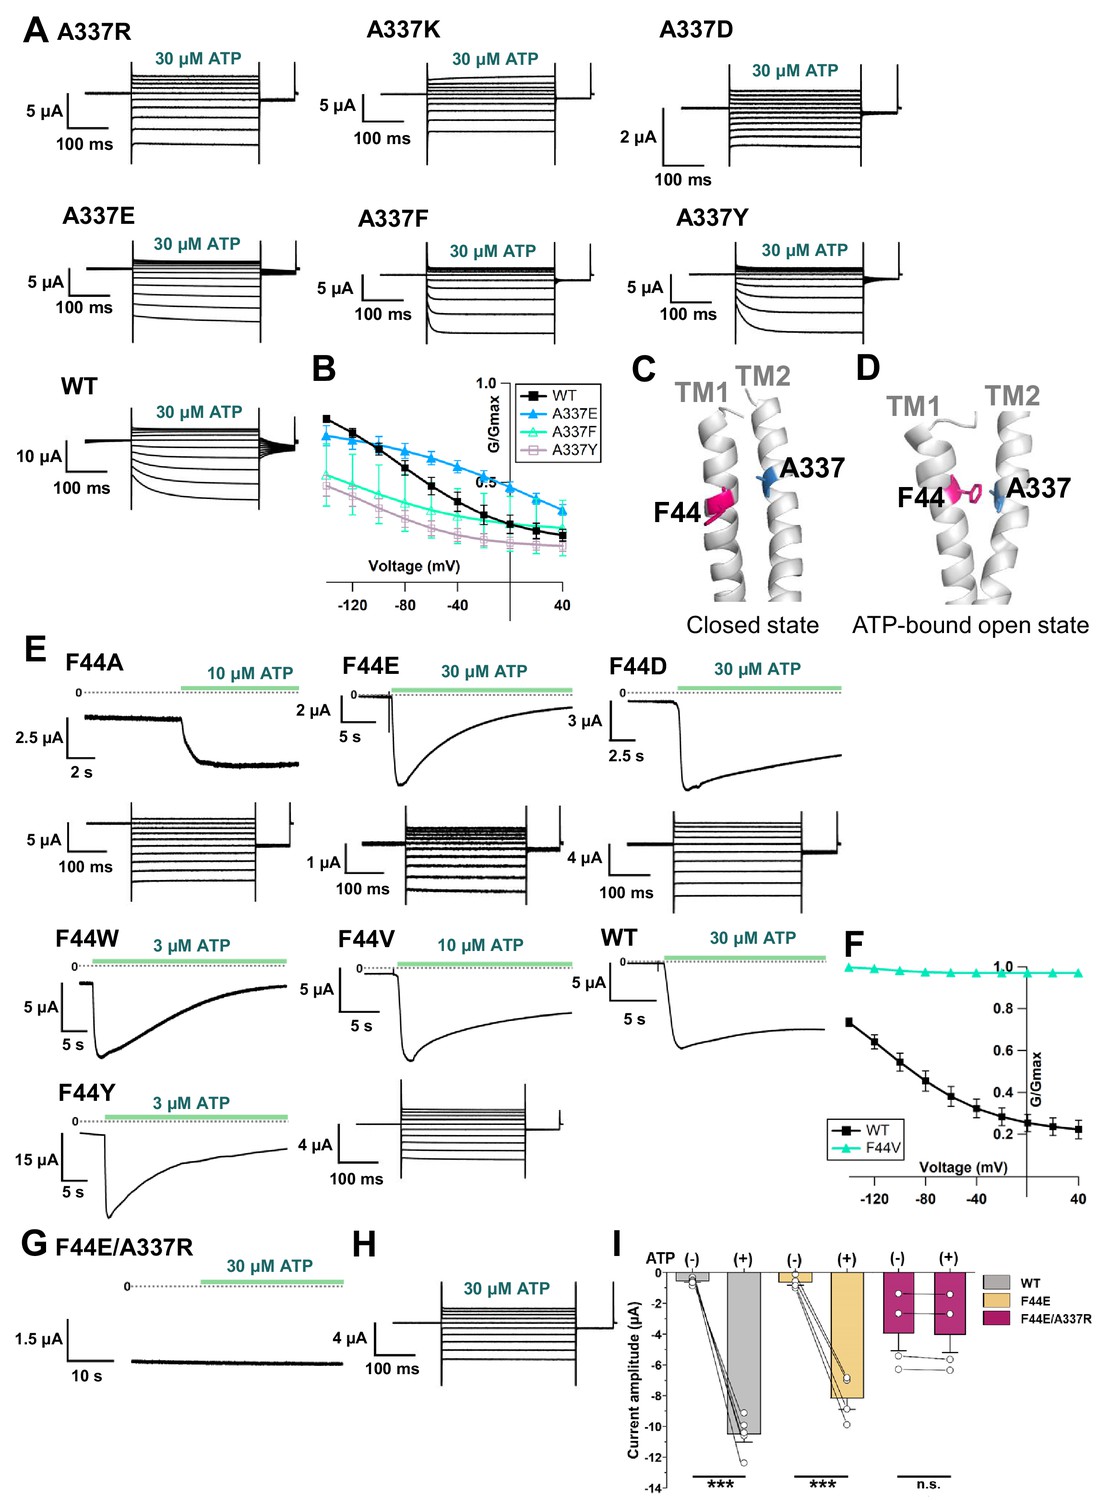
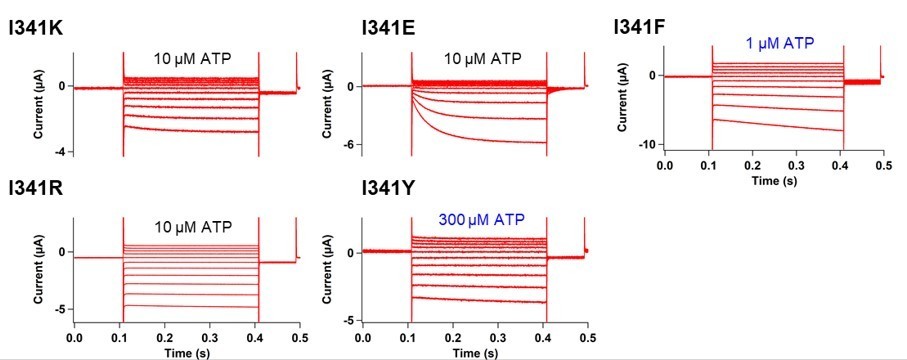
Effects of mutations at A337 in TM2 and F44 in TM1 on P2X2 receptor ATP- and voltage-dependent gating.
(A) Representative current traces of single amino acid mutants at the position of A337 in the presence of 30 µM ATP, in response to voltage step pulses from +40 mV to −140 mV, with a holding potential of −40 mV (A337R, A337K, A337D, A337E, A337F, A337Y, and WT, respectively). (B) Comparison of G-V relationships between WT (black filled square), A337E (blue filled triangle), A337F (turquoise open triangle), and A337Y (purple open square) for 30 µM ATP (n = 3), from tail current analysis at −60 mV. Normalization was based on the maximum conductance in the highest [ATP] (300 μM) for each construct. (C, D) Side view structure of the position of F44 (magenta) and A337 (blue) in the closed (C) and ATP-bound open (D) state, respectively. (E) Representative current traces of single amino acid mutants at the position of F44 upon application of various [ATP] (F44A, F44W, F44Y, F44E, F44D, and WT, respectively; n = 3–6 for each mutant). (F) G-V relationship comparison between WT (black filled square) and F44V (turquoise filled triangle) for 10 µM ATP (n = 3), showing that this mutant was equally active at all recorded voltages and was far less sensitive to voltage than wildtype. Normalization was based on the maximum conductance in the highest [ATP] (300 μM) for each construct. (G, H) Representative current traces of F44E/A337R upon ATP (G) and voltage (H) application. (I) Comparison of current amplitude of WT, F44E, and F44E/A337R before and after ATP application (***p≤0.001, p=0.00007 for WT, and p=0.00095 for F44E, paired t-test [n = 4–5]). All error bars are ± s.e.m. centered on the mean. Source data are provided in Figure 7—source data 1. Statistical analysis data are provided in Figure 7—source data 2.
-
Figure 7—source data 1
Effects of mutations at A337 in TM2 and F44 in TM1 on P2X2 receptor ATP- and voltage-dependent gating.
- https://cdn.elifesciences.org/articles/65822/elife-65822-fig7-data1-v2.xlsx
-
Figure 7—source data 2
Statistical analysis to support graph in Figure 7I.
- https://cdn.elifesciences.org/articles/65822/elife-65822-fig7-data2-v2.pdf
Figure 7—figure supplement 1
Effect of swapped mutation F44A/A337F.
(A–F) Representative current traces of F44A/A337F upon various [ATP] application (1, 3, 10, 30, 100, 300 µM), followed by voltage application at each concentration (n = 3). Voltage-dependent gating was almost absent, similar to F44A (Figure 7E).
Figure 8
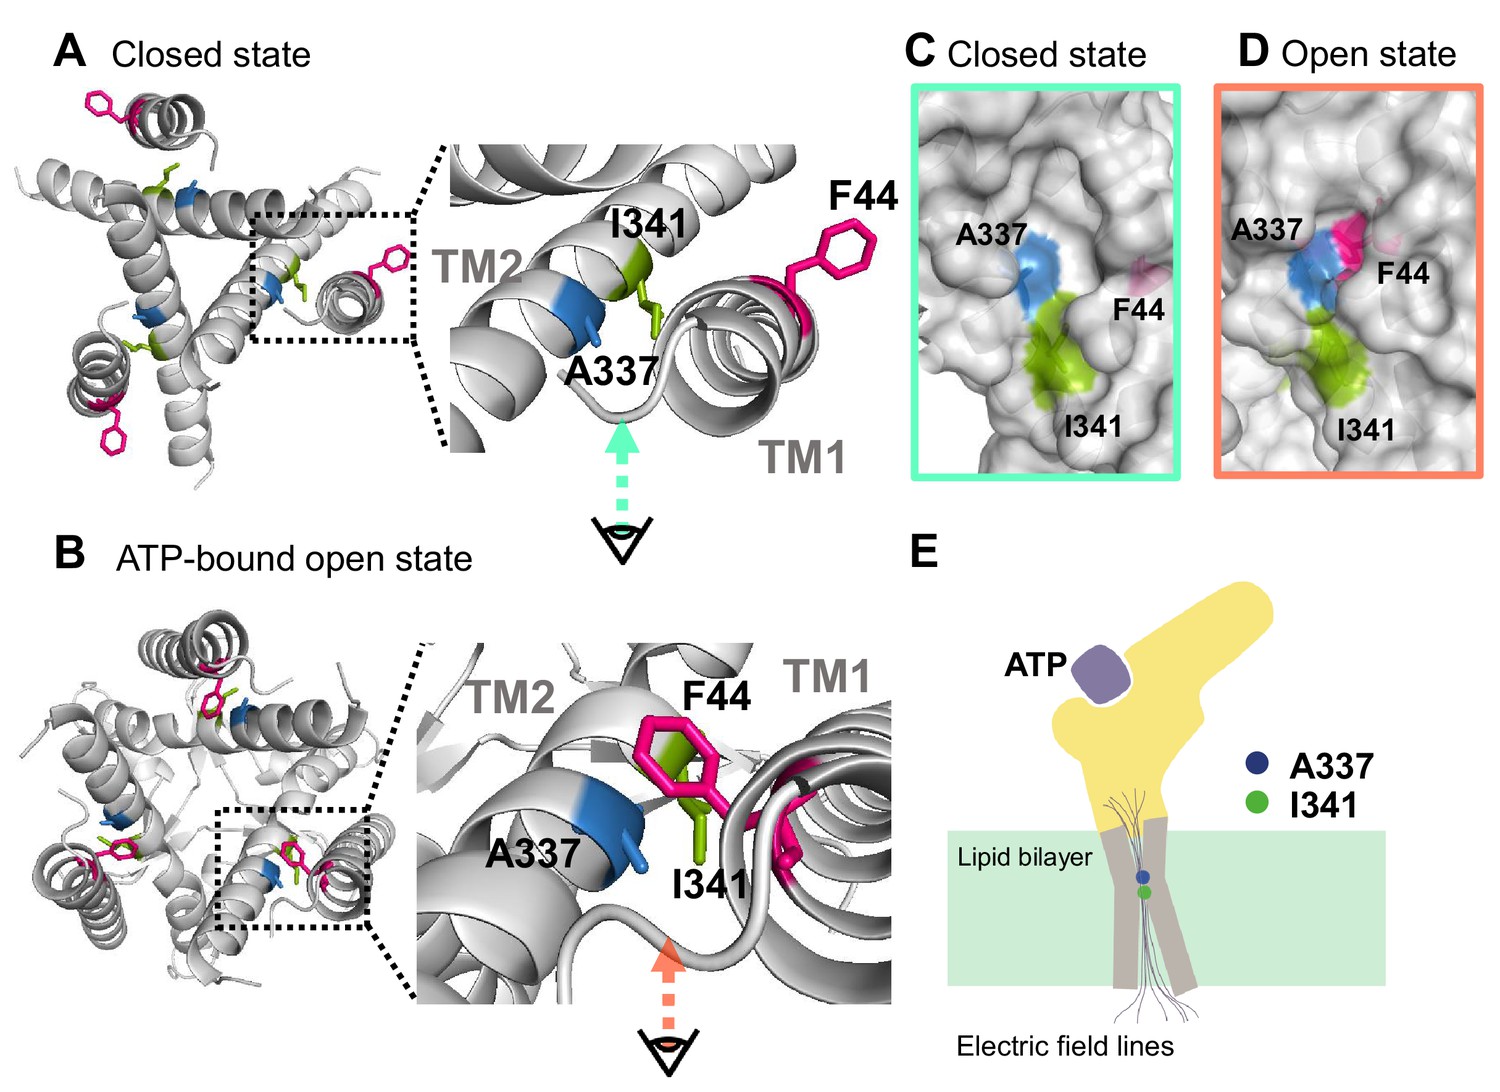
Proposed initiation mechanisms of P2X2 receptor complex gating.
(A, B) Top view structure of the P2X2 receptor in the closed (A) and ATP-bound open state (B). Depicted are the proposed initiation mechanisms of P2X2 receptor complex gating as follows. (1) The electric convergence at A337 and I341; (2) F44 moves toward A337 in the TM2 domain upon ATP binding; (3) hyperpolarization-induced structural rearrangements around A337 in TM2; (4) interaction between A337 and F44 in the ATP-bound open state is thought to be under the influence of the converged electric field. (C, D) Side view of the surface representation of the crevices in the converged electric field in the closed state (C) and ATP-bound open state (D). (E) A schematic illustration of the focused electric field at A337 and I341. The ion permeation pathway is not depicted in this scheme.
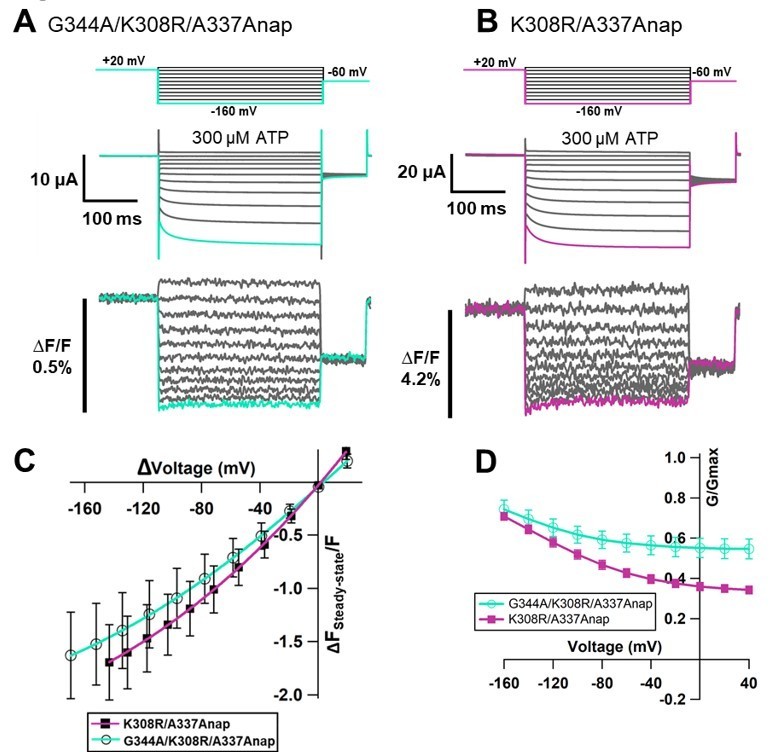
Author response image 1
Author response image 2

Author response image 3
Author response image 4
Author response image 5
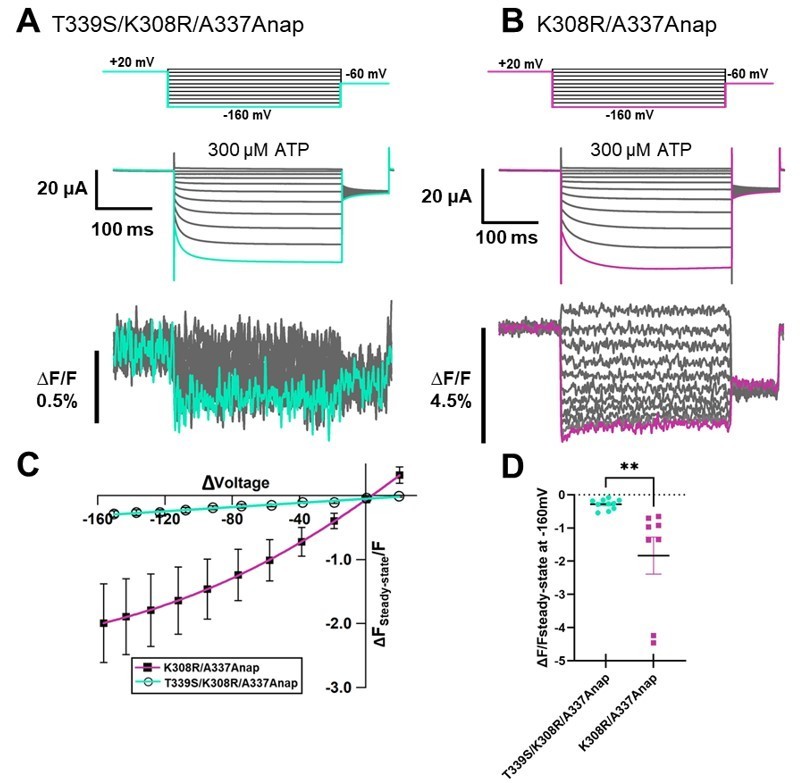
Author response image 6
Tables
Key resources table
| Reagent type (species) or resource | Designation | Source or reference | Identifiers | Additional information |
|---|---|---|---|---|
| Gene (Rattus norvegicus) | Rattus norvegicus P2X2 | Brake et al., 1994 | ||
| Gene (Ciona intestinalis) | Ciona intestinalis voltage-sensing phosphatase (Ci-VSP) | Sakata et al., 2016 | ||
| Strain, strain background (Escherichia coli) | XL1-Blue | Agilent Technologies | ||
| Strain, strain background (Escherichia coli) | TG1 | Clontech | ||
| Recombinant DNA reagent | pAnap (plasmid) | Addgene | Plasmid #48696 | cDNA encoding the tRNA synthetase/Anap-CUA |
| Commercial assay or kit | QuikChange II site-directed mutagenesis | Agilent Technologies | 200524 | |
| Commercial assay or kit | mMESSAGE T7 RNA transcription kit | Thermo Fisher Scientific | AM1344 | |
| Commercial assay or kit | mMESSAGE SP6 RNA transcription kit | Thermo Fisher Scientific | AM1340 | |
| Chemical compound, drug | 0.15% tricaine | Sigma-Aldrich | ||
| Chemical compound, drug | Collagenase type 1 | Sigma-Aldrich | ||
| Chemical compound, drug | ATP disodium salt | Sigma-Aldrich | 34369-07-8 | |
| Chemical compound, drug | Anap sodium salt | FutureChem Chemicals | FC-8101 | |
| Chemical compound, drug | HG 9-91−01/SIK inhibitor | MedChem Express | 1456858-58-4 | |
| Chemical compound, drug | Suramin sodium salt | Sigma-Aldrich | 129-46-4 | |
| Chemical compound, drug | PPADS tetrasodium salt | Sigma-Aldrich | P178 | |
| Software, algorithm | Igor Pro 5.01 | Wavemetrics | RRID:SCR_000325 | |
| Software, algorithm | PyMOL Molecular Graphics System ver. 2.3.0 | Schrodinger LLC | RRID:SCR_000305 | |
| Software, algorithm | OriginPro | OriginLab | RRID:SCR_014212 | |
| Software, algorithm | GraphPad Prism 9 | GraphPad Software, Inc. | RRID:SCR_002798 | |
| Software, algorithm | SWISS-MODEL | Arnold et al., 2006; Biasini et al., 2014 | RRID:SCR_018123 | |
| Software, algorithm | Protter protein visualization | Omasits et al., 2014 | https://wlab.ethz.ch/protter/start/ | |
| Software, algorithm | BioRender | BioRender.com | RRID:SCR_018361 | Figure 1A created with BioRender |
Additional files
-
Supplementary file 1
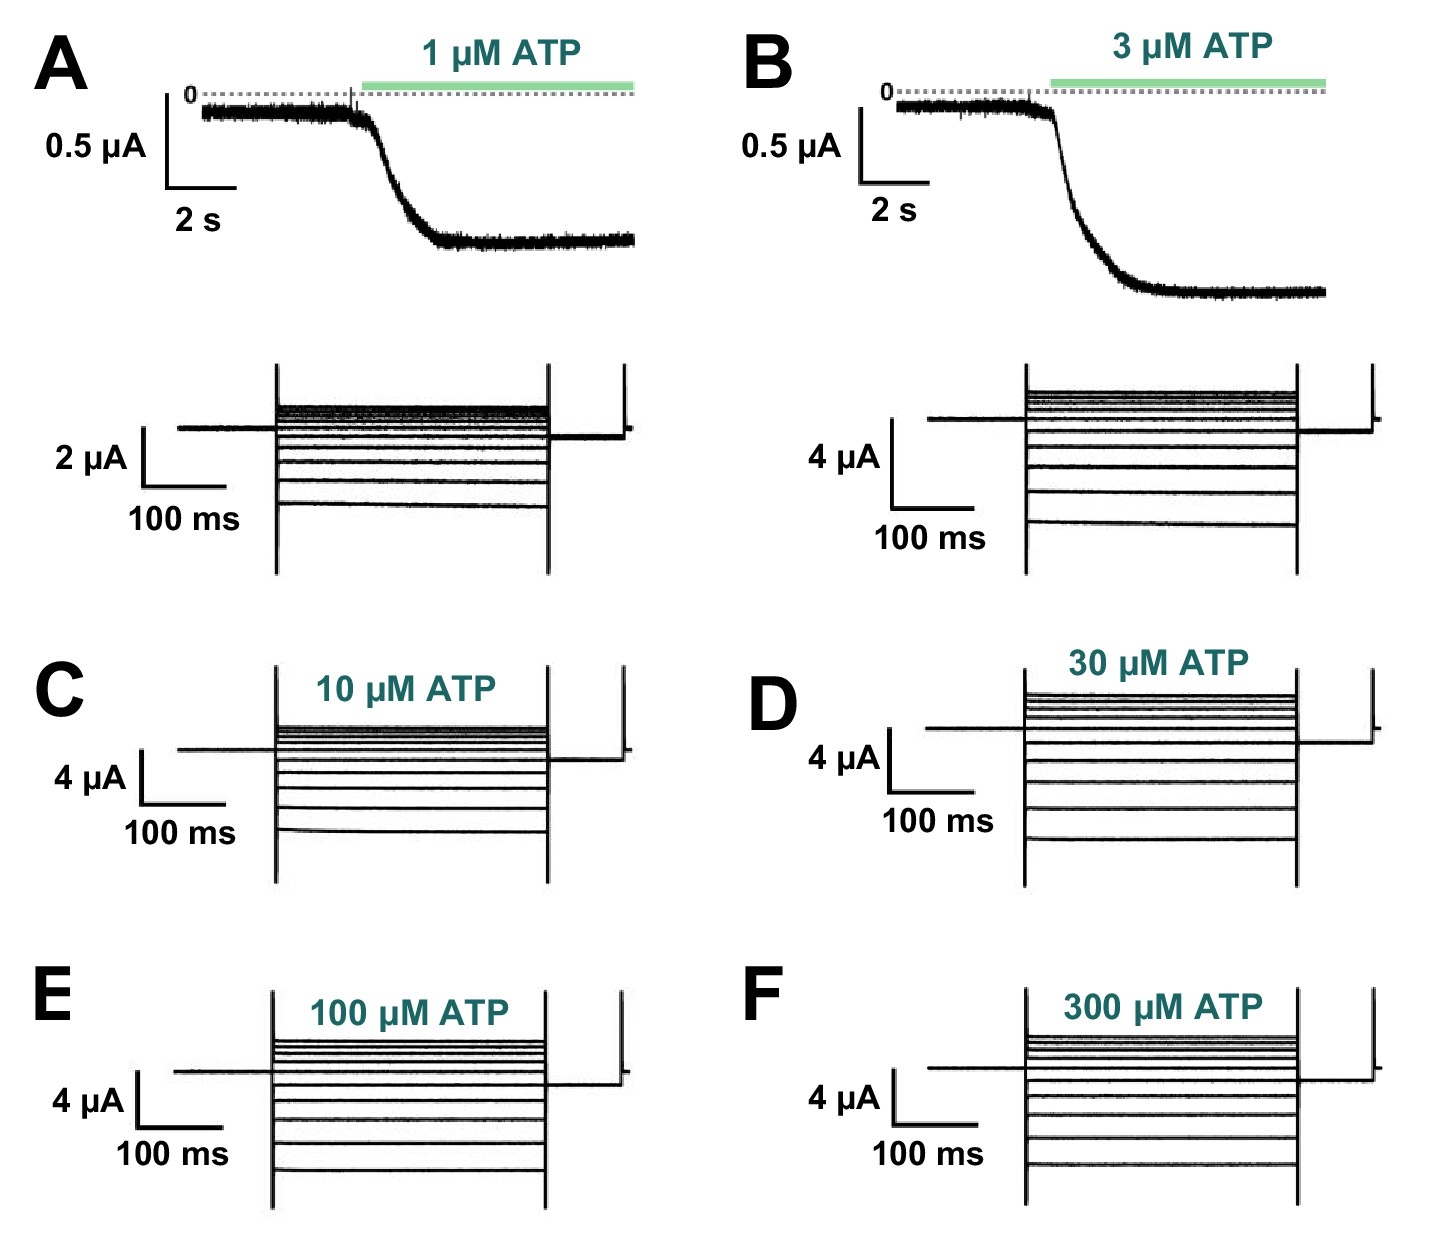
List of introduced TAG mutations in P2X2 receptor for VCF analysis.
Mutations were introduced one at a time into 96 positions within the extracellular domain (ECD) near the ATP-binding site and extracellular linker, transmembrane domains (TMs), intracellular N-terminal, and intracellular C-terminal. ATP application ranging from 10 µM, 30 µM, or 100 µM unless otherwise stated. (+) indicates there was either ATP-evoked fluorescence (F) signal change, voltage-evoked F change, ATP-evoked current (I) change, or voltage-evoked I change. (-) indicates negative results. (**) indicates mutants which have a very low expression level, so that the reliable VCF analysis could not be undertaken. (***) indicates fast current decay. (--) indicates that the subsequent recording could not be performed, as a result of fast current decay. (n.d.) indicates not determined.
- https://cdn.elifesciences.org/articles/65822/elife-65822-supp1-v2.docx
-
Transparent reporting form
- https://cdn.elifesciences.org/articles/65822/elife-65822-transrepform-v2.docx
Download links
A two-part list of links to download the article, or parts of the article, in various formats.
Downloads (link to download the article as PDF)
Open citations (links to open the citations from this article in various online reference manager services)
Cite this article (links to download the citations from this article in formats compatible with various reference manager tools)
Voltage-clamp fluorometry analysis of structural rearrangements of ATP-gated channel P2X2 upon hyperpolarization
eLife 10:e65822.
https://doi.org/10.7554/eLife.65822


