Structural basis of the effect of activating mutations on the EGF receptor
- Department of Chemistry, University College London, United Kingdom
- Institute of Pharmaceutical Sciences of Western Switzerland, University of Geneva, Switzerland
- Oncology R&D, AstraZeneca, United Kingdom
- UCL School of Pharmacy, University College London, United Kingdom
- Institute of Structural and Molecular Biology, University College London, United Kingdom
- Pharmaceutical Sciences, University of Geneva, Switzerland
Figures
Figure 1 with 4 supplements

Active conformation of the somatic mutations on EGFR kinase domain studied here.
The αC-helix is depicted in cyan, while the A-loop in orange. The point of deleted residues in the ΔELREA mutant is indicated with a red dot. In the case of the point mutation L858R, and the two Ex20Ins, the residues associated with the mutation are depicted in red spheres.
Figure 1—figure supplement 1
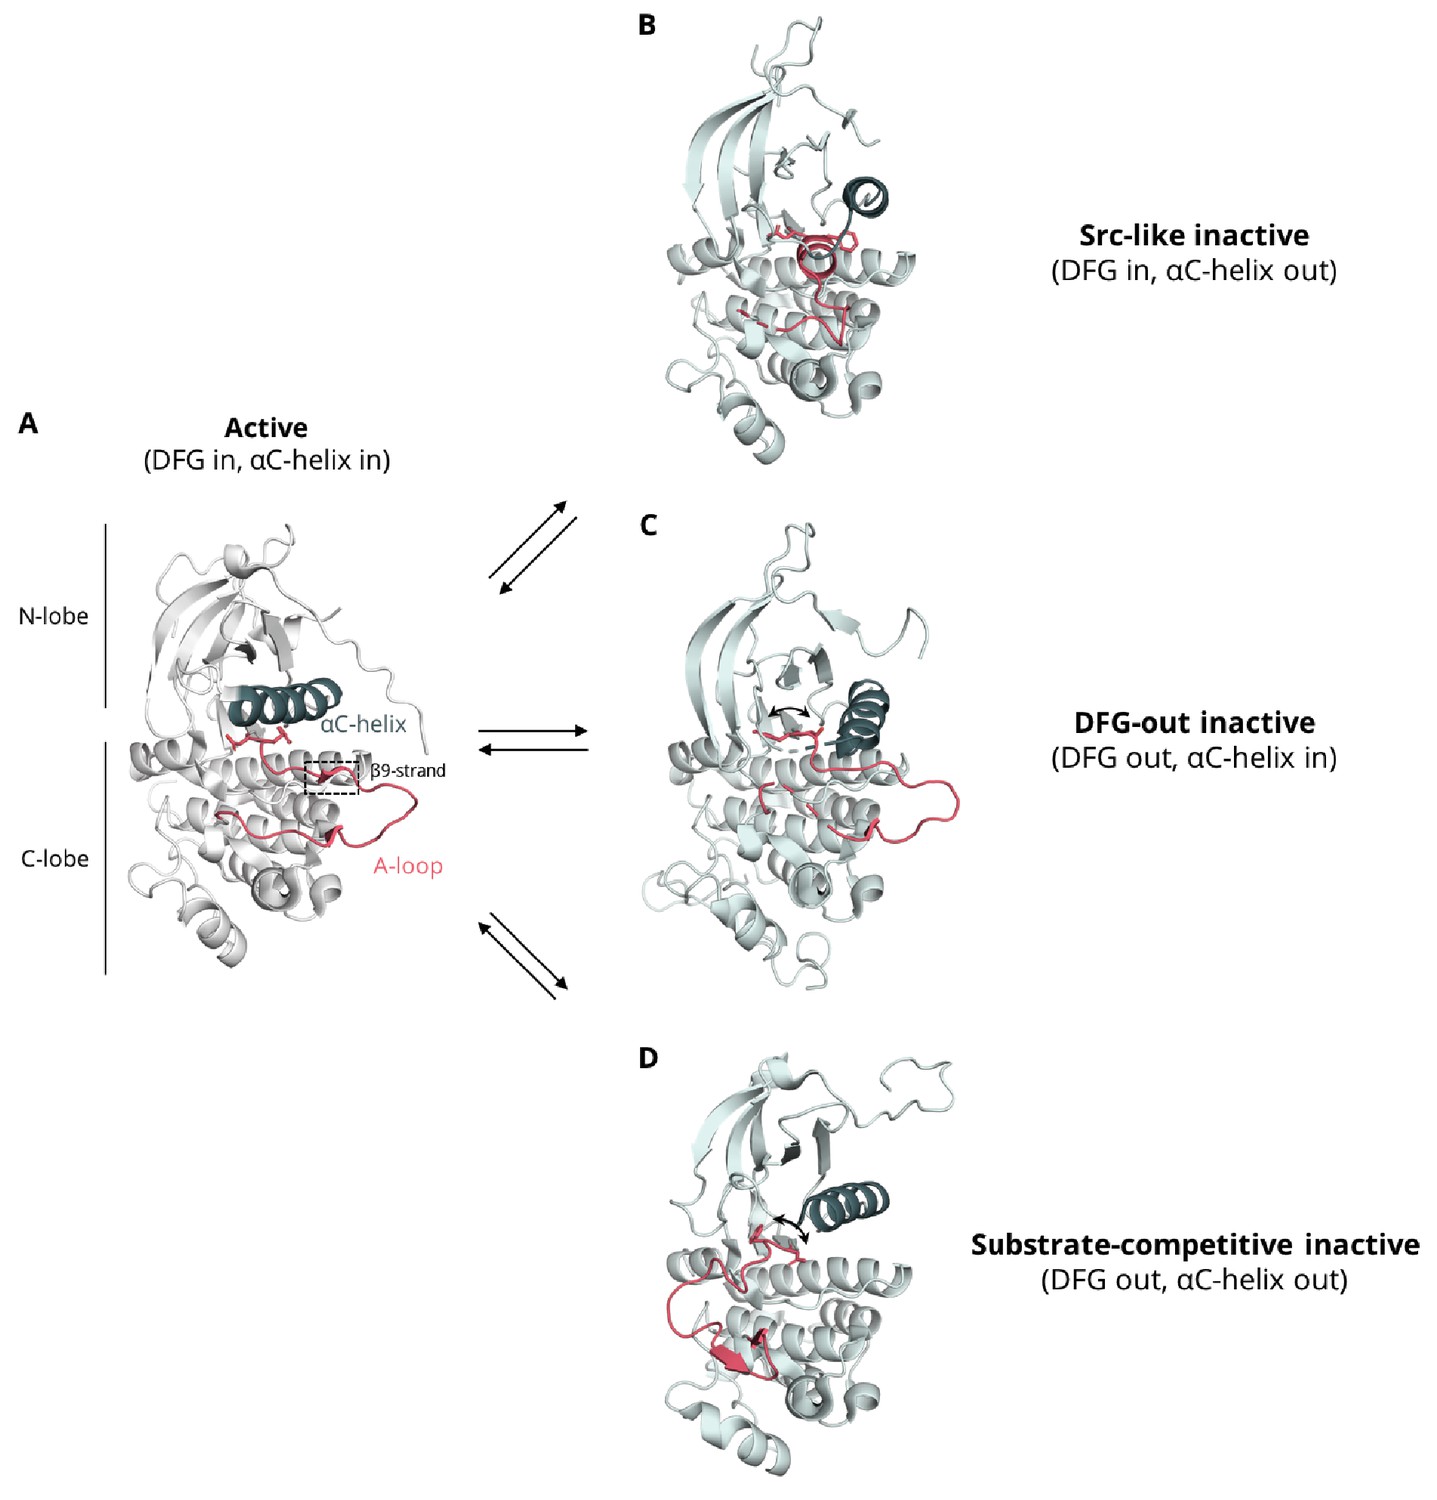
Conformational variability of the αC-helix and A-loop of the kinase domain.
(A) active conformation in which the A-loop assumes an extended conformation, forming usually a β-strand (β9) with residues of the C-lobe, the αC-helix is found in the αC-in conformation, and the DFG motif in the ‘DFG-in’ orientation, where the aspartate of the motif is arranged properly for the catalysis and coordination of ATP (EGFR, PDB ID: 2ITP), (B) Src-like inactive conformation in which the A-loop forms a two-turn helix in its N-terminal region, the DFG motif is in the ‘DFG-in’ orientation, and the αC-helix is found in the αC-out, where the helix rotates away from the core disrupting an important salt bridge between an aspartate and a lysine residue that is essential for catalysis (EGFR, PDB ID: 2GS7), (C) DFG-out inactive conformation in which the A-loop assumes a conformation similar to the one seen in the active conformation, the catalytic aspartate is flipped out from the active site leading to a ‘DFG-out’ orientation, while the αC-helix is in its active, αC-in position (EGFR, PDB: 2RF9), (D) substrate-competitive conformation, in which the A-loop points away from the αC-helix and shields the binding site, the DFG motif assumes the 'DFG-out' orientation, and the αC-helix is found in the αC-out position (Abl, PDB ID: 1OPJ). This conformation has been captured via MD simulations as an intermediate state during the DFG flip of EGFR (Shan et al., 2013).
Figure 1—figure supplement 2
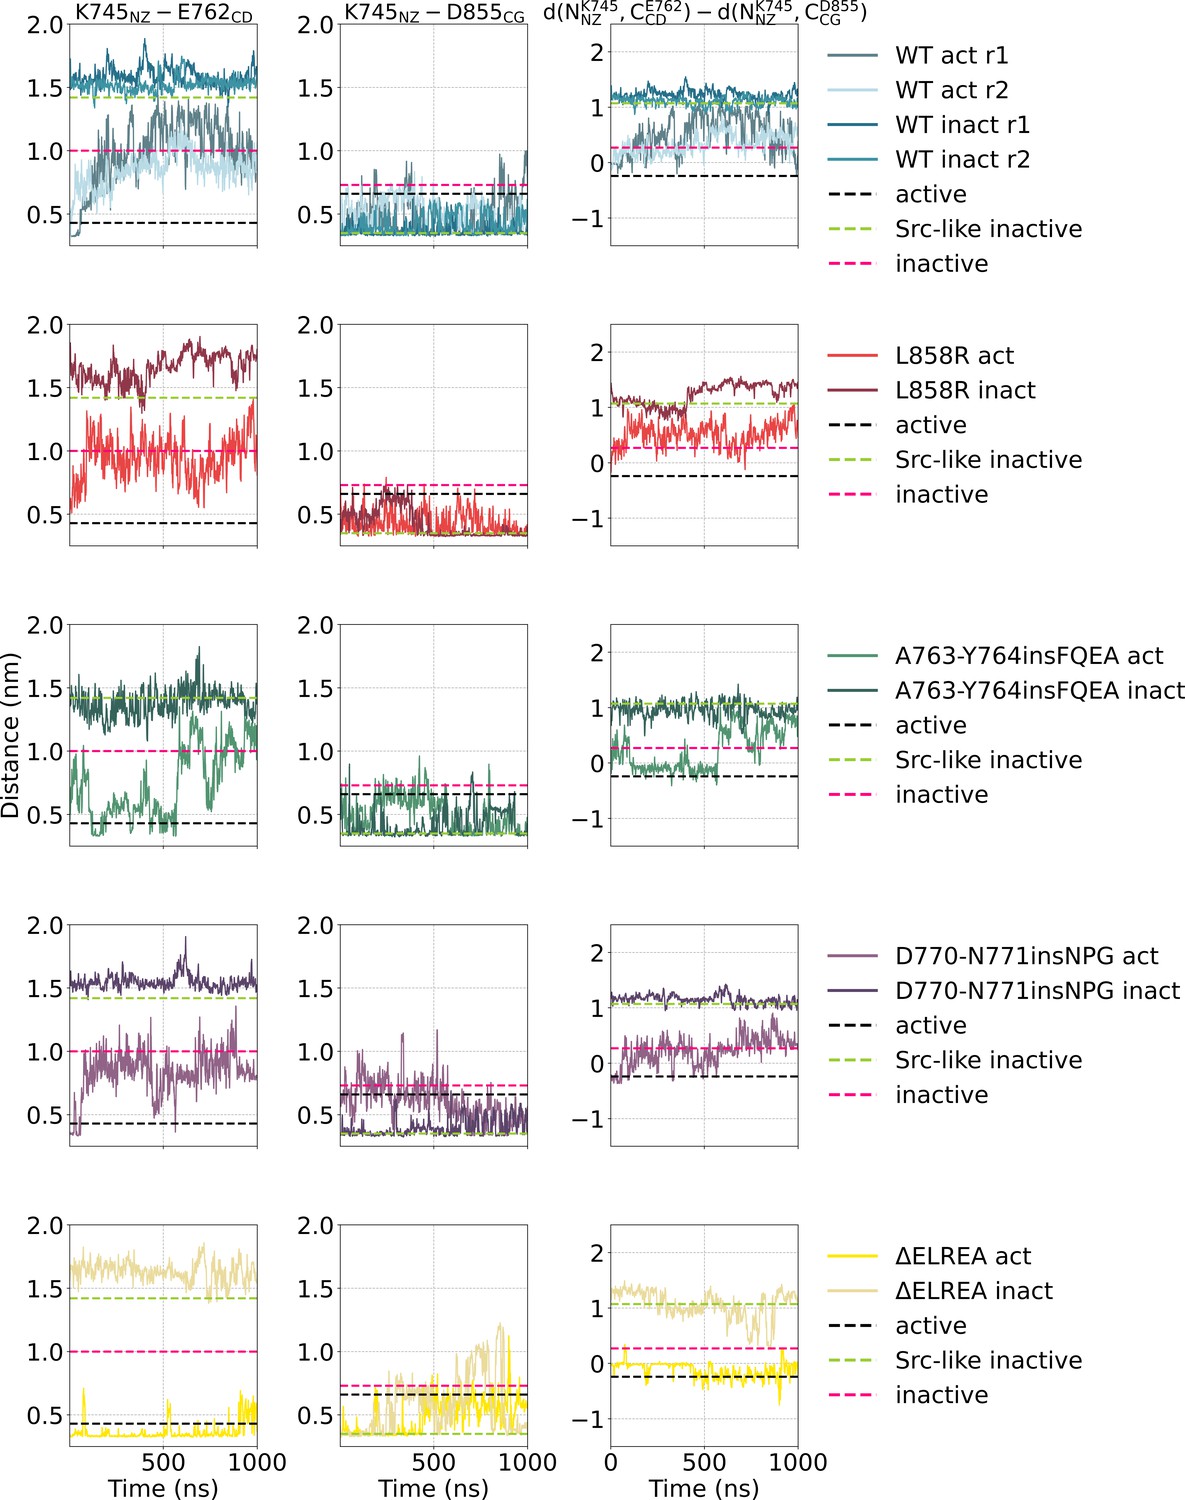
Simple moving averaged time series of the distance between two salt-bridge-forming residue pairs K745-E762 and D855-E762 over the course of the unbiased simulations starting from the monomeric active or Src-like inactive conformation.
Simple moving averaged time series of the distance between two salt-bridge-forming residue pairs K745-E762 and D855-E762 over the course of the unbiased simulations starting from the monomeric active or Src-like inactive conformation. An averaging window of 200 was used to smooth the calculated distances. The distance between the representative atoms of each residue in the crystal structures of the active (PDB ID: 2GS2, black), Src-like, DFG-in inactive (PDB ID: 2GS7, green), and inactive, DFG-out (PDB ID: 2RF9, pink) conformation are highlighted with dashed lines.
Figure 1—figure supplement 3
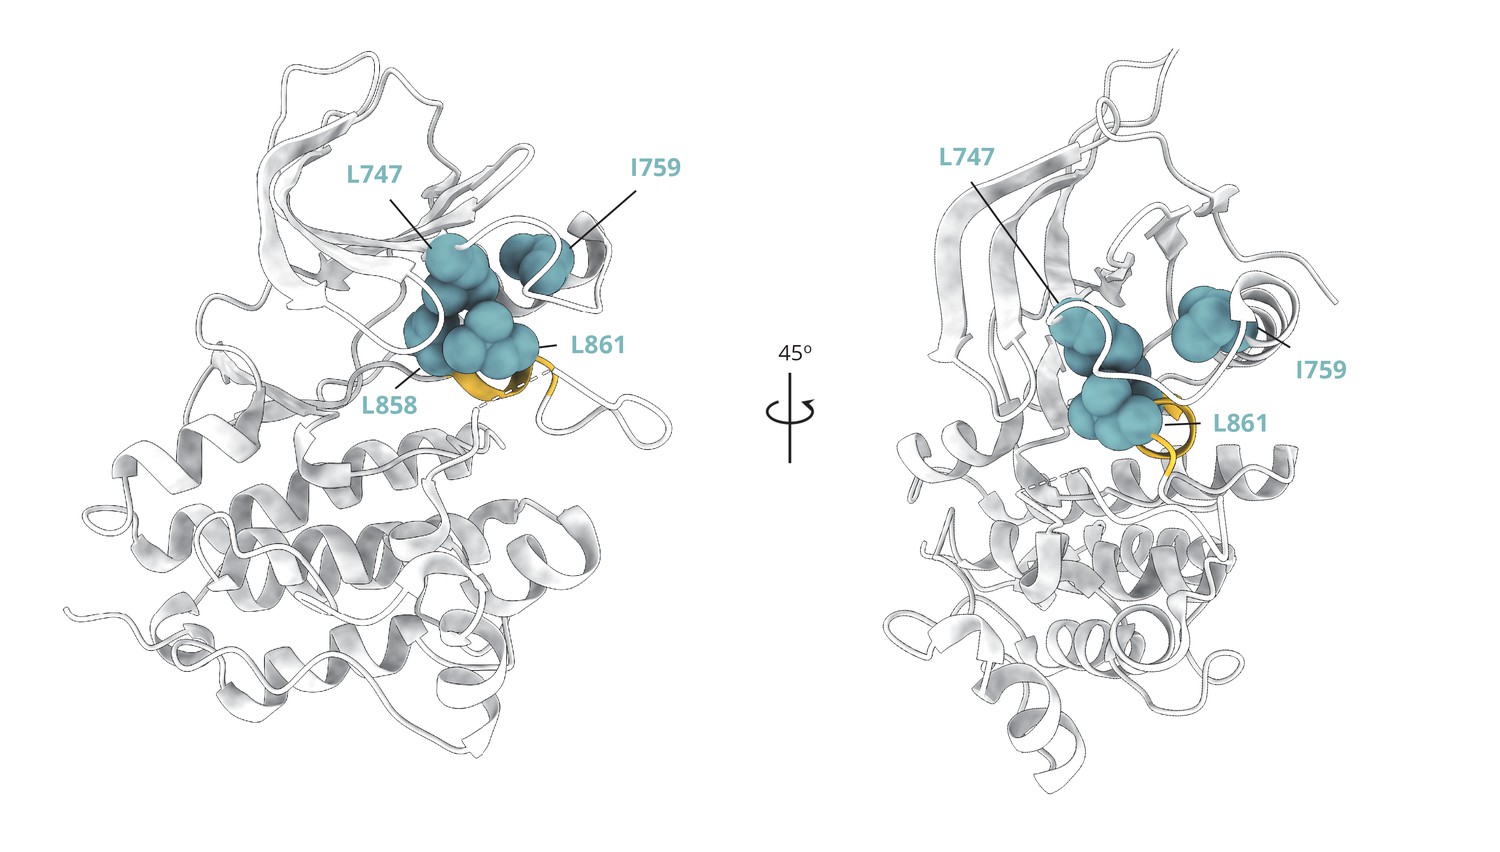
Cluster of hydrophobic residues that stabilize the two-turn helix of the A-loop and the Src-like inactive conformation overall.
Cluster of hydrophobic residues (blue spheres) whose side chains pack together to stabilize the two-turn helix (yellow) of the A-loop and the Src-like inactive conformation (PDB ID: 2GS7) overall.
Figure 1—figure supplement 4
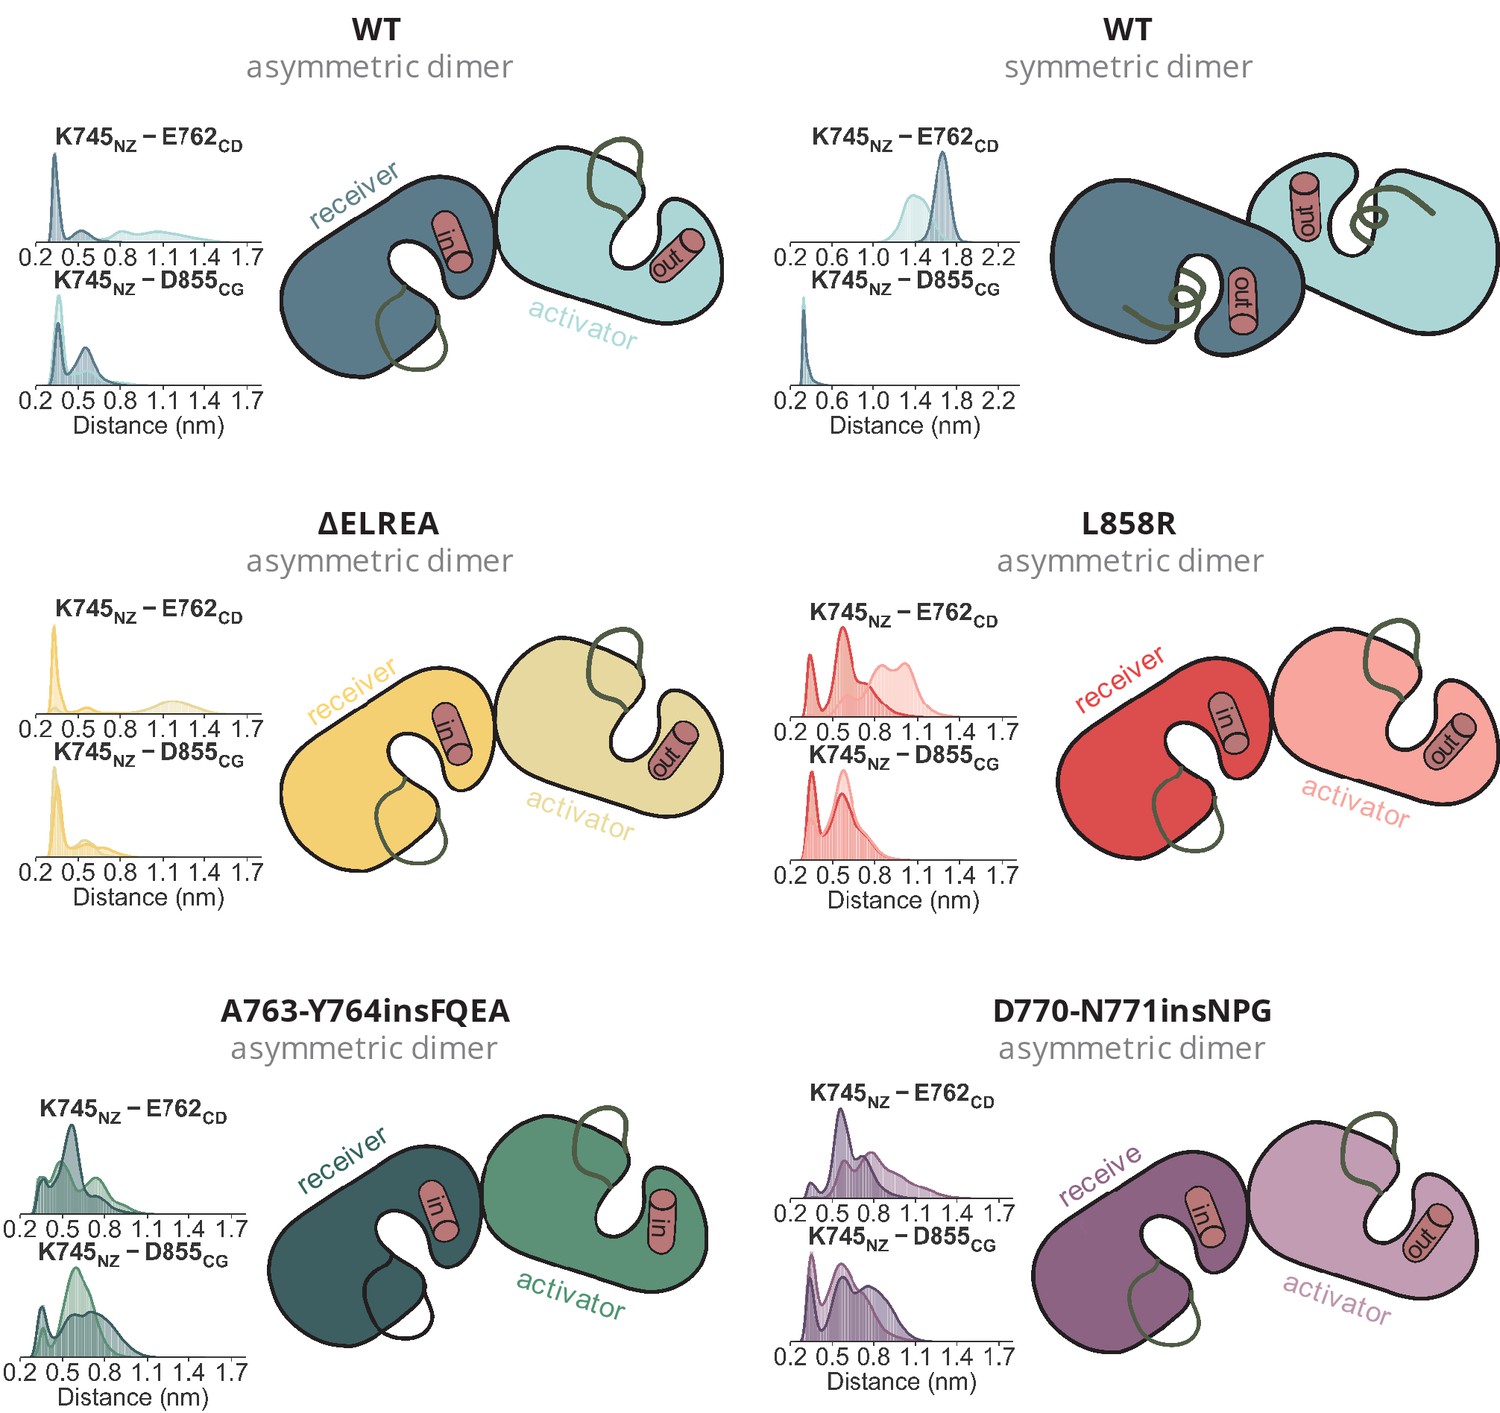
Position of the αC-helix in each monomer of the simulated dimers.
Position of the αC-helix in each monomer of the simulated dimers. The distances over the course of the dimeric simulations between K745, E762, and D855, which together probe the position of the helix are given as distributions.
Figure 2
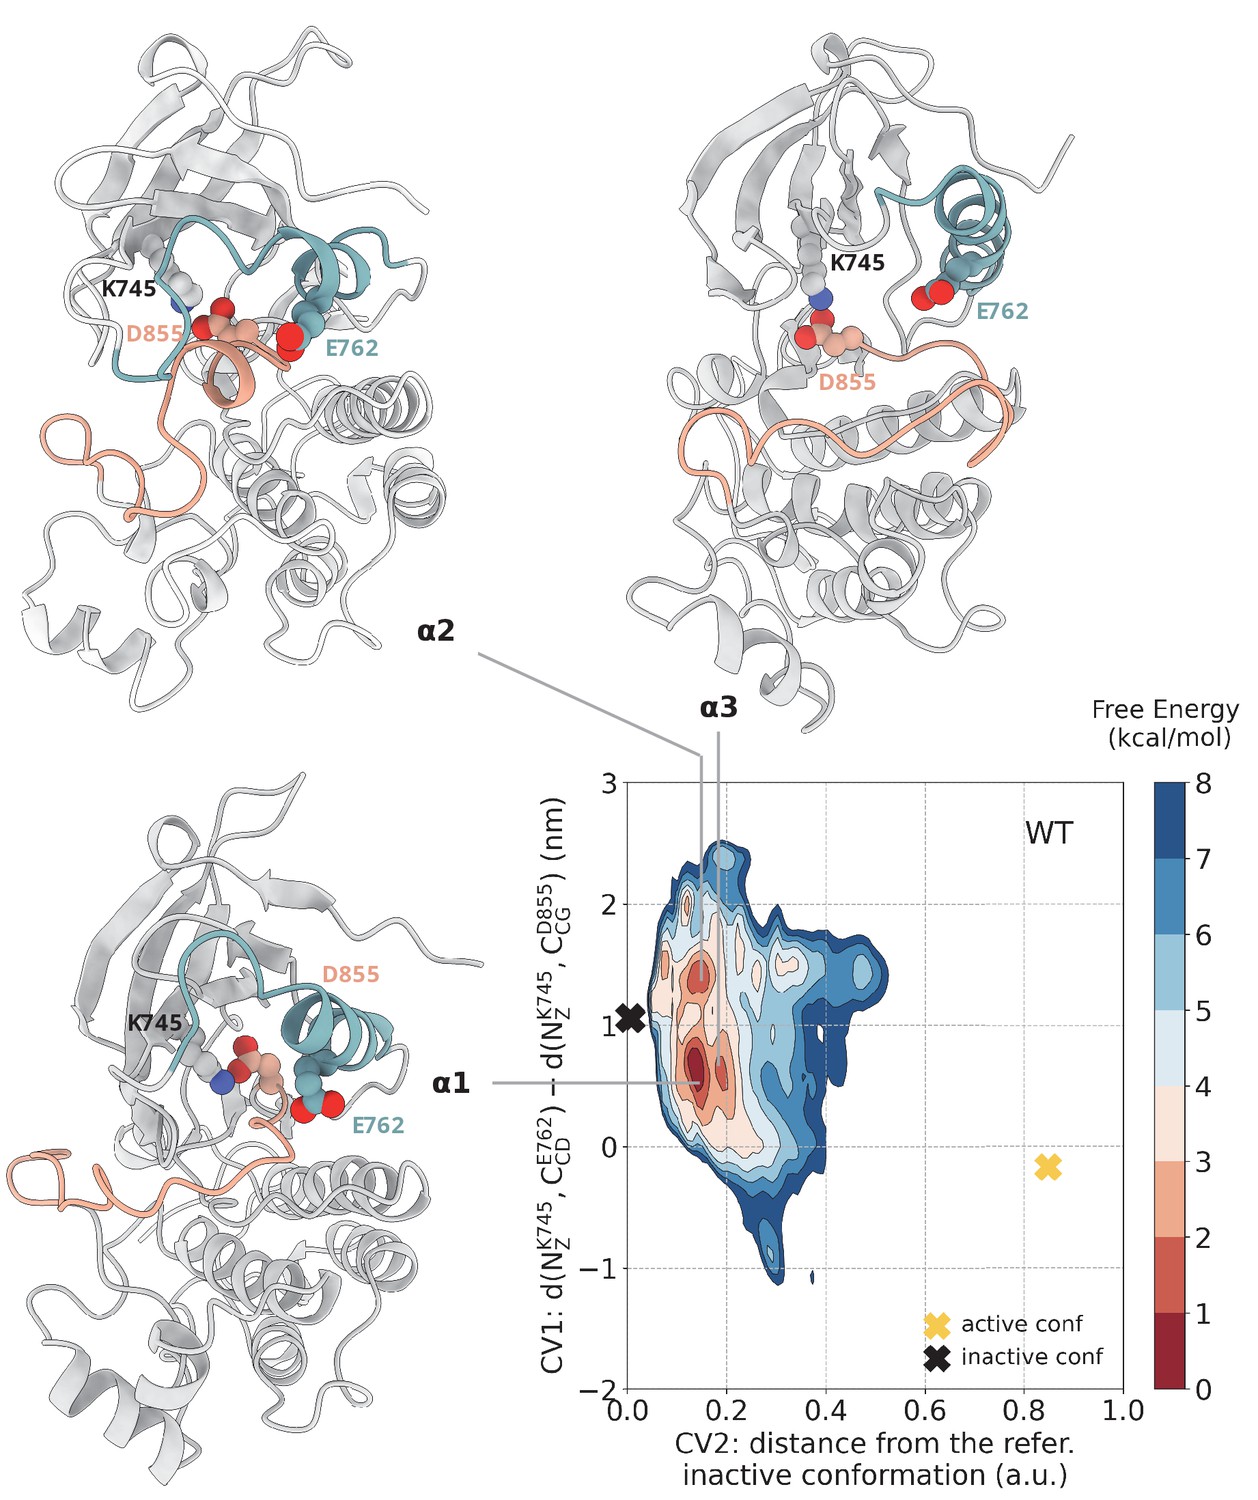
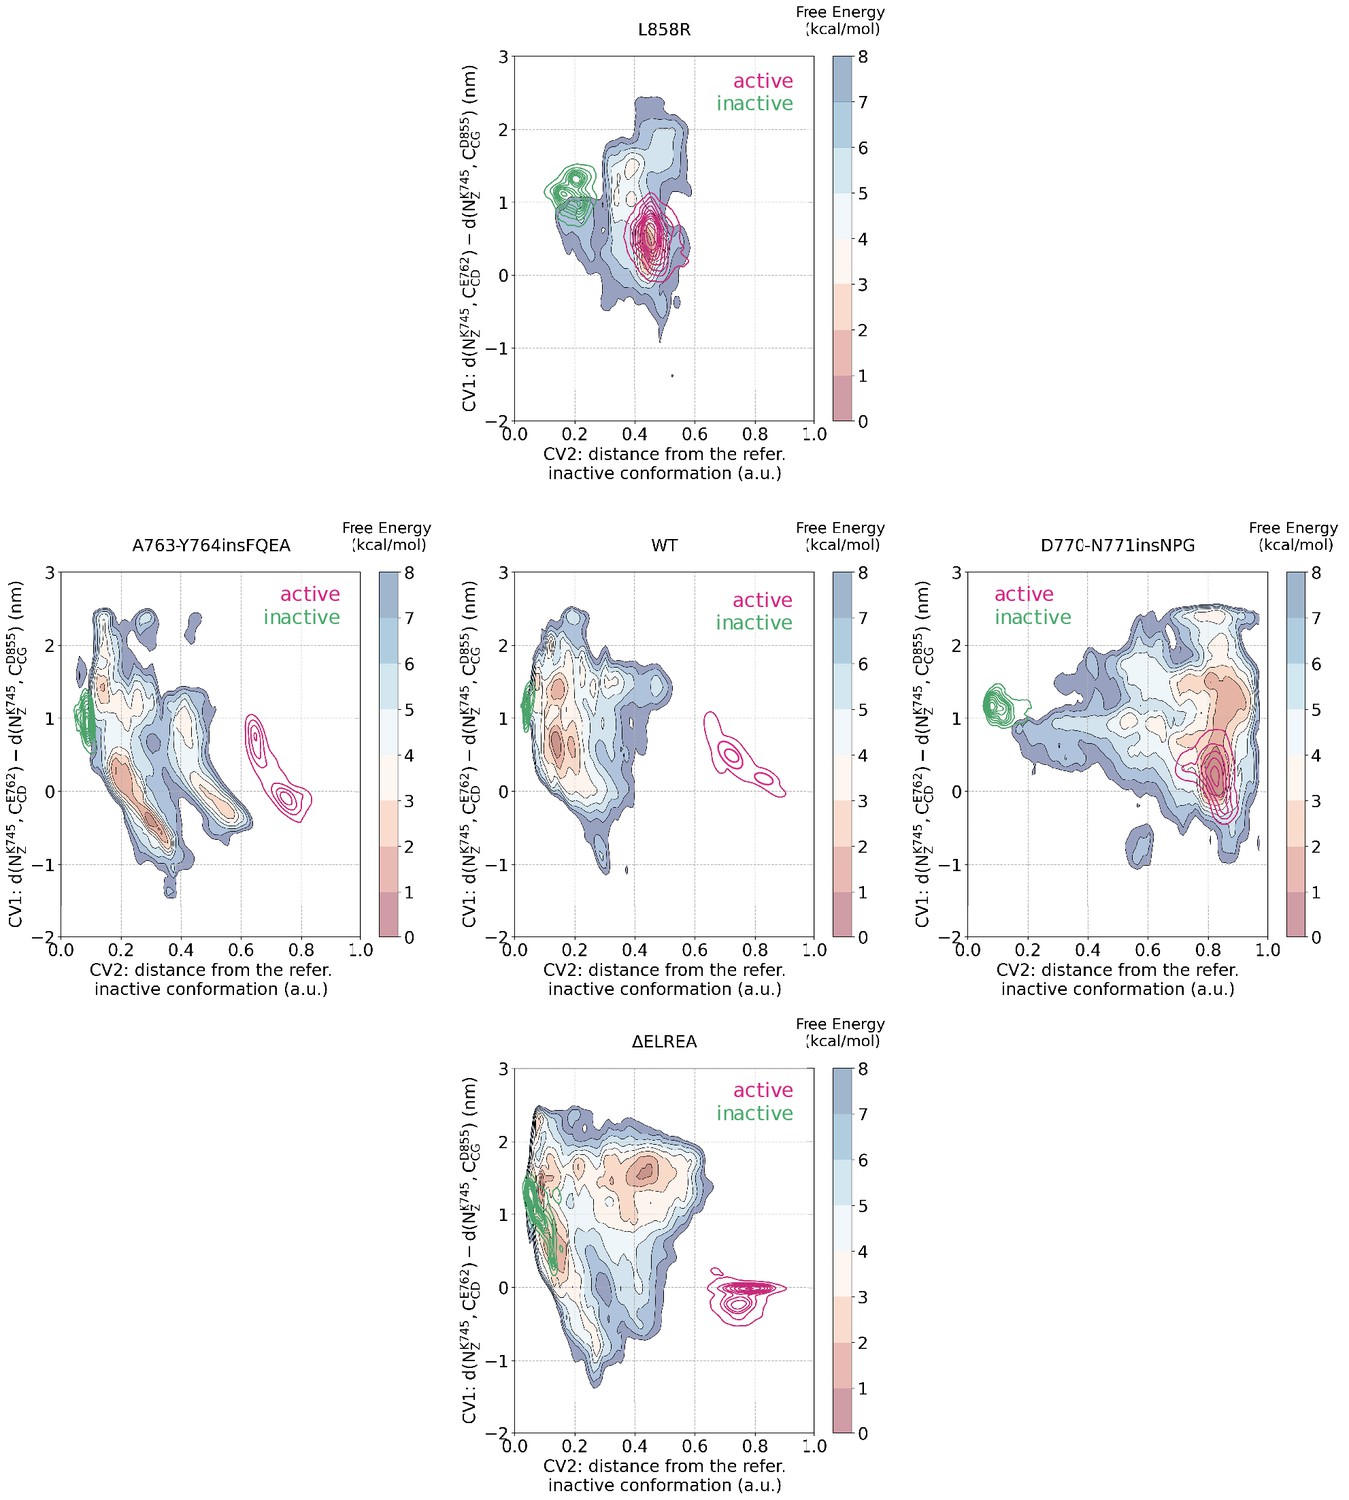
Free energy surface of the WT EGFR as a function of CV1 (distances between K745:E762 and K745:D855) and CV2 (distance from reference Src-like inactive structure).
Representative structures for free energy minima are depicted in cartoon representation. A yellow cross indicates the position of the active conformation (PDB ID: 2GS2) in the explored CV space, while a black cross indicates the position of the Src-like inactive conformation (PDB ID: 2GS7) as reference.
Figure 3 with 1 supplement

Free energy surface of the L858R mutant as a function of CV1 and CV2.
Representative structures for two main conformations found in the deepest minimum are depicted in cartoon representation. The interaction of R858 with E758 and E762 is responsible for the secondary structure stability of the αC-helix, while the interaction of R858 with D837 and D855 prevents the formation of the two-turn helix on the A-loop. A yellow cross indicates the position of the active conformation (PDB ID: 2ITV) in the explored CV space, while a black cross indicates the position of the Src-like inactive conformation (homology model) as reference.
Figure 3—figure supplement 1
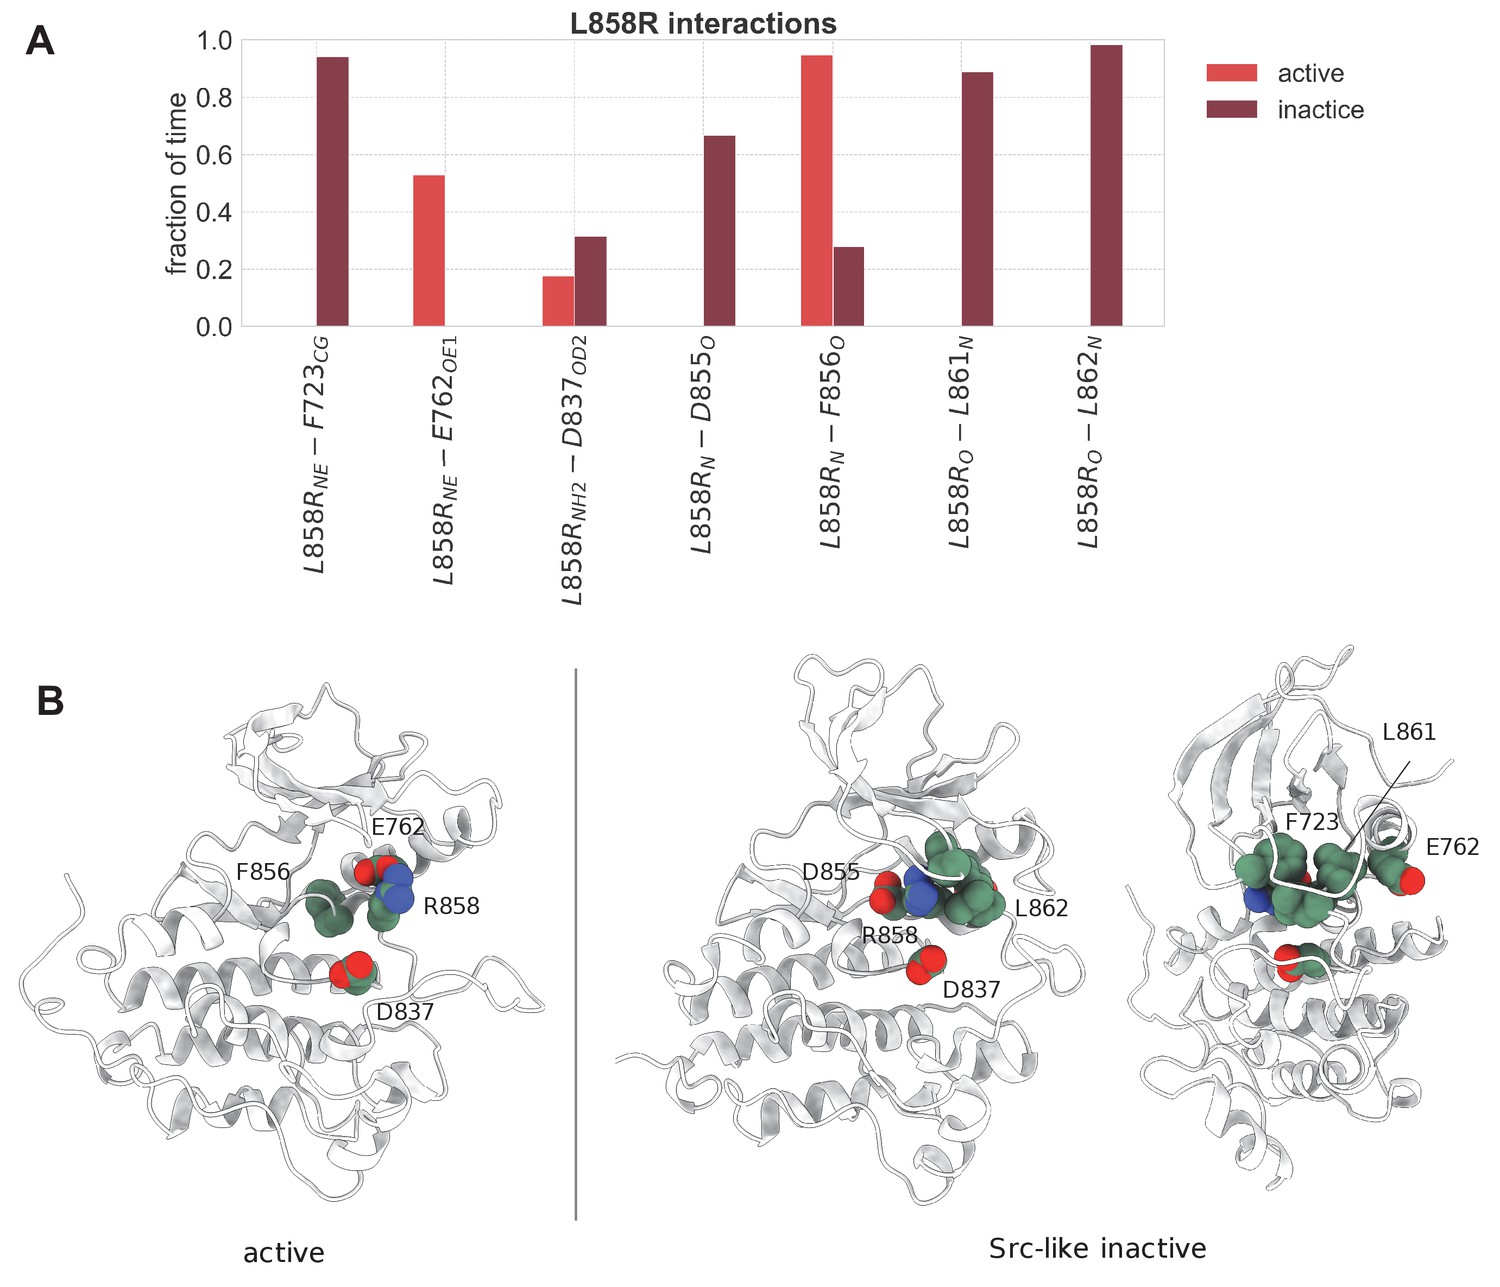
Important interactions of L858R with neighboring residues that are maintained over the course of the unbiased simulations of the monomeric L858R EGFR.
(A) Important interactions of L858R with neighboring residues that are maintained over the course of the unbiased simulations of the monomeric L858R EGFR. The estimation of the time fraction that the residues are considered to interact is based on distance criteria (d < 0.75 nm for hydrophobic interactions, d < 0.35 nm for hydrogen bonds, and d < 0.45 nm for salt bridges). The representative side-chain and backbone atoms of the interacting residues that have been considered for every interaction are denoted in subscript. (B) Graphical representation of the important interactions that L858R participates in and described in (A). The depicted structures were selected from the unbiased simulations of the monomeric state.
Figure 4 with 3 supplements
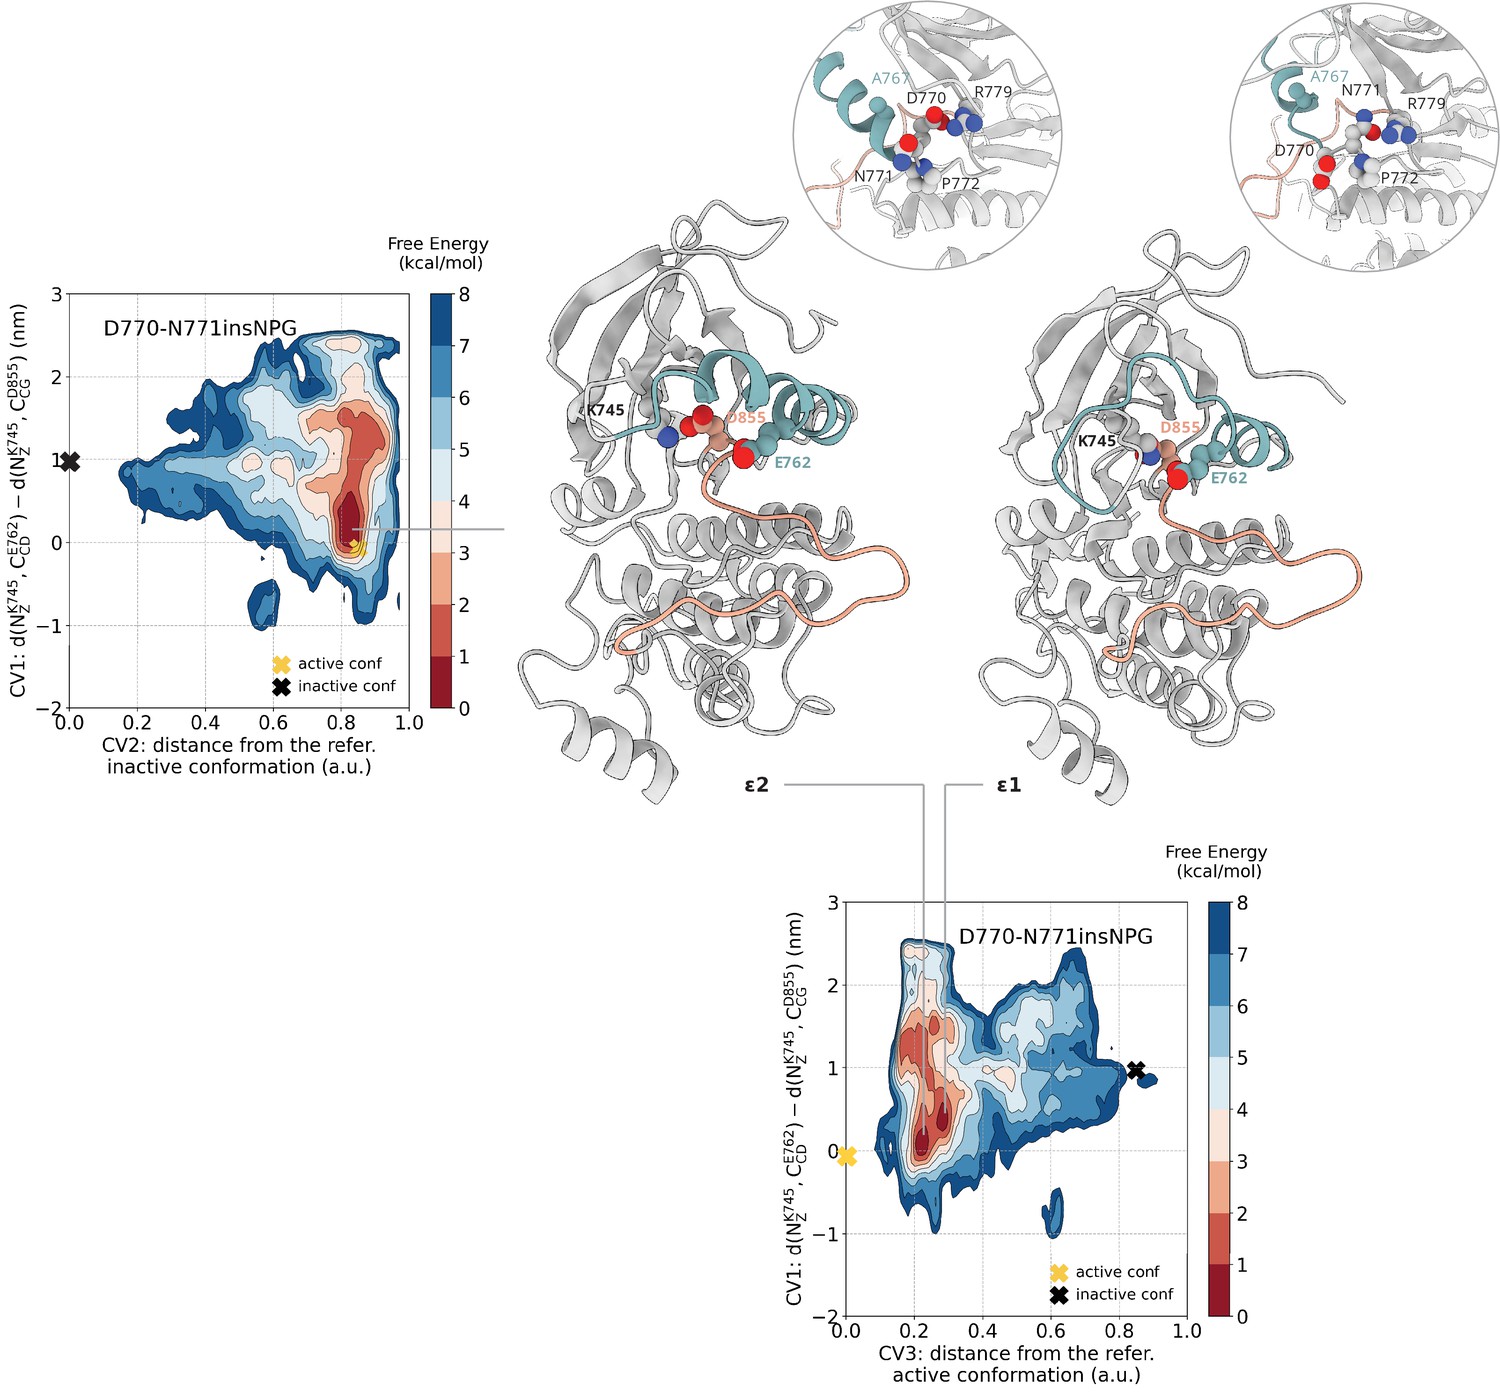
Free energy surface of the D770-N771insNPG mutant as a function of CV1 and CV2 as well as of CV1 and CV3.
Representative structures of the two main conformations found in the deepest minima are depicted in cartoon representation. A yellow cross indicates the position of the active conformation (PDB ID: 4LRM) in the explored CV space, while a black cross indicates the position of the Src-like inactive conformation (homology model) as reference.
Figure 4—figure supplement 1
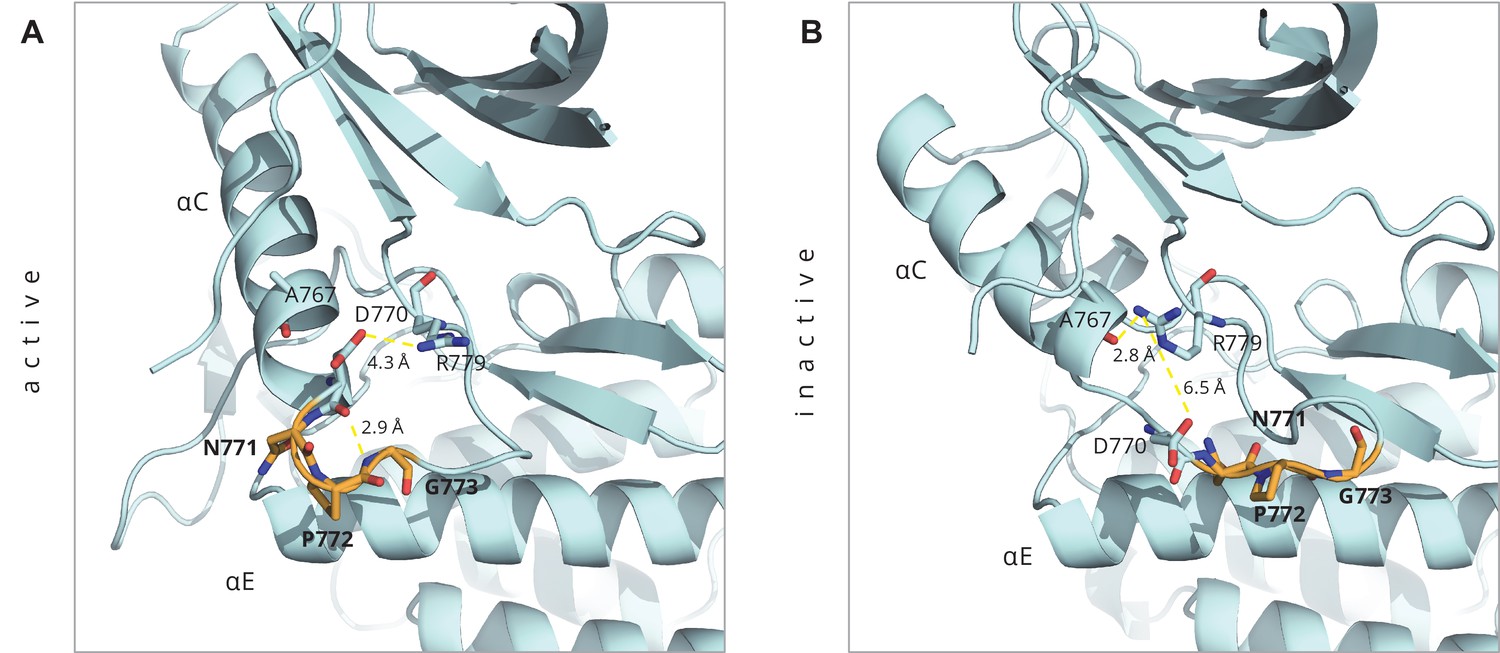
Key interactions around the inserted residues in the D770-N771insNPG mutant as seen in the ligand-bound active conformation of the mutant (PDB ID: 4LRM), and in the homology model of the Src-like inactive conformation that we built.
Key interactions around the inserted residues in the D770-N771insNPG mutant as seen in (A) the ligand-bound active conformation of the mutant (PDB ID: 4LRM), and in (B) the homology model of the Src-like inactive conformation that we built. The inserted residues are depicted in orange.
Figure 4—figure supplement 2
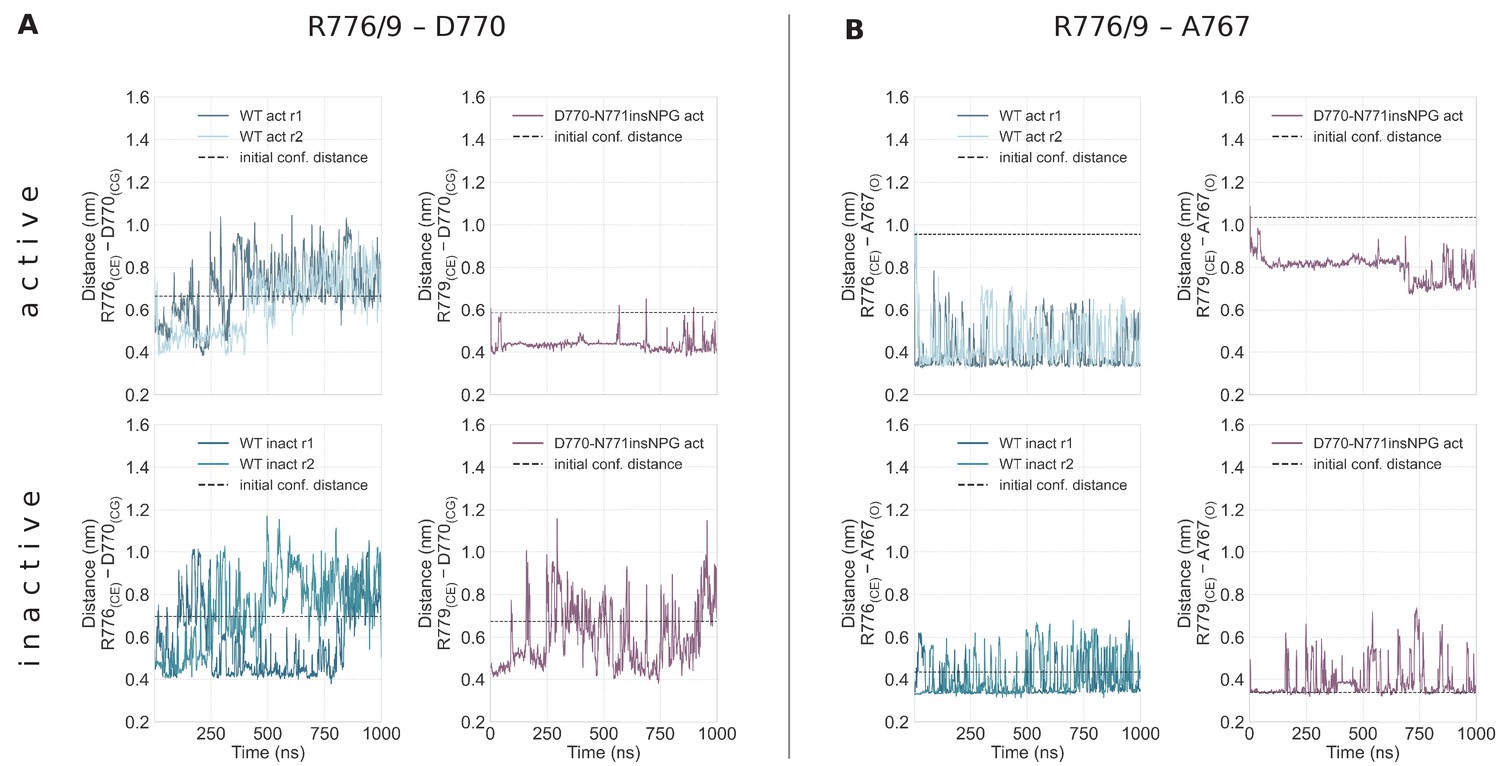
Simple moving averaged time series of the interactions of R776/9 with D770 and A767 over the course of the unbiased simulations starting from the monomeric active (top row) and Src-like inactive (bottom row) conformations.
Simple moving averaged time series of the interactions of R776/9 with D770 (A) and A767 (B) over the course of the unbiased simulations starting from the monomeric active (top row) and Src-like inactive (bottom row) conformations. R776 corresponds to the WT numbering, while R779 corresponds to the D770-N771insNPG numbering. The atoms that we used to assess the distance between the residues are given in the parenthesis, while the distance of these atoms in the starting conformation is depicted with a dashed line. An averaging window of 200 was used to smooth the calculated distances.
Figure 4—figure supplement 3
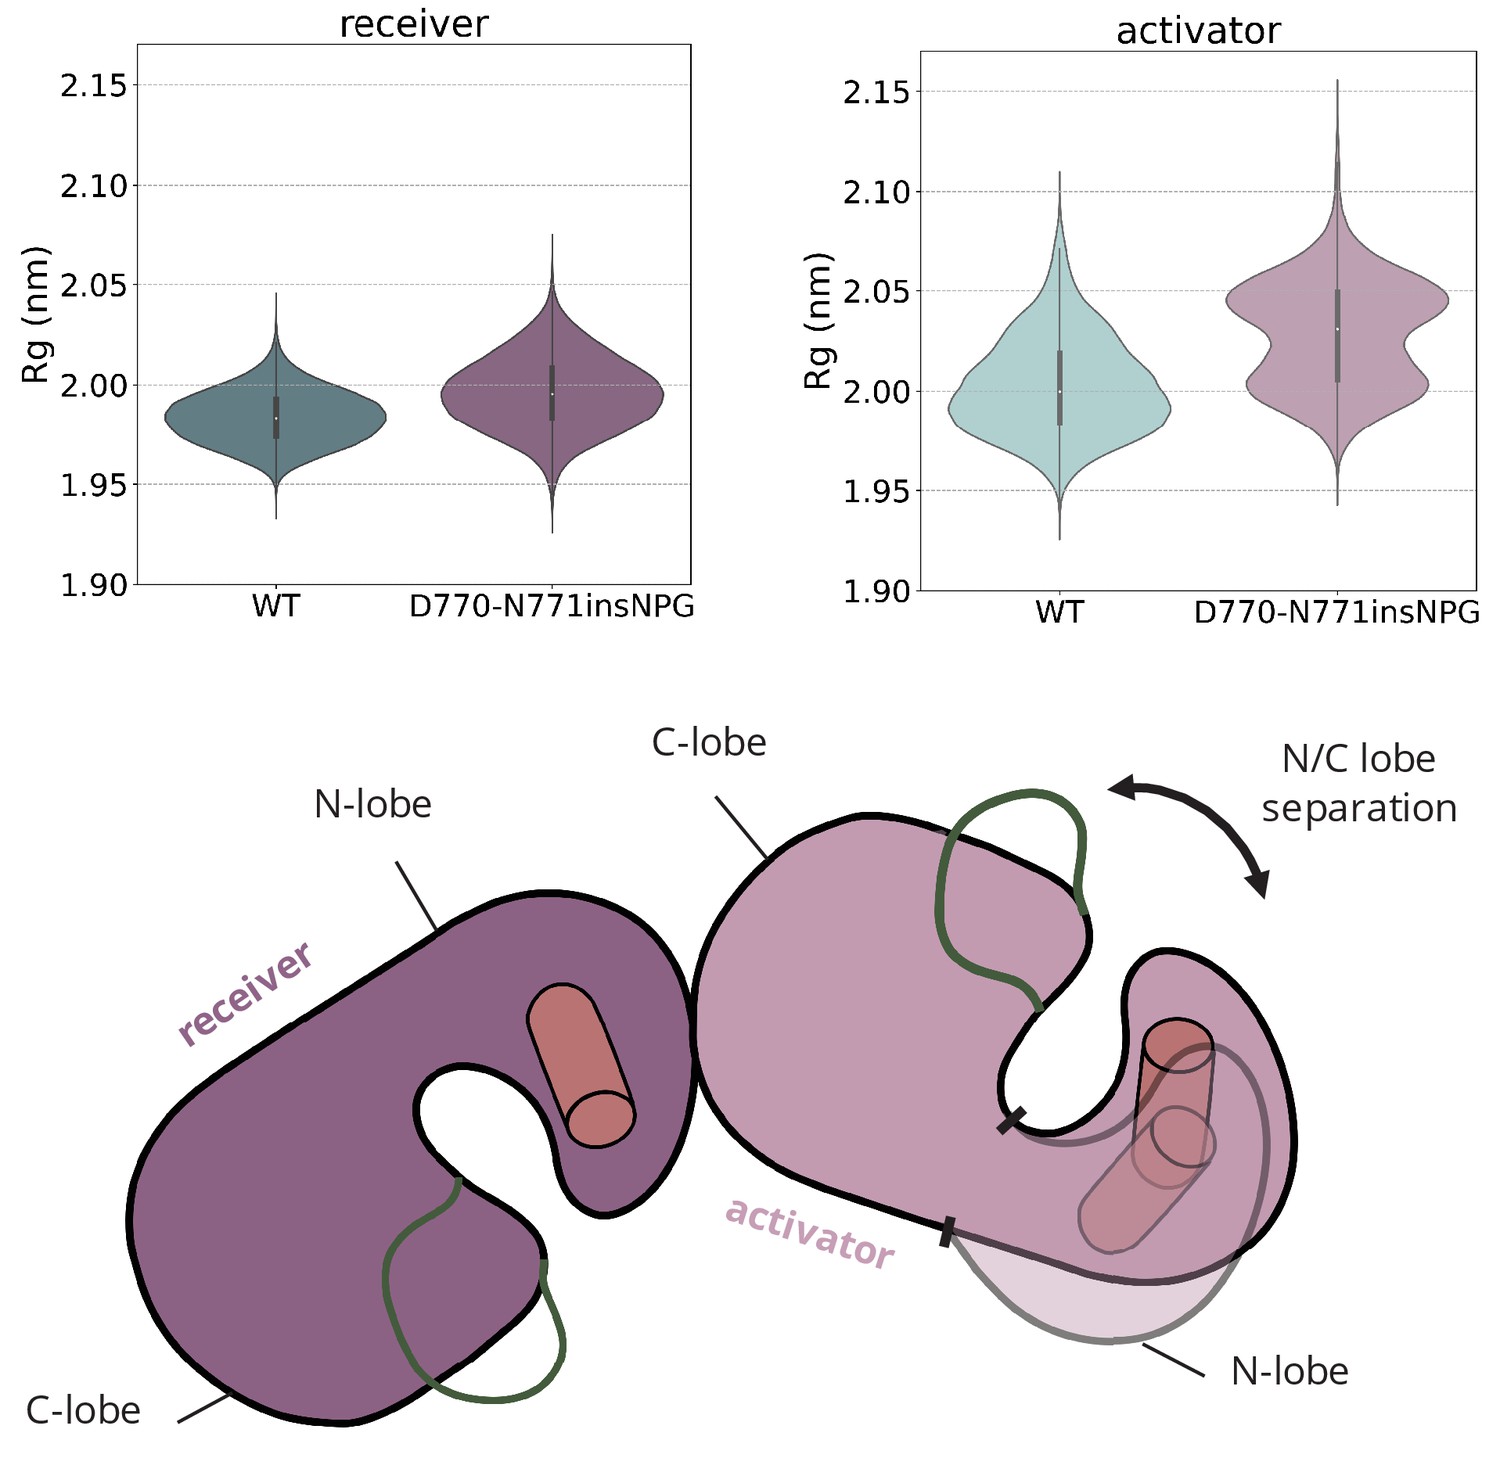
Amplification of the interlobal separation due to the D770-N771insNPG insertion.
Distribution of the radius of gyration (Rg) of the receiver and the activator kinases over the course of the unbiased simulations of the asymmetric dimer of D770-N771insNPG EGFR. The increased Rg of the activator kinase is attributed to amplification of the N/C lobe separation on the activator monomer due to the D770-N771insNPG insertion.
Figure 5 with 1 supplement
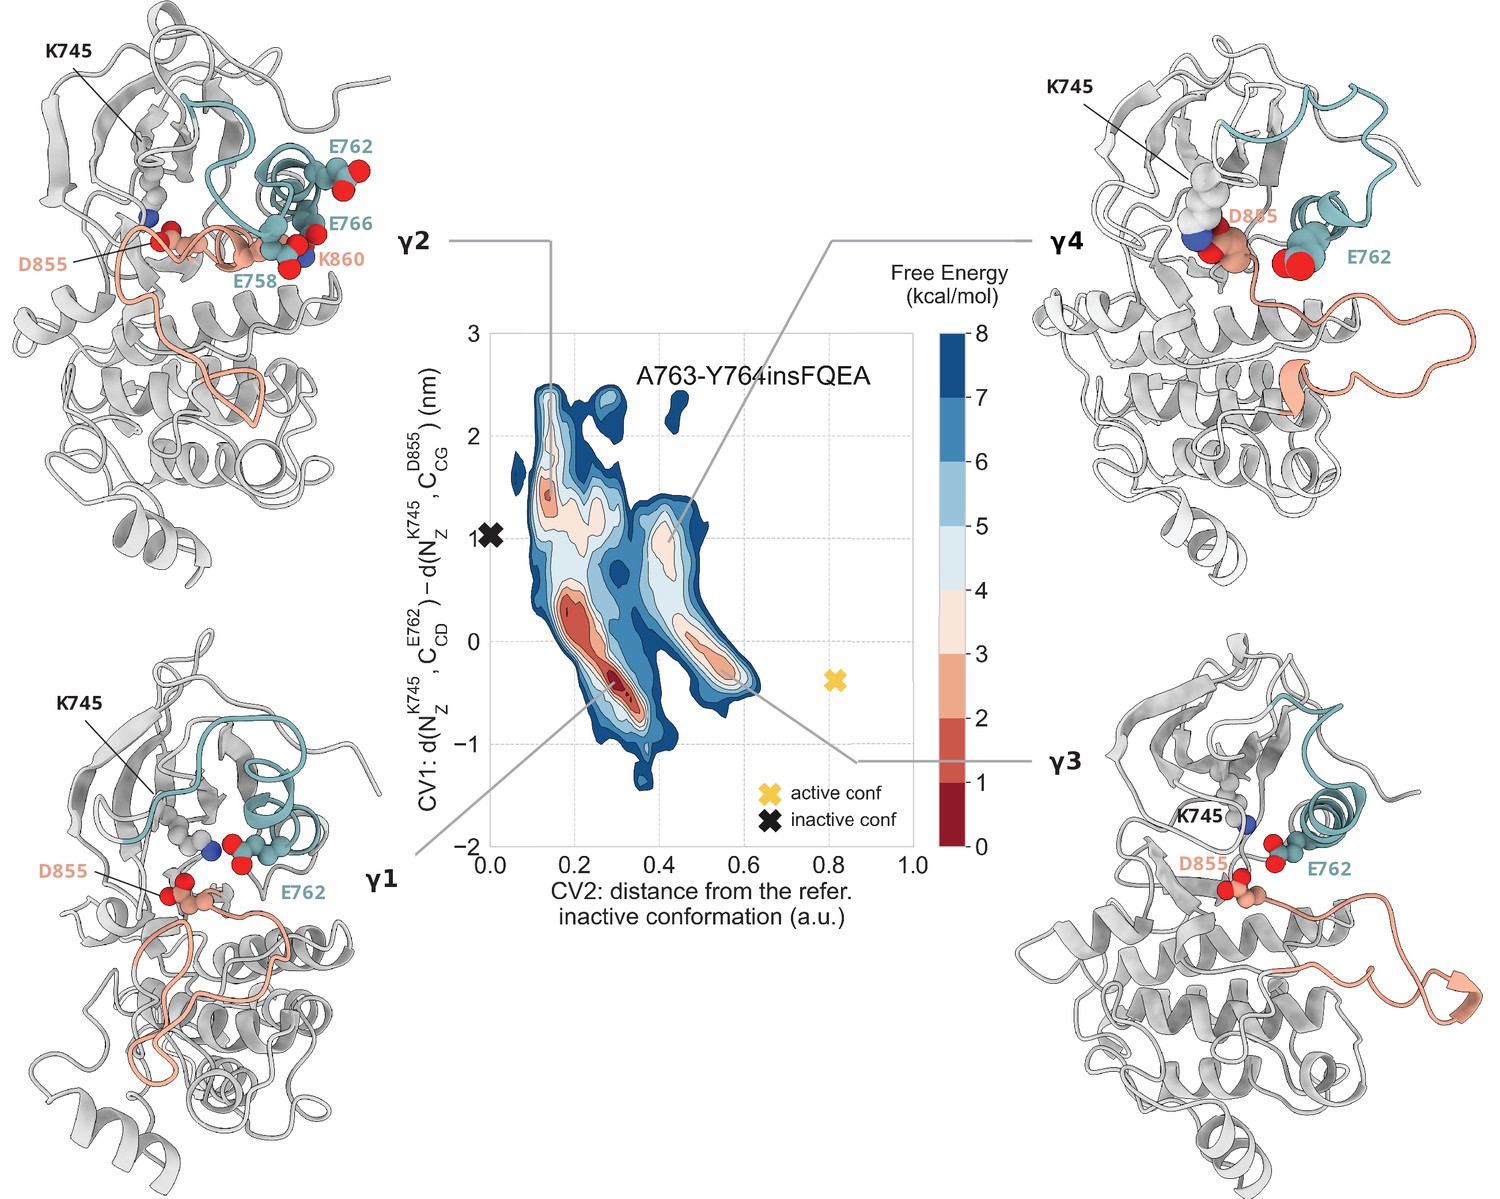
Free energy surface of the A763-Y764insFQEA mutant as a function of CV1 and CV2.
Representative structures of the main conformations found in the free energy minima are depicted in cartoon representation. A yellow cross indicates the position of the active conformation (homology model) in the explored CV space, while a black cross indicates the position of the Src-like inactive conformation (homology model) as reference.
Figure 5—figure supplement 1
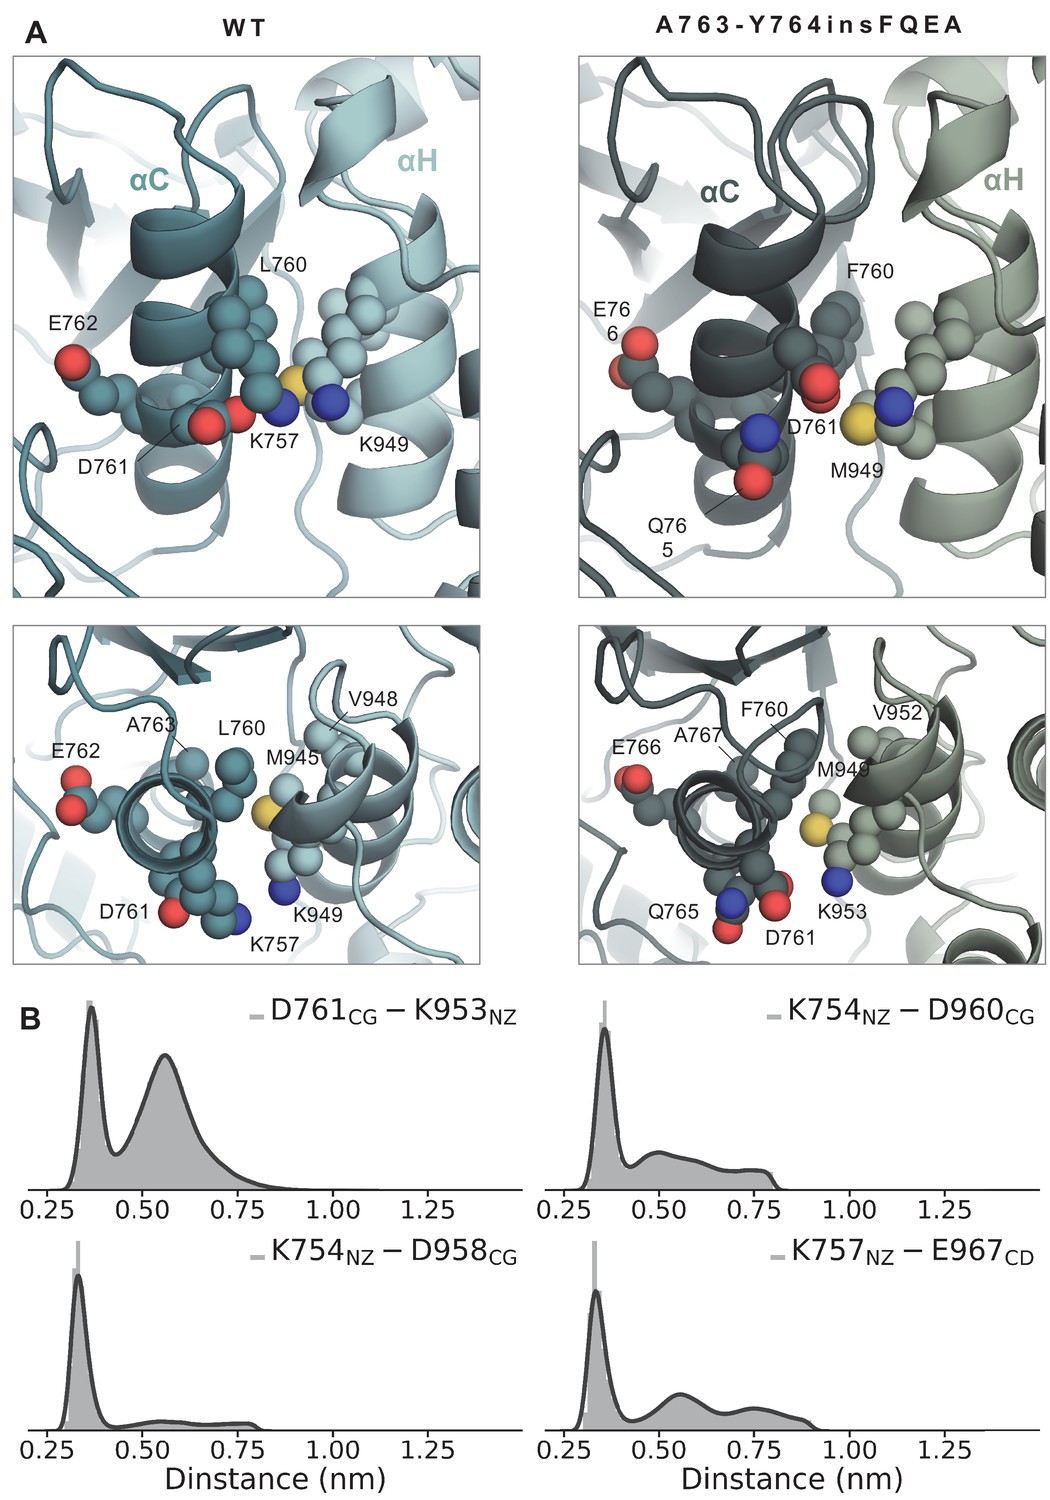
Side and top view of the WT and A763-Y764insFQEA asymmetric dimer interface around the αC-helix (receiver monomer) and αH-helix (activator monomer).
(A) Side and top view of the WT and A763-Y764insFQEA asymmetric dimer interface around the αC-helix (receiver monomer) and H-helix (activator monomer). F760 of A763-Y764insFQEA is accommodated in the hydrophobic cleft formed by V952, M949, and K953, while K757 of the WT has been replaced by D761 in the A763-Y764insFQEA, which can interact with K953. (B) Distribution of the distance between residues of the αC-helix of the receiver kinase and αI-helix of the activator kinase over the course of the unbiased simulations of the A763-Y764insFQEA asymmetric dimer.
Figure 6 with 2 supplements

Free energy surface of the ΔELREA mutant as a function of CV1 and CV2.
Representative structures of the main conformations found in the free energy minima are depicted in cartoon representation. A yellow cross indicates the position of the active conformation (homology model) in the explored CV space, while a black cross indicates the position of the Src-like inactive conformation (homology model) as reference.
Figure 6—figure supplement 1
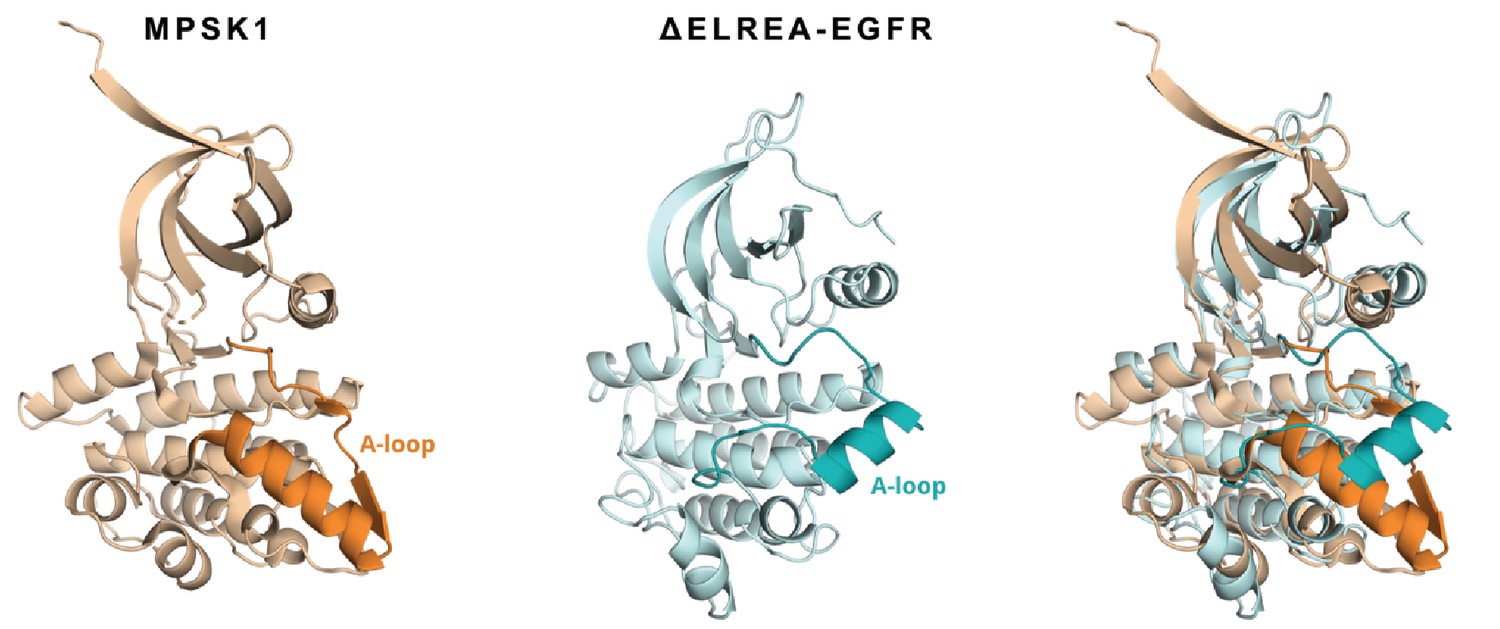
Superposition of a representative structure from an ensemble of conformations explored by the ΔELREA mutant (cyan) with MPSK1 kinase (beige, PDB ID 2BUJ).
The activation loop of each structure has been highlighted to show the similarity in the adopted conformation.
Figure 6—figure supplement 2
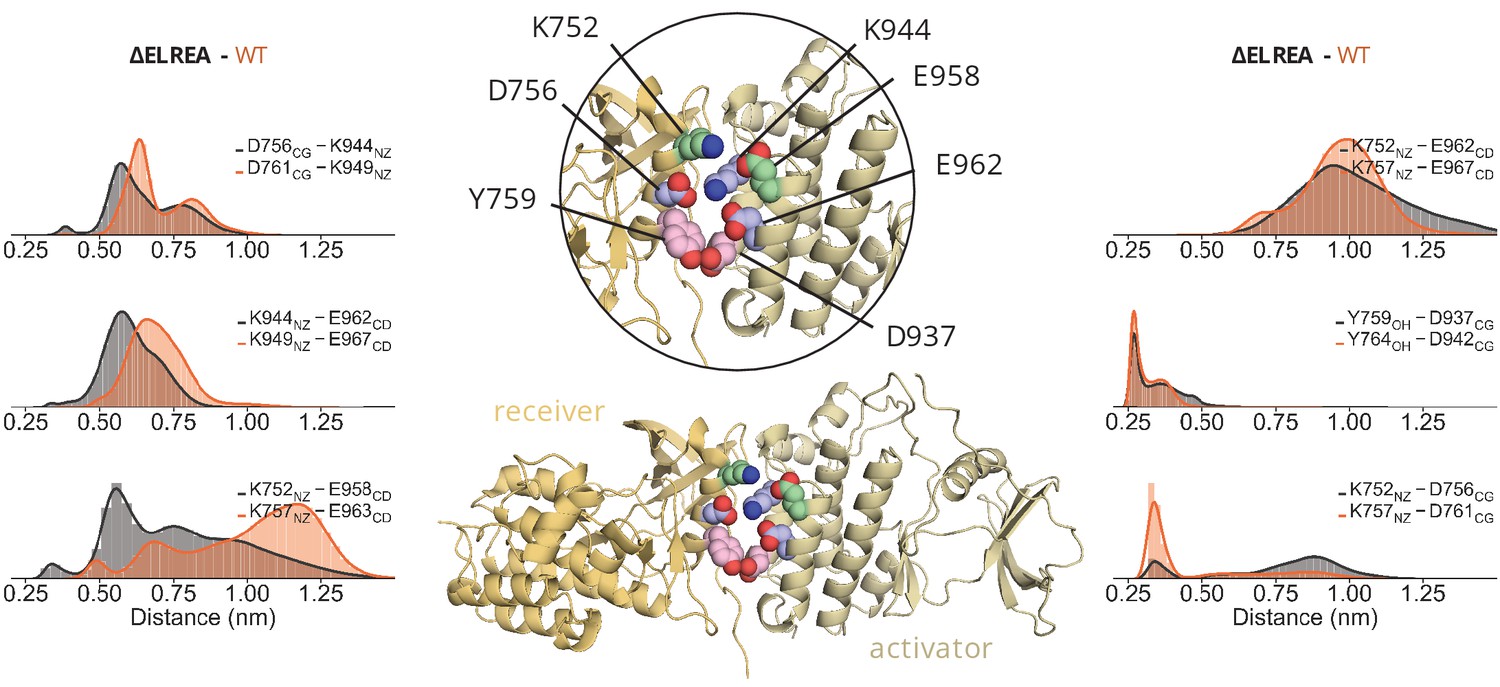
ΔELREA interface interactions ΔELREA interface interactions.
Distribution of the distance between residues of the αC-helix of the receiver kinase and I-helix of the activator kinase over the course of the unbiased simulations of the ΔELREA asymmetric dimer. The residue numbering corresponds to the numbering of each system; ΔELREA numbering (black), WT numbering (orange).
Figure 7 with 5 supplements
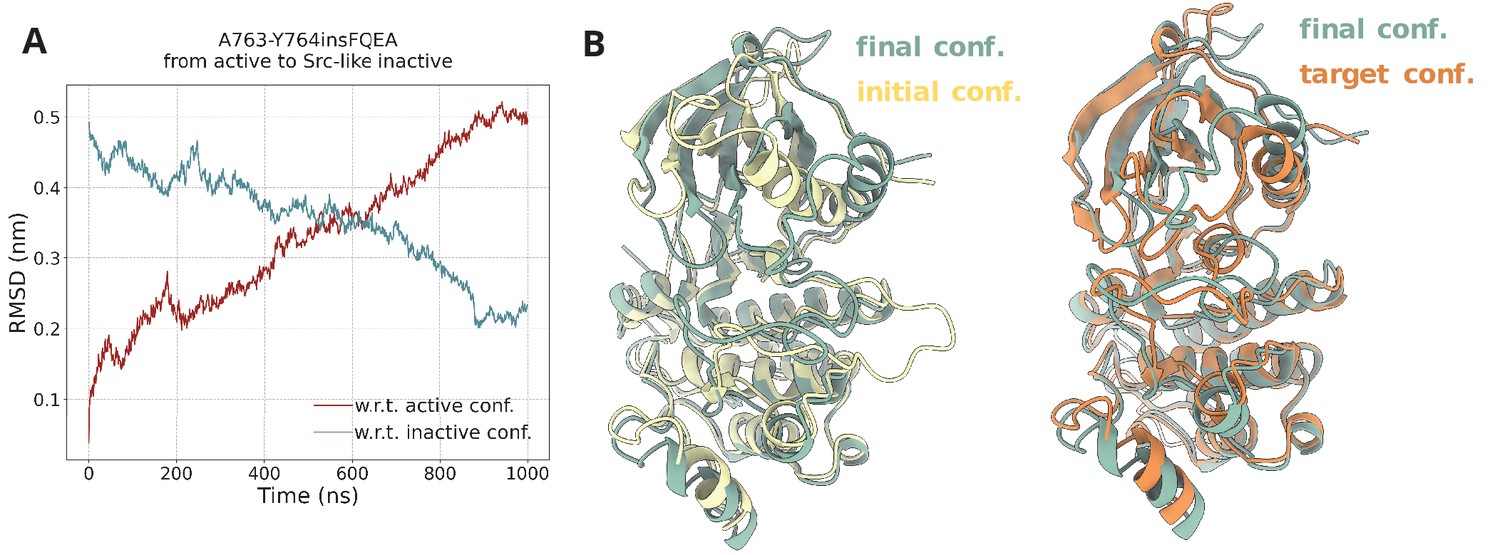
Steered MD simulations.
(A) RMSD change with respect to the active and Src-like inactive conformation during the SMD simulation of the A763-Y764insFQEA EGFR. The SMD simulation was initiated from the active conformation (yellow) and streered toward the Src-like inactive conformation (orange). (B) Superposition of the final frame of the SMD simulation with the initial and target conformation. Same SMD simulations were run for each system prior to the PTmetaD to confirm that the designed contact maps can drive the active to Src-like inactive transition and vice-versa with similar results (data not shown).
Figure 7—figure supplement 1
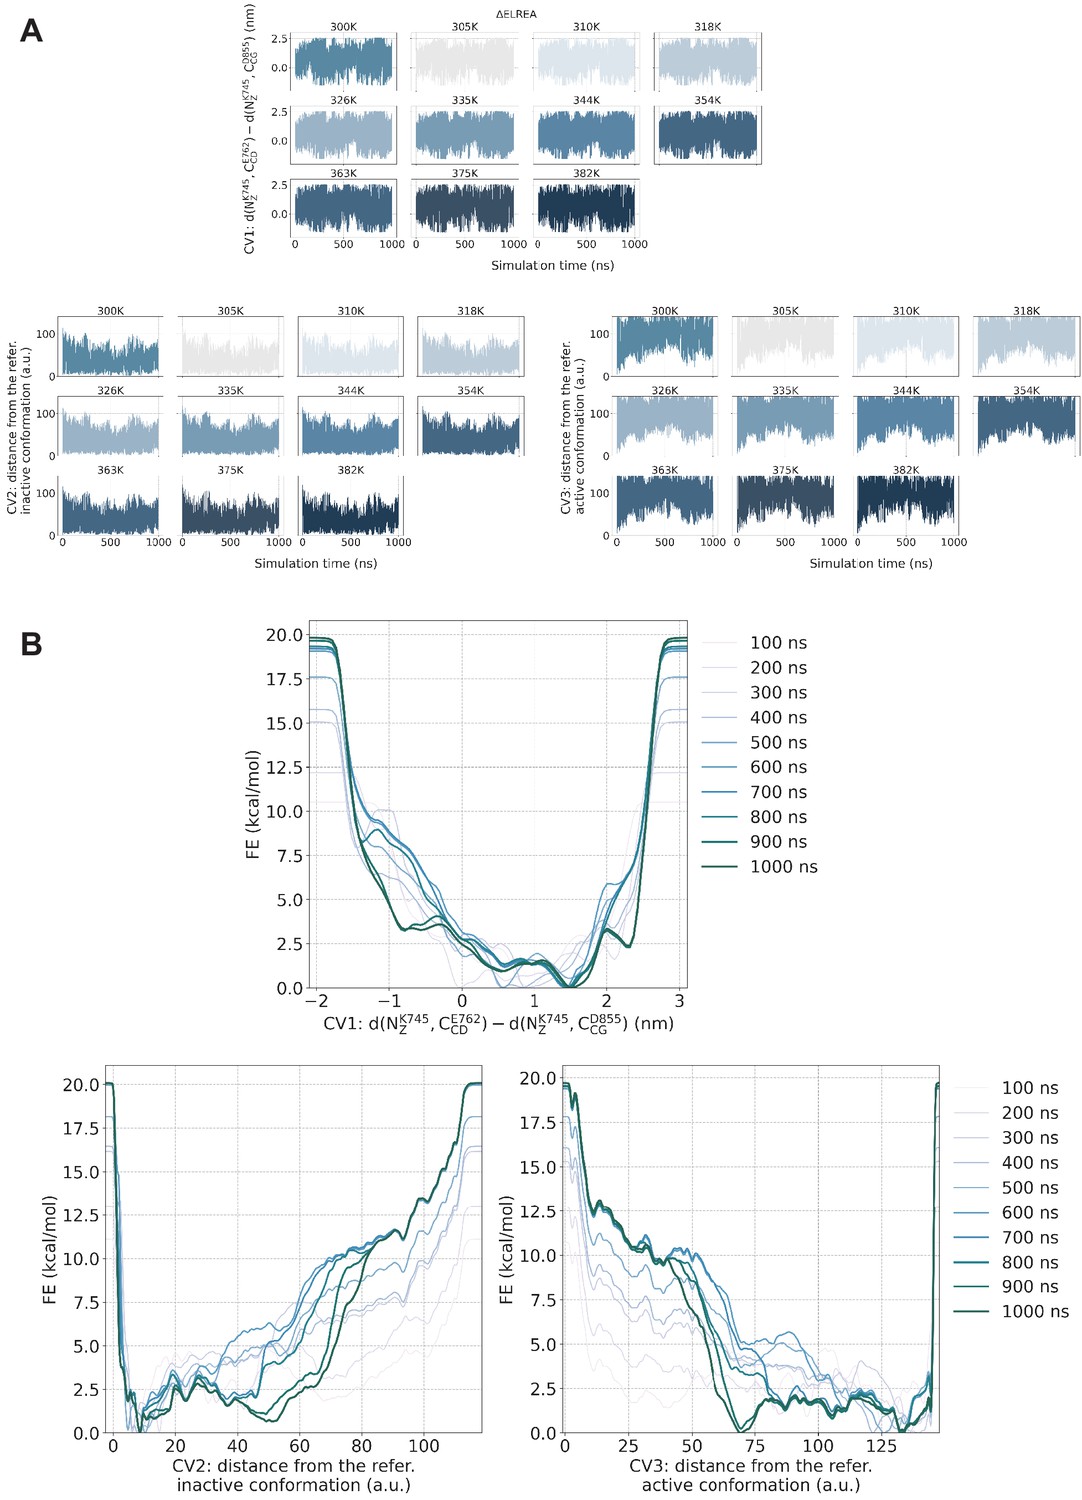
PTmetaD simulations convergence check.
PTmetaD simulations convergence check for the ΔELREA-EGFR. (A) Time series per replica of the three CVs that were biased during the PTmetaD simulation. Following the progression of the predefined CVs over time, one can assess whether the system gets stuck to any specific region of the CV phase space. (B) Estimate of the free energy as a function of the simulation time. At convergence, the reconstructed profiles should be similar. Similar behavior was observed for the rest of the examined mutants.
Figure 7—figure supplement 2
Mapping of the CV spaced sampled during the unbiased simulations to the PTmetaD simulations.
Mapping of the conformational space sampled during the unbiased simulations of the monomeric EGFR to the space sampled during the PTmetaD simulations as projected to two out of the three CVs that were biased during the PTmetaD. The portion of the space that was sampled by unbiased simulations starting from the active conformation are shown in magenta, while the space sampled during simulations starting from the Src-like inactive conformation are shown in green.
Figure 7—figure supplement 3
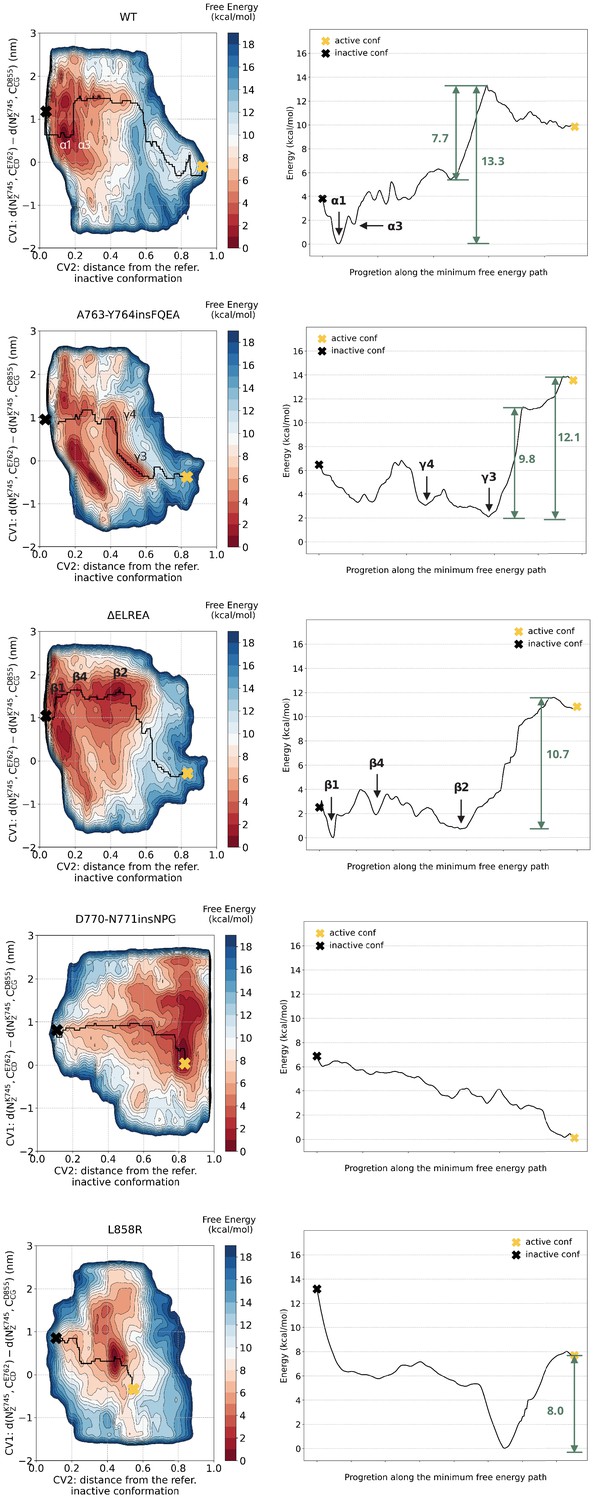
Minimum energy path.
Minimum energy path connecting the active to Src-like inactive conformation.
Figure 7—figure supplement 4
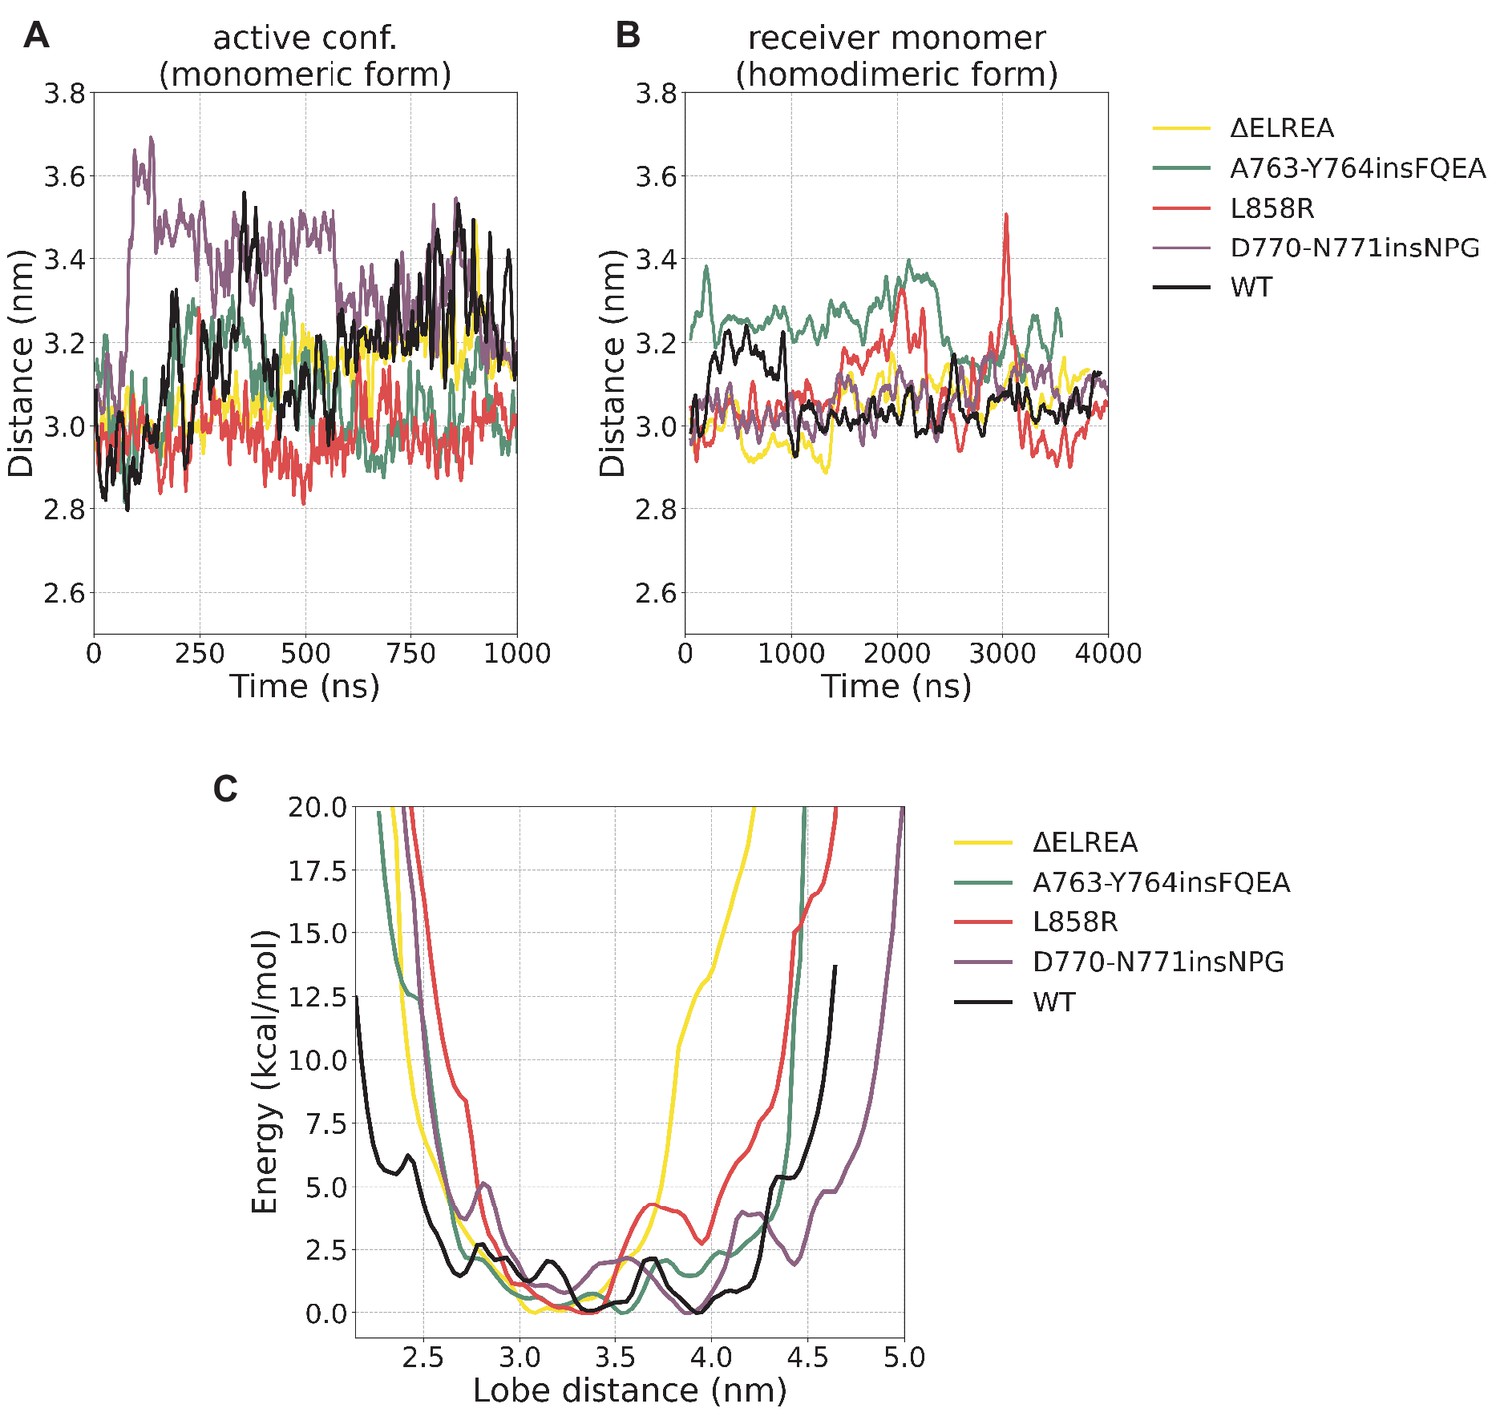
N/C-lobe separation.
N/C-lobe separation (A) during the unbiased simulations of the monomeric form starting from the active conformation, (B) the receiver monomer during the unbiased simulations of the homodimeric form, and (C) the reprojection of the free energy from the PTmetaD on this distance. The calculated lobe distance corresponds to the distance between V786 (N-lobe, WT residue numbering) and T903 (C-lobe, WT residue numbering).
Figure 7—figure supplement 5
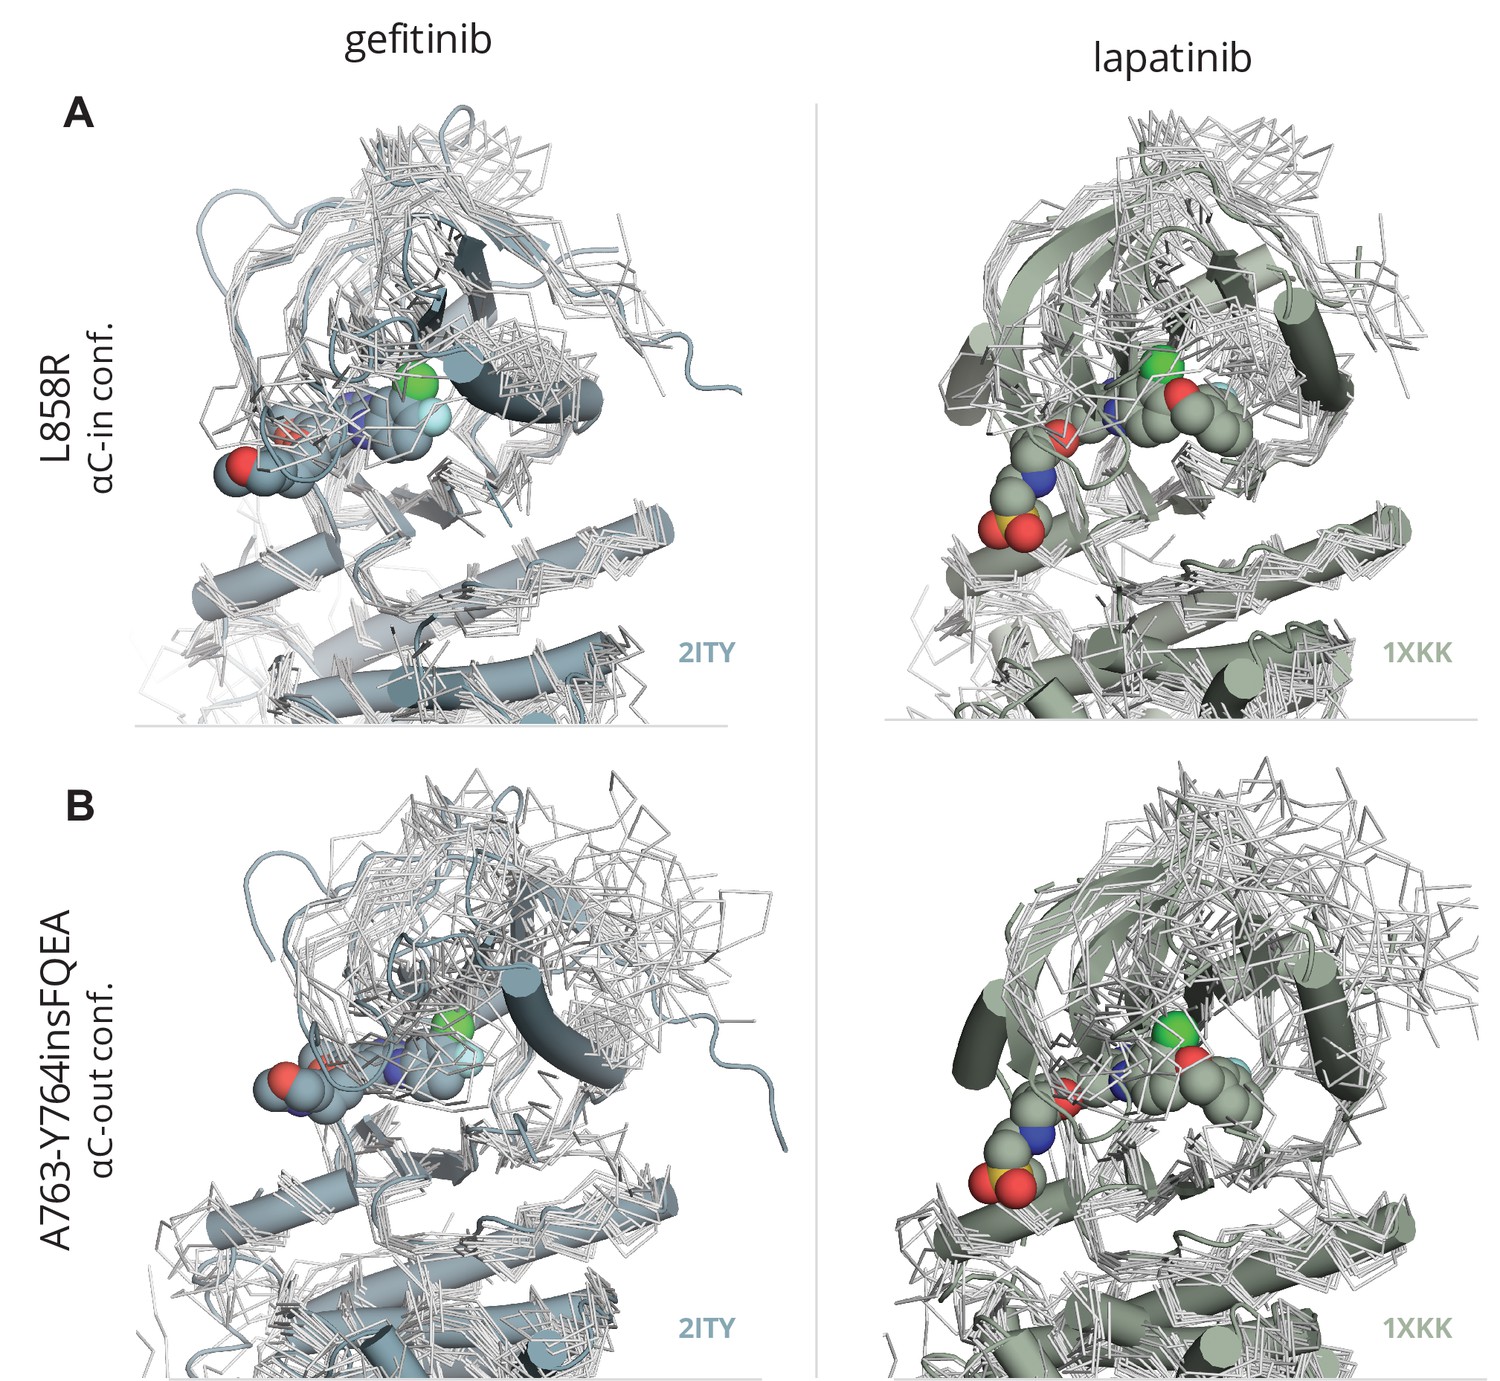
Fitting of gefitinib and lapatinib to L858R and A763-Y764insFQEA.
Ensemble of conformations from the PTmetaD simulations of the activating mutant (A) L858R and (B) A763-Y764insFQEA in the αC-in and αC-out conformations depicted in gray tubes and superimposed with the crystal structures of the WT-EGFR (PDB ID: 2ITY) bound with gefitinib and lapatinib (PDB ID: 1XKK).
Author response image 1
Tables
Table 1
Summary of the unbiased simulations of the monomeric EGFR.
The reported times correspond to the simulation time of each independent unbiased simulation.
| System | Starting conformation | Total simulation time (ns) |
|---|---|---|
| WT | active | 1000 |
| active | 1000 | |
| Src-like inactive | 1000 | |
| Src-like inactive | 1000 | |
| L858R | active | 1000 |
| Src-like inactive | 1000 | |
| A763-Y764insFQEA | active | 1000 |
| Src-like inactive | 1000 | |
| D770-N771insNPG | active | 1000 |
| Src-like inactive | 1000 | |
| ΔELREA | active | 1000 |
| Src-like inactive | 1000 | |
| [1ex] |
Table 2
Summary of the unbiased simulations of the homodimeric EGFR.
The reported times correspond to the simulation time of each independent unbiased simulation.
| System | Starting conformation | Total simulation time (ns) |
|---|---|---|
| WT | asymmetric dimer | 4000 |
| symmetric dimer | 4000 | |
| L858R | asymmetric dimer | 4000 |
| A763-Y764insFQEA | asymmetric dimer | 4000 |
| D770-N771insNPG | asymmetric dimer | 4000 |
| ΔELREA | asymmetric dimer | 4000 |
Additional files
Download links
A two-part list of links to download the article, or parts of the article, in various formats.
Downloads (link to download the article as PDF)
Open citations (links to open the citations from this article in various online reference manager services)
Cite this article (links to download the citations from this article in formats compatible with various reference manager tools)
Structural basis of the effect of activating mutations on the EGF receptor
eLife 10:e65824.
https://doi.org/10.7554/eLife.65824


