Colistin kills bacteria by targeting lipopolysaccharide in the cytoplasmic membrane
- MRC Centre for Molecular Bacteriology and Infection, Imperial College London, United Kingdom
- Department of Bioengineering, Imperial College London, United Kingdom
- Department of Materials, Imperial College London, United Kingdom
- Institute of Biomedical Engineering, Imperial College London, United Kingdom
- Department of Chemistry, Imperial College London, Molecular Sciences Research Hub, United Kingdom
- Department of Molecular Biosciences, University of Texas at Austin, United States
- National Heart and Lung Institute, Imperial College London, United Kingdom
- Department of Paediatric Respiratory Medicine, Royal Brompton Hospital, United Kingdom
Figures
Figure 1 with 6 supplements
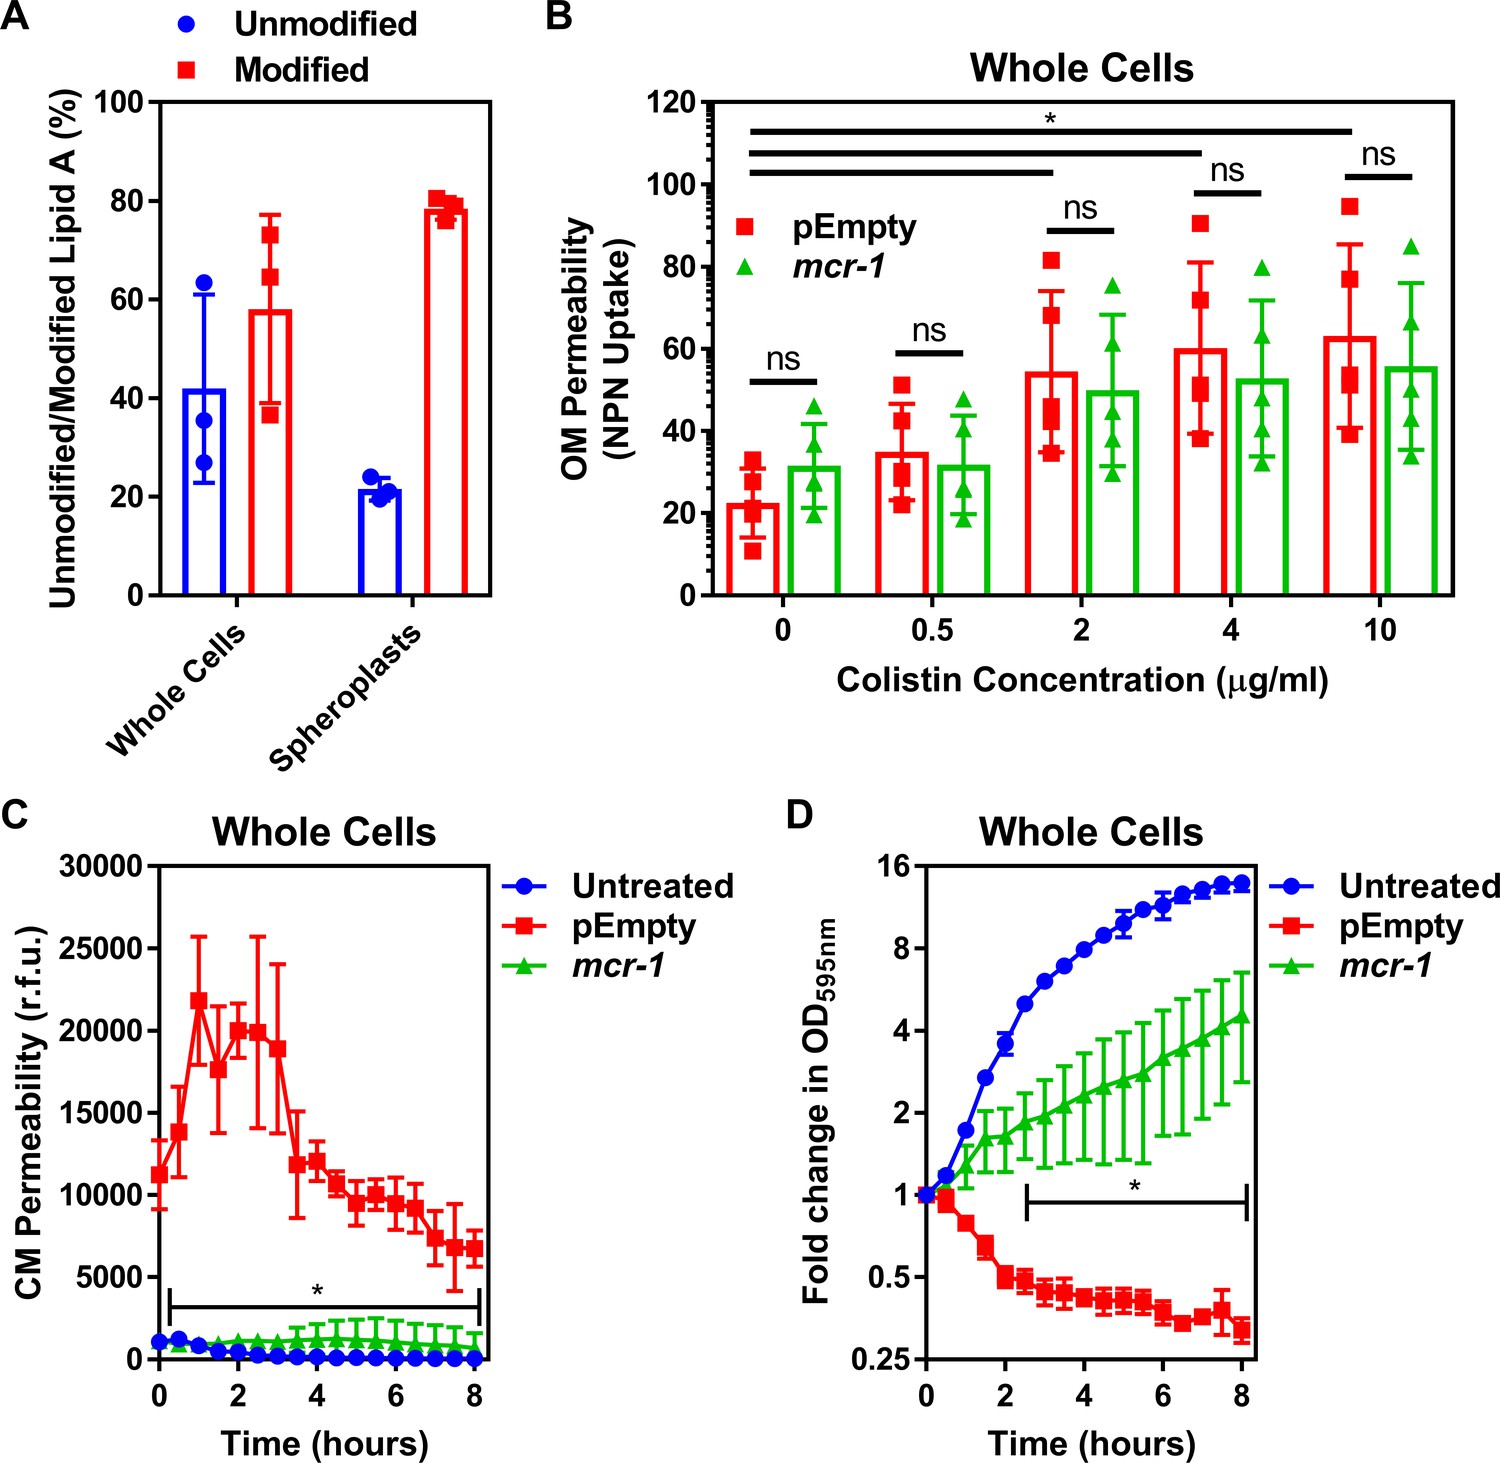
Colistin disrupts the outer membrane but not the cytoplasmic membrane of E. coli expressing mcr-1.
(A) Quantification of LPS modified with phosphoethanolamine, expressed as the percentage of unmodified lipid A and unmodified lipid A, in whole cells and spheroplasts of E. coli MC1000 expressing mcr-1, as determined by MALDI-TOF-based lipidomics (n = 3 in duplicate, *p<0.05 between Whole Cells and Spheroplasts). (B) OM disruption of E. coli MC1000 cells expressing mcr-1 or an empty plasmid control strain (pEmpty) during 10 min of exposure to colistin at the indicated antibiotic concentrations, as determined by uptake of the fluorescent dye NPN (10 µM) (n = 5, each data point represents the arithmetic mean of 20 replicate measurements; ns: p>0.05 between pEmpty and mcr-1 strains, *p<0.05 between the indicated concentrations of colistin). (C) Permeabilisation of the CM of E. coli MC1000 cells expressing mcr-1 or empty plasmid-containing cells during incubation with colistin (4 µg ml−1), as determined using 2.5 µM propidium iodide (PI) (n = 4; *p<0.0001 between pEmpty and mcr-1 strains). (D) Growth or lysis of E. coli MC1000 cells expressing mcr-1 or empty plasmid control cells during exposure to colistin (4 µg ml−1), as measured using OD595nm readings (n = 4; *p<0.05 between pEmpty and mcr-1 strains). Data in (A) were analysed by a two-tailed paired Student’s t-test. Data in (B–D) were analysed by a two-way ANOVA with Sidak’s (B) or Dunnett’s (C, D) post hoc tests. Data are presented as the arithmetic mean, and error bars represent the standard deviation of the mean. OM: outer membrane; NPN: N-phenyl-1-naphthylamine; CM: cytoplasmic membrane; r.f.u.: relative fluorescence units; OD: optical density.
Figure 1—figure supplement 1
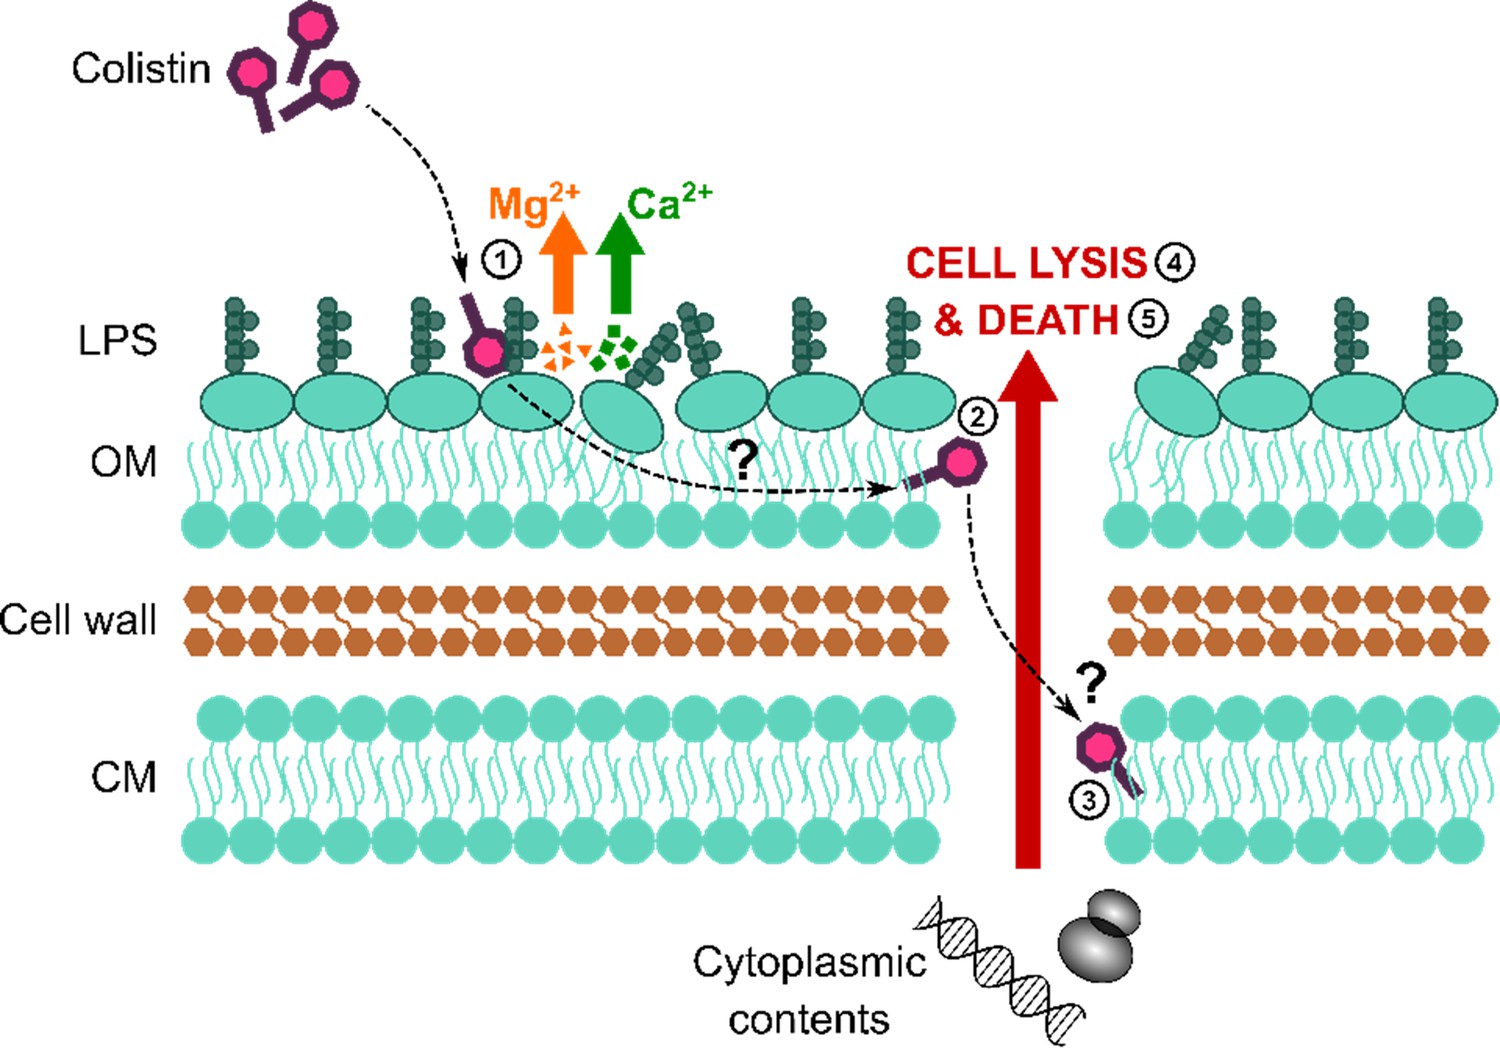
Colistin causes outer membrane (OM) disruption, but the process by which this leads to cytoplasmic membrane (CM) damage and bacterial lysis is not known.
Diagrammatic representation of the current hypothesised mechanism of action of colistin: (1) Colistin binds to LPS in the OM, causing displacement of cations that form bridges between LPS molecules and leading to membrane disruption. (2) The antibiotic then crosses the OM via a process termed ‘self-directed uptake’. (3) Colistin subsequently disrupts the CM through a mechanism that remains unclear. (4, 5) Once the cell envelope is permeabilised, the bacteria lyse and are killed.
Figure 1—figure supplement 2

Characterisation of the E. coli MC1000 strain harbouring a plasmid encoding the colistin resistance gene mcr-1, and an MC1000 strain containing the pDM1 plasmid only (pEmpty) as a control strain.
(A) Growth of E. coli MC1000 cells containing an empty pDM1 plasmid (pEmpty) or MC1000 cells containing the pDM1 plasmid expressing the mcr-1 gene, as determined by measuring OD600nm over 16 hr incubation at 37°C (n = 3 in triplicate). (B) Final growth densities of E. coli MC1000 cells with an empty pDM1 plasmid and MC1000 cells harbouring the pDM1 plasmid encoding the mcr-1 gene in MHB media containing the indicated concentrations of colistin, as determined by measuring OD595nm after 18 hr incubation (n = 3 in triplicate; *p<0.0001 compared to pEmpty strain). Expression of the mobilised colistin resistance determinant mcr-1 by E. coli MC1000 bacteria resulted in only a minor growth defect relative to empty plasmid-containing control cells (A). As expected, E. coli MC1000 cells producing MCR-1 had an eightfold increase in the MIC of colistin in comparison to the isogenic empty plasmid strain (2 μg ml−1 versus 0.25 μg ml−1) (B). This confirmed that the bacteria harbouring a plasmid with the mcr-1 gene were resistant to colistin. Data in B were analysed by a two-way ANOVA with Sidak’s post hoc test. Data are presented as the arithmetic mean, and error bars represent the standard deviation of the mean.
Figure 1—figure supplement 3
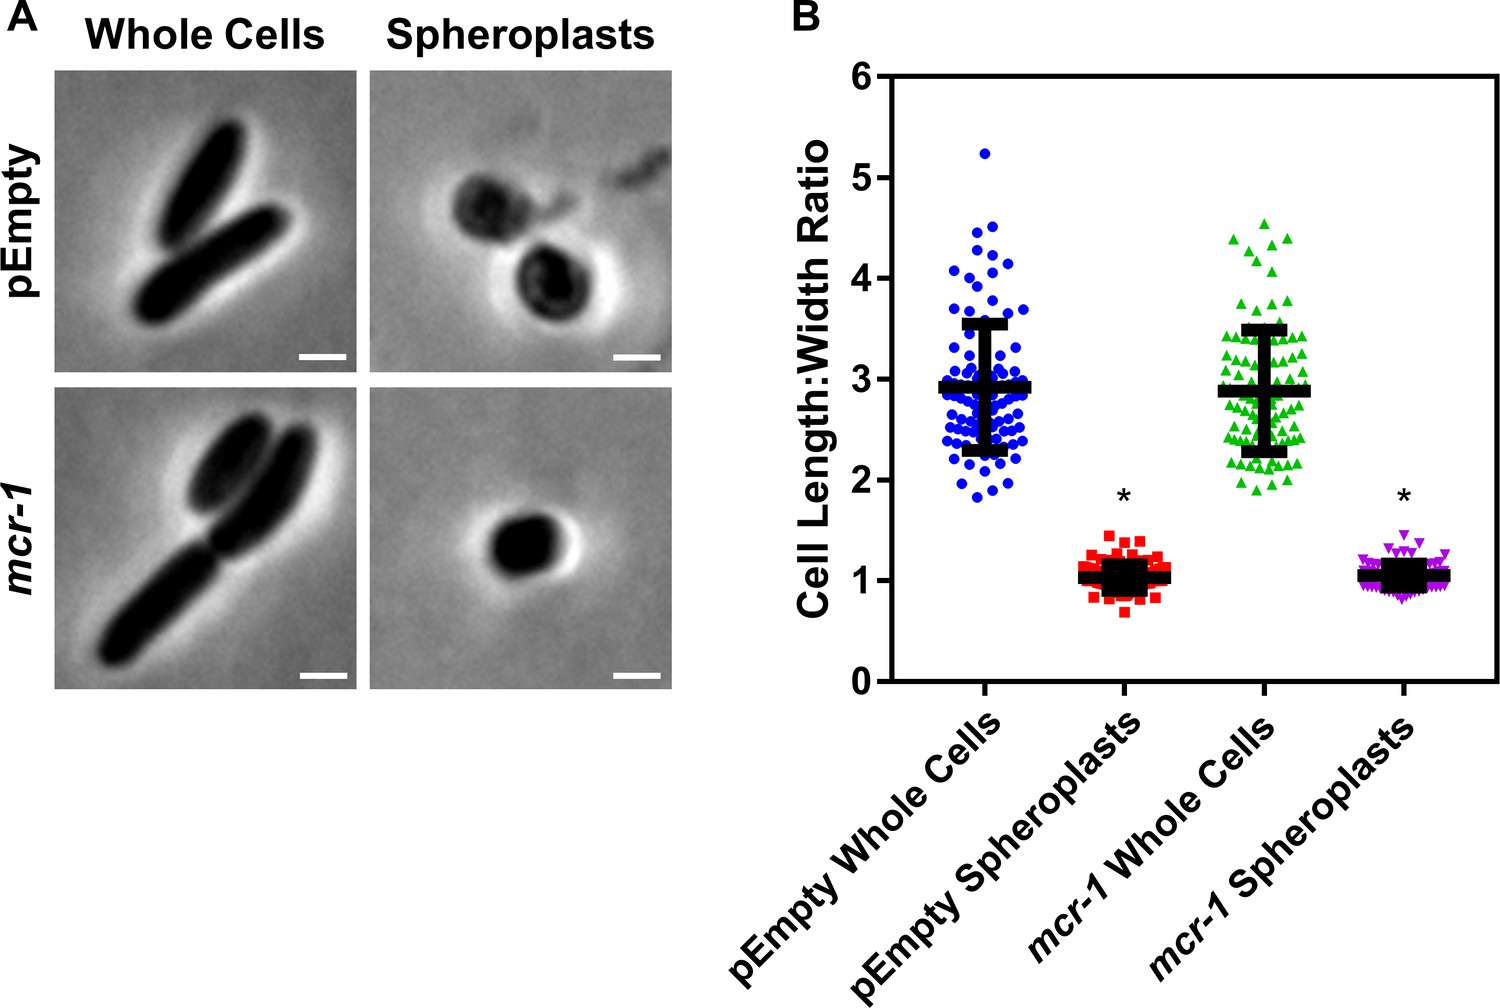
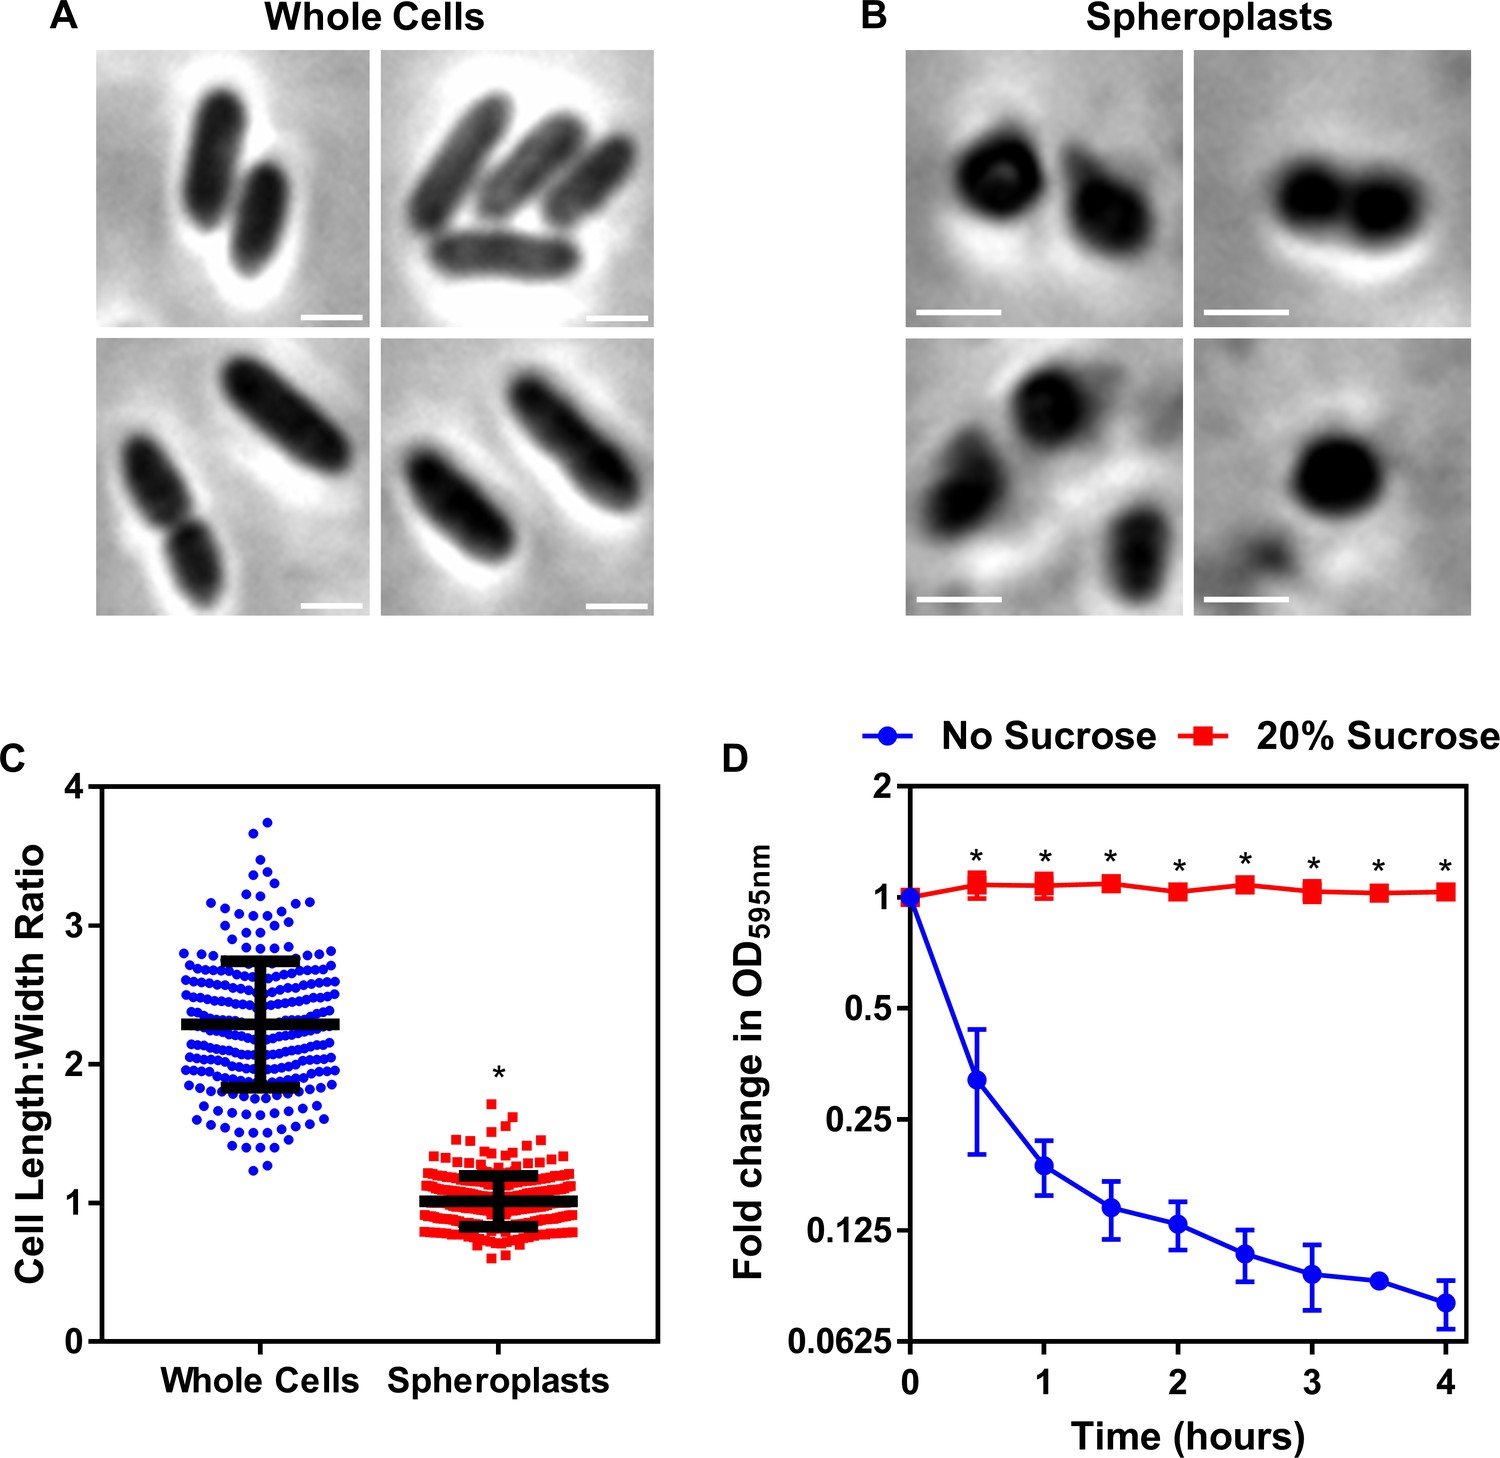
Formation of E. coli pEmpty and mcr-1 spheroplasts.
(A) Representative phase contrast micrographs of E. coli MC1000 cells harbouring an empty pDM1 plasmid (pEmpty) or a pDM1 plasmid expressing the colistin-resistance determinant mcr-1 before (Whole Cells) and after (Spheroplasts) treatment with 0.25 mg ml−1 EDTA (to remove the outer membrane [OM]) and 1 mg ml−1 lysozyme (to remove the cell wall) for 1 hr at 30°C, followed by the addition of trypsin (0.5 mg ml−1) for 15 min, with all incubations occurring in Tris buffer (0.03 M, pH 8.0) containing 20% sucrose (Scale bars: 5 μm). (B) Quantification of length:width ratio of E. coli MC1000 cells containing an empty plasmid, or E. coli cells with the same plasmid encoding the mcr-1 gene, before (Whole Cells) and after (Spheroplasts) exposure to EDTA, lysozyme and trypsin (A) (n = 100 cells per group; *p<0.0001 compared to the respective Whole Cells). Removal of the OM and cell wall from both E. coli MC1000 pEmpty and mcr-1-expressing bacteria results in the formation of round cells with a length:width ratio of ~1 (A, B), confirming the successful production of E. coli spheroplasts lacking the OM and cell wall. Data in B were analysed by a one-way ANOVA with Tukey’s post hoc test. Data are presented as the arithmetic mean, and error bars represent the standard deviation of the mean.
Figure 1—figure supplement 4
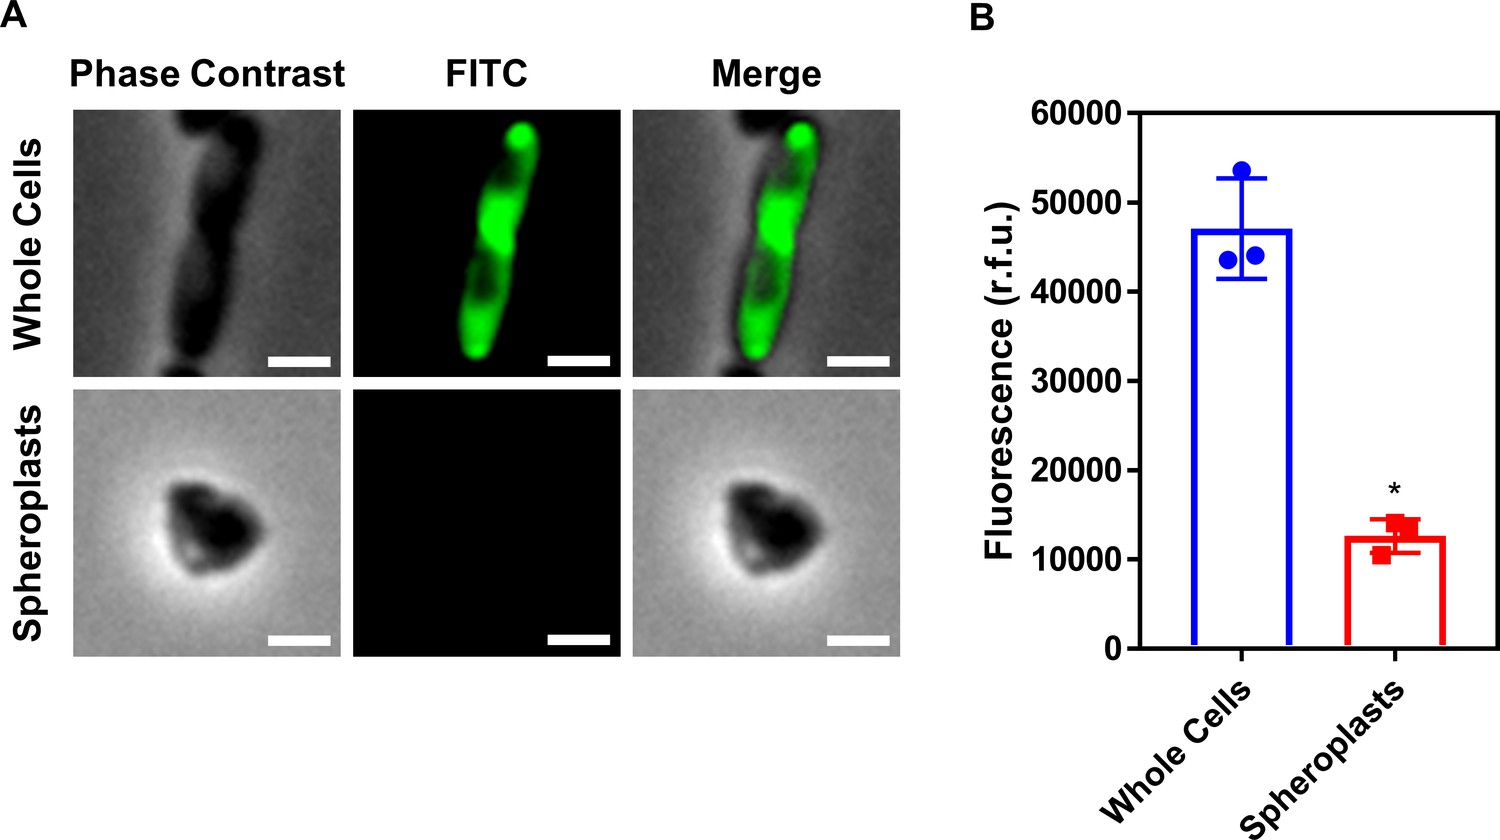
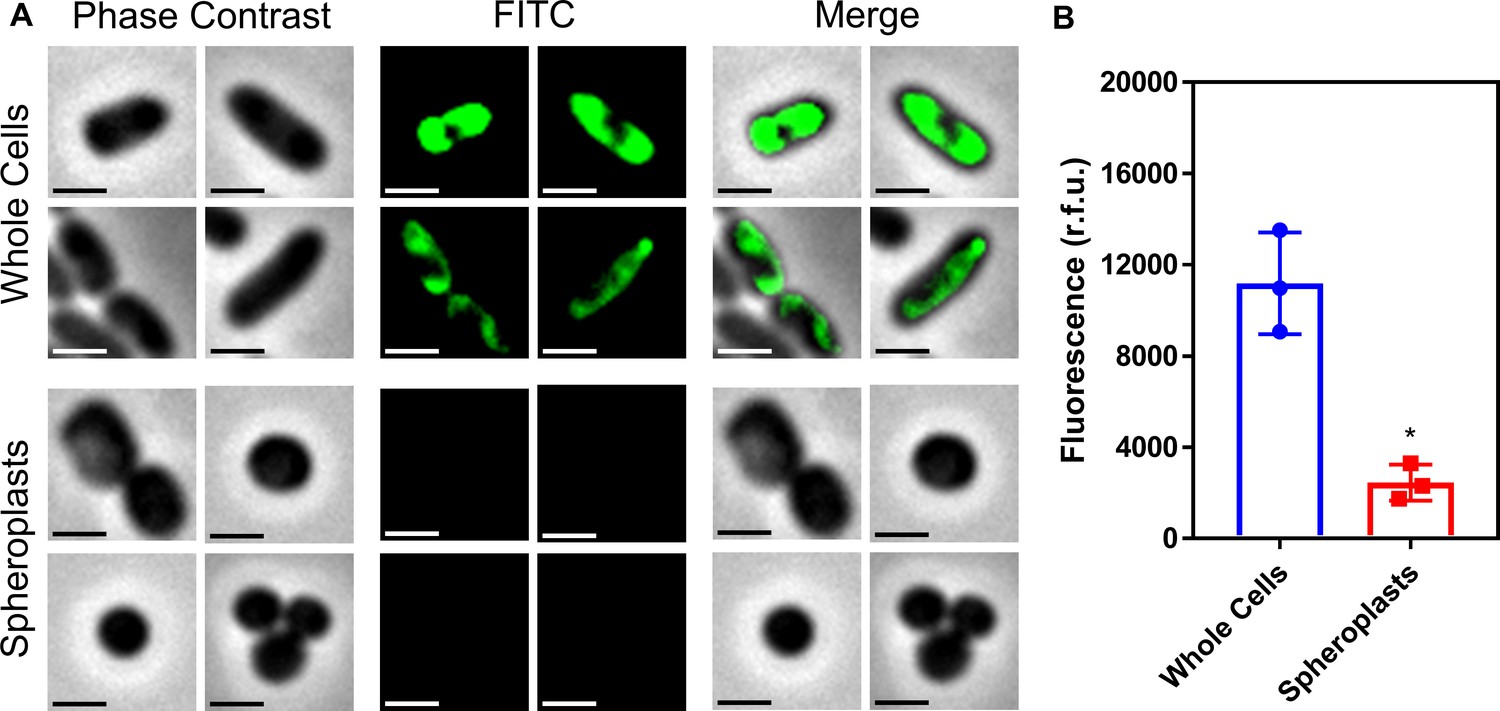
Conversion of E. coli whole cells to spheroplasts results in removal of the OM, and no OM contamination in the CM.
(A) Representative fluorescence microscopy images of E. coli MC1000 pEmpty cells labelled with fluorescein isothiocyanate (FITC, 0.5 mg ml−1) before (Whole Cells) and after (Spheroplasts) conversion to spheroplasts with EDTA (0.25 mg ml−1) and lysozyme (1 mg ml−1) in Tris buffer (0.03 M, pH 8.0) containing 20% sucrose, as described in Figure 1—figure supplement 6 (Scale bars: 5 μm). (B) Quantification of fluorescence from FITC-labelled E. coli MC1000 pEmpty cells before (Whole Cells) and after (Spheroplasts) conversion to spheroplasts (n = 3 in triplicate; *p<0.01 compared to Whole Cells). Proteins in the OM of whole E. coli MC1000 cells were tagged with a FITC fluorophore for 30 min, as previously described (Wiegand et al., 2008). Following conversion of these labelled bacterial cells to spheroplasts, there was virtually no fluorescence from FITC visible by microscopy (A), or when quantifying the entire cell population (B). This confirmed that the OM had been successfully removed during the formation of spheroplasts, and that there was no contamination of the CM with material from the OM. Data in B were analysed by a paired Student’s t-test. Data are presented as the arithmetic mean, and error bars represent the standard deviation of the mean.
Figure 1—figure supplement 5
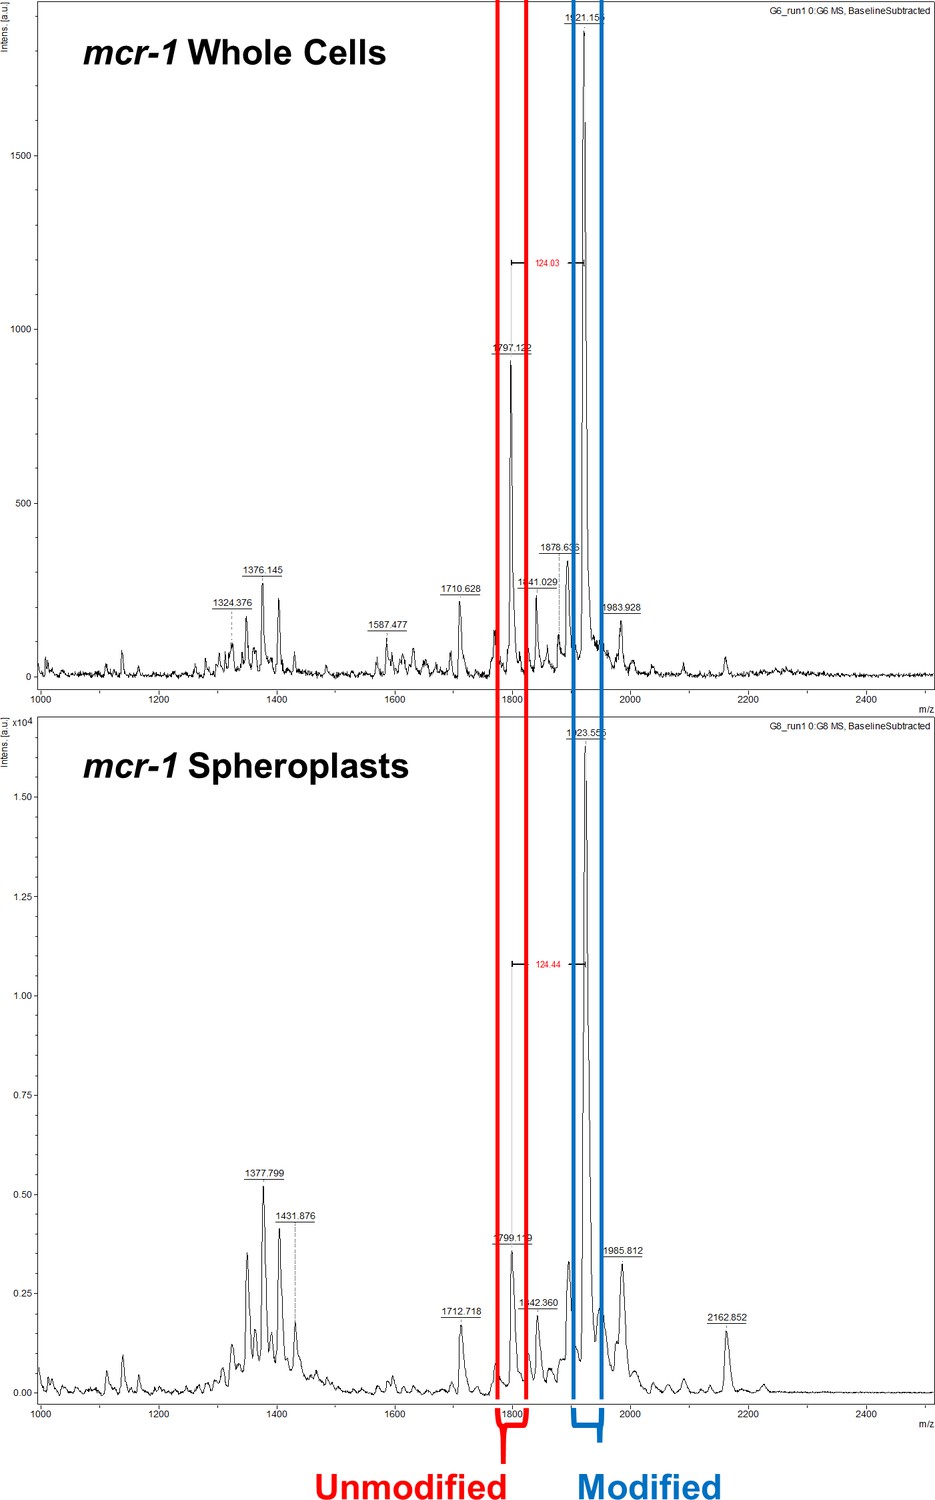
The ratio of modified lipid A to unmodified lipid A is significantly greater in the cytoplasmic membrane (CM) than in the outer membrane (OM) of E. coli expressing mcr-1.
Representative mass spectra showing the ratio of unmodified lipid A (red) to lipid A modified with phosphoethanolamine (blue) in whole cells and spheroplasts of E. coli MC1000 expressing mcr-1, as determined by MALDI-TOF-based lipidomics. There was a higher proportion of LPS modified with pETN in mcr-1-expressing E. coli MC1000 spheroplasts compared to whole E. coli MC1000 cells, demonstrating that there is an increased abundance of unmodified LPS in the OM compared to the CM.
Figure 1—figure supplement 6
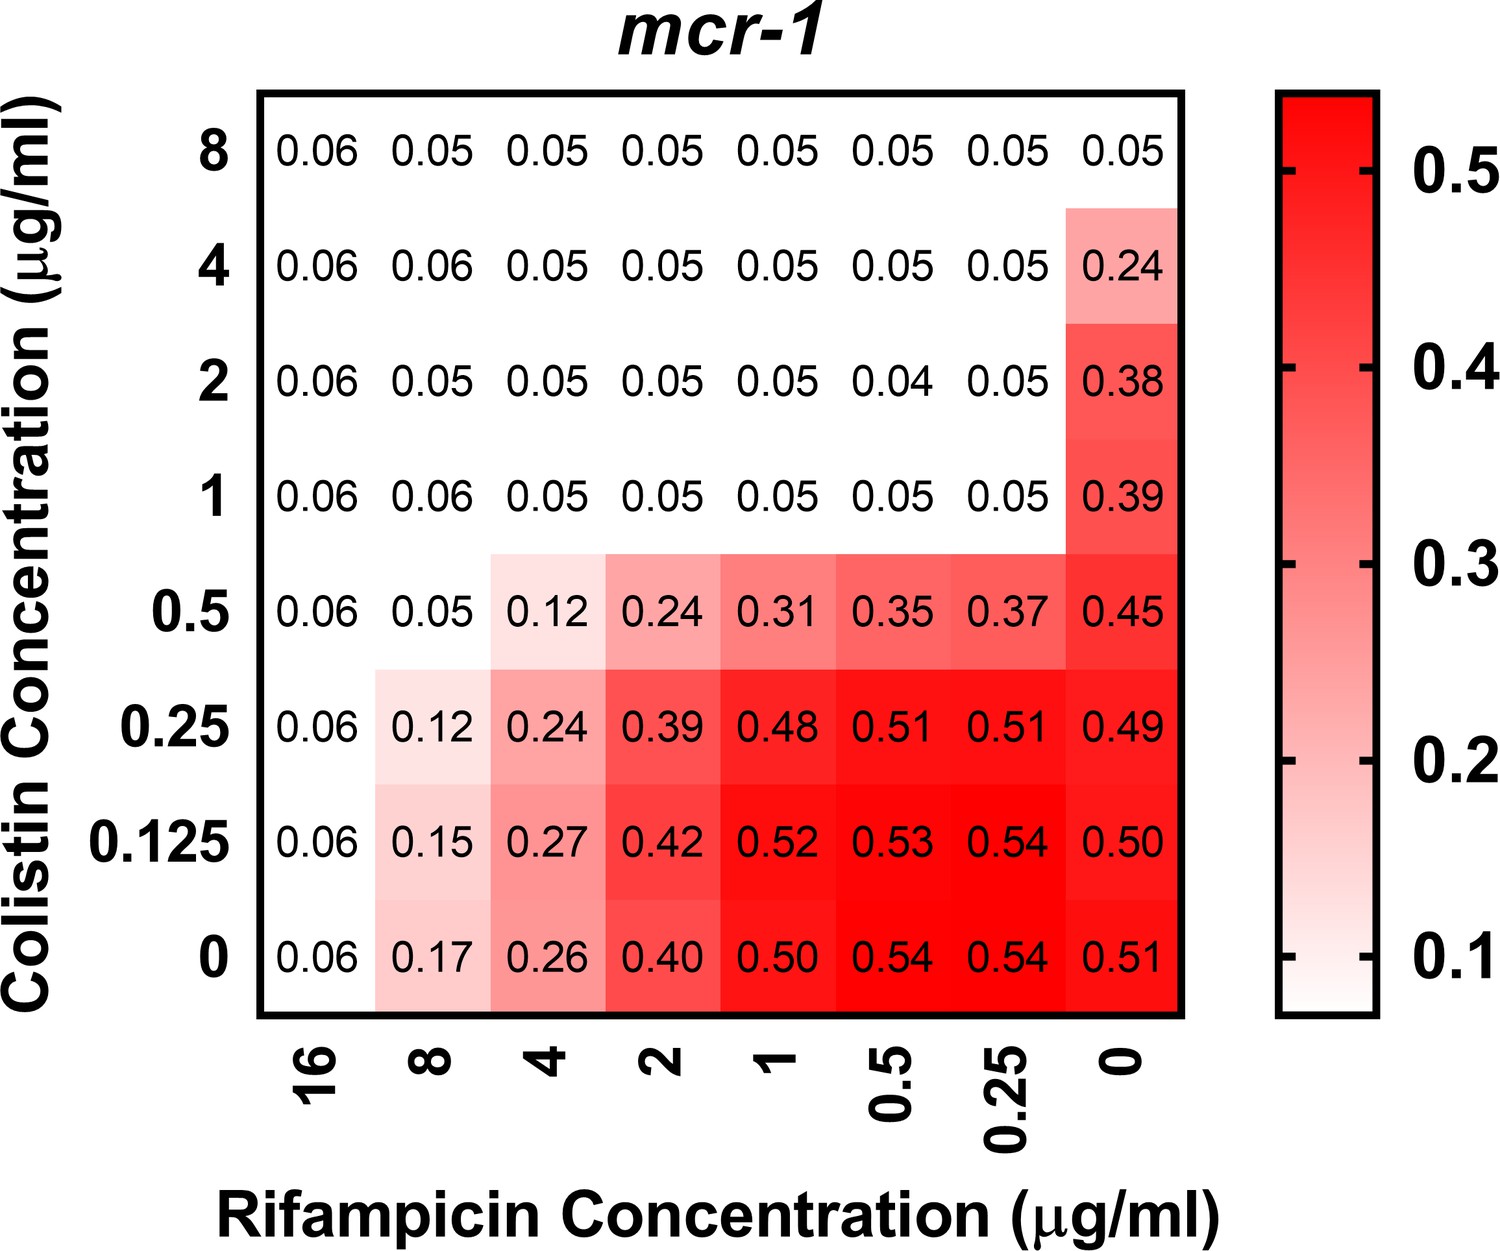
Colistin potentiates the activity of rifampicin against colistin-resistant E. coli expressing mcr-1.
Checkerboard broth microdilution assay showing the synergistic growth-inhibitory activity of colistin and rifampicin against E. coli MC1000 cells producing MCR-1, as determined by measuring OD600nm after 18 hr incubation. Gram-negative bacteria including E. coli are intrinsically resistant to rifampicin, due to its inability to penetrate the OM of the cell envelope and access its intracellular target (MacNair et al., 2018). However, colistin and rifampicin displayed potent synergy against mcr-1-expressing E. coli, with a fractional inhibitory concentration index (FICI) value of 0.14. This indicated that colistin was enabling rifampicin to cross the OM and enter the cytoplasm, providing further evidence that colistin was able to disrupt the OM of resistant bacteria producing MCR-1.
Figure 2 with 2 supplements
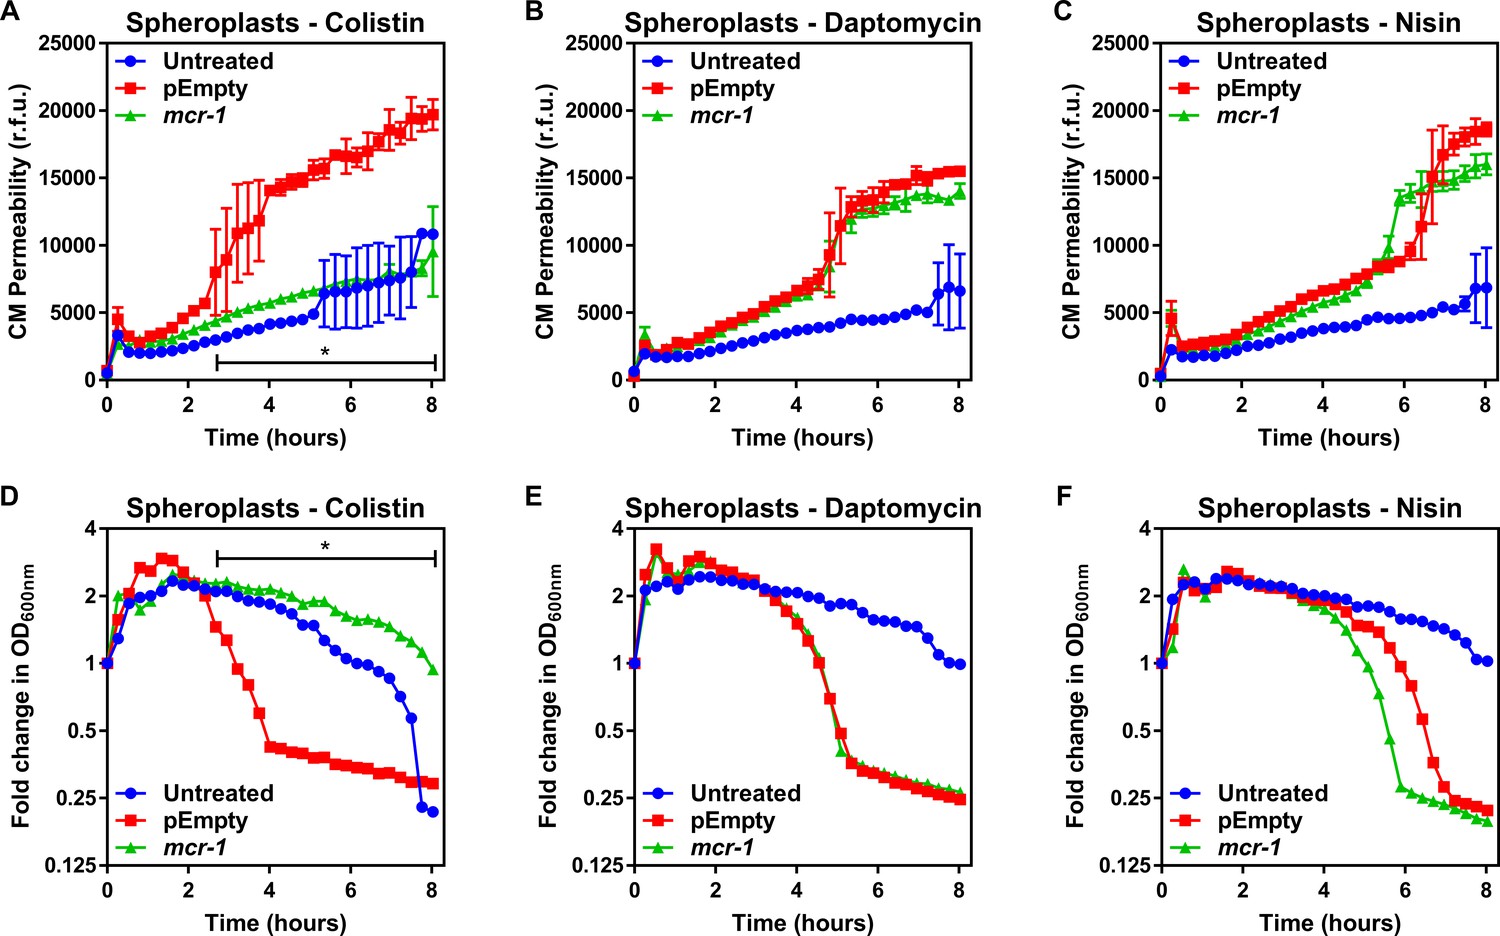
MCR-1 protects the cytoplasmic membrane of E. coli spheroplasts from colistin but not other cationic antimicrobial peptides.
(A–C) Permeabilisation of the CM of E. coli MC1000 spheroplasts generated from bacteria expressing mcr-1 or empty plasmid control bacteria (pEmpty) during incubation with (A) colistin (4 µg ml−1), (B) daptomycin (20 µg ml−1, with 1.25 mM Ca2+ ions), or (C) nisin (20 µg ml−1), as determined using 0.25 µM PI (n = 3, experiment performed on four independent occasions; *p<0.01 between pEmpty and mcr-1 strains). (D–F) Lysis of E. coli MC1000 spheroplasts generated from bacteria expressing mcr-1 or empty plasmid control bacteria during incubation with (D) colistin (4 µg ml−1), (E) daptomycin (20 µg ml−1, with 1.25 µM Ca2+ ions), or (F) nisin (20 µg ml−1), as measured using OD600nm readings (n = 3, experiment performed on four independent occasions; *p<0.05 between pEmpty and mcr-1 strains, error bars are omitted for clarity). Data in (A–F) were analysed by a two-way ANOVA with Dunnett’s post hoc test. Data are presented as the arithmetic mean, and error bars, where shown, represent the standard deviation of the mean. CM: cytoplasmic membrane; r.f.u.: relative fluorescence units; OD: optical density.
Figure 2—figure supplement 1
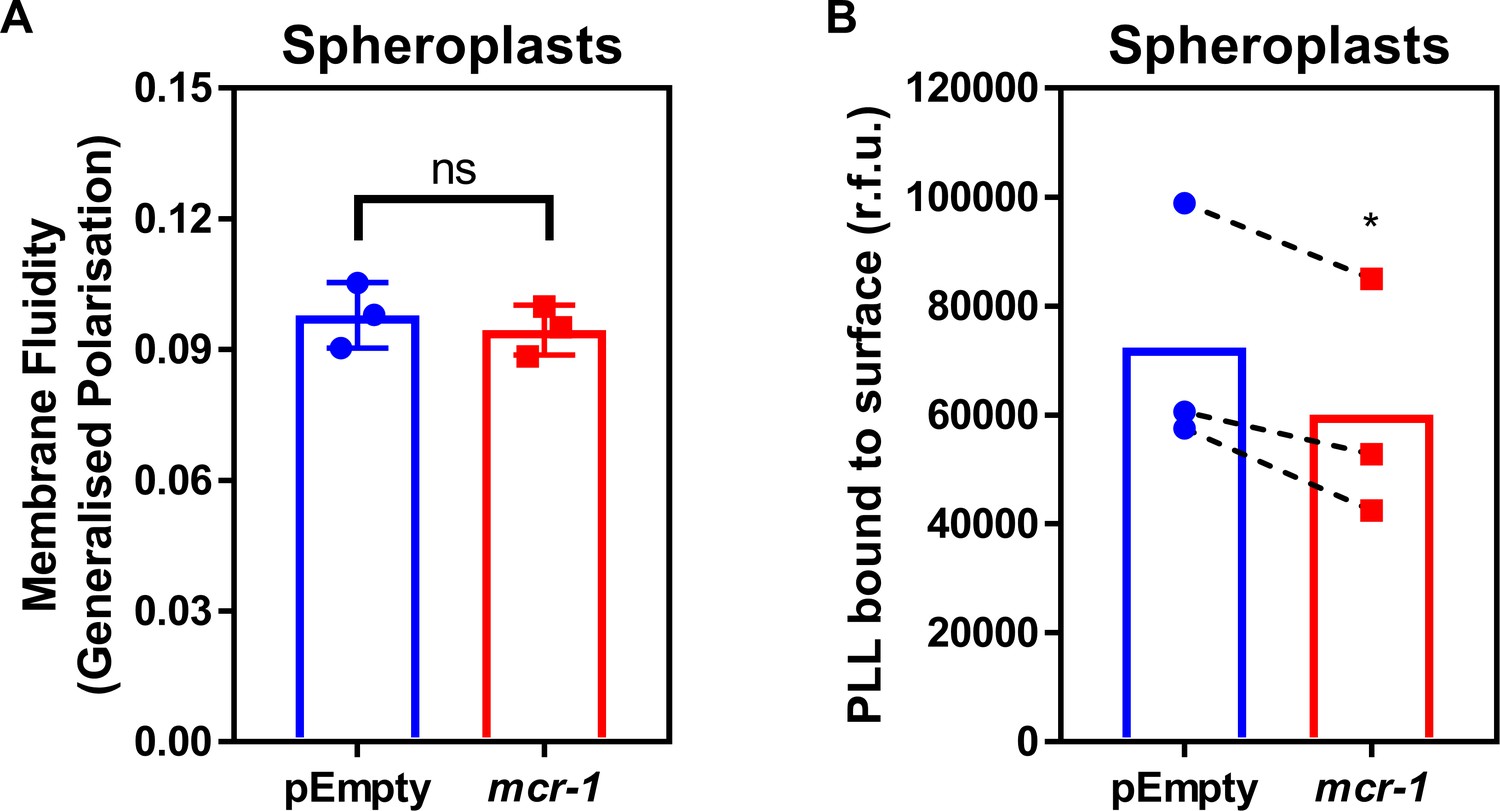
LPS modifications in the CM of colistin-resistant E. coli expressing mcr-1 has a small effect on membrane charge but not membrane fluidity.
(A) Fluidity of the CM of E. coli MC1000 spheroplasts producing MCR-1 or an empty plasmid control strain, as determined using the fluorescent Laurdan dye (100 µM) to generate Generalised Polarisation (GP) values (n = 3 in duplicate; ns: p>0.05 compared to pEmpty). (B) Charge of the CM of E. coli MC1000 spheroplasts producing MCR-1 or an empty plasmid control strain, as determined by binding of highly positively charged FITC-labelled Poly-L-Lysine (PLL, 20 µg ml−1) to the surface of spheroplasts (n = 3; *p<0.05 compared to pEmpty). There was no difference in GP between pEmpty spheroplasts and spheroplasts expressing mcr-1, indicating that modified LPS had no effect on the fluidity of the CM (A). As expected, there was a small decrease in the amount of positively-charged PLL that could bind to the CM of spheroplasts producing MCR-1 compared to pEmpty, demonstrating that LPS modifications slightly increased the net positive charge of the CM (B). Data in (A, B) were analysed by a two-tailed paired Student’s t-test. Data are presented as the arithmetic mean, and error bars represent the standard deviation of the mean.
Figure 2—figure supplement 2
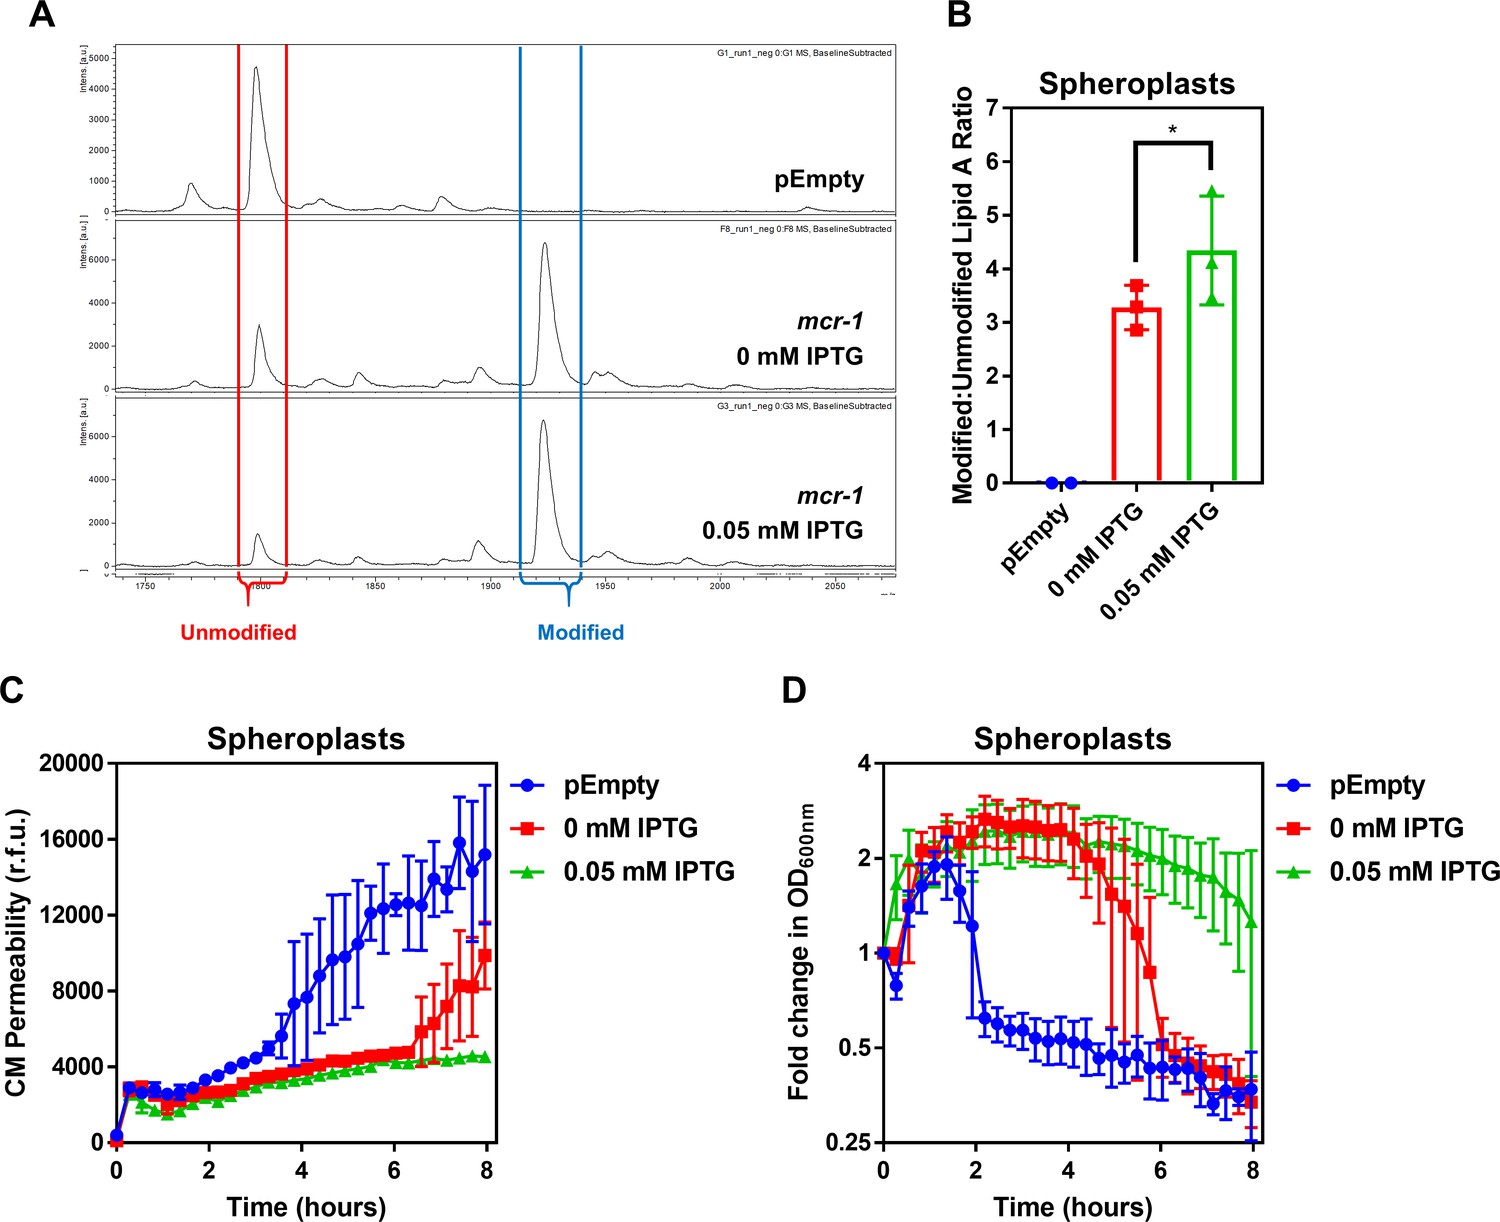
The amount of unmodified LPS in the CM of colistin-resistant E. coli expressing mcr-1 is proportional to the degree of susceptibility to colistin-mediated CM damage.
(A) Representative mass spectra showing the presence and abundance of unmodified lipid A (red) and lipid A modified with phosphoethanolamine (blue) in MCR-1-producing spheroplasts of E. coli MC1000 either uninduced, or induced with 0.05 mM IPTG, as determined by MALDI-TOF-based lipidomics. Also shown, a spectrum from the same analysis of E. coli pEmpty (B) Quantification of LPS modified with phosphoethanolamine, expressed as the ratio of modified lipid A to unmodified lipid A, in MCR-1-producing spheroplasts of E. coli MC1000 either uninduced, or induced with 0.05 mM IPTG, as determined by MALDI-TOF-based lipidomics. (n = 3, *p<0.01 between 0 mM IPTG and 0.05 mM IPTG). (C) Permeabilisation by colistin (4 µg ml−1) of the CM of E. coli MC1000 spheroplasts generated from empty plasmid control bacteria, or from bacteria expressing mcr-1 either uninduced, or induced with 0.05 mM IPTG, as determined using 0.25 µM PI (n = 3, experiment performed on three independent occasions). (D) Lysis by colistin (4 µg ml−1) of E. coli MC1000 spheroplasts generated from empty plasmid control bacteria, or from bacteria expressing mcr-1 either uninduced, or induced with 0.05 mM IPTG, as measured using OD600nm readings (n = 3, experiment performed on three independent occasions). Spheroplasts of E. coli cells producing MCR-1 with different amounts of modified LPS in the CM were generated using the IPTG-inducible pDM1 plasmid. In the absence of IPTG induction, pETN-modified LPS was detected in the CM of E. coli spheroplasts, suggesting leakiness of the expression vector (A). Crucially, however, there was a significant increase in the proportion of pETN-modified lipid A relative to unmodified lipid A in the CM in response to 0.05 mM IPTG, in keeping with increased mcr-1 expression (A, B). The quantity of unmodified LPS in the CM of E. coli spheroplasts correlated with the extent to which the CM was susceptible to colistin-induced disruption of the CM, with spheroplasts that were not induced with IPTG displaying only a partial reduction in PI uptake in response to the polymyxin antibiotic compared to pEmpty spheroplasts (C). In keeping with this, colistin-mediated lysis of uninduced spheroplasts producing MCR-1 was delayed, but not prevented (D). By contrast, E. coli spheroplasts expressing mcr-1 which were induced with 0.05 mM IPTG and had a lower proportion of unmodified lipid A in the CM and exhibited no CM disruption in response to colistin and there was also no lysis of spheroplasts observed (C, D). This confirmed that resistance to colistin conferred by mcr-1 was directly related to the amount of unmodified LPS present in the CM. Data in B were analysed by a one-way ANOVA with Sidak’s post hoc test. Data are presented as the arithmetic mean, and error bars represent the standard deviation of the mean.
Figure 3
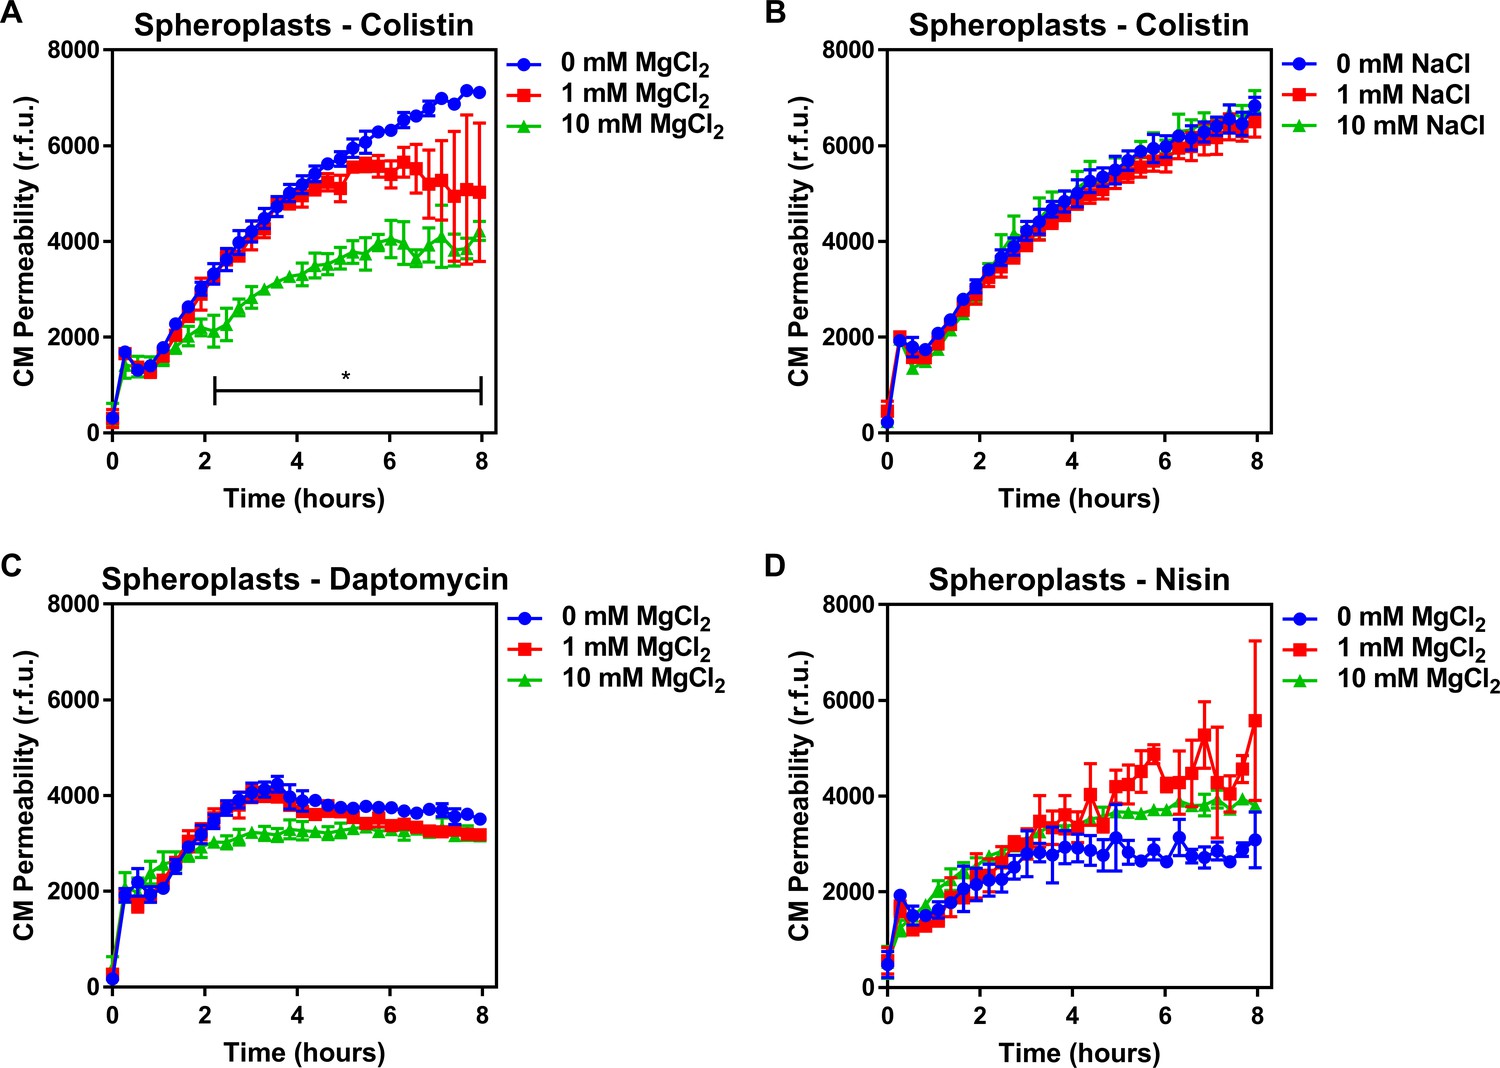
Colistin damages the cytoplasmic membrane by disrupting cation bridges between LPS molecules.
(A, B) Permeabilisation of the CM of E. coli MC1000 spheroplasts generated from empty plasmid control bacteria during incubation with colistin (4 µg ml−1), in the absence or presence of either MgCl2( A) or NaCl (B) at the indicated concentrations, as determined using 0.25 µM PI (n = 3, experiment performed on three independent occasions; *p<0.01 between 0 mM MgCl2 and 10 mM MgCl2). (C, D) Permeabilisation of the CM of E. coli MC1000 spheroplasts generated from empty plasmid control bacteria during incubation with either (C) daptomycin (20 µg ml−1, with 1.25 mM Ca2+ ions) or (D) nisin (20 µg ml−1), in the absence or presence of MgCl2 at the indicated concentrations, as determined using 0.25 µM PI (n = 3, experiment performed on three independent occasions). Data in (A–D) were analysed by a two-way ANOVA with Dunnett’s post hoc test. Data are presented as the arithmetic mean, and error bars represent the standard deviation of the mean. CM: cytoplasmic membrane; r.f.u.: relative fluorescence units.
Figure 4 with 7 supplements

Murepavadin sensitises P. aeruginosa to colistin by increasing LPS abundance in the cytoplasmic membrane.
(A) Checkerboard broth microdilution assay showing the synergistic growth-inhibitory interaction between colistin and the LPS transport inhibitor murepavadin against P. aeruginosa PA14 cells, as determined by measuring OD595nm after 18 hr incubation. (B) OM disruption of P. aeruginosa PA14 cells during 10 min exposure to colistin (2 µg ml−1) in the absence or presence of murepavadin (0.05 µg ml−1), as assessed by uptake of the fluorescent dye NPN (10 µM) (n = 4, each data point represents the arithmetic mean of 20 replicate measurements; ns: p>0.05 between colistin-treated bacteria). (C) CM disruption of P. aeruginosa PA14 cells exposed to colistin (2 µg ml−1) in the absence or presence of murepavadin (0.05 µg ml−1), as determined using 2.5 µM PI (n = 4; *p<0.0001 for colistin and murepavadin-exposed cells compared to colistin alone). (D) Lysis of P. aeruginosa PA14 cells exposed to colistin (2 µg ml−1) in the absence of presence of murepavadin (0.05 µg ml−1), as measured by OD595nm readings (n = 4; *p<0.01 for colistin and murepavadin-exposed cells compared to colistin alone). Data in (B) were analysed by a one-way ANOVA with Tukey’s post hoc test. Data in (C, D) were analysed by a two-way ANOVA with Dunnett’s post hoc test. Data are presented as the arithmetic mean, and error bars represent the standard deviation of the mean. OM: outer membrane; NPN: N-phenyl-1-naphthylamine; CM: cytoplasmic membrane; r.f.u.: relative fluorescence units; OD: optical density.
Figure 4—figure supplement 1
Formation of P. aeruginosa spheroplasts.
(A, B) Representative phase contrast micrographs of P. aeruginosa PA14 cells before (A) and after (B) treatment with 0.25 mg ml−1 EDTA (to remove the OM) and 1 mg ml−1 lysozyme (to remove the cell wall) for 1 hr at 30°C, followed by the addition of trypsin (0.5 mg ml−1) for 15 min, with all incubations occurring in Tris buffer (0.03 M, pH 8.0) containing 20% sucrose (Scale bars: 5 μm). (C) Quantification of length:width ratio of P. aeruginosa PA14 whole cells (A) and P. aeruginosa spheroplasts following exposure to EDTA, lysozyme, and trypsin (B) (n = 250 cells per group; *p<0.0001 compared to Whole Cells). (D) Lysis of P. aeruginosa spheroplasts exposed to EDTA (0.25 mg ml−1) and lysozyme (1 mg ml−1) at 30°C in Tris buffer (0.03 M, pH 8.0), in the presence or absence of 20% sucrose, as determined by OD595nm measurements (n = 4; *p<0.0001 compared to No Sucrose). After removal of the OM and cell wall with EDTA and lysozyme respectively, the resulting P. aeruginosa cells formed had a length:width ratio of almost exactly 1 (C) and immediately lysed when not maintained in an osmoprotective environment containing 20% sucrose (D). Together, these data confirmed the successful production of P. aeruginosa spheroplasts lacking the OM and cell wall. Data in C were analysed by an unpaired Student’s t-test. Data in D were analysed by a two-way ANOVA with Sidak’s post hoc test. Data are presented as the arithmetic mean, and error bars represent the standard deviation of the mean.
Figure 4—figure supplement 2
Conversion of P. aeruginosa whole cells to spheroplasts results in removal of the OM, and no OM contamination in the CM.
(A) Representative fluorescence microscopy images of P. aeruginosa PA14 cells labelled with fluorescein isothiocyanate (FITC, 0.5 mg ml−1) before (Whole Cells) and after (Spheroplasts) conversion to spheroplasts with EDTA (0.25 mg ml−1) and lysozyme (1 mg ml−1) in Tris buffer (0.03 M, pH 8.0) containing 20% sucrose, as described in Figure 4—figure supplement 1 (Scale bars: 5 μm). (B) Quantification of fluorescence from FITC-labelled P. aeruginosa PA14 cells before (Whole Cells) and after (Spheroplasts) conversion to spheroplasts (n = 3 in triplicate; *p<0.05 compared to Whole Cells). Proteins in the OM of whole P. aeruginosa cells were tagged with a FITC fluorophore for 30 min, as previously described (Wiegand et al., 2008). Following conversion of these labelled bacterial cells to spheroplasts, there was virtually no fluorescence from FITC visible by microscopy (A), or when quantifying the entire cell population (B). This confirmed that the OM had been successfully removed during the formation of spheroplasts, and that there was no contamination of the CM with material from the OM. Data in B were analysed by a paired Student’s t-test. Data are presented as the arithmetic mean, and error bars represent the standard deviation of the mean.
Figure 4—figure supplement 3
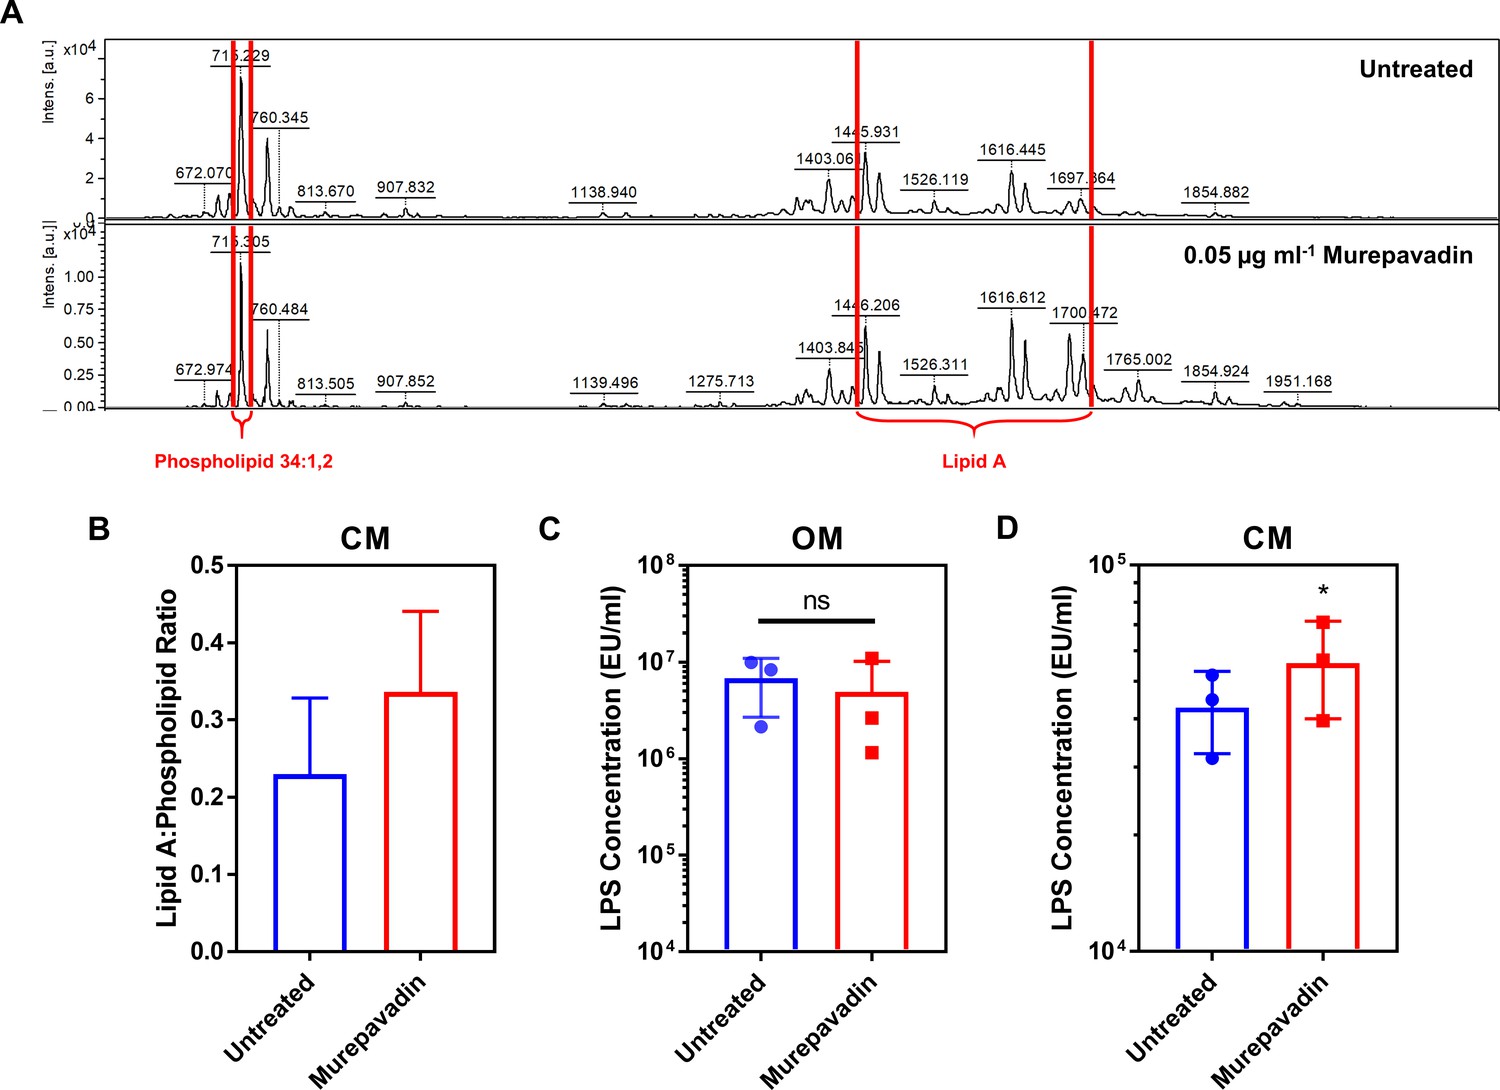
Murepavadin increases the abundance of LPS in the cytoplasmic membrane (CM) of P. aeruginosa.
(A, B) Representative mass spectra (A) and quantification (B) showing the ratio of lipid A to a membrane phospholipid species (34:1,2) in the CM of P. aeruginosa PA14 spheroplasts exposed, or not, to murepavadin (0.05 µg ml−1) for 2 hr, as determined by MALDI-TOF-based lipidomics (n = 3 in duplicate). (C, D) Quantification of LPS levels in the OM (C) and CM (D) of P. aeruginosa PA14 during conversion to spheroplasts from whole cells pre-exposed, or not, to the LPS transport inhibitor murepavadin (0.05 μg ml−1) for 2 hr, as determined using the Limulus Amebocyte Lysate (LAL) assay (n = 3; ns: p>0.05, *p<0.05 compared to Untreated conditions). Exposure of P. aeruginosa to a sub-lethal concentration of the LPS transport inhibitor murepavadin triggered an accumulation of LPS in the CM, but had no effect on LPS levels in the OM. Furthermore, MALDI-TOF analysis confirmed that the LPS in murepavadin-treated cells was unmodified, confirming it could be accurately detected and quantified using the LAL assay. Data in B–D were analysed by a two-tailed paired Student’s t-test. Data are presented as the arithmetic mean, and error bars represent the standard deviation of the mean.
Figure 4—figure supplement 4
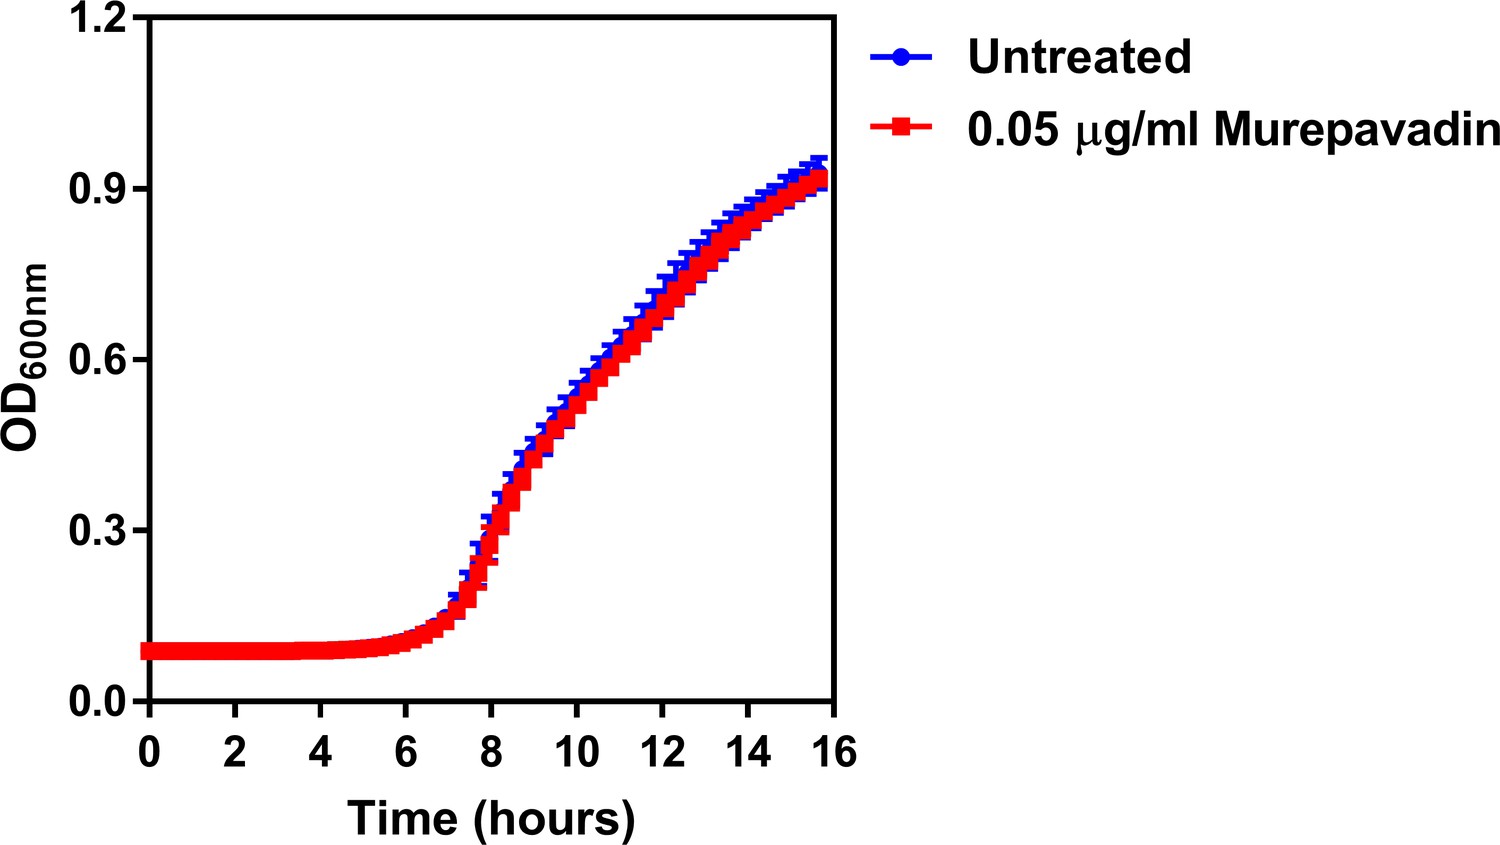
The LPS transport inhibitor murepavadin has no effect on reducing growth of P. aeruginosa at the concentration used.
Growth of P. aeruginosa PA14 cells in the presence of a sub-lethal concentration of the LptD inhibitor murepavadin at the indicated concentration, as determined by measuring OD600nm during 14 hr incubation at 37°C (n = 4; murepavadin-treated population not significantly different i.e. p>0.05 compared to Untreated). Exposure of P. aeruginosa to murepavadin at the concentration used in experiments had no effect on blocking bacterial growth, confirming that this was a sub-lethal concentration. Data were analysed by a two-way ANOVA with Sidak’s post hoc test. Data are presented as the arithmetic mean, and error bars represent the standard deviation of the mean.
Figure 4—figure supplement 5
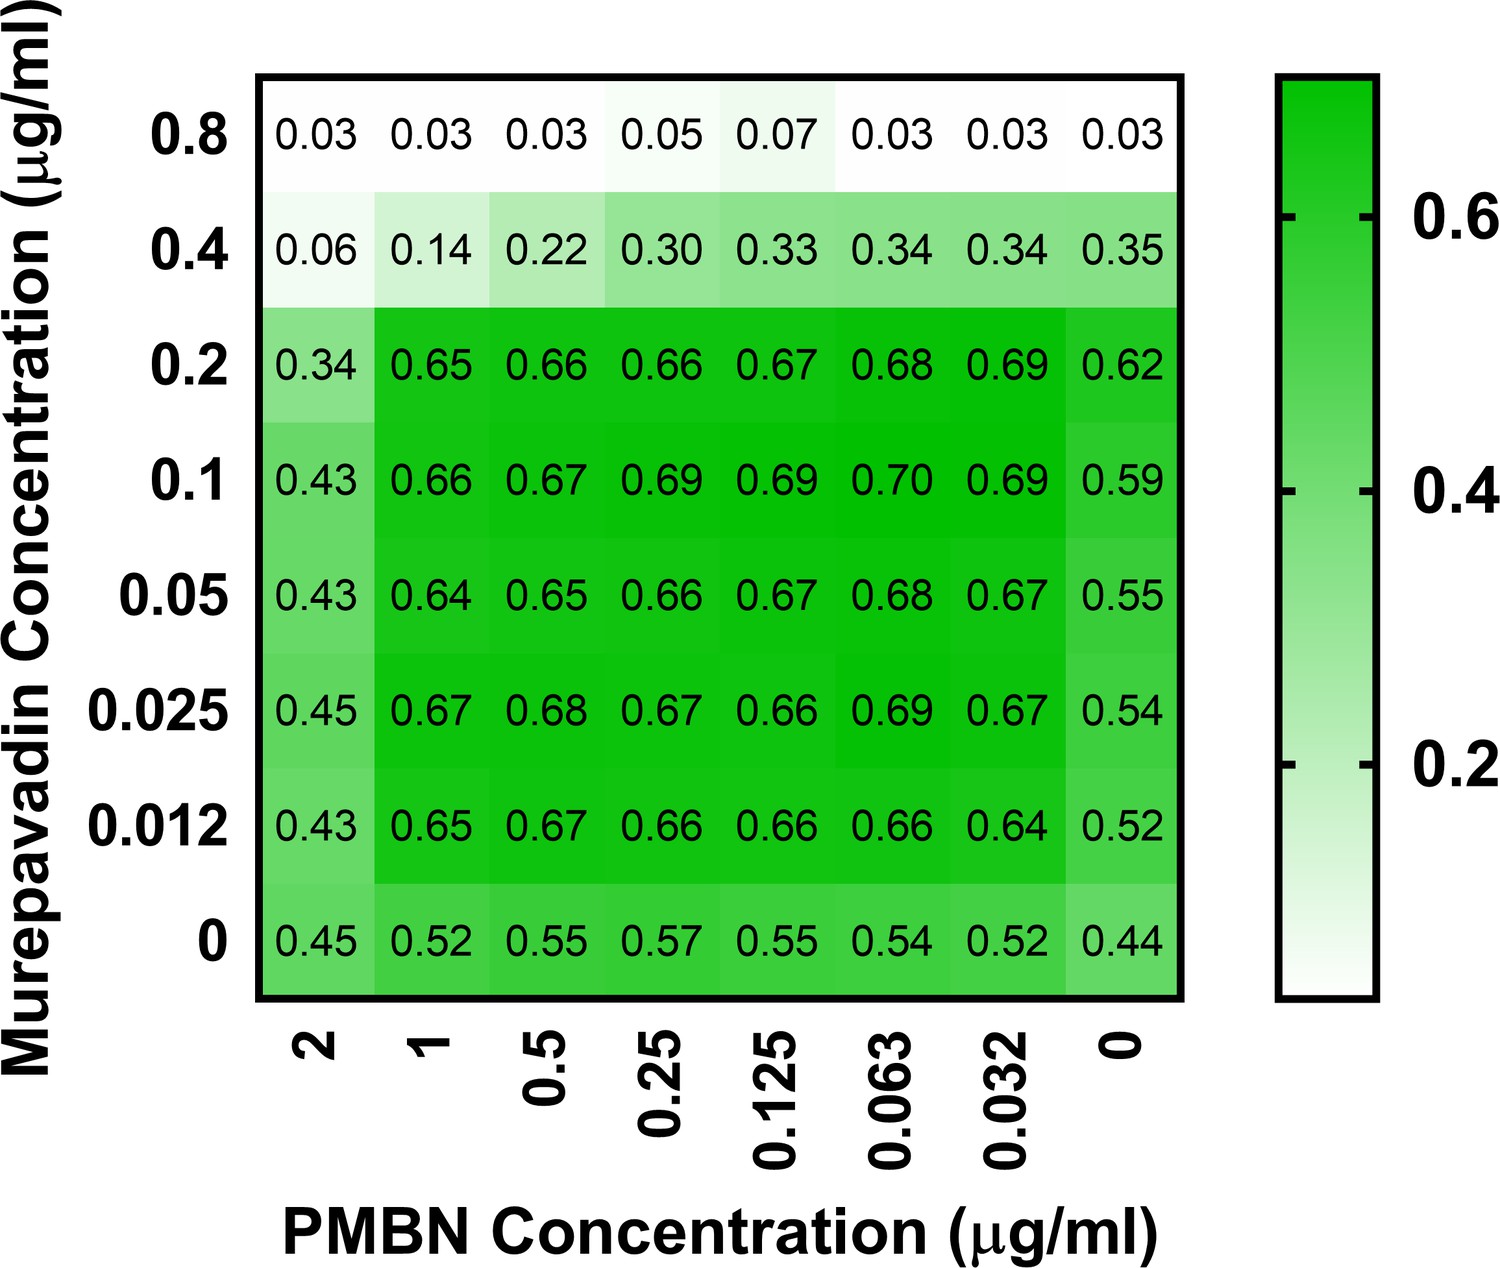
Polymyxin B nonapeptide (PMBN) does not display synergy with murepavadin against P. aeruginosa PA14.
Checkerboard broth microdilution assay showing the growth-inhibitory interaction between PMBN and murepavadin against P. aeruginosa PA14 cells, as determined by measuring OD600nm after 18 hr incubation. In contrast to the synergistic interaction between colistin and murepavadin (Figure 4A), there was no synergy observed between murepavadin and PMBN, with an FICI value of 1. The lack of synergy between PMBN and murepavadin confirms that the synergistic interaction between colistin and murepavadin was not due to colistin permeabilising the OM and enhancing the activity of murepavadin.
Figure 4—figure supplement 6
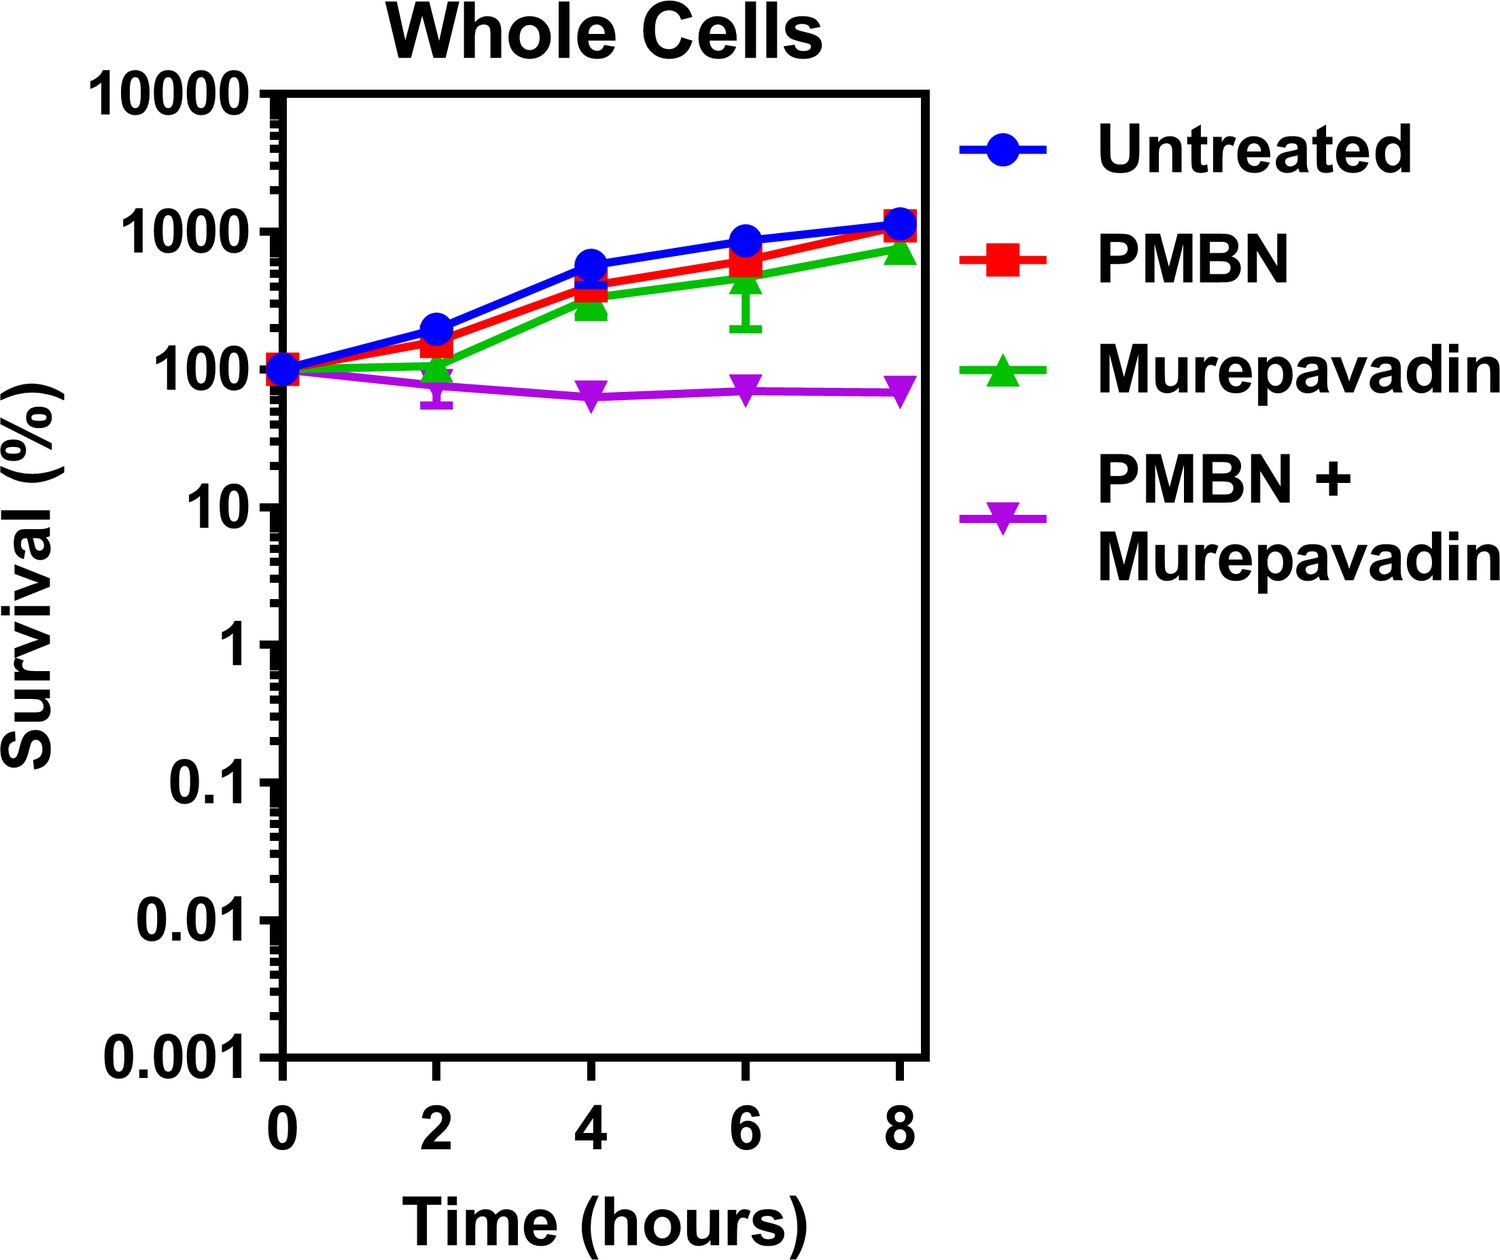
PMBN–murepavadin combination therapy does not promote killing of P. aeruginosa.
Survival of P. aeruginosa PA14 cells exposed to polymyxin B nonapeptide (1.67 µg ml−1) in the absence of presence of murepavadin (0.05 µg ml−1), as determined by c.f.u. counts (n = 4). In contrast to the marked increase in bacterial killing when colistin was used in combination with murepavadin (Figure 5A), there was no decrease in survival of P. aeruginosa cells when treated with murepavadin alongside the molar equivalent concentration of PMBN (1.73 µM) as was used for colistin experiments in Figure 5A (2 µg ml−1), although there was evidence of an additive effect. Since PMBN and colistin both share the ability to permeabilise the OM, this provided further confirmation that the enhanced bacterial killing was not due to colistin providing murepavadin with increased access to its target, but rather due to murepavadin-induced accumulation of LPS in the CM. Data are presented as the arithmetic mean, and error bars represent the standard deviation of the mean.
Figure 4—figure supplement 7
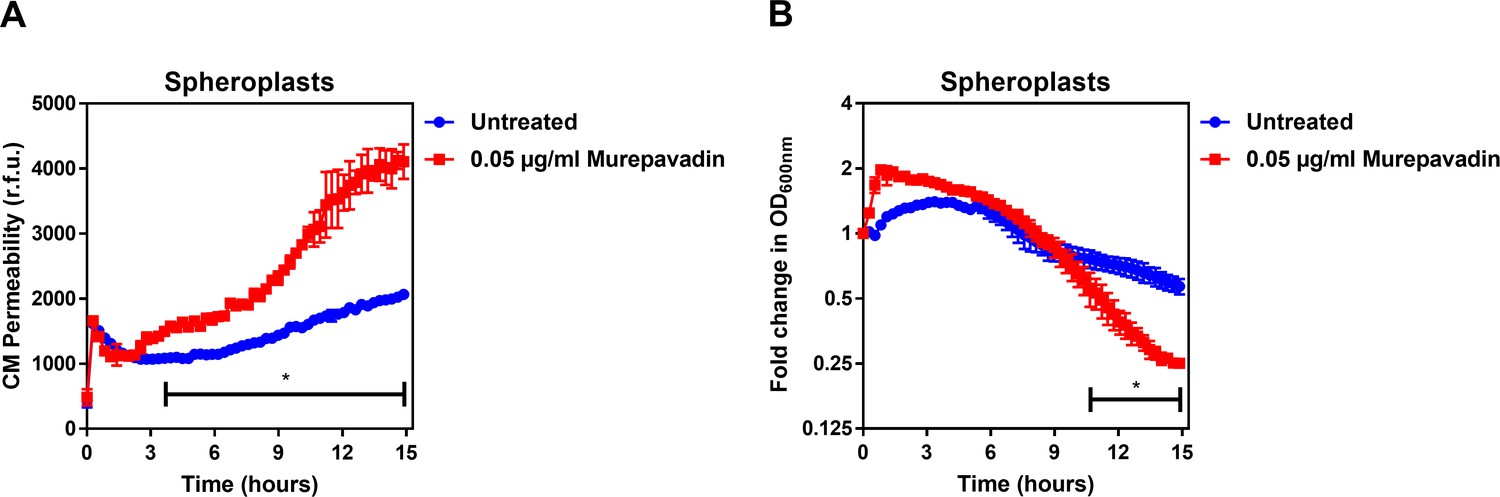
Murepavadin enhances the ability of colistin to damage the CM and trigger bacterial lysis.
(A) Permeabilisation of the CM of P. aeruginosa PA14 spheroplasts by colistin (2 µg ml−1) following exposure, or not, of bacteria to murepavadin (0.05 µg ml−1) for 2 hr prior to conversion to spheroplasts, as determined using 0.25 µM PI (n = 3; experiment performed on three independent occasions, *p<0.01 for murepavadin pre-treated spheroplasts compared to untreated cells). (B) Lysis of P. aeruginosa PA14 spheroplasts by colistin (2 µg ml−1) following exposure, or not, of bacteria to murepavadin (0.05 µg ml−1) for 2 hr prior to conversion to spheroplasts, as measured by OD600nm readings (*p<0.05 for murepavadin pre-treated spheroplasts compared to untreated cells). As observed with whole bacterial cells (Figure 4C,D), murepavadin-induced accumulation of LPS in the CM of P. aeruginosa spheroplasts significantly enhanced the ability of colistin to damage the CM (A). In keeping with this, the increased amount of LPS in the CM of murepavadin pre-treated spheroplasts led to an increase in colistin-mediated lysis (B). Crucially, these experiments were performed with cells that were pre-treated with murepavadin, with the LptD inhibitor washed out prior to exposure to colistin. This confirmed that it was murepavadin triggering LPS accumulation in the CM that led to an increase in bacterial lysis in response to colistin, rather than the polymyxin antibiotic enhancing murepavadin activity through OM permeabilisation. Data in A, B were analysed by a two-way ANOVA with Sidak’s post hoc test. Data are presented as the arithmetic mean, and error bars represent the standard deviation of the mean.
Figure 5 with 2 supplements
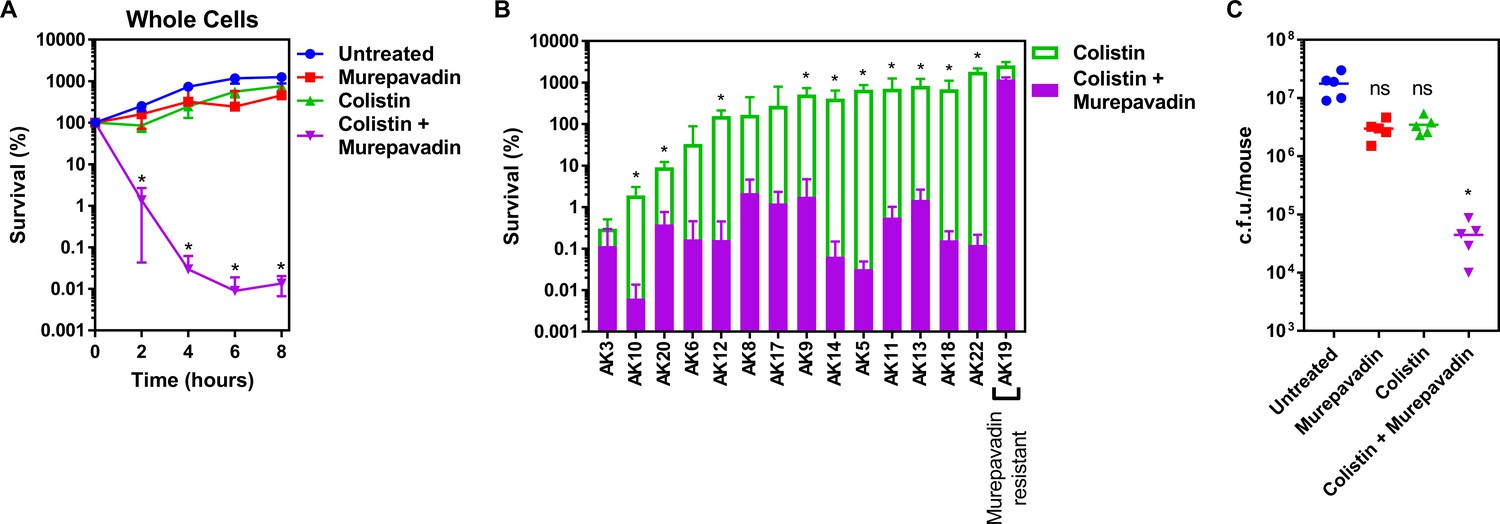
Colistin-murepavadin combination therapy promotes killing of P. aeruginosa in vitro and in vivo.
(A) Survival of P. aeruginosa PA14 cells exposed to colistin (2 µg ml−1) in the absence of presence of murepavadin (0.05 µg ml−1), as determined by c.f.u. counts (n = 4; *p<0.05 for colistin and murepavadin-exposed cells compared to colistin alone). (B) Survival or growth of a panel of clinical multidrug-resistant P. aeruginosa strains isolated from the sputum of cystic fibrosis patients after 8 hr exposure to colistin (2 µg ml−1) alone, or in the presence of a sub-lethal concentration (0.5× MIC) of murepavadin, as determined by c.f.u. counts (n = 4; *p<0.01 for colistin and murepavadin-exposed cells compared to colistin alone). (C) Burden of P. aeruginosa PA14 in the lungs of mice after 3 hr treatment with murepavadin (0.25 mg kg-1), colistin (5 mg kg-1), neither antibiotic, or both antibiotics in combination, as determined by c.f.u. counts (each data point represents a single mouse; for each group, n = 5; ns: p>0.05, *p<0.001 compared to untreated mice). Data in (A, B) were analysed by a two-way ANOVA with Dunnett’s (A) or Sidak’s (B) post hoc tests. Data in (C) were analysed by a Kruskal–Wallis test with Dunn’s post hoc test. Data are presented as the arithmetic mean, and error bars, where shown, represent the standard deviation of the mean.
Figure 5—figure supplement 1
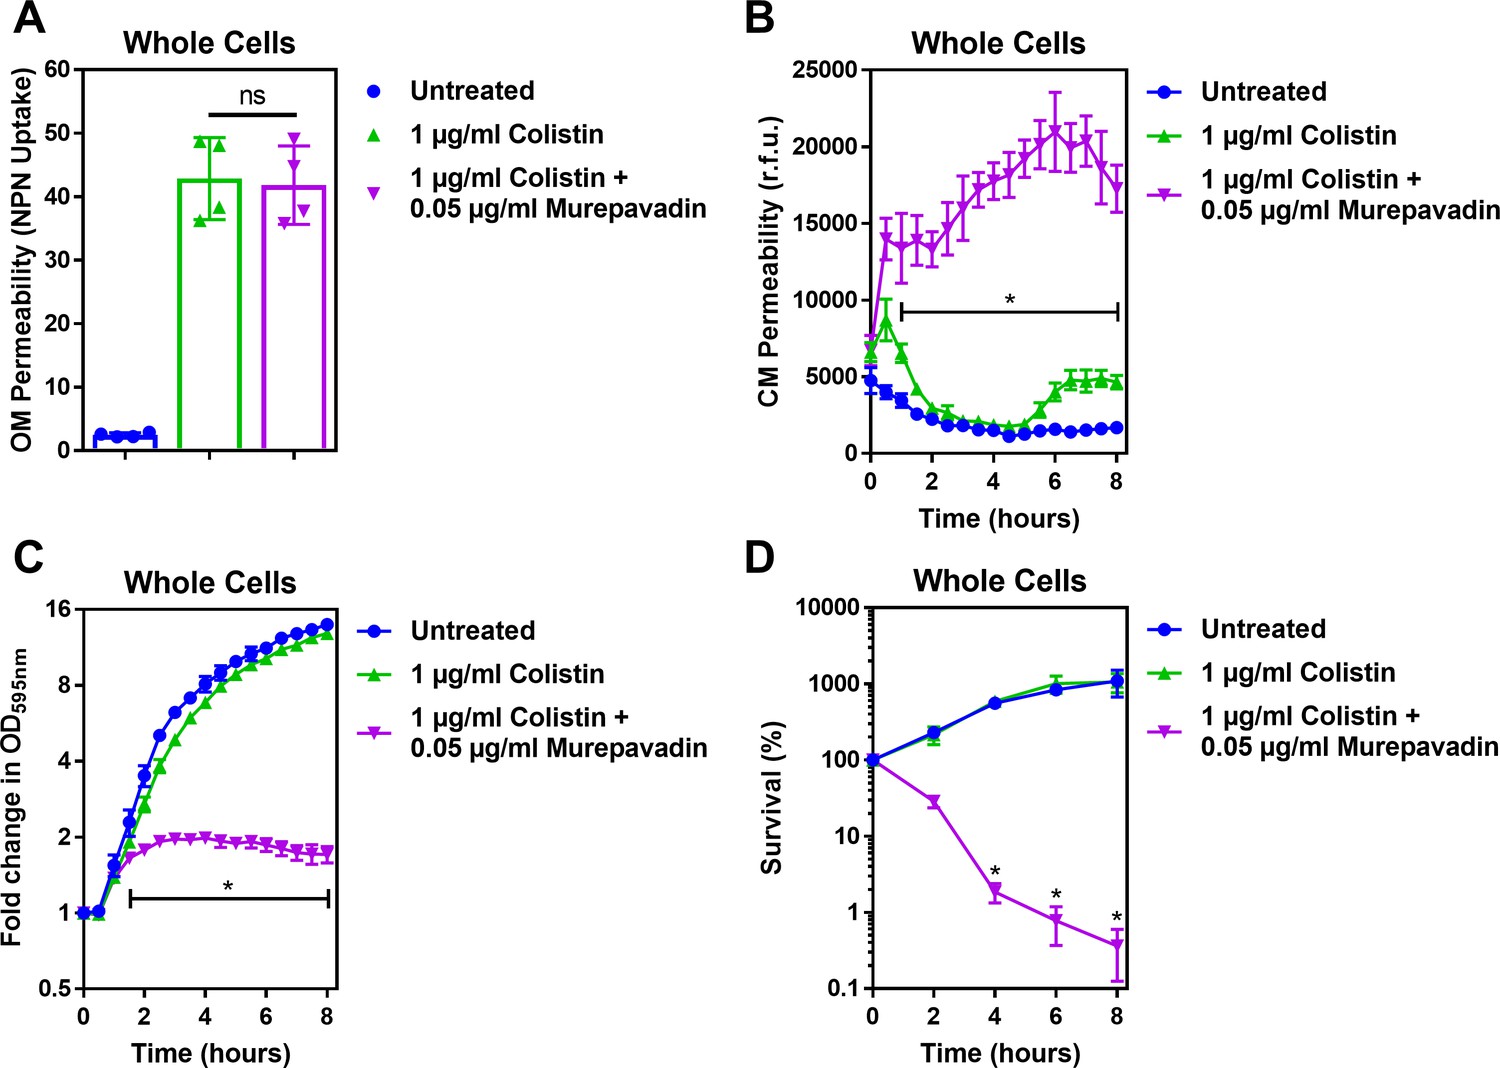
Murepavadin potentiates the activity of sub-lethal colistin concentrations, leading to enhanced CM damage, cell lysis and bacterial killing.
(A) OM disruption of P. aeruginosa PA14 cells during 10 min exposure to colistin (1 μg ml−1) in the absence or presence of murepavadin (0.05 μg ml−1), as assessed by uptake of the fluorescent dye NPN (10 μM) (n = 4, each data point represents the arithmetic mean of 20 replicate measurements; ns: p>0.05 between colistin-treated bacteria). (B) CM disruption of P. aeruginosa PA14 cells exposed to colistin (1 μg ml−1) in the absence or presence of murepavadin (0.05 μg ml−1), as determined using 2.5 μM PI (n = 4; *p<0.0001 for murepavadin-exposed cells compared to Colistin alone). (C) Growth of P. aeruginosa PA14 cells exposed to colistin (1 μg ml−1) in the absence or presence of murepavadin (0.05 μg ml−1), as measured by OD595nm readings (n = 4; *p<0.01 for murepavadin-exposed cells compared to Colistin alone). (D) Survival of P. aeruginosa PA14 cells exposed to colistin (1 μg ml−1) in the absence or presence of murepavadin (0.05 μg ml−1), as determined by c.f.u. counts (n = 4; *p<0.0001 for murepavadin-exposed cells compared to Colistin alone). Exposure of P. aeruginosa to murepavadin, which leads to accumulation of LPS in the CM, had no impact on the ability of colistin to damage the OM, further confirming that the LPS transport inhibitor, at the concentration used, did not significantly affect LPS levels in the OM (A). However, a normally sub-lethal concentration of colistin was able to permeabilise the CM of murepavadin-exposed whole cells of P. aeruginosa (B). This enhanced CM disruption by a sub-lethal concentration of colistin in combination with murepavadin led to an increase in lysis of P. aeruginosa cells, and ultimately greater bacterial killing (C, D). Together, these data showed that accumulation of LPS in the CM via murepavadin enhanced the bactericidal activity of colistin, even at concentrations of the polymyxin antibiotic that otherwise had no growth inhibitory effects. Data in A were analysed by a one-way ANOVA with Tukey’s post hoc test. Data in B, C were analysed by a two-way ANOVA with Dunnett’s post hoc test. Data in D were analysed by a two-way ANOVA with Tukey’s post hoc test. Data are presented as the arithmetic mean, and error bars represent the standard deviation of the mean.
Figure 5—figure supplement 2
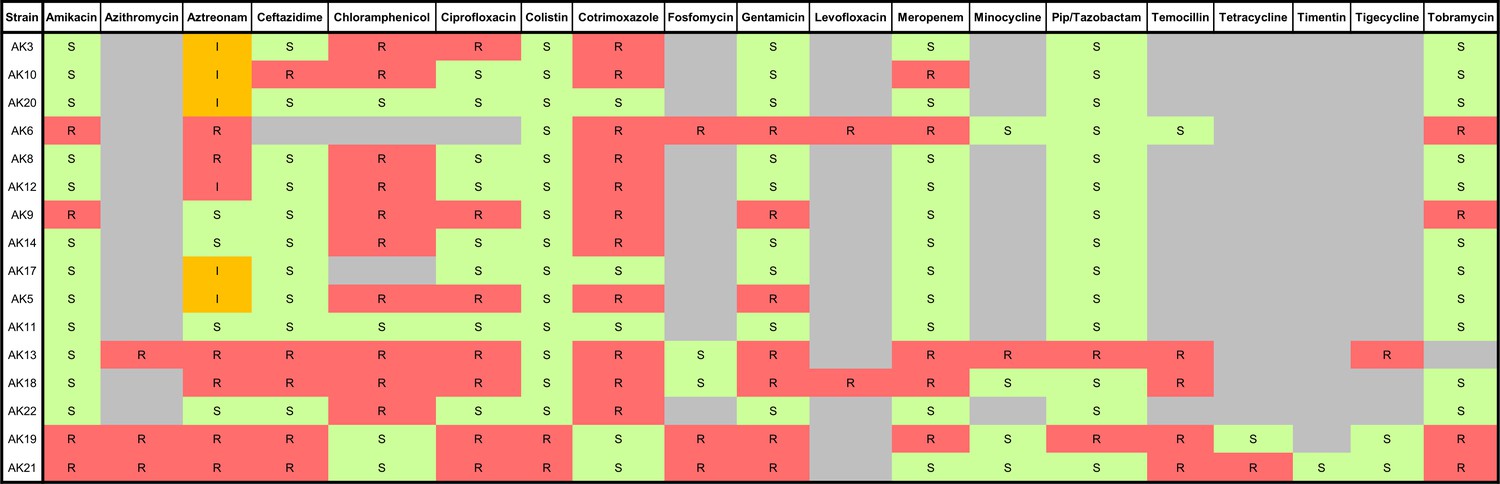
Antibiogram summarising the antimicrobial susceptibilities of a panel of MDR P. aeruginosa human clinical strains isolated from sputum samples of cystic fibrosis patients.
S: susceptible (green), I: intermediate (orange), R: resistant (red). Bacterial strains were isolated and antimicrobial susceptibility testing was performed at the Royal Brompton Hospital, Royal Brompton, and Harefield NHS Foundation Trust.
Figure 6
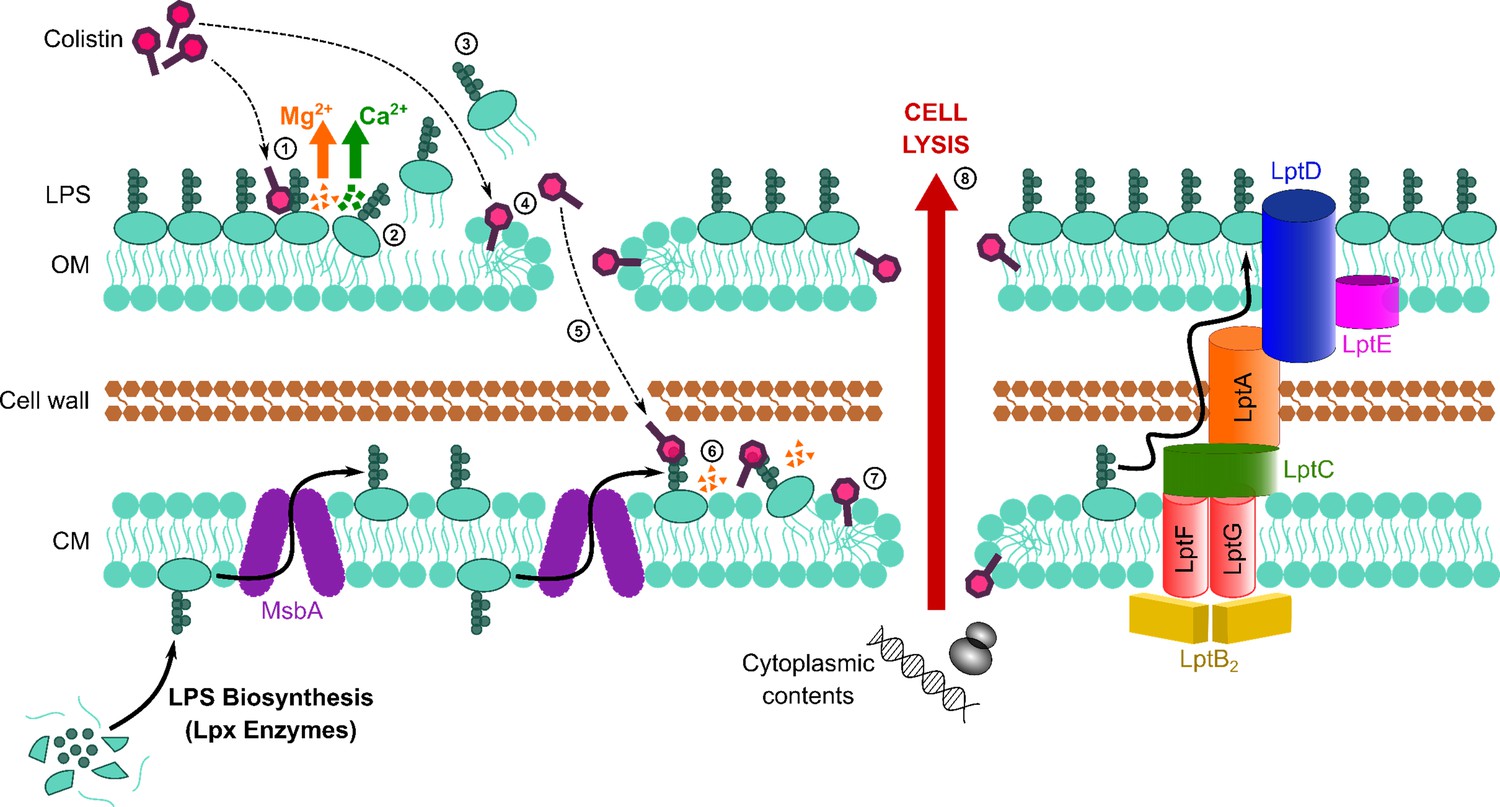
Colistin kills bacteria by targeting LPS in both the outer and cytoplasmic membrane (CM), leading to disruption of the cell envelope and bacterial lysis.
Diagrammatic representation of the novel proposed mechanism of action of colistin: Colistin binds to LPS in the OM (1), displacing cations that form bridges between LPS molecules, which leads to destabilisation of the OM (2). As a consequence of the weakening of intermolecular bonds in the LPS monolayer, LPS is released from the bacterial surface (3), allowing colistin to further damage the OM via the action of the polymyxin lipid tail (4). This provides colistin with access to the periplasm, where colistin interacts with LPS in the CM (5) that is awaiting transport to the OM by the LptABCDEFG machinery after being synthesised in the cytoplasm and flipped to the outer leaflet of the CM by MsbA. As in the OM, colistin binding to LPS results in displacement of cation bridges and disruption of the CM (6), which it ultimately permeabilises (7), culminating in the loss of cytoplasmic contents, cell lysis, and bacterial death (8).
Tables
Key resources table
| Reagent type (species) or resource | Designation | Source or reference | Identifiers | Additional information |
|---|---|---|---|---|
| Strain, strain background (Escherichia coli) | MC1000 | Dortet et al., 2018 PMID:30442963 | pEmpty | Background strain (araD139, ∆(ara, leu)7697, ∆lacX74, galU, galK, strA) harbouring the IPTG-inducible pDM1 plasmid (GenBank MN128719) |
| Strain, strain background (Escherichia coli) | MC1000 | Dortet et al., 2018 PMID:30442963 | mcr-1 | MC1000 strain harbouring the pDM1 plasmid encoding the mcr-1 gene amplified from a clinical E. coli isolate |
| Strain, strain background (Pseudomonas aeruginosa) | PA14 | Lee et al., 2006 PMID:17038190 | PA14 | Wild-type reference strain; highly virulent human isolate representing most common clonal group worldwide |
| Strain, strain background (Pseudomonas aeruginosa) | AK3 | This study | AK3 | Multi-drug resistant human clinical isolate from sputum of cystic fibrosis patient – mucoid strain |
| Strain, strain background (Pseudomonas aeruginosa) | AK10 | This study | AK10 | Multi-drug resistant human clinical isolate from sputum of cystic fibrosis patient |
| Strain, strain background (Pseudomonas aeruginosa) | AK20 | This study | AK20 | Multi-drug resistant human clinical isolate from sputum of cystic fibrosis patient |
| Strain, strain background (Pseudomonas aeruginosa) | AK6 | This study | AK6 | Multi-drug resistant human clinical isolate from sputum of cystic fibrosis patient – mucoid strain |
| Strain, strain background (Pseudomonas aeruginosa) | AK12 | This study | AK12 | Multi-drug resistant human clinical isolate from sputum of cystic fibrosis patient – mucoid strain |
| Strain, strain background (Pseudomonas aeruginosa) | AK8 | This study | AK8 | Multi-drug resistant human clinical isolate from sputum of cystic fibrosis patient – mucoid strain |
| Strain, strain background (Pseudomonas aeruginosa) | AK17 | This study | AK17 | Multi-drug resistant human clinical isolate from sputum of cystic fibrosis patient |
| Strain, strain background (Pseudomonas aeruginosa) | AK9 | This study | AK9 | Multi-drug resistant human clinical isolate from sputum of cystic fibrosis patient |
| Strain, strain background (Pseudomonas aeruginosa) | AK14 | This study | AK14 | Multi-drug resistant human clinical isolate from sputum of cystic fibrosis patient |
| Strain, strain background (Pseudomonas aeruginosa) | AK5 | This study | AK5 | Multi-drug resistant human clinical isolate from sputum of cystic fibrosis patient – mucoid strain |
| Strain, strain background (Pseudomonas aeruginosa) | AK11 | This study | AK11 | Multi-drug resistant human clinical isolate from sputum of cystic fibrosis patient – mucoid strain |
| Strain, strain background (Pseudomonas aeruginosa) | AK13 | This study | AK13 | Multi-drug resistant human clinical isolate from sputum of cystic fibrosis patient |
| Strain, strain background (Pseudomonas aeruginosa) | AK18 | This study | AK18 | Multi-drug resistant human clinical isolate from sputum of cystic fibrosis patient |
| Strain, strain background (Pseudomonas aeruginosa) | AK22 | This study | AK22 | Multi-drug resistant human clinical isolate from sputum of cystic fibrosis patient |
| Strain, strain background (Pseudomonas aeruginosa) | AK19 | This study | AK19 | Multi-drug resistant human clinical isolate from sputum of cystic fibrosis patient – murepavadin-resistant |
| Chemical compound, drug | Colistin | Sigma-Aldrich | C4461-1G | Targets LPS |
| Chemical compound, drug | Murepavadin (POL7080) | DC Chemicals | DC11273 | Targets LptD |
| Chemical compound, drug | Daptomycin | Bio-Techne Ltd | 3917/10 | Targets phosphatidylglycerol in the bacterial membrane |
| Chemical compound, drug | Nisin | Sigma-Aldrich | N5764-5G | Targets bacterial membranes |
| Chemical compound, drug | Rifampicin | Molekula Ltd | 32609202 | Targets RNA Polymerase |
| Chemical compound, drug | Polymyxin B nonapeptide (PMBN) | Sigma-Aldrich | P2076-5MG | Permeabilises the OM |
| Chemical compound, drug | Tetracycline | Sigma-Aldrich | 87128–25G | Protein synthesis inhibitor |
| Commercial assay or kit | LAL Chromogenic Endotoxin Quantitation Kit | Thermo Scientific Pierce | 88282 | Quantitative assay for LPS |
| Chemical compound, drug | Isopropyl β-d-1-thiogalactopyranoside (IPTG) | Melford Laboratories | MB1008 | Induces gene expression |
| Chemical compound, drug | Lysozyme from chicken egg white | Sigma-Aldrich | L6876-1G | Degrades peptidoglycan |
| Chemical compound, drug | Ethylenediaminetetraacetic acid (EDTA) | Sigma-Aldrich | E6511-100G | Removes OM from bacteria |
| Chemical compound, drug | Trypsin | Sigma-Aldrich | T7309-1G | Degrades proteins |
| Chemical compound, drug | Propidium iodide (PI) | Sigma-Aldrich | P4864-10ML | Fluoresces when bound to DNA |
| Chemical compound, drug | Fluorescein 5 (6)-isothiocyanate | Sigma-Aldrich | 46950–50MG-F | Used to label proteins with a fluorescent tag |
| Chemical compound, drug | N-phenyl-1-napthylamine (NPN) | Acros Organics | 147160250 | Fluoresces when bound to phospholipids |
| Chemical compound, drug | FITC-labelled Poly-L-lysine (PLL) | Sigma-Aldrich | P3543-10MG | Used to measure membrane surface charge |
| Chemical compound, drug | 6-Dodecanoyl-N,N-dimethyl-2-naphthylamine (Laurdan) | Sigma-Aldrich | 40227–100 MG | Used to measure membrane fluidity |
Additional files
-
Supplementary file 1
Contains Supplementary Table 1 detailing the minimum inhibitory concentrations (MICs) of colistin and murepavadin against the P. aeruginosa strains used in this study.
- https://cdn.elifesciences.org/articles/65836/elife-65836-supp1-v2.docx
-
Transparent reporting form
- https://cdn.elifesciences.org/articles/65836/elife-65836-transrepform-v2.docx
Download links
A two-part list of links to download the article, or parts of the article, in various formats.
Downloads (link to download the article as PDF)
Open citations (links to open the citations from this article in various online reference manager services)
Cite this article (links to download the citations from this article in formats compatible with various reference manager tools)
Colistin kills bacteria by targeting lipopolysaccharide in the cytoplasmic membrane
eLife 10:e65836.
https://doi.org/10.7554/eLife.65836


