Reformulation of an extant ATPase active site to mimic ancestral GTPase activity reveals a nucleotide base requirement for function
- Laboratory of Molecular Biology, National Cancer Institute, National Institutes of Health, United States
- National Center for Biotechnology Information, National Library of Medicine, National Institutes of Health, United States
- Department of Bacteriology, University of Wisconsin, United States
- Biophysics Core Facility, National Heart, Lung and Blood Institute, National Institutes of Health, United States
Figures
Figure 1
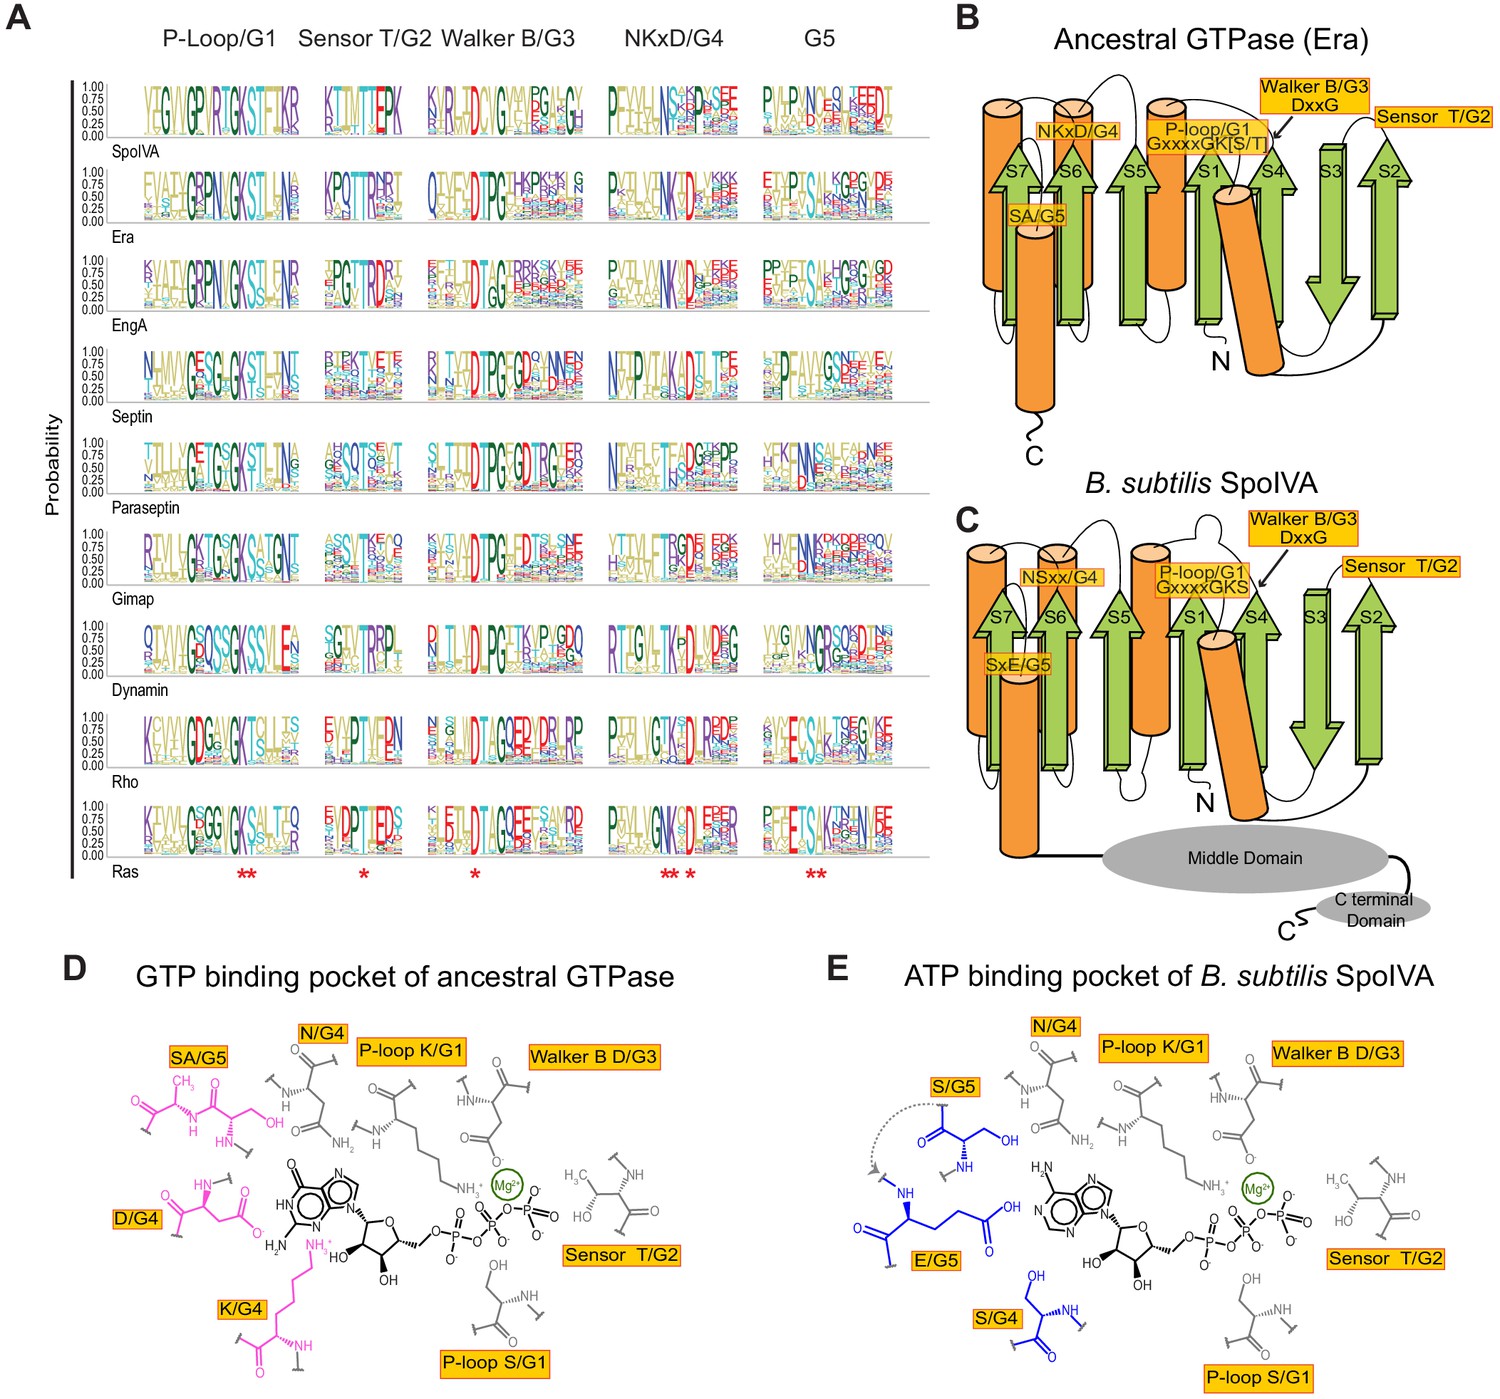
Predicted residues in SpoIVA evolved from an ancestral GTPase to bind ATP.
(A) Sequence logo displaying conservation of amino acid residues in different members of the TRAFAC class of GTPases. Letters represent amino acid abbreviations; height of each letter represents the probability of conservation among orthologs of the indicated protein. Red asterisk below the sequence logo indicates absolute conservation of the amino acid at that position. (B and C) Topological representation of (B) ancestral TRAFAC GTPase or (C) SpoIVA. Motifs in the active site are indicated in yellow; numbering (G1–G5) corresponds to an idealized GTPase (Bourne et al., 1991). N: amino terminus; C: carboxy terminus. β-strands are depicted as green arrows; α-helices are depicted as orange cylinders. Middle and C-terminal domains of SpoIVA are depicted as gray ovals. (D and E) Depiction of the nucleotide-binding pocket of (D) ancestral TRAFAC GTPase bound to GTP or (E) SpoIVA bound to ATP. Residues in the ancestral GTPase that contact the guanine base of GTP are depicted in pink; predicted residues in SpoIVA that may bind the adenine base of ATP are depicted in blue.
Figure 2 with 1 supplement
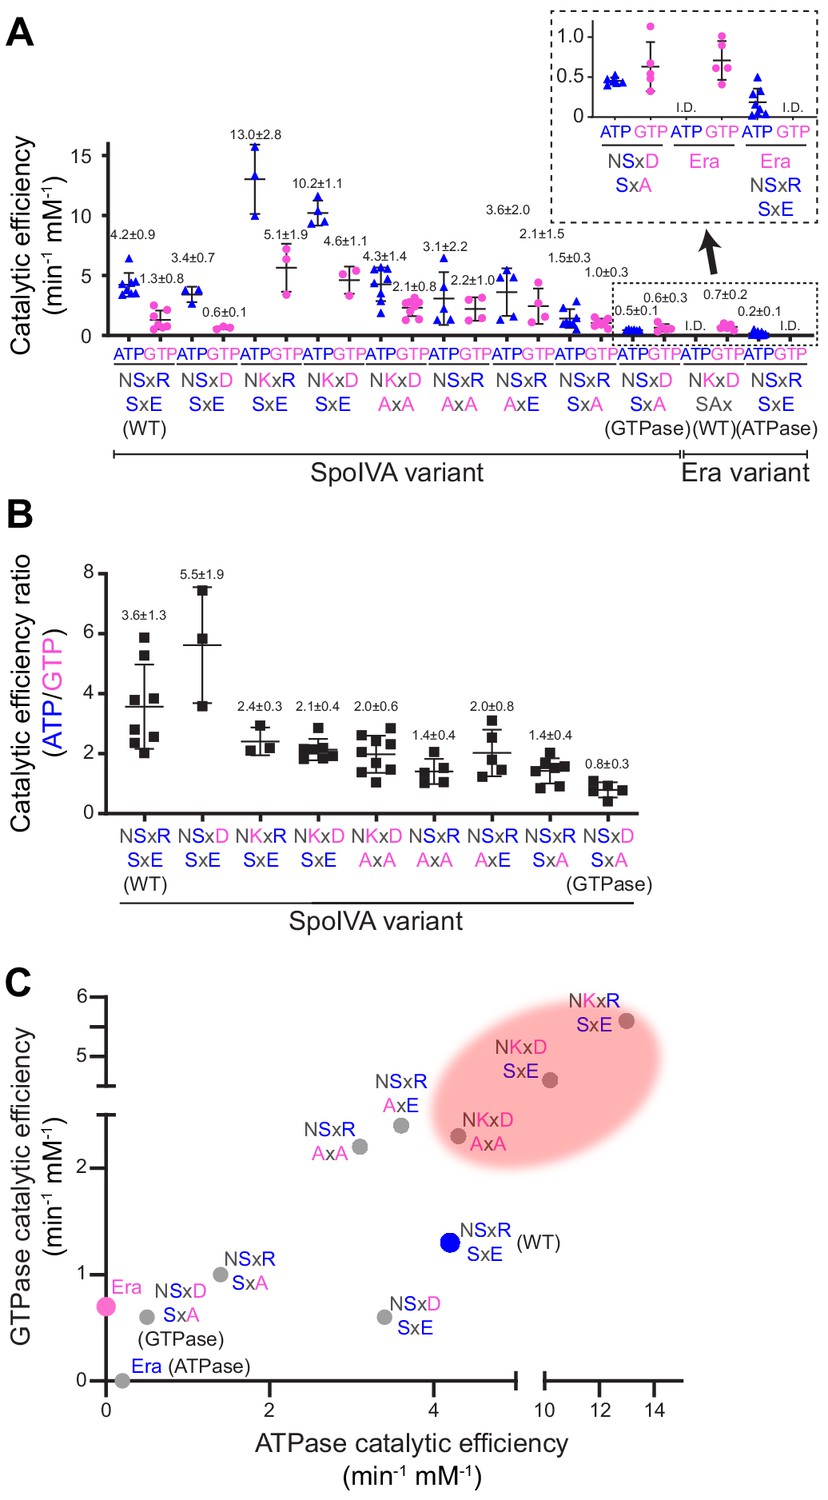
Stepwise restoration of ancestral GTPase activity in SpoIVA using site-directed mutagenesis.
(A) Catalytic efficiencies of ATP (blue triangles) or GTP (pink circles) hydrolysis by different SpoIVA or Era variants, indicated by the amino acids substituted in the degenerate NKxD motif or the SxE motif. Catalytic efficiencies (kcat/Km) were calculated by measuring nucleotide hydrolysis for each SpoIVA or Era variant by increasing nucleotide concentration from 0 to 4 mM to produce saturation curves (Figure 2—figure supplement 1) that revealed the substrate turnover rate (kcat) and nucleotide concentration that produced half-maximal enzymatic activity (Km). Km and kcat values for each variant are reported in Supplementary file 2. Amino acids depicted in blue indicate that the residue was present in the extant (WT) SpoIVA ATPase; those depicted in pink indicate that the residue was altered to mimic the Era GTPase. Each data point represents mean results of an independent assay performed three to four times with one batch of purified protein; bars represent aggregate mean values from all experiments (also stated above each data set); error bars are S.D. Inset: magnification of data sets for the SpoIVAGTPase variant (NSxD, SxA) and Era variants. (B) Ratios of catalytic efficiencies for ATP and GTP hydrolysis by different SpoIVA variants. Data points represent ratios obtained from an independent parallel assay using ATP and GTP; bars represent mean values (also stated above each data set); error bars are S.D. (C) Catalytic efficiencies for GTP hydrolysis in (A) plotted as a function of ATP hydrolysis in (A) for each SpoIVA variant. Red shading indicates parameter space wherein SpoIVA variants are not functional in vivo (as reported in Figure 3, Figure 3—figure supplement 1A).
-
Figure 2—source data 1
Raw data for enzyme kinetics.
- https://cdn.elifesciences.org/articles/65845/elife-65845-fig2-data1-v1.xlsx
Figure 2—figure supplement 1
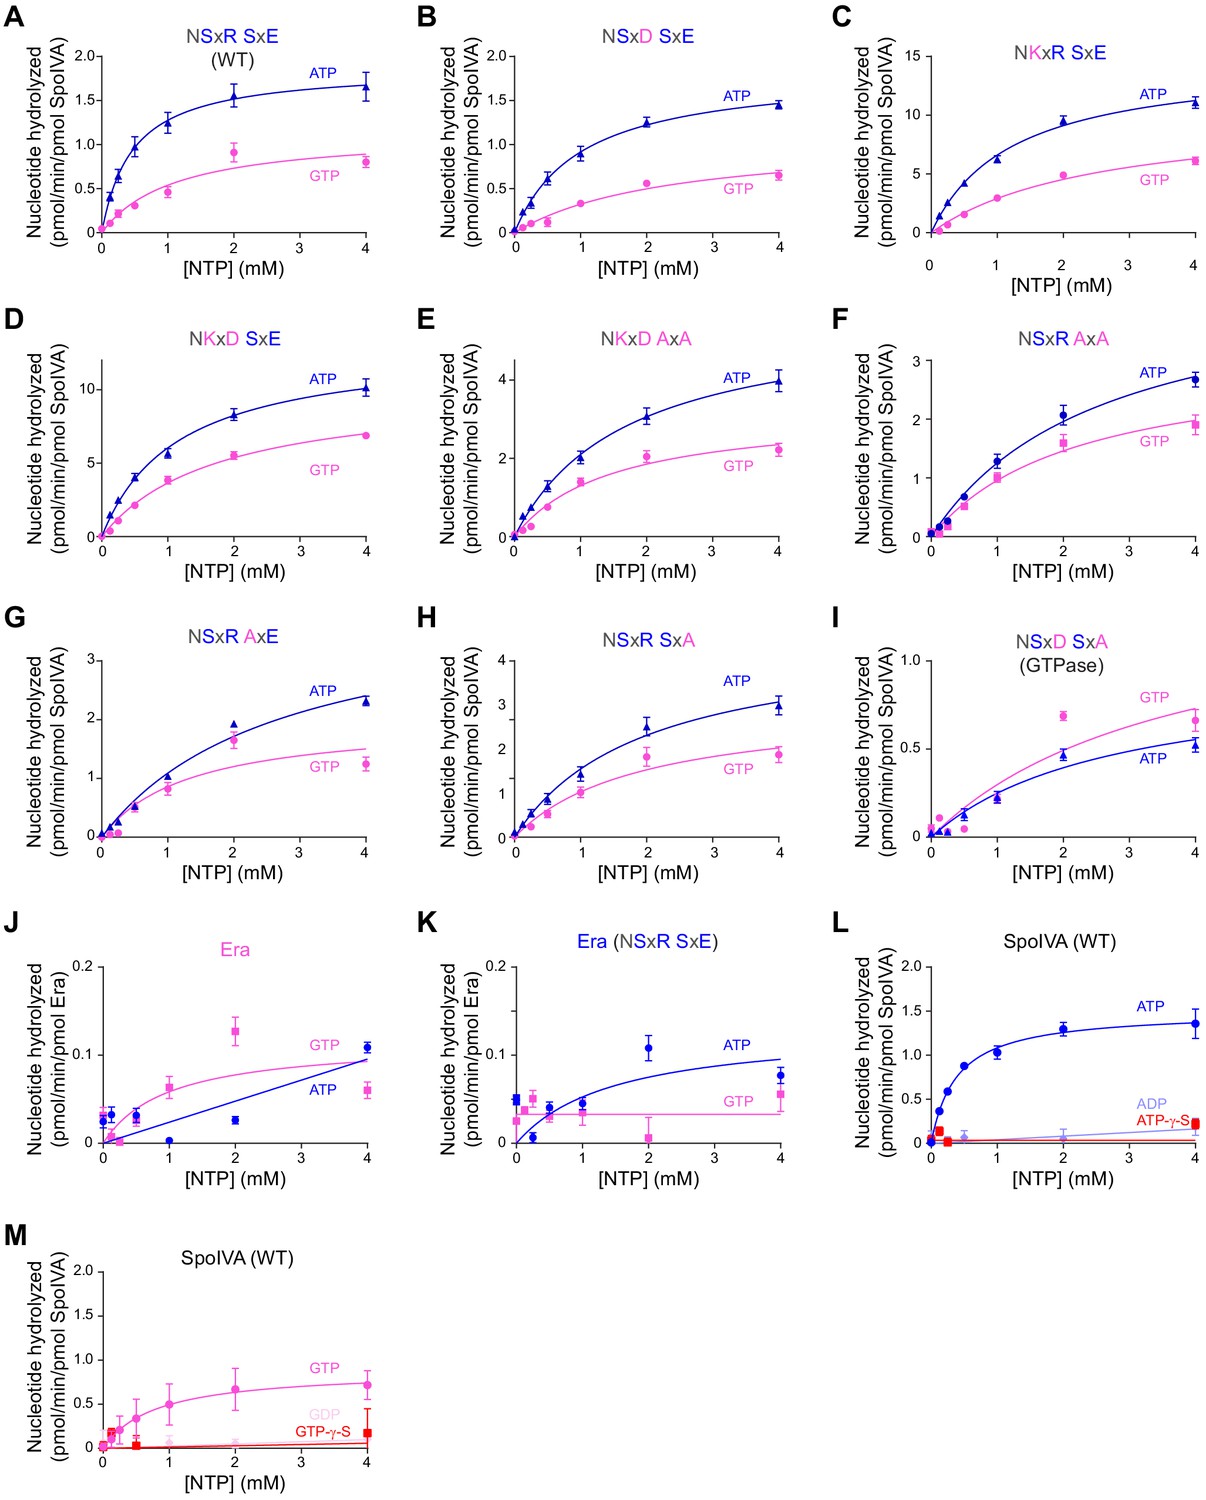
Saturation curves for ATP and GTP hydrolysis by SpoIVA and Era variants.
(A) Purified SpoIVA, (B-I) SpoIVA variants, or (J-K) B. subtilis Era at 0.3 µM protein concentration were incubated with increasing concentrations of ATP (blue triangles) or GTP (pink circles), or (L) ADP or ATP-γ-S, or (M) GDP or GTP-γ-S, and nucleotide hydrolysis was assayed by measuring the generation of free phosphate. Data were fit to the Michaelis–Menten enzyme saturation model and kcat and Km values were calculated. Catalytic efficiencies derived from calculated kcat and Km values represent one data point plotted in Figure 2A and reported in Supplementary file 2. Error bars represent S.D. (n = 3). Reactions with B. subtilis Era contained 1 mM 16S rRNA oligonucleotide fragment (see Materials and methods) to stimulate nucleotide hydrolysis.
Figure 3 with 1 supplement
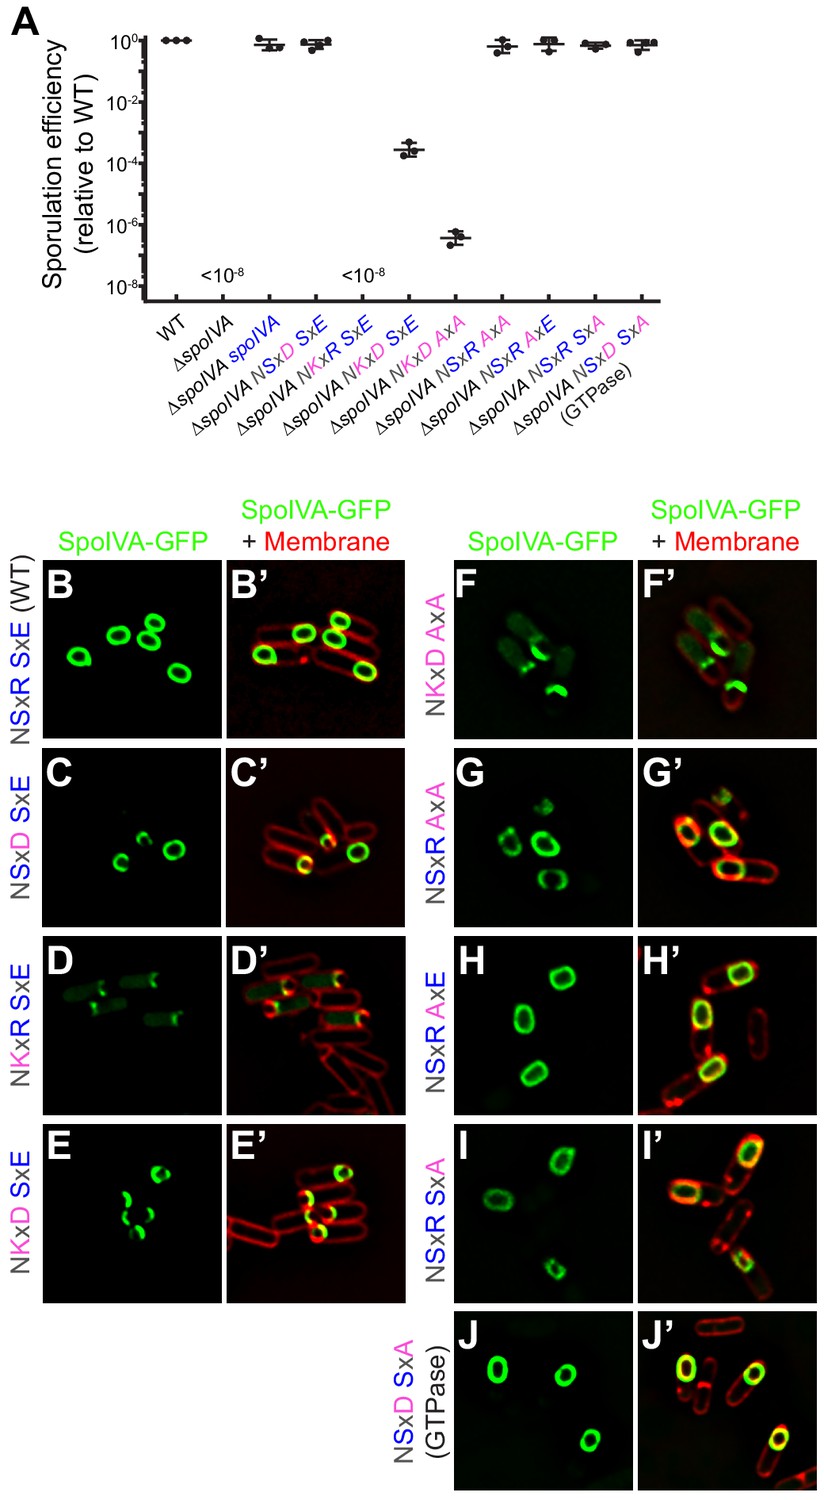
SpoIVAGTPase variant is functional in vivo.
(A) Sporulation efficiencies, relative to WT (PY79) and measured as resistance to 80°C for 20 min, of Bacillus subtilis strains (PY79, KP73, KR394, NG7, NG13, NG8, TU209, TU211, TU212, TU213, and TU223) harboring the indicated allele of spoIVA. Data points represent sporulation efficiencies from independent cultures (n = 3–4); bars indicate mean values; error bars are S.D.; ‘<10−8’ indicates that no heat-resistant spores were recovered. Sporulation efficiencies are listed in Supplementary file 2. (B–J) Fluorescence micrographs of sporulating B. subtilis strains (SL55, JH19, JH20, JH21, TU200, TU201, TU202, TU203, and TU227) harboring the indicated SpoIVA variant fused to green fluorescent protein imaged 3 hr after the onset of sporulation. (B–J) Fluorescence from GFP; (B’–J’) overlay, GFP fluorescence from B to J , respectively, and fluorescence from membranes visualized using FM4-64. Genotypes are listed in Supplementary file 1.
Figure 3—figure supplement 1
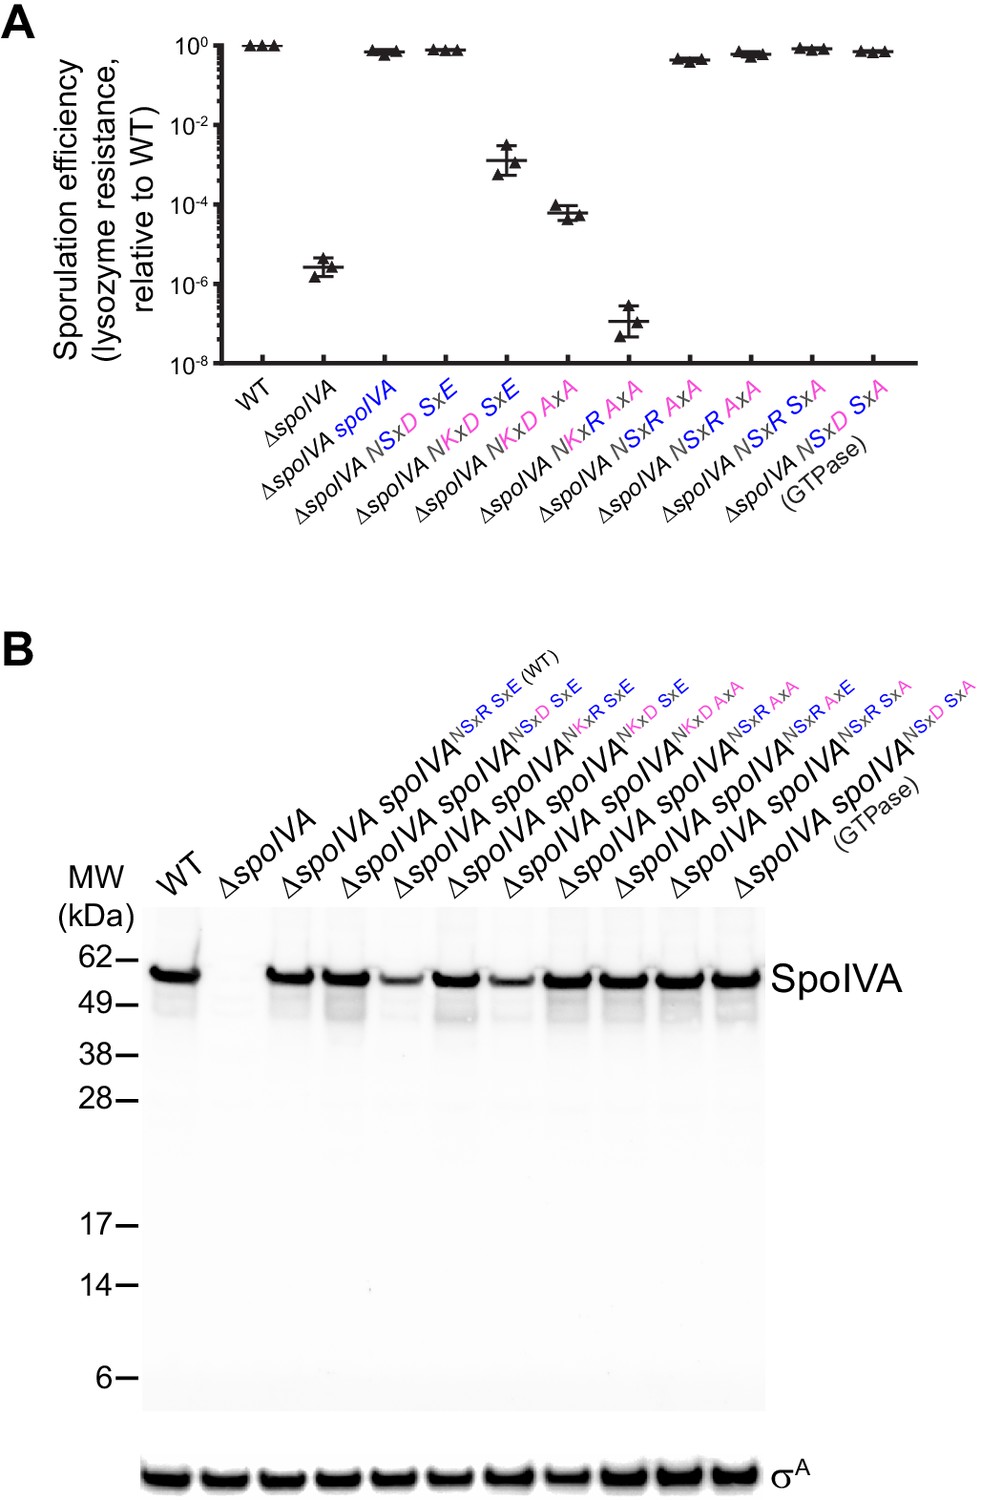
Lysozyme resistance and intracellular accumulation of SpoIVA and SpoIVA variants.
(A) Sporulation efficiencies, relative to WT (PY79) and measured as resistance to 250 µg/ml lysozyme for 1 hr at 37°C, of Bacillus subtilis strains (PY79, KP73, KR394, NG7, NG8, TU209, TU210, TU211, TU212, TU213, and TU223) harboring the indicated allele of spoIVA. (B) Immunoblots of cell extracts harvested from strains of indicated genotype harboring various alleles of spoIVA. Blots probed with antisera raised against purified SpoIVA (top) or σA (bottom, used as a loading control). Migration of molecular weight markers (kDa) indicated on the left. Strains: WT (PY79); ΔspoIVA (KP73); ΔspoIVA, spoIVA (KP394); ΔspoIVA, spoIVANSxD,SxE (NG13); ΔspoIVA, spoIVANKxR,SxE (NG7); ΔspoIVA, spoIVANKxD,SxE (NG8); ΔspoIVA, spoIVANKxD,AxA (TU209); ΔspoIVA, spoIVANSxR,AxA (TU211); ΔspoIVA, spoIVANSxR,AxE (TU212); ΔspoIVA, spoIVANSxR,SxA (TU213); ΔspoIVA, spoIVANSxD SxA (TU223). Genotypes listed in Supplementary file 1.
Figure 4 with 1 supplement
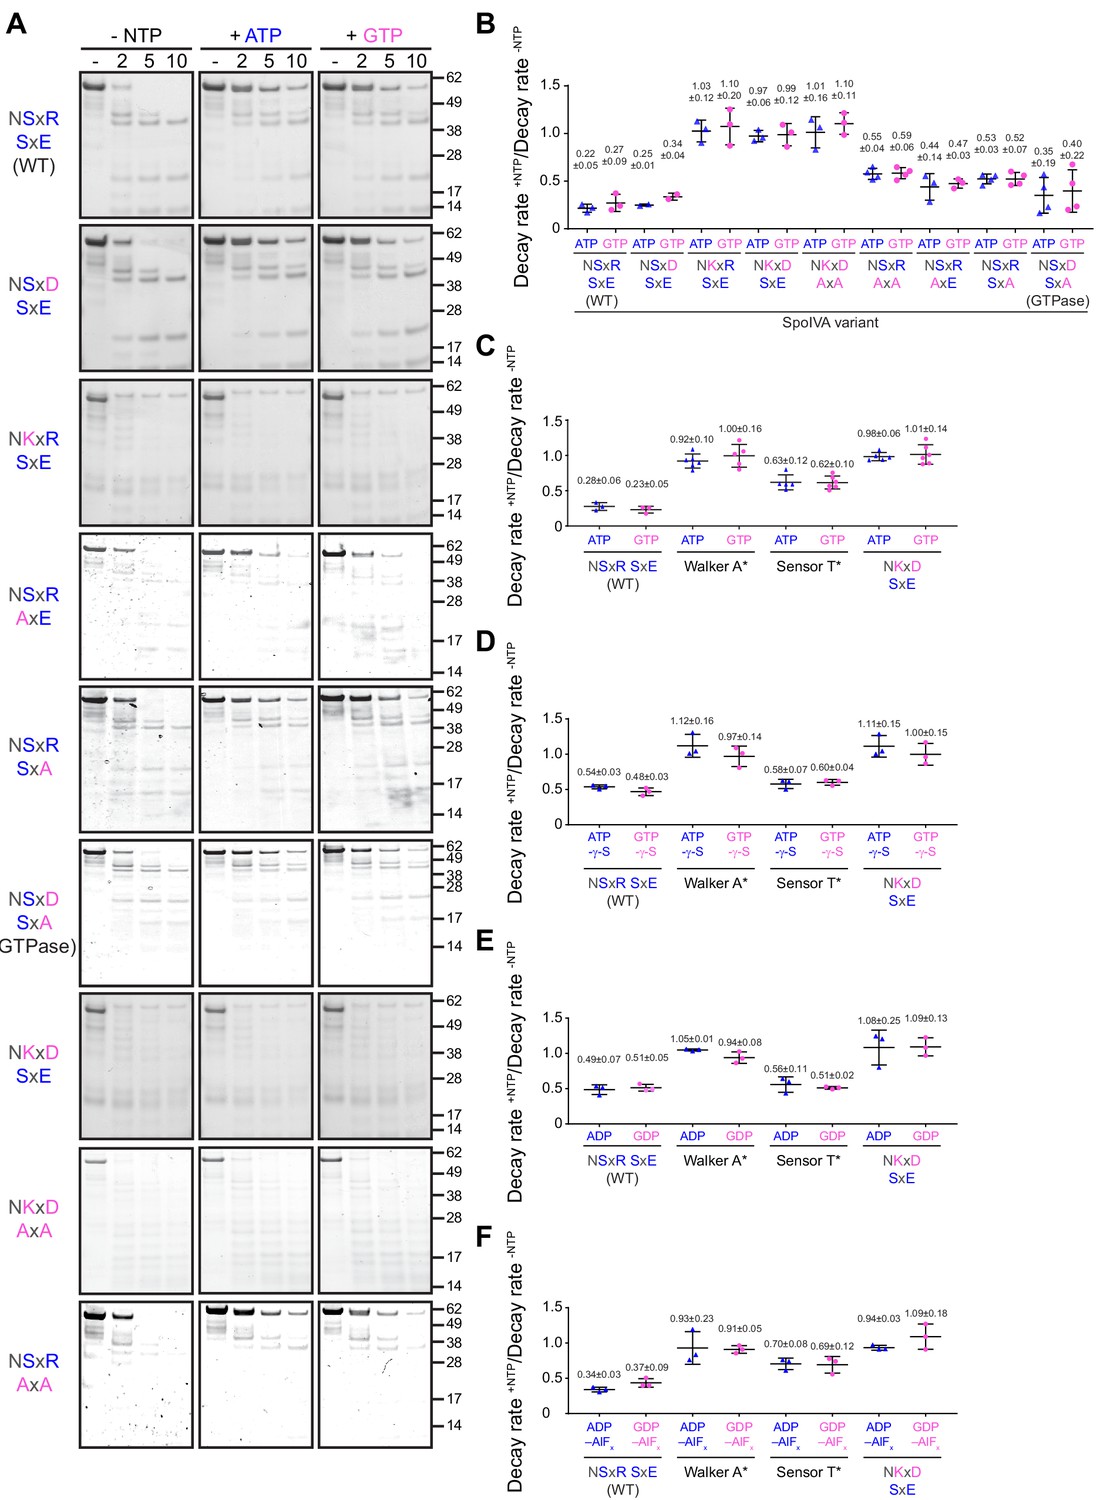
ATP or GTP hydrolysis, but not ADP or GDP binding, drives a conformational change in SpoIVA required for polymerization.
(A) Purified variants of SpoIVA at 2 µM (below the threshold concentration for polymerization) were incubated either in the absence of nucleotide (left panels) or in the presence of ATP (middle) or GTP (right) at 37°C for 4 hr. Reactions were then exposed to limited proteolysis by trypsin for the indicated times (2, 5, or 10 min), after which proteolysis was stopped by addition of SDS sample buffer and the products were analyzed by Coomassie-stained PAGE. Mobility of molecular weight markers (kilodaltons) are indicated to the right. Displayed is a representative image (n = 3–4) (B) Quantification of the disappearance of the full length purified SpoIVA variants in (A) in the presence of ATP (blue triangles) or GTP (pink circles). Rates of decay are reported as a ratio of that in the presence to the absence of nucleotide (Supplementary file 2). (C–F) Quantification of the disappearance of the full length purified SpoIVA variant indicated (WT; Walker A* which does not bind ATP; Sensor T* which binds but does not hydrolyze ATP; NKxD SxE which hydrolyzes ATP at an increased rate) as in (B) in the presence of (C) ATP or GTP; (D) ATP-γ-S or GTP-γ-S; (E) ADP or GDP; or (F) ADP-AlFx or GDP-AlFx. Representative images of Coomassie-stained gels for (C–F) are in Figure 4—figure supplement 1. Data points represent decay rate ratios from independent assays (n = 3–4); bars indicate mean values; error bars are S.D.
Figure 4—figure supplement 1
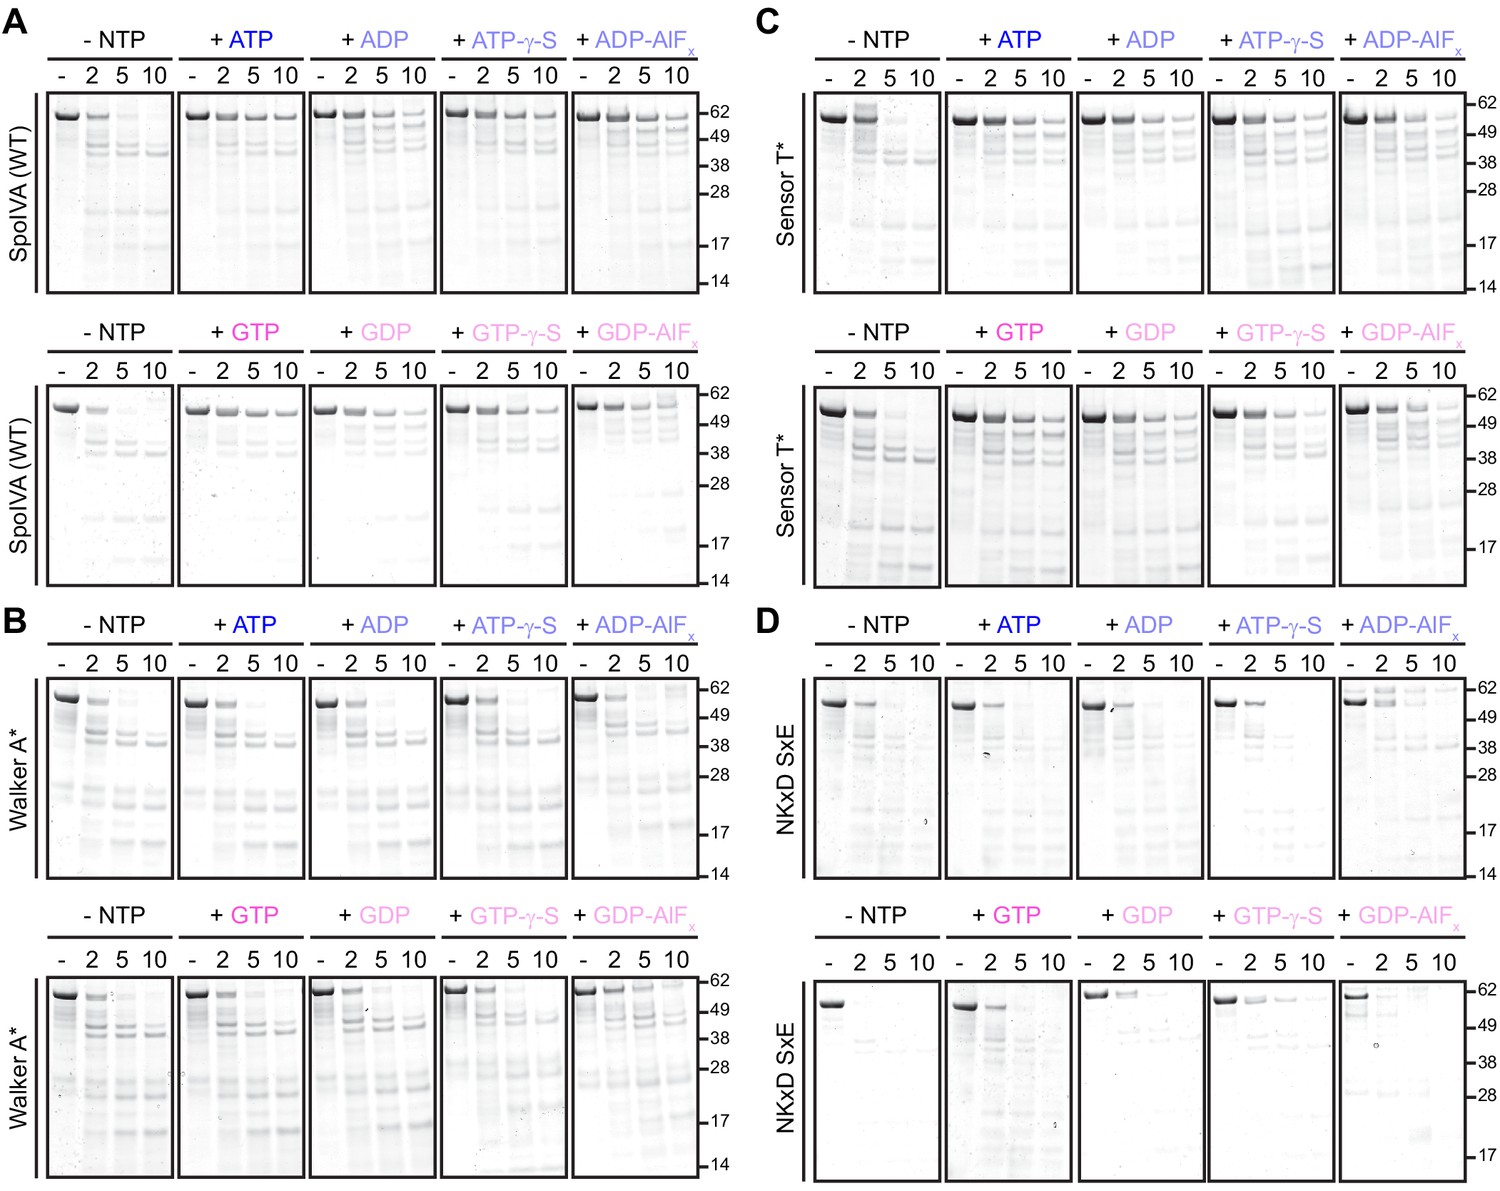
Representative SDS-PAGE images of limited trypsin proteolysis of purified SpoIVA and variants incubated with various nucleotides and nucleotide analogs.
To assess conformational changes, purified (A) SpoIVA, (B) Walker A-disrupted SpoIVA variant (Walker A*, which does not bind ATP), (C) Sensor T-disrupted variant (Sensor T*, which binds, but does not hydrolyze, ATP), or (D) NKxD SxE variant of SpoIVA, at 2 µM (below the threshold concentration for polymerization; Figure 5—figure supplement 1A) were incubated either in the absence of nucleotide (-NTP) or in the presence of ATP, GTP, ATP-, or GTP-γ-S, or ADP- or GDP-AlFx as indicated, at 37°C for 4 hr. Reactions were then exposed to limited proteolysis by trypsin for the indicated times (2, 5, or 10 min), after which proteolysis was stopped by addition of SDS sample buffer and the products were analyzed by Coomassie-stained PAGE. Mobility of molecular weight markers (kDa) are indicated to the right. Displayed is a representative image (n = 3–4).
Figure 5 with 3 supplements
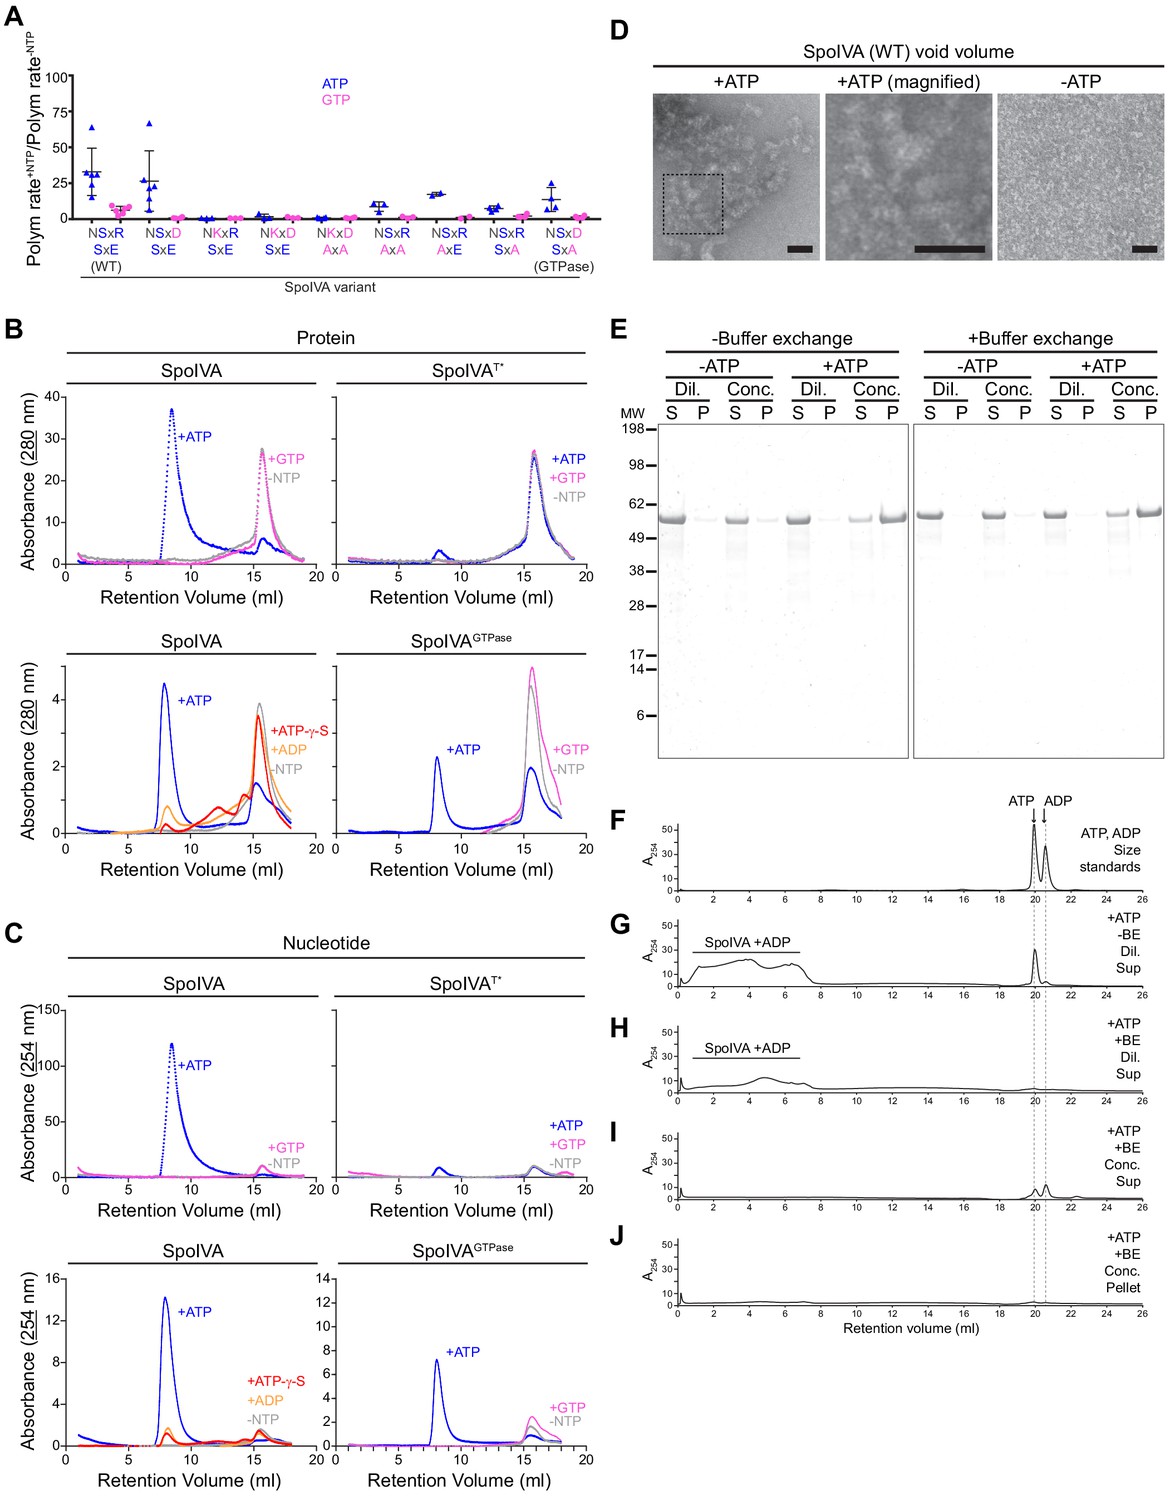
ATP, but not GTP, hydrolysis drives the formation of a functional assembly intermediate that is required for SpoIVA polymerization.
(A) Initial polymerization rates of purified SpoIVA variants (6 µM) as measured by dynamic light scattering reported as a ratio of that in the presence and absence of the indicated nucleotide. Each data point represents a ratio obtained from an independent assay using ATP (blue triangles) or GTP (pink circles); bars represent mean values; error bars are S.D. Polymerization traces are in Figure 5—figure supplement 1 and calculated rates are in Supplementary file 2. (B) Elution profiles of purified WT SpoIVA (top left), SpoIVAT* variant (which binds, but does not hydrolyze, nucleotide; top right [Castaing et al., 2013]), or SpoIVAGTPase (bottom right) that was incubated in the absence of nucleotide (gray), or presence of ATP (blue) or GTP (pink); or WT SpoIVA (bottom left) incubated with ATP-g-S (red) or ADP (orange); and separated by size exclusion chromatography (SEC) and detected using UV light absorbance at 280 nm (which measures aromatic rings in proteins). (C) Elution profiles of the identical experiments in (B) detected using UV light absorbance at 254 nm (which measures nucleotides). Depicted is a single representative experiment that was performed three times. (D) Negative stain transmission electron micrograph of the void volume obtained from SEC of WT SpoIVA in (B) incubated in the presence (left; indicated area shown at higher magnification in center panel) or absence (right) of ATP. Size bars: 50 nm. (E–J) SpoIVA assembly intermediate is functional for polymerization. Purified WT SpoIVA at 2 µM (below the threshold concentration for polymerization; Figure 5—figure supplement 1A) was incubated in the absence or presence of ATP at 37°C for 4 hr. Samples were divided in half and one half was buffer exchanged (‘BE’) to remove free ATP. Samples were then concentrated 20-fold to induce polymerization. Concentrated (‘Conc.’) and dilute (‘Dil.’) samples were then ultracentrifuged to collect polymerized material. (E) Supernatant (S) and resuspended pellet (P) fractions were separated by SDS-PAGE, SpoIVA was detected by Coomassie stain. Relative migration of molecular weight size markers (MW) is indicated to the left. (F–J) Indicated fractions were also separated by size exclusion chromatography and eluted material was detected using UV light absorbance at 254 nm. (F) Migration of ATP and ADP, as indicated. Supernatant fraction of purified SpoIVA incubated with ATP (G) without or (H) with buffer exchange (‘BE’). Elution of SpoIVA bound to ADP in the column void volume is indicated. (I) Supernatant and (J) pellet fractions of purified SpoIVA incubated with ATP, after buffer exchange and concentration to induce polymerization, followed by heat denaturation to extract bound nucleotides (insoluble material was removed by centrifugation prior to loading the column).
-
Figure 5—source data 1
Ion counts for intracellular nucleotide levels.
- https://cdn.elifesciences.org/articles/65845/elife-65845-fig5-data1-v1.zip
Figure 5—figure supplement 1
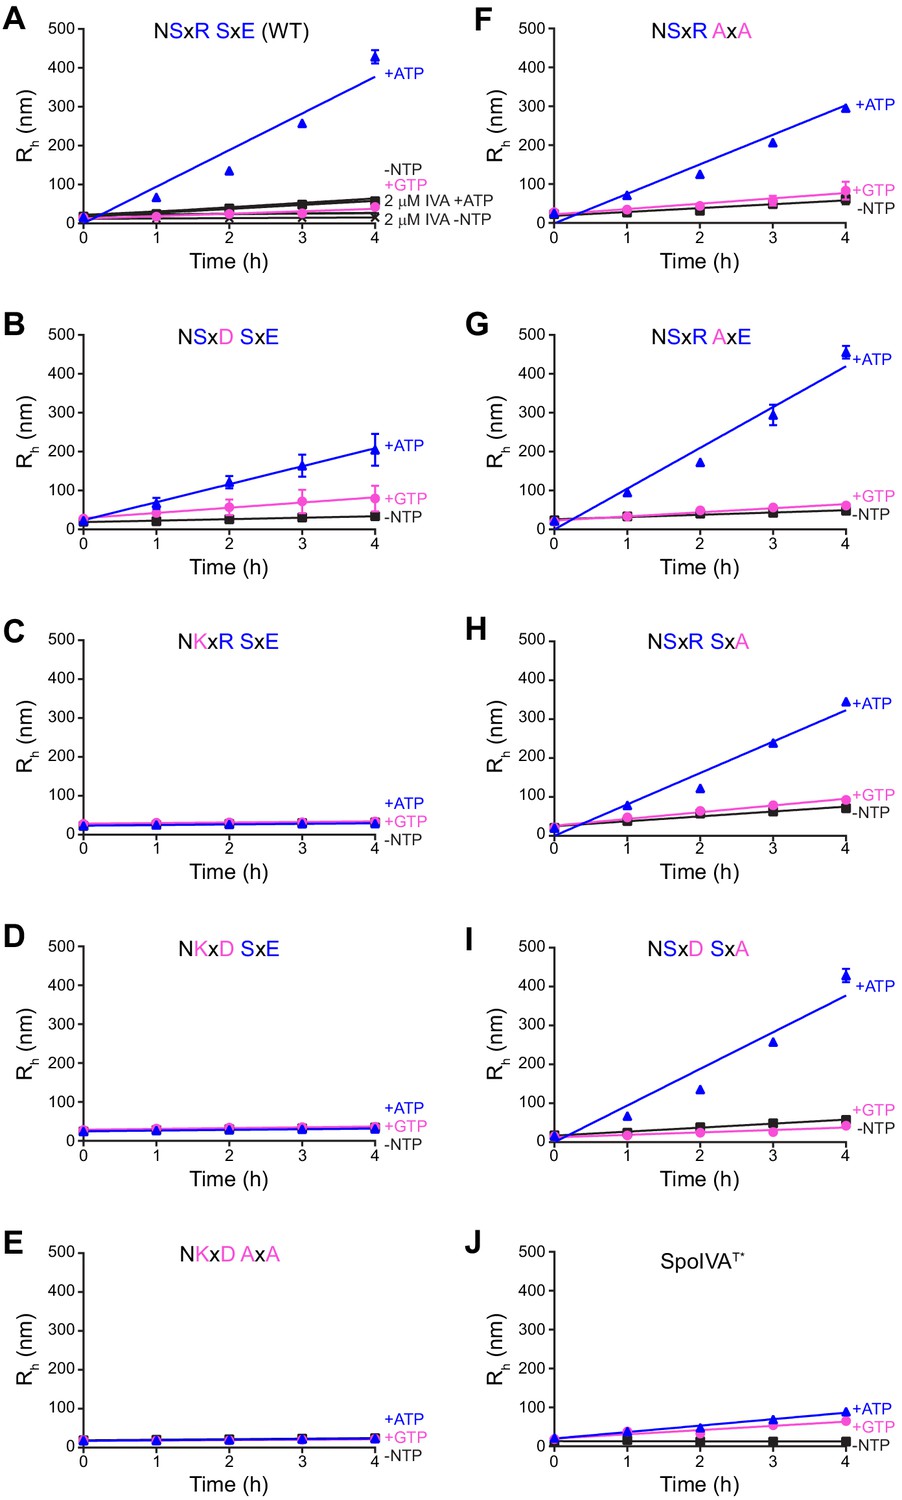
Polymerization kinetics of SpoIVA and SpoIVA variants.
(A–J) Purified SpoIVA (A) or indicated SpoIVA variant (B–J) at 6 µM (or 2 µM as indicated) protein concentration was incubated in the absence (black squares) or presence of ATP (blue triangles) or GTP (pink circles), and the hydrodynamic radius (Rh) was measured using dynamic light scattering at various time points. Data were fit to a linear equation and the initial polymerization rate was calculated by measuring the slope. Data points represent mean values (n = 3); error bars are S.D. The ratio of the calculated polymerization rate for samples with ATP or GTP over no NTP for each curve represents one data point in Figure 5A.
Figure 5—figure supplement 2
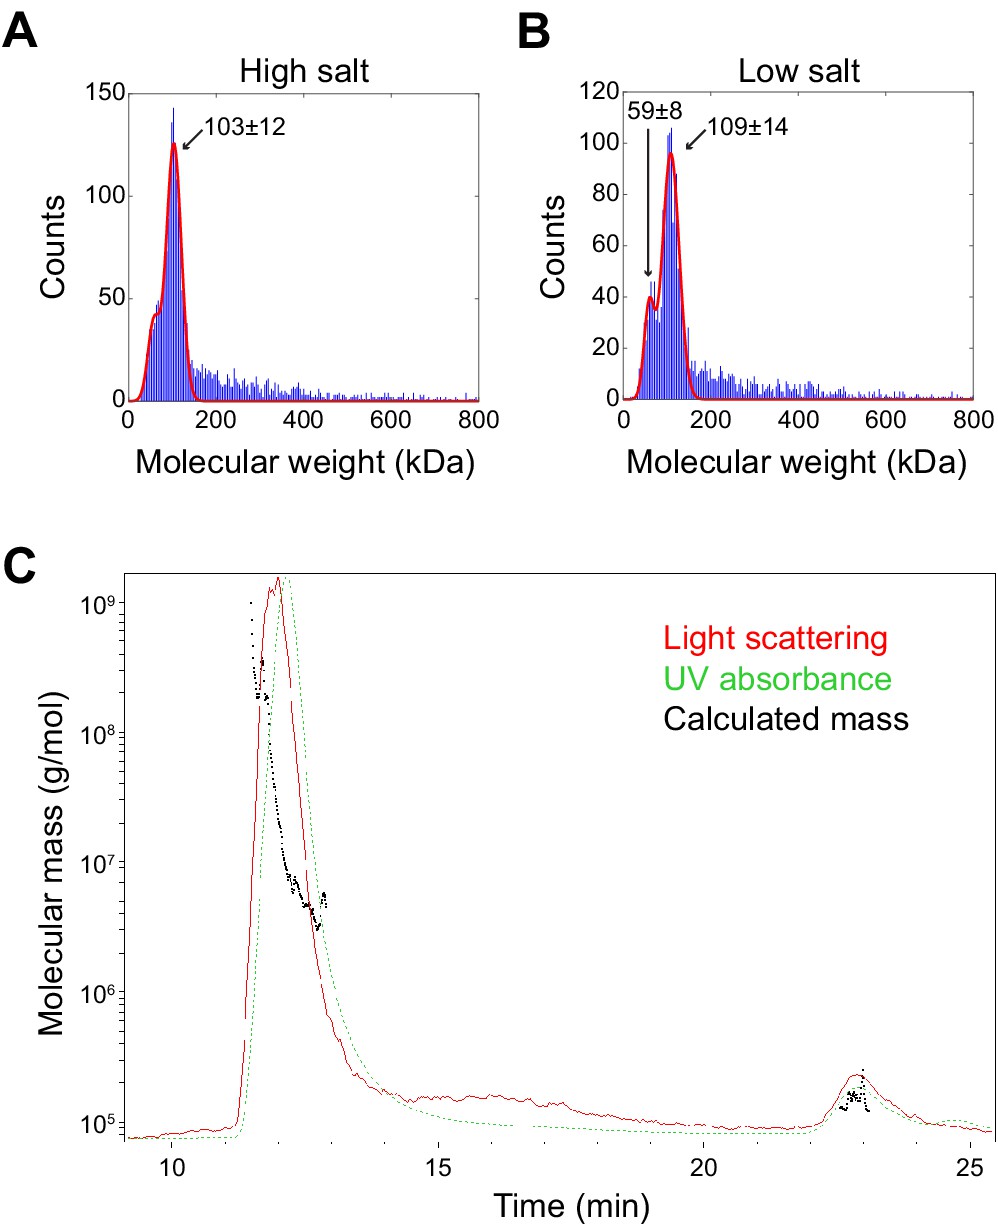
Molecular weight determination of minimal the SpoIVA unit and assembly intermediate.
(A and B) Molecular weight determination of purified SpoIVA in (A) 400 mM NaCl (high salt) or (B) 137 mM NaCl (low salt) using interferometric scattering mass spectrometry (iSCAMS). Predominant peak in high salt corresponds to a species with a molecular weight of 103 ± 12 kDa; two peaks in low salt correspond to molecular weights of 59 ± 8 kDa and 109 ± 14 kDa. (C) Molecular mass determination of high molecular weight SpoIVA assembly intermediate (Figure 5B,C) using size exclusion chromatography with multi-angle light scattering (SEC-MALS).
Figure 5—figure supplement 3
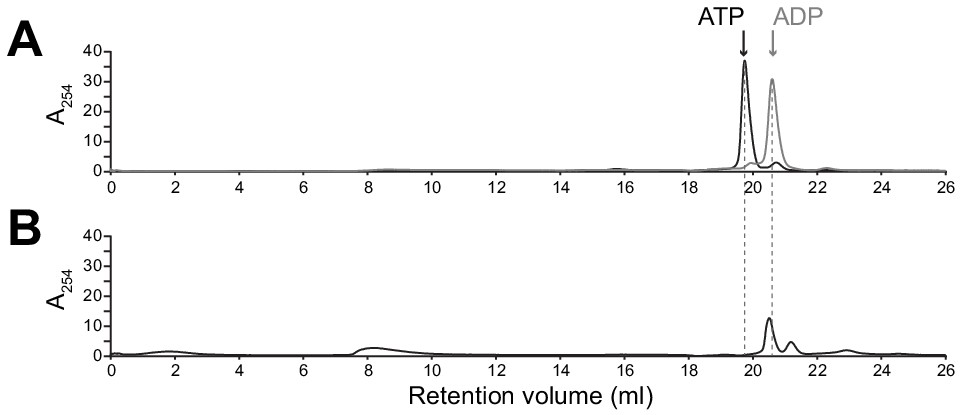
ADP remains bound to SpoIVA assembly intermediate complex.
(A) Migration of purified ATP (black) and ADP (gray) standards, as indicated, separated by size exclusion chromatography (SEC) (Superdex 30, GE Healthcare). (B) Purified WT SpoIVA at 2 µM (below the threshold concentration for polymerization; see Figure 5—figure supplement 1A) was incubated in the presence of ATP at 37°C for 4 hr and separated by SEC (Superose 6, GE Healthcare). Fractions containing the higher molecular weight species (~8–10 ml column void volume, Figure 5B) were combined and incubated at 95°C for 20 min to extract bound nucleotides; protein aggregates were then removed by centrifugation and the resulting supernatant was separated by SEC.
Figure 6

Extant SpoIVA polymerizes more efficiently than the SpoIVAGTPase in the presence of ATP.
(A–D) Extraction of nucleotides from sporulating B. subtilis cultures at various time points and quantification using LC-MS. Quantification of (A) nucleoside triphosphates ATP (blue), GTP (pink), CTP (green), and UTP (red); (B) nucleoside diphosphates ADP (blue), GDP (pink), CDP (green), and UDP (red); (C) nucleoside monophosphates AMP (blue), GMP (pink), CMP (green), and UMP (red); and (D) alarmones ppGpp (orange) and pGpp (green). ‘Pre-induction’ indicates time point immediately prior to induction of sporulation; 0 hr is defined as immediately after sporulation induction. Data points indicate mean (n = 3 independent cultures); error bars are S.E.M. Ion count values are listed in Supplementary file 3. (E) Purified SpoIVA (top two rows) or SpoIVAGTPase (bottom two rows) were incubated with increasing concentrations of either ATP (rows 1 and 3) or GTP (rows 2 and 4) at 37°C for 4 hr and subjected to limited trypsin proteolysis for various lengths of time indicated, and the resulting products were analyzed by Coomassie-stained PAGE as described in Figure 4A. Mobility of molecular weight markers (kilodaltons) are indicated to the right. Displayed is a representative experiment (n = 3–5). (F) Quantification of the disappearance of the full length purified SpoIVA variants in (E) in the presence of ATP (blue triangles) or GTP (pink circles). Rates of decay are reported as a ratio of that in the presence over the absence of nucleotide. Each point represents an independent experiment (n = 3–5). (G) Initial polymerization rates of purified SpoIVA variants (6 µM) as measured by dynamic light scattering reported as a ratio of that in the presence (4 mM, 1.5 mM, or 0.06 mM ATP) over the absence of ATP. Each data point represents a ratio obtained from independent assays (n = 3) in the presence and absence of ATP; bars represent mean values; error bars are S.D.
Figure 7
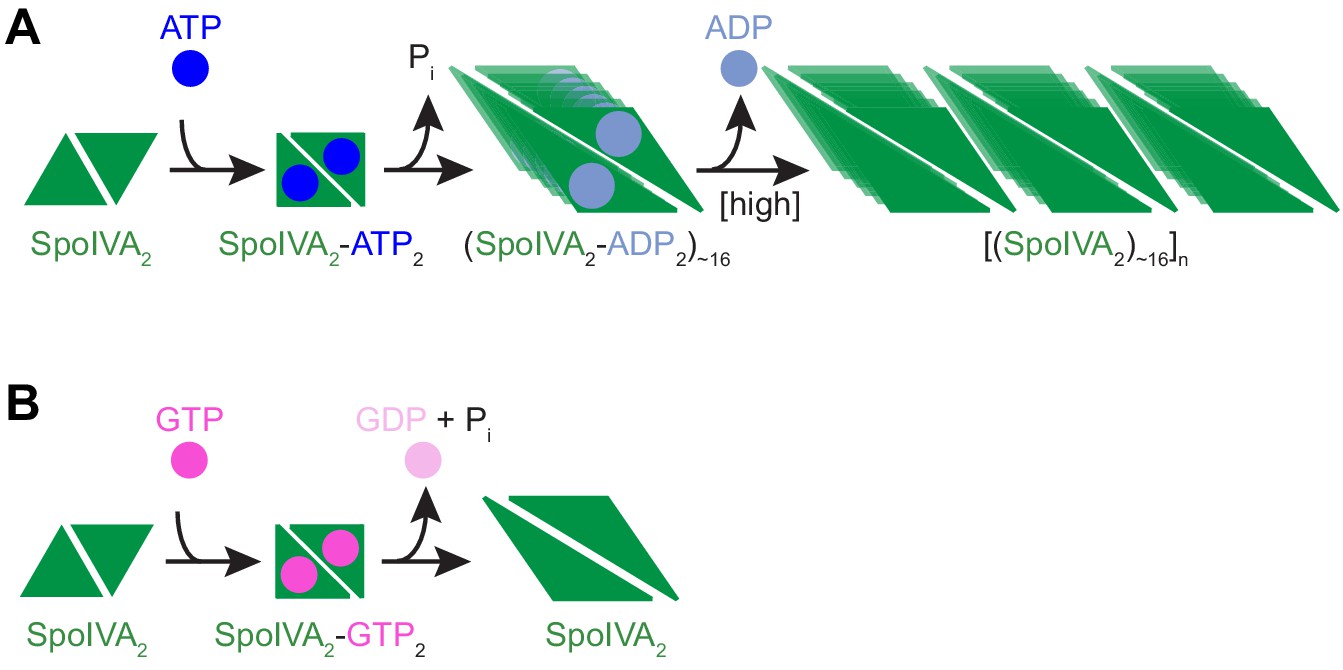
Model for the nucleotide-specific polymerization of SpoIVA.
(A) Depicted is a SpoIVA dimer (green equilateral triangles; Figure 5—figure supplement 2A,B) that binds to ATP, resulting in a conformational change. Hydrolysis of the bound ATP (Figure 2—figure supplement 1A) drives a second conformational change in SpoIVA (Figures 4A and 6E). The inorganic phosphate is released (Castaing et al., 2013), but the ADP remains bound temporarily (Figure 5—figure supplement 3), which we propose mediates multimerization of SpoIVA to form an assembly intermediate (Figures 5B,C and Figure 5—figure supplement 2C). At high enough concentration of SpoIVA, the ADP is released as SpoIVA multimers form static polymers (Figure 5E–J). (B) In the presence of high concentration of GTP, GTP hydrolysis by SpoIVA drives a conformational change in the protein similar to that observed in the presence of ATP (Figure 4A). However, GDP is prematurely released, SpoIVA fails to form the assembly intermediate (Figure 5B,C), and thus SpoIVA polymerization does not occur (Figures 5A and Figure 5—figure supplement 1A).
Tables
Key resources table
| Reagent type (species) or resource | Designation | Source or reference | Identifiers | Additional information |
|---|---|---|---|---|
| Strain, strain background (Bacillus subtilis) | PY79 | Youngman et al., 1984 | Wild type | |
| Strain, strain background (Bacillus subtilis) | KP73 | Price and Losick, 1999 | ∆spoIVA::neo | |
| Strain, strain background (Bacillus subtilis) | KR394 | Ramamurthi and Losick, 2008 | ∆spoIVA::neo thrC::spoIVA spec | |
| Strain, strain background (Bacillus subtilis) | NG7 | This paper, Figure 3, Figure 3—figure supplement 1, Supplementary file 1 | ∆spoIVA::neo thrC::spoIVAS189K spec | |
| Strain, strain background (Bacillus subtilis) | NG13 | This paper, Figure 3, Figure 3—figure supplement 1, Supplementary file 1 | ∆spoIVA::neo thrC::spoIVAR191D spec | |
| Strain, strain background (Bacillus subtilis) | NG8 | This paper, Figure 3, Figure 3—figure supplement 1, Supplementary file 1 | ∆spoIVA::neo thrC::spoIVAS189K, R191D spec | |
| Strain, strain background (Bacillus subtilis) | TU209 | This paper, Figure 3, Figure 3—figure supplement 1, Supplementary file 1 | ∆spoIVA::neo thrC::spoIVAS189K, R191D, S216A, E218A spec | |
| Strain, strain background (Bacillus subtilis) | TU210 | This paper, Figure 3—figure supplement 1 | ∆spoIVA::neo thrC::spoIVAS189K, S216A, E218A spec | |
| Strain, strain background (Bacillus subtilis) | TU211 | This paper, Figure 3, Figure 3—figure supplement 1, Supplementary file 1 | ∆spoIVA::neo thrC::spoIVAS216A, E218A spec | |
| Strain, strain background (Bacillus subtilis) | TU212 | This paper, Figure 3, Figure 3—figure supplement 1, Supplementary file 1 | ∆spoIVA::neo thrC::spoIVAS216A spec | |
| Strain, strain background (Bacillus subtilis) | TU213 | This paper, Figure 3, Figure 3—figure supplement 1, Supplementary file 1 | ∆spoIVA::neo thrC::spoIVAE218A spec | |
| Strain, strain background (Bacillus subtilis) | TU223 | This paper, Figure 3, Figure 3—figure supplement 1, Supplementary file 1 | ∆spoIVA::neo thrC::spoIVAR191D, E218A spec | |
| Strain, strain background (Bacillus subtilis) | SL55 | This paper, Figure 3 Supplementary file 1 | ∆spoIVA::neo thrC::GFP-spoIVA spec ∆amyE::spoIVA cat | |
| Strain, strain background (Bacillus subtilis) | JH19 | This paper, Figure 3 Supplementary file 1 | ∆spoIVA::neo thrC::GFP-spoIVAS189K spec ∆amyE::spoIVAS189K cat | |
| Strain, strain background (Bacillus subtilis) | JH20 | This paper, Figure 3 Supplementary file 1 | ∆spoIVA::neo thrC::GFP-spoIVAR191D spec ∆amyE::spoIVAR191D cat | |
| Strain, strain background (Bacillus subtilis) | TU200 | This paper, Figure 3 Supplementary file 1 | ∆spoIVA::neo thrC::GFP-spoIVAS189K, R191D, S216A, E128A spec ∆amyE::spoIVAS189K, R191D, S216A, E218Acat | |
| Strain, strain background (Bacillus subtilis) | TU201 | This paper, Figure 3 Supplementary file 1 | ∆spoIVA::neo thrC::GFP-spoIVAS216A, E218Aspec ∆amyE::spoIVAS216A, E218A cat | |
| Strain, strain background (Bacillus subtilis) | TU202 | This paper, Figure 3 Supplementary file 1 | ∆spoIVA::neo thrC::GFP-spoIVAS216Aspec ∆amyE::spoIVAS216A cat | |
| Strain, strain background (Bacillus subtilis) | TU203 | This paper, Figure 3 Supplementary file 1 | ∆spoIVA::neo thrC::GFP-spoIVAE218A spec ∆amyE::spoIVAE218A cat | |
| Strain, strain background (Bacillus subtilis) | TU227 | This paper, Figure 3 Supplementary file 1 | ∆spoIVA::neo thrC::GFP-spoIVAR191D, E218A spec ∆amyE::spoIVAR191D, E218A cat | |
| Commercial assay or kit | Malachite Green Phosphate Assay Kit | BioAssay Systems | POMG-25H | |
| Antibody | Rabbit polyclonal anti-SpoIVA | Ramamurthi lab | Raised against purified B. subtilis His6-SpoIVA (1:20,000) | |
| Antibody | Rabbit polyclonal anti-SigA | Ramamurthi lab | Raised against purified B. subtilis SigA (1:50,000) |
Additional files
-
Source data 1
Summary of calculated data for in vitro assays.
- https://cdn.elifesciences.org/articles/65845/elife-65845-data1-v1.xlsx
-
Supplementary file 1
Bacillus subtilis strains used in this study.
- https://cdn.elifesciences.org/articles/65845/elife-65845-supp1-v1.docx
-
Supplementary file 2
Summary of results from in vitro and in vivo assays performed with various SpoIVA variants.
For subcellular localization data, ‘+' indicates forespore localization pattern qualitatively similar to wild-type GFP-SpoIVA; ‘-' indicates mis-localization. Errors are S.D.
- https://cdn.elifesciences.org/articles/65845/elife-65845-supp2-v1.docx
-
Supplementary file 3
Nucleotide levels (ion counts) at indicated time points after induction of sporulation in B. subtilis via resuspension method.
0 hr time point indicates time of sporulation induction by resuspension; pre-induction is immediately prior to resuspension. Errors are S.D.
- https://cdn.elifesciences.org/articles/65845/elife-65845-supp3-v1.docx
-
Transparent reporting form
- https://cdn.elifesciences.org/articles/65845/elife-65845-transrepform-v1.docx
Download links
A two-part list of links to download the article, or parts of the article, in various formats.
Downloads (link to download the article as PDF)
Open citations (links to open the citations from this article in various online reference manager services)
Cite this article (links to download the citations from this article in formats compatible with various reference manager tools)
Reformulation of an extant ATPase active site to mimic ancestral GTPase activity reveals a nucleotide base requirement for function
eLife 10:e65845.
https://doi.org/10.7554/eLife.65845


