CRISPR-based functional genomics in human dendritic cells
- Department of Cellular and Molecular Pharmacology, University of California, San Francisco, United States
- Howard Hughes Medical Institute, University of California, San Francisco, United States
- California Institute for Quantitative Biosciences, University of California, San Francisco, United States
- Department of Microbiology and Immunology, University of California, San Francisco, United States
- Department of Bioengineering, Stanford University, United States
- ChEM-H, Stanford University, United States
- Whitehead Institute for Biomedical Research, United States
- Chan Zuckerberg Biohub, United States
- Department of Biology, Massachusetts Institute of Technology, United States
Figures
Figure 1 with 5 supplements
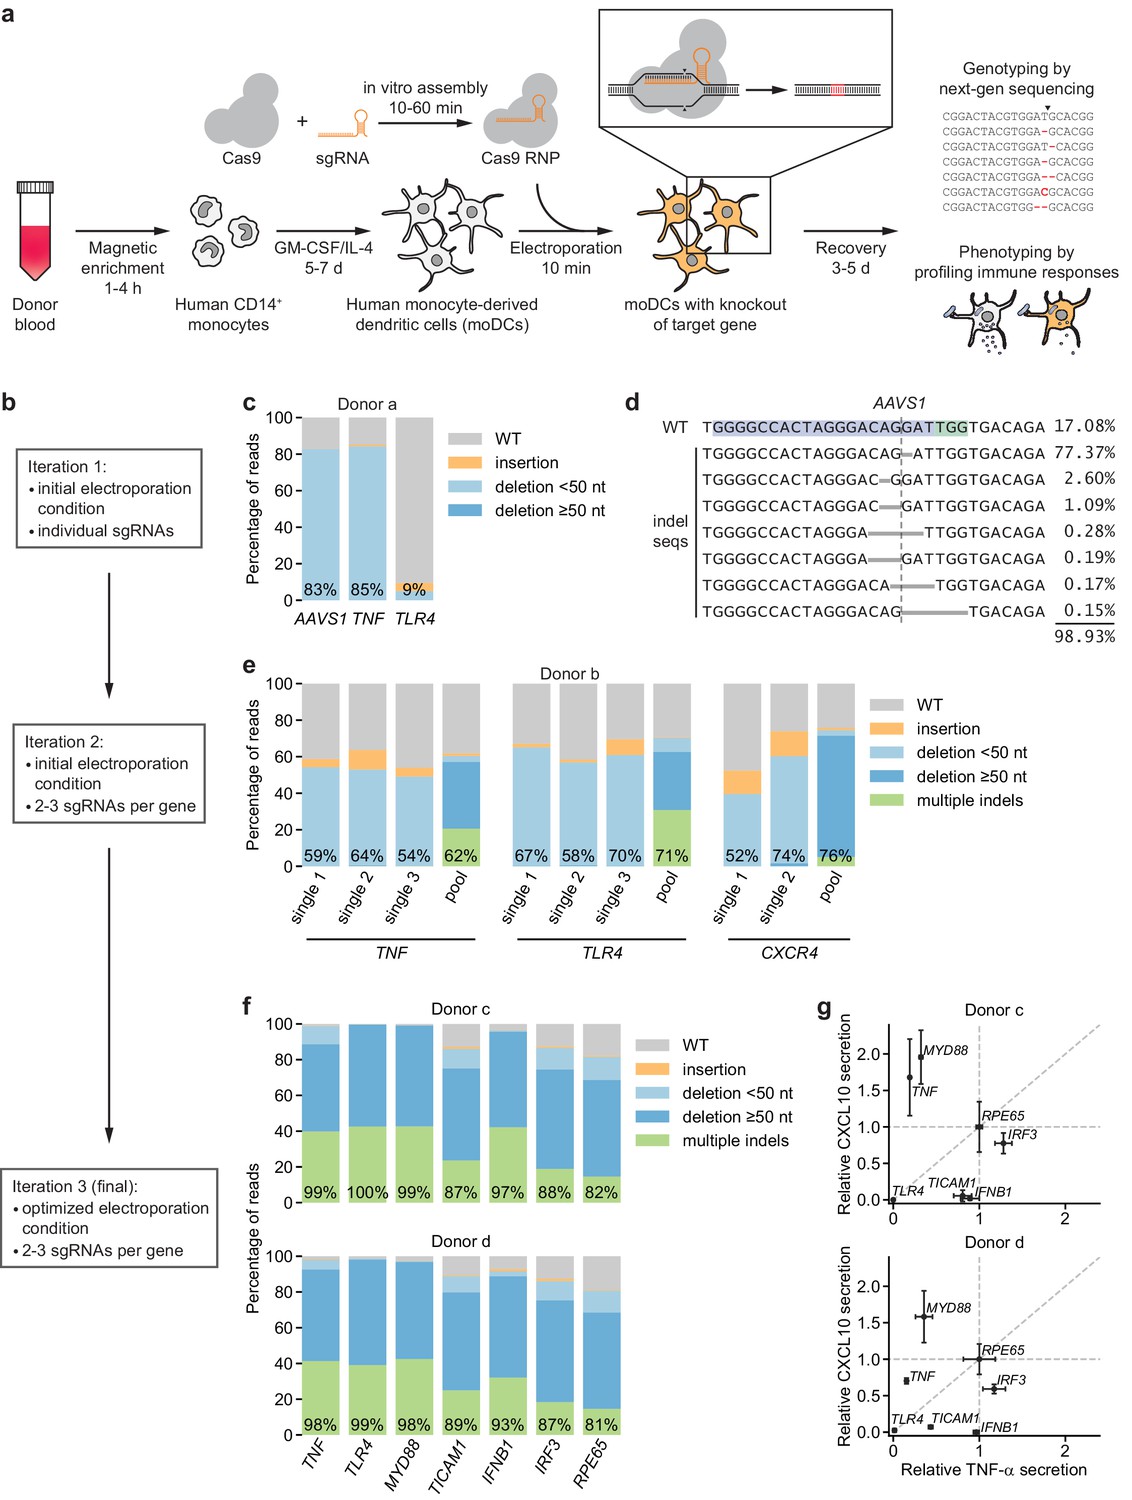
CRISPR/Cas9-based strategy for gene knockout in human moDCs.
(a) Schematic outline of the strategy. (b) Flow chart delineating optimization. (c) Percentage of genomic DNA reads assigned to different classes of outcomes after targeting each locus with Cas9 RNPs in condition P1, CB-150. Labeled values indicate total percentage of reads with a non-WT sequence. (d) Individual editing outcomes at the AAVS1 locus accounting for at least 0.15% of on-target reads. Horizontal gray bars denote deletions. Vertical dashed line denotes Cas9 cut site. (e) Outcome classification, as in (c), after targeting indicated loci with single or multi-sgRNA Cas9 RNPs. (f) Outcome classification, as in (c), after targeting seven loci with multi-sgRNA Cas9 RNPs in moDCs from two independent donors. (g) Production of TNF-α and CXCL10 by knockout moDCs challenged with 100 ng/mL E. coli O55 LPS, normalized to cell numbers and to cytokine production in moDCs with knockout of RPE65. Data represent mean and standard deviation of two independent treatments for both TNF-α and CXCL10 levels. See also Figure 1—figure supplement 1, Figure 1—figure supplement 2, Figure 1—figure supplement 3, Figure 1—figure supplement 4, and Figure 1—figure supplement 5.
Figure 1—figure supplement 1
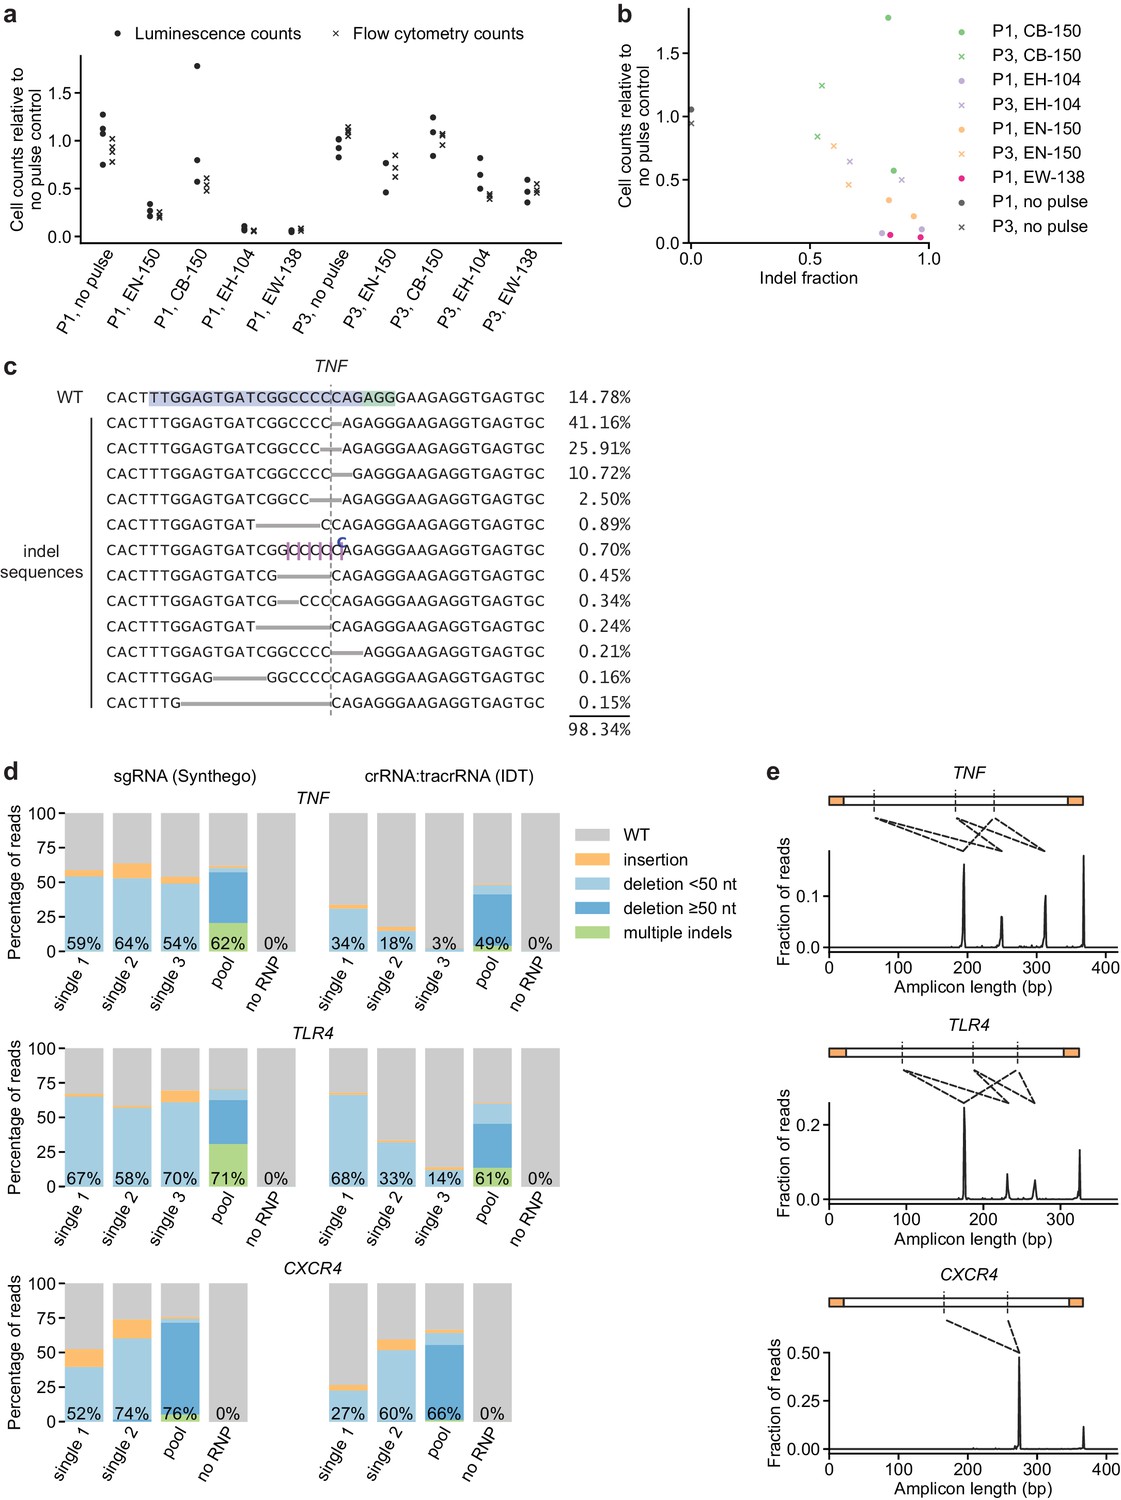
Additional characterization of initial conditions for moDC genome editing strategy.
(a) Cell counts relative to no pulse control cells determined by two methods 3 days (flow cytometry) or 5 days (luminescence) after electroporation of moDCs in indicated conditions. (b) Comparison of indel fraction and cell counts measured in different electroporation conditions, identifying condition P1, CB-150 as a condition with low toxicity and high editing efficiency. (c) Individual editing outcomes at the TNF locus accounting for at least 0.15% of on-target reads after editing in condition P1, CB-150. Horizontal gray bars denote deletions. Vertical dashed line denotes Cas9 cut site. Superscripted bases denote insertions. Due to the presence of a C homopolymer at the cut site, the location of some short deletions and insertions cannot be unambiguously inferred; the most likely location is denoted. (d) Percentage of genomic DNA reads assigned to different classes of outcomes after targeting each locus with single or multi-sgRNA Cas9 RNPs in condition P1, CB-150. Cas9 RNPs were formed either with sgRNAs (left) or crRNA:tracrRNA complexes (right). Labeled values indicate total percentage of reads with a non-WT sequence. (e) Distribution of amplicon lengths for moDCs electroporated with multi-sgRNA Cas9 RNPs (in the sgRNA format). Observed amplicons correspond to deletions of regions between sgRNA cut sites, as indicated by the diagrams. Amplicons are depicted with the primer binding sequences in orange and sgRNA cut sites as vertical dashed lines.
Figure 1—figure supplement 2
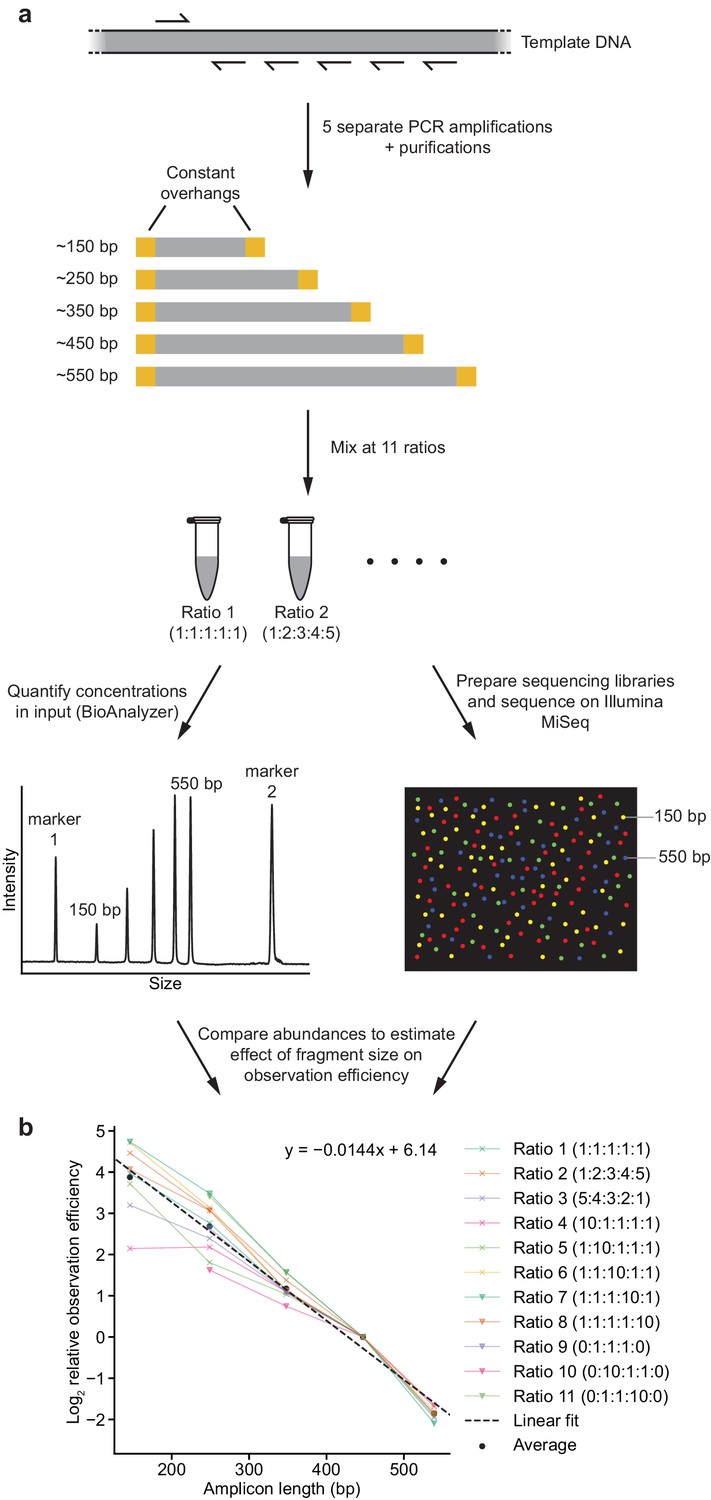
Strategy to measure effect of amplicon size on observation (amplification + sequencing) efficiency.
(a) Schematic outline of strategy. See Materials and methods for details. (b) Comparison of calculated observation efficiencies and fragment size for each fragment with each of the 11 reaction ratios. Dotted line represents fit derived from a linear regression, with coefficients indicated.
Figure 1—figure supplement 3
Identification of an optimal electroporation condition for moDC genome editing.
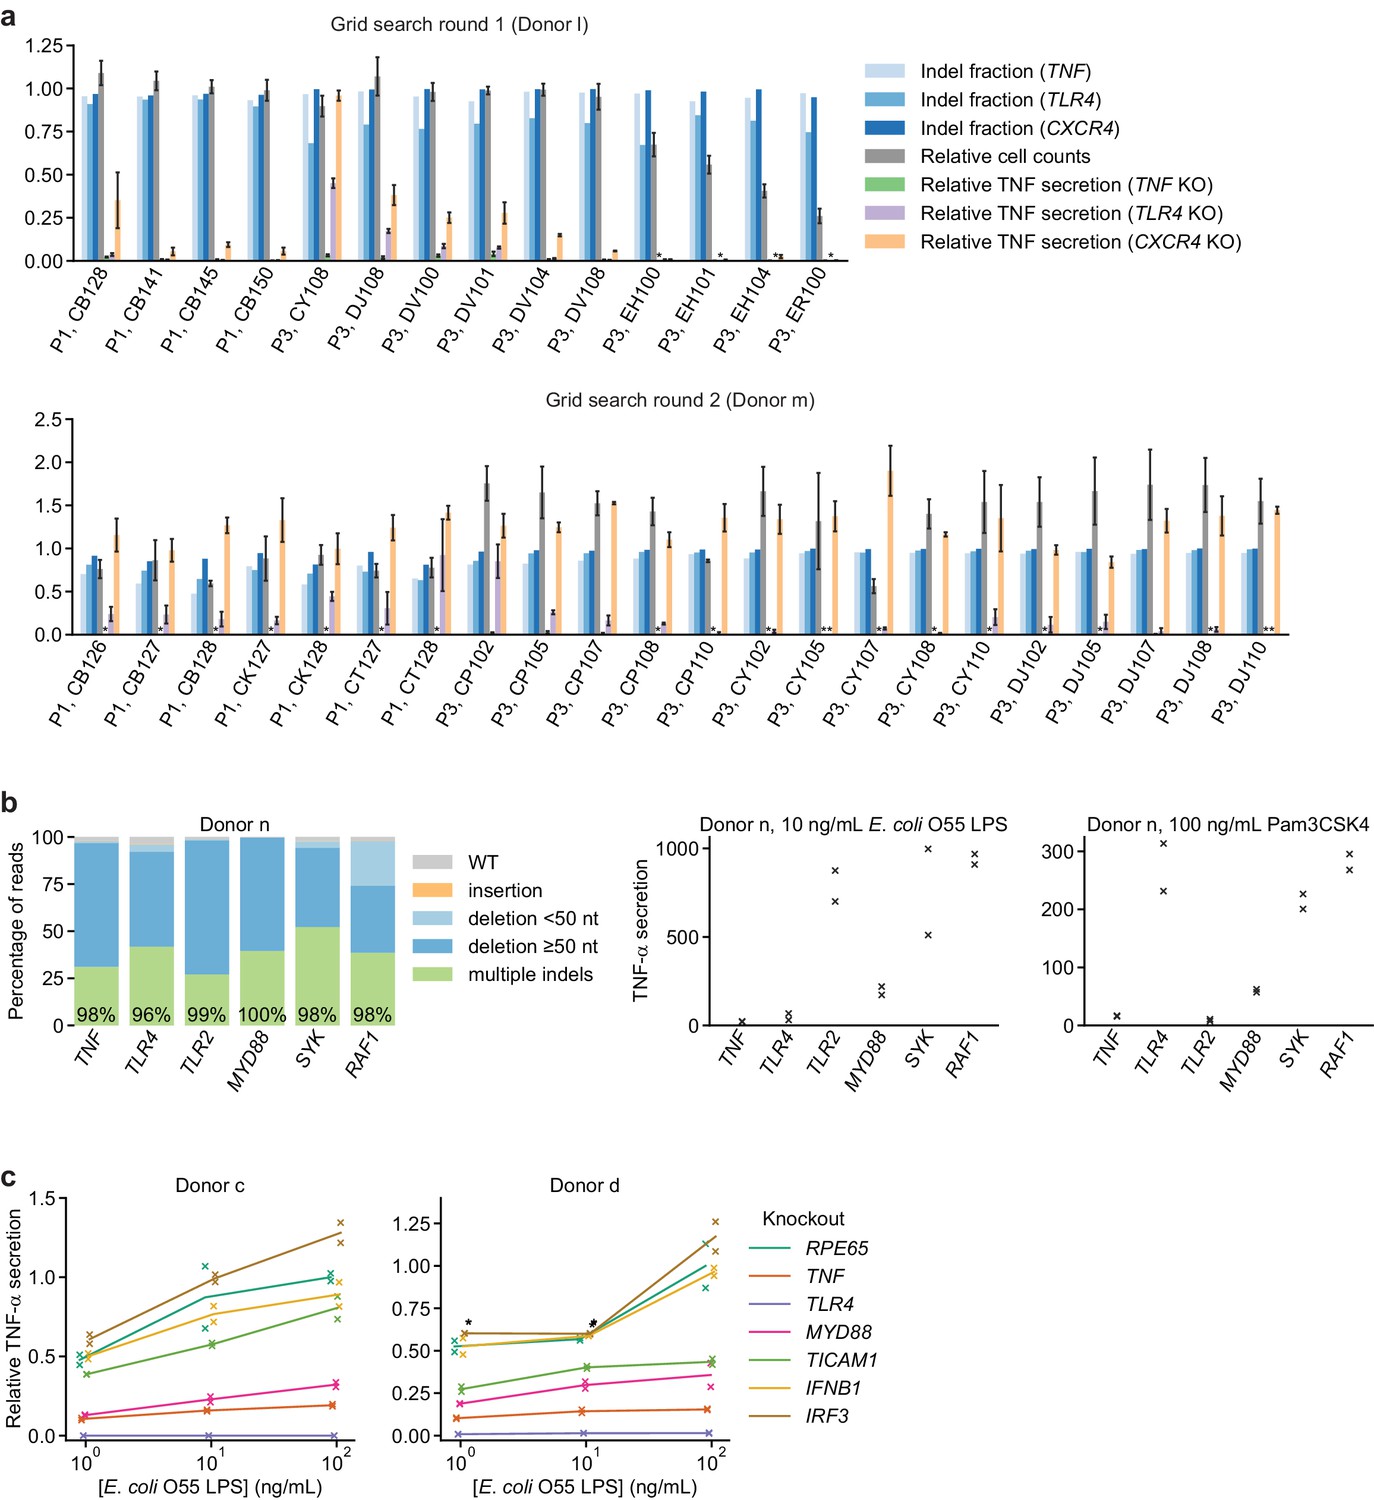
(a) Results from two successive grid searches of electroporation conditions. Ideal conditions have high indel fraction at all loci, high cell counts, low TNF-α secretion in response to 10 ng/mL E. coli LPS with knockout of TNF and TLR4, and high TNF-α secretion with knockout of CXCR4. TNF-α secretion was normalized to cell counts. Indel fractions represent data from a single measurement. Cell counts represent mean count ± standard deviation from two independent wells. TNF-α secretion values represent mean ± standard deviation of two independent treatments, normalized to cell counts. (*) indicates signal below detection limit. (b) Left: Percentage of genomic DNA reads assigned to different classes of outcomes after targeting each locus with multi-sgRNA Cas9 RNPs. Labeled values indicate total percentage of reads with a non-WT sequence. Right: Production of TNF-α by knockout moDCs challenged with 10 ng/mL E. coli O55 LPS or 100 ng/mL Pam3CSK4, normalized to cell counts. Data represent two independent treatments, normalized to cell count obtained from replicate measurements. (c) Production of TNF-α by knockout moDCs challenged with indicated concentrations of E. coli O55 LPS, normalized to cell counts and to TNF-α production by moDCs with knockout of RPE65 and treated with the highest concentration of E. coli O55 LPS. All samples were treated with identical LPS concentrations, but x-values are slightly offset by sample for clarity. Data represent two independent treatments, normalized to cell count obtained from replicate measurements. (*) indicates sample saturated during measurement of TNF-α secretion. Data from treatment with 100 ng/mL E. coli O55 LPS are also plotted in Figure 1g.
Figure 1—figure supplement 4
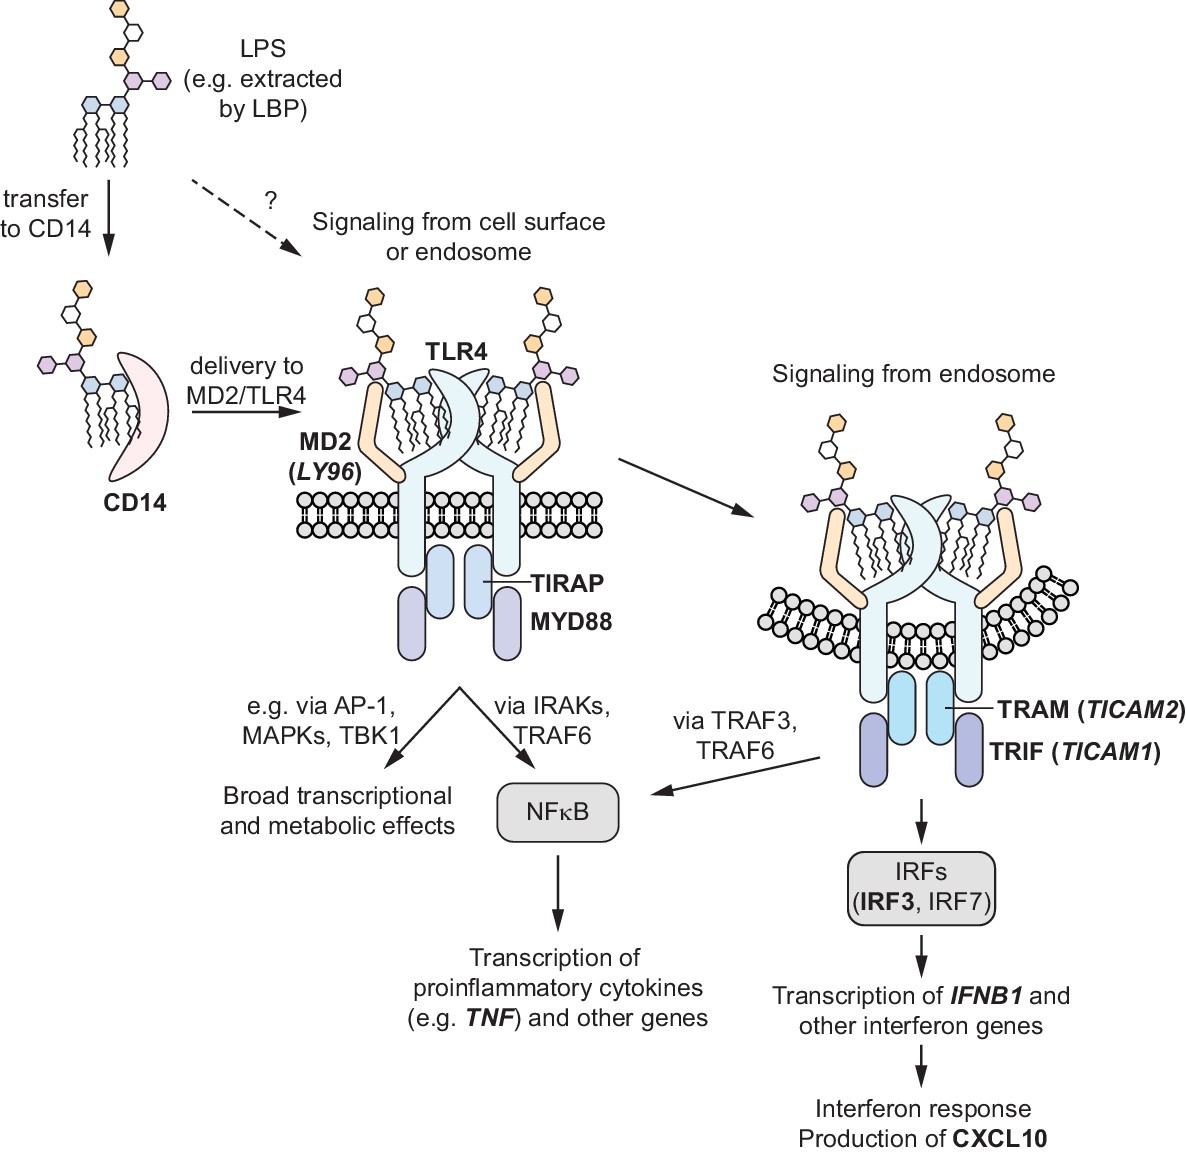
Schematic overview of TLR4 signaling pathways.
LPS binding to TLR4 at the cell surface initially activates the MYD88-dependent signaling pathway, which results in activation of NF-κB and production of pro-inflammatory cytokines such as TNF-α. Endocytosis of the LPS-TLR4 complex leads to activation of the TRIF-dependent signaling pathway, which both further activates NF-κB and initiates an interferon response. Labels of genes mentioned in the main text are bolded. For genes with mismatched protein and gene names, protein names are indicated with gene names in parentheses.
Figure 1—figure supplement 5
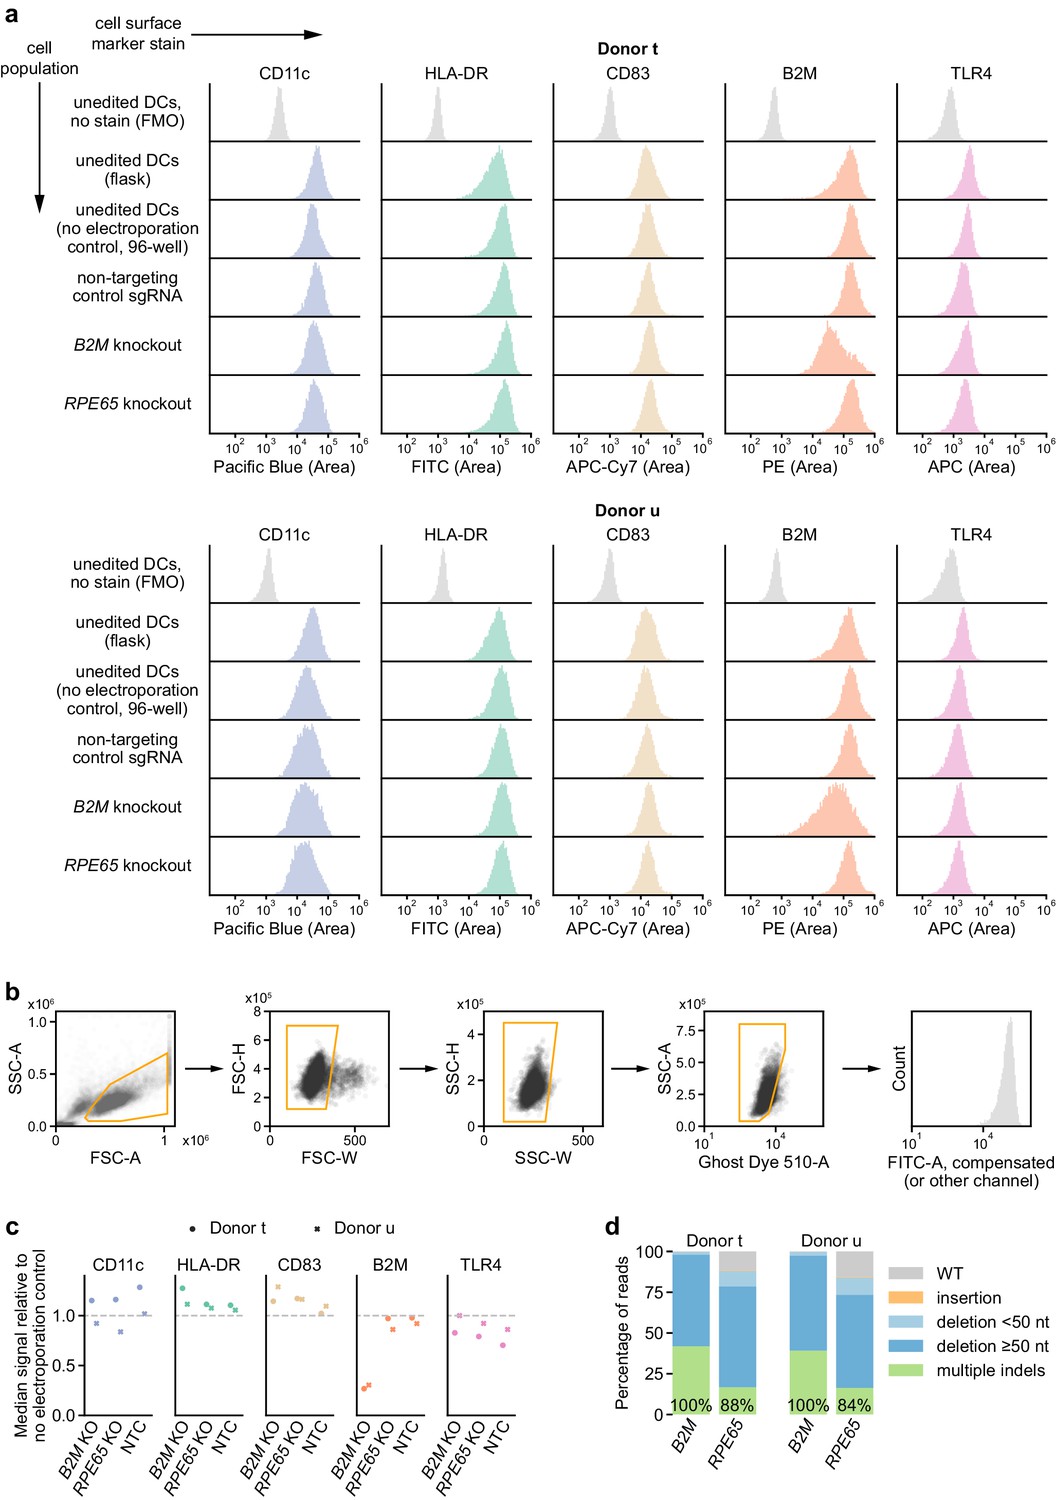
Immunophenotyping of edited moDCs.
(a) Expression profiles of indicated markers in edited and unedited moDCs from two independent donors, measured by flow cytometry. DCs were stained 5 days after electroporation. No electroporation control DCs that had been handled and cultured alongside the edited DCs in 96-well plates as well as control DCs that had been cultured in flasks were also stained. Background fluorescence was estimated using fluorescence-minus-one control-stained unedited moDCs, shown at the top. (b) Gating strategy applied to the flow cytometry data. (c) Ratio of median fluorescence signal in indicated populations versus no electroporation control moDCs for indicated markers. (d) Percentage of genomic DNA reads assigned to different classes of outcomes after targeting each locus with multi-sgRNA Cas9 RNPs. Labeled values indicate total percentage of reads with a non-WT sequence.
Figure 2 with 3 supplements

Responses of human moDCs to LPSs are specific to bacterial species and human donor.
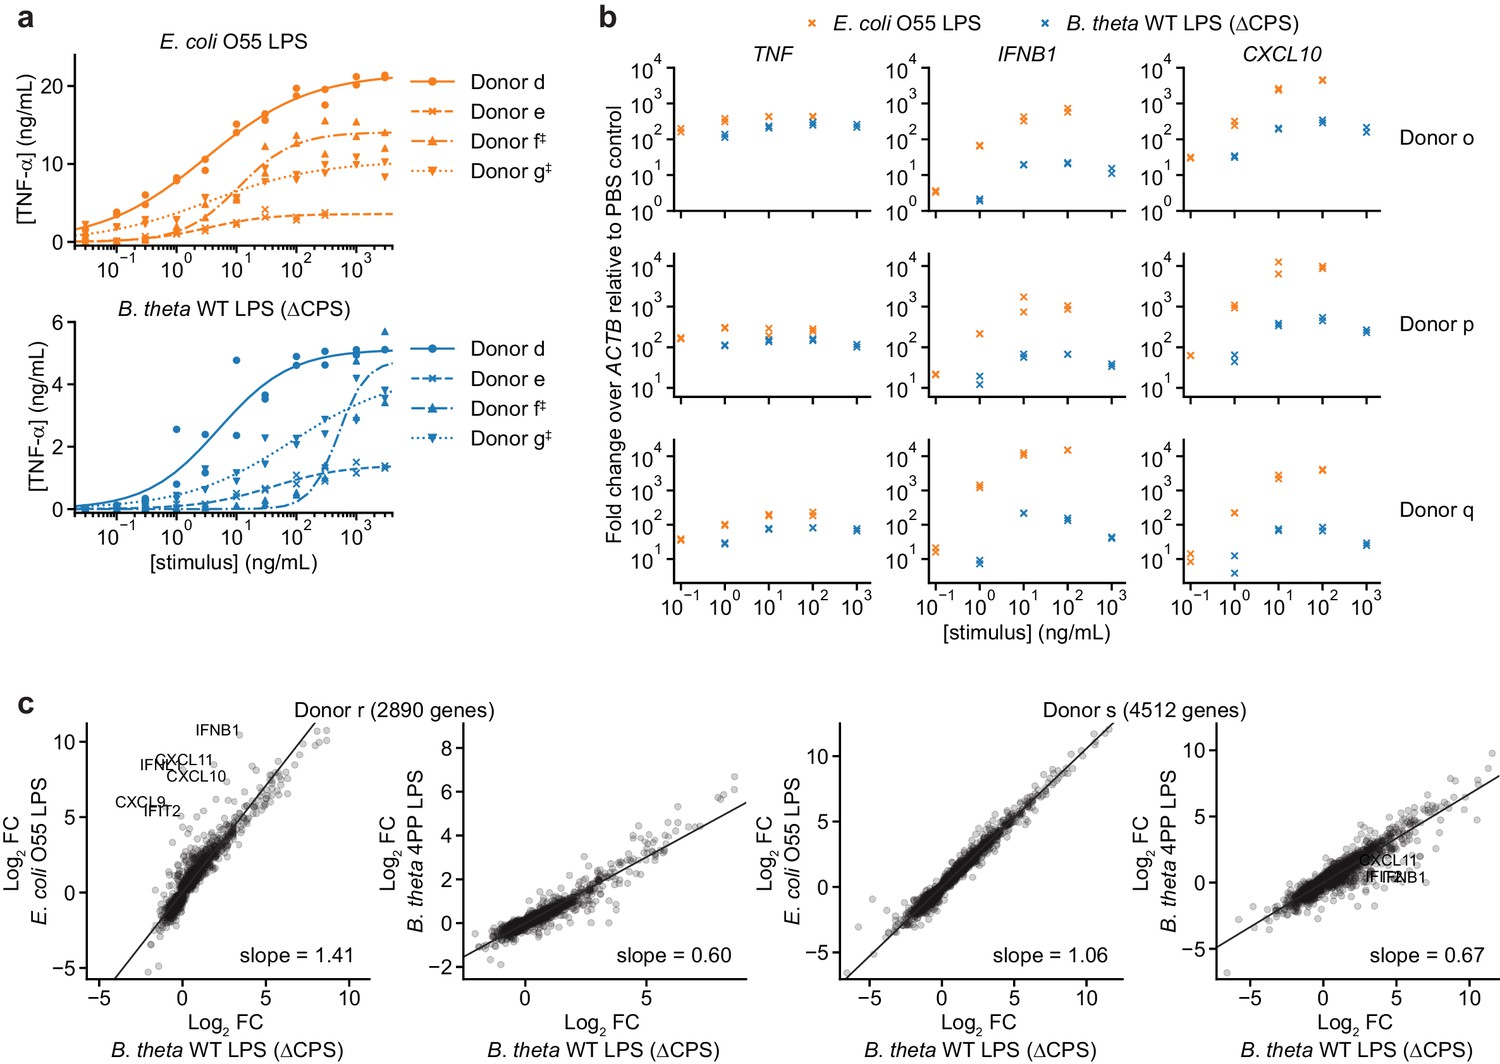
(a) TNF-α secretion after stimulation of moDCs from four independent donors with titration series of the indicated LPSs. Cells from donor e were not treated with R. sphaeroides LPS. Each data point represents an independent treatment of 20,000 moDCs. Lines denote a Hill curve fit. ‡ indicates moDCs that were processed in parallel (donors f and g). (b) Expression levels of selected genes after stimulation of moDCs from two donors with 10 ng/mL E. coli O55 LPS, 100 ng/mL B. theta WT LPS, or 100 ng/mL B. theta 4PP LPS, as determined by RNA-seq. Log2 fold-changes compared to PBS-treated control cells or transcript counts per million are shown for the 25 protein-coding genes with the largest log2 fold-changes after treatment with E. coli O55 LPS. B. theta WT LPS elicits weaker upregulation of genes than E. coli O55 LPS, with a more pronounced difference for genes downstream of TRIF such as IFNB1. B. theta 4PP LPS elicits even weaker upregulation of genes. Data represent means obtained from three independent treatment replicates for each treatment and donor. See also Figure 2—figure supplement 1, Figure 2—figure supplement 2, and Figure 2—figure supplement 3.
Figure 2—figure supplement 1
B. theta LPS and E. coli LPS elicit different responses from moDCs with responses that vary by donor.
(a) Responses to individual LPSs from Figure 2a plotted by donor to highlight differences in response magnitude and EC50. ‡ indicates moDCs that were processed in parallel (donors f and g). (b) Fold-changes in gene expression for TNF (activated by MYD88 and TRIF), IFNB1, and CXCL10 (both activated only by TRIF) upon treatment with B. theta WT LPS or E. coli O55 LPS for moDCs derived from three independent donors, measured by qPCR as 2–ΔΔCp, calculated as the difference in Cp of the target gene compared to ACTB (ΔCp) and normalized to the same quantity for PBS-treated cells (ΔΔCp). Data represent two independent treatments and RNA extractions. Each data point represents the mean of three technical replicates. (c) Comparison of log2 fold-changes from RNA-seq data for all protein-coding genes (annotated in Ensembl release 103) differentially expressed with p<0.01 with any treatment, as determined by DeSeq2 (Love et al., 2014). B. theta WT LPS elicits weaker upregulation of genes than E. coli O55 LPS, although the difference is weaker for donor s. B. theta 4PP LPS elicits weaker upregulation of genes than B. theta WT LPS. Data represent means obtained from three independent treatment replicates for each treatment and donor. Lines denote fit from a linear regression, with slope indicated. LPS concentrations used to stimulate cells for RNA-seq: E. coli O55 LPS: 10 ng/mL; B. theta WT LPS: 100 ng/mL; B. theta 4PP LPS: 100 ng/mL.
Figure 2—figure supplement 2
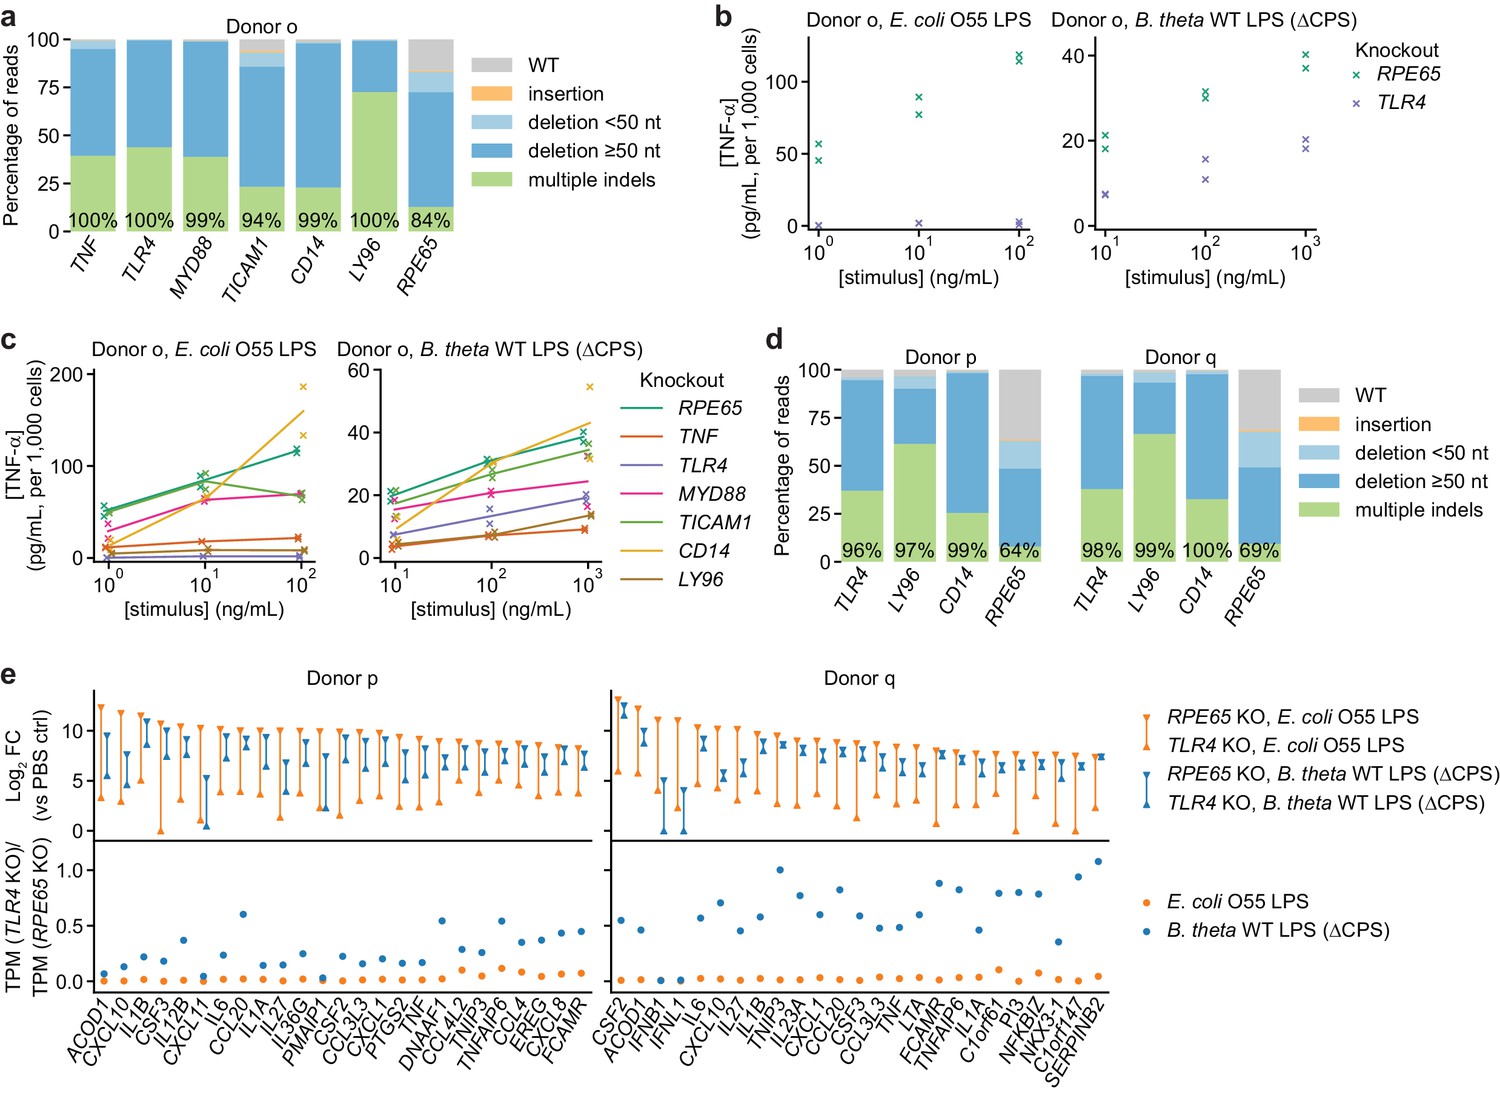
TLR4 knockout does not completely eliminate the response to B. theta LPS.
(a) Percentage of genomic DNA reads assigned to different classes of outcomes after targeting each locus with multi-sgRNA Cas9 RNPs. Labeled values indicate total percentage of reads with a non-WT sequence. (b) Production of TNF-α by moDCs with knockout of TLR4 or RPE65 stimulated with indicated concentrations of E. coli O55 LPS or B. theta LPS, normalized to cell counts. Data represent two independent treatments, normalized to cell count obtained from replicate measurements. (c) Production of TNF-α by knockout moDCs, as in (b), with data from additional knockouts also shown. All samples were treated with identical LPS concentrations, but x-values are slightly offset by sample for clarity. Lines denote means of two independent treatments. (d) Percentage of genomic DNA reads assigned to different classes of outcomes after targeting each locus with multi-sgRNA Cas9 RNPs. Labeled values indicate total percentage of reads with a non-WT sequence. (e) Expression levels of selected genes after stimulation of knockout moDCs from two donors with 3 ng/mL E. coli O55 LPS and 100 ng/mL B. theta WT LPS (donor p) or 10 ng/mL E. coli O55 LPS and 30 ng/mL B. theta WT LPS (donor q). Treatment concentrations were chosen based on similar transcriptional upregulation observed by qPCR (Figure 2—figure supplement 1b). Log2 fold-changes compared to control cells (PBS-treated, knockout of RPE65) or the ratio of transcript counts (transcripts per million, TPM) in moDCs with knockout of TLR4 and moDCs with knockout of RPE65 are shown for the 25 genes with the largest summed log2 fold-changes after treatment with E. coli O55 LPS and B. theta WT LPS in moDCs with knockout of RPE65. MoDCs with TLR4 knockout exhibit almost no transcriptional changes in response to E. coli LPS but upregulate many genes in response to B. theta WT LPS, with the exception of genes downstream of TRIF, such as IFNB1. Data represent means obtained from two independent treatment replicates for each treatment and donor.
Figure 2—figure supplement 3
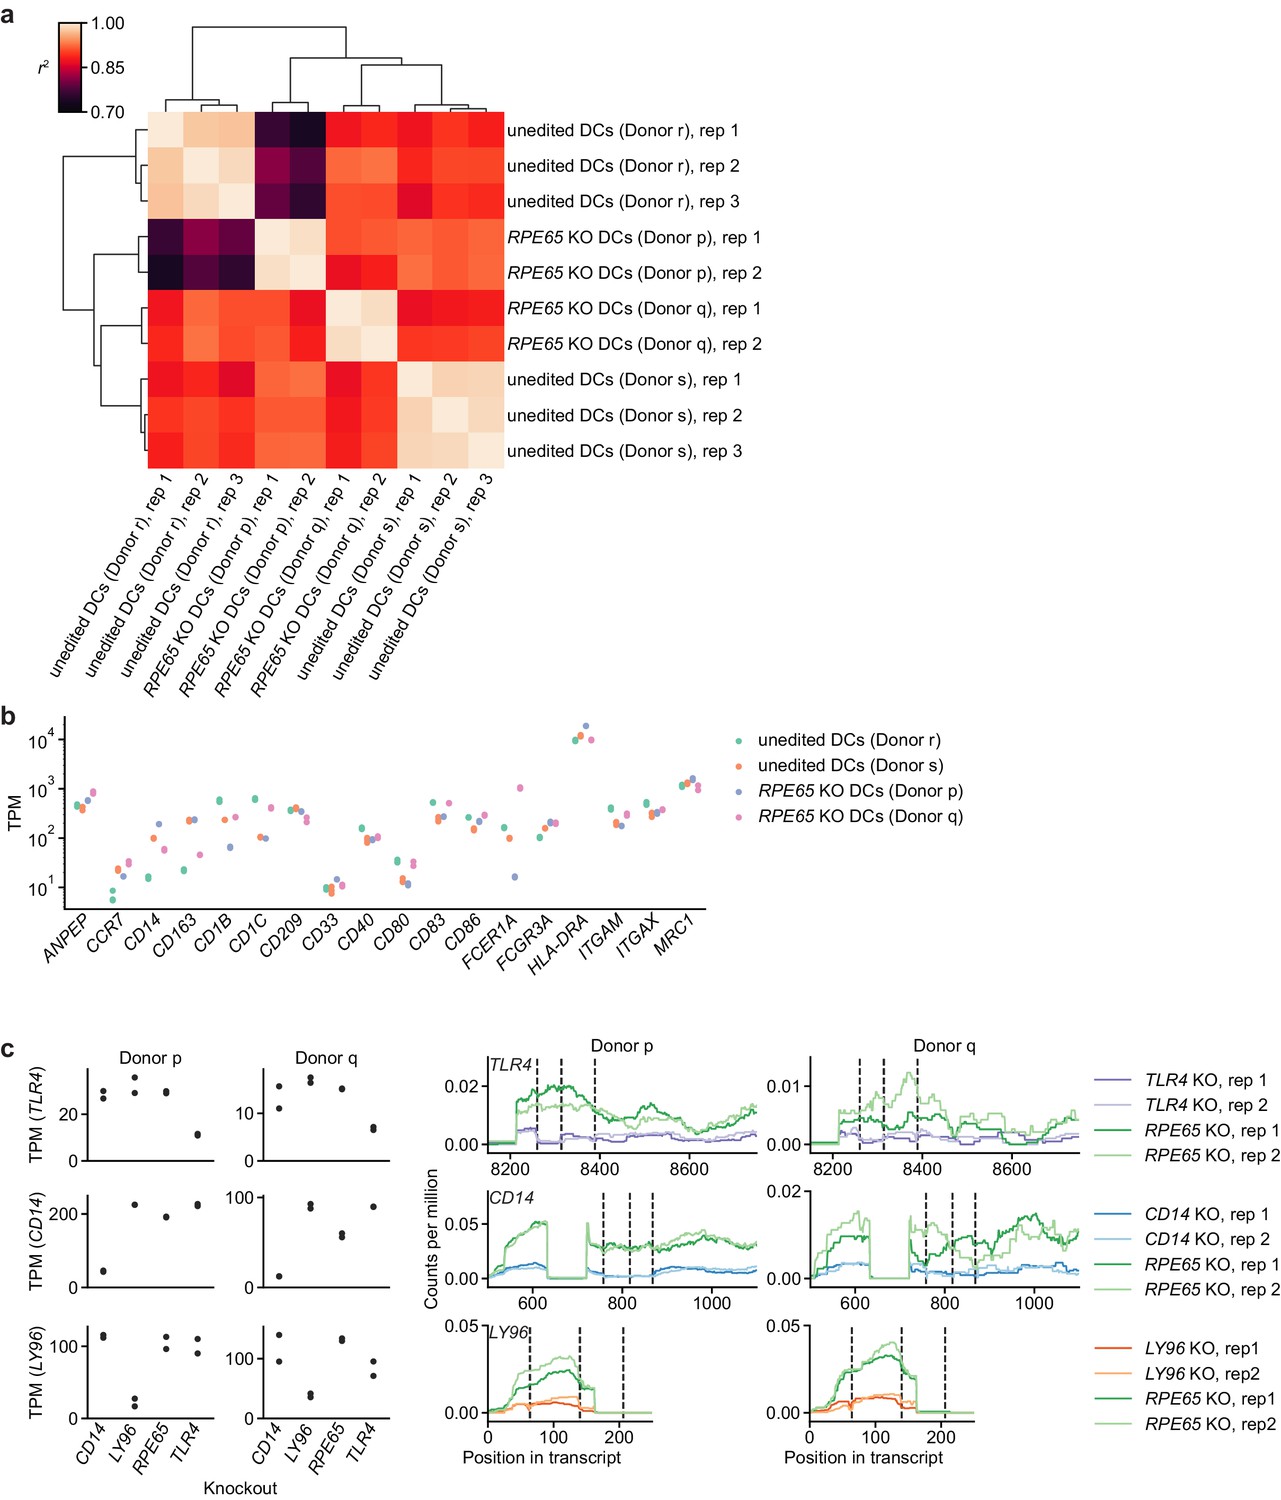
Comparison of transcriptonal profiles of edited and unedited moDCs.
(a) Clustered correlation heatmap of transcriptional profiles from different edited and unedited moDC populations. Crosswise squared Pearson correlations (r2) of TPM counts of all protein-coding genes with TPM > 0 in at least one sample (15,787 genes, protein-coding genes annotated in Ensembl release 103) were clustered by the Ward variance minimization algorithm implemented in scipy. (b) Expression levels (in TPM) of DC and myeloid cell markers in different edited and unedited moDC populations. (c) Assessment of transcript abundance and transcript structure for targeted genes in knockout moDC populations, suggesting both reduced transcript levels for targeted genes and further disruption of transcript structure (reduced mRNA coverage around sgRNA cut sites). We note that transcript levels of CRISPR-edited genes are not predictive of protein depletion (Smits et al., 2019). The data in Figure 2—figure supplement 2e, however, provide evidence for a reduction in TLR4 function, for which either transcript level reduction or transcript structure disruption is a necessary requirement. Left: Transcript counts (transcripts per million) for targeted genes in different PBS-treated (control) knockout moDC populations. Data represent measurements from independent replicates. Right: Transcript read coverage for targeted genes in different PBS-treated (control) knockout moDC populations. sgRNA cut sites are indicated by vertical dashed lines. Only exons with the sgRNA cut sites are shown.
Figure 3 with 6 supplements
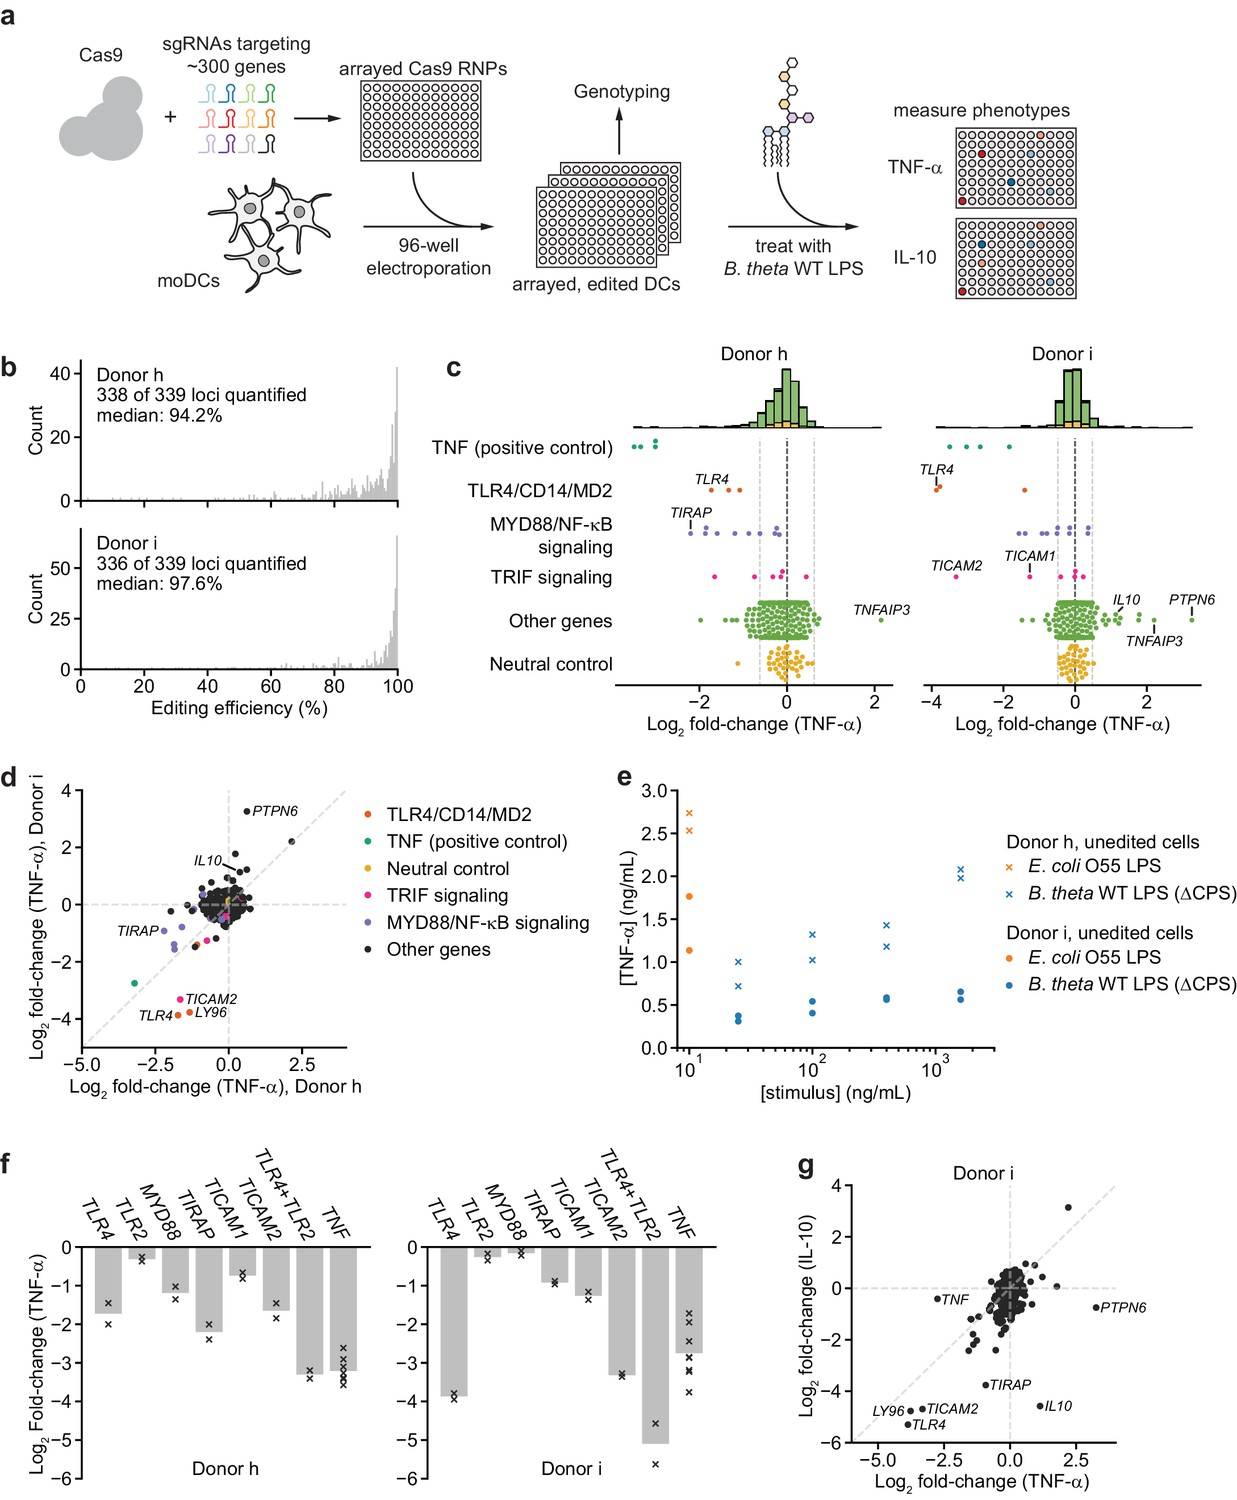
An arrayed genetic screen reveals how moDCs recognize LPS from a human gut bacterium and suggests mechanisms of inter-individual variation.
(a) Schematic of genetic screen. (b) Observed editing efficiencies for loci targeted in the screen. Efficiencies were not obtained for one locus for donor h and three loci for donor i due to PCR failures; no locus failed for both donors. (c) TNF-α secretion of knockout moDC populations from two independent donors after stimulation with 100 ng/mL B. theta WT LPS, displayed as log2 fold-changes compared to neutral controls within each of the four 96-well plates and normalized to cell counts. Each data point represents the mean of two treatment replicates and two cell count replicates. Vertical dashed lines denote mean and two standard deviations of the phenotypes from all neutral gene controls. Distributions of all phenotypes are plotted in the stacked histograms, colored by category, at the top. (d) Comparison of TNF-α secretion from (c) for the two donors. (e) TNF-α secretion after stimulation of unedited moDCs (from no pulse/no RNP wells) from both donors with different concentrations of the indicated LPSs. Each data point represents an independent treatment. (f) TNF-α secretion for selected moDC knockout populations including moDCs with simultaneous knockout of TLR4 and TLR2 after stimulation with 100 ng/mL B. theta WT LPS. Data are shown as individual measurements (×) and mean of all treatment replicates (bars). (g) Comparison of TNF-α and IL-10 secretion from knockout moDC populations for moDCs derived from donor i after stimulation with 100 ng/mL B. theta WT LPS. Each data point represents the mean of two treatment replicates and two cell count replicates for TNF-α secretion and data from a single treatment replicate and two cell count replicates for IL-10 secretion. See also Figure 3—figure supplement 1, Figure 3—figure supplement 2, Figure 3—figure supplement 3, Figure 3—figure supplement 4, Figure 3—figure supplement 5, and Figure 3—figure supplement 6.
Figure 3—figure supplement 1
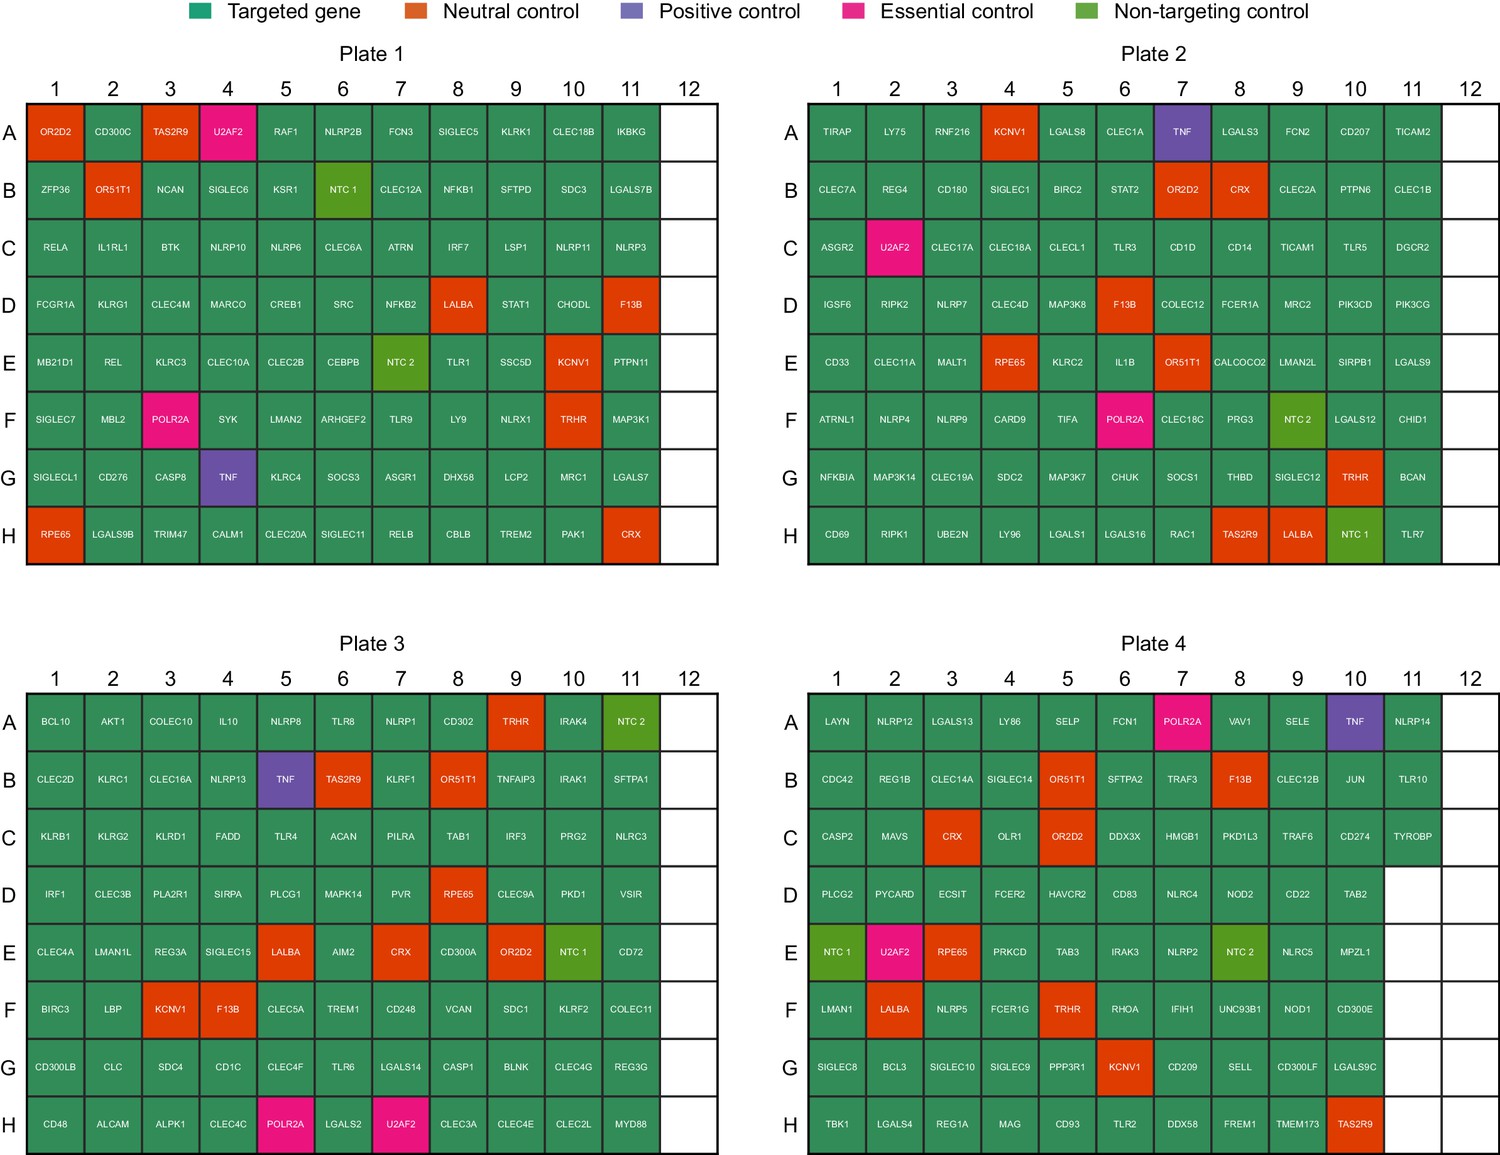
Layout of sgRNAs in the arrayed genetic screen.
Non-targeting controls and sgRNAs targeting neutral controls, essential controls, and TNF (positive control) were included on each plate in randomized positions.
Figure 3—figure supplement 2
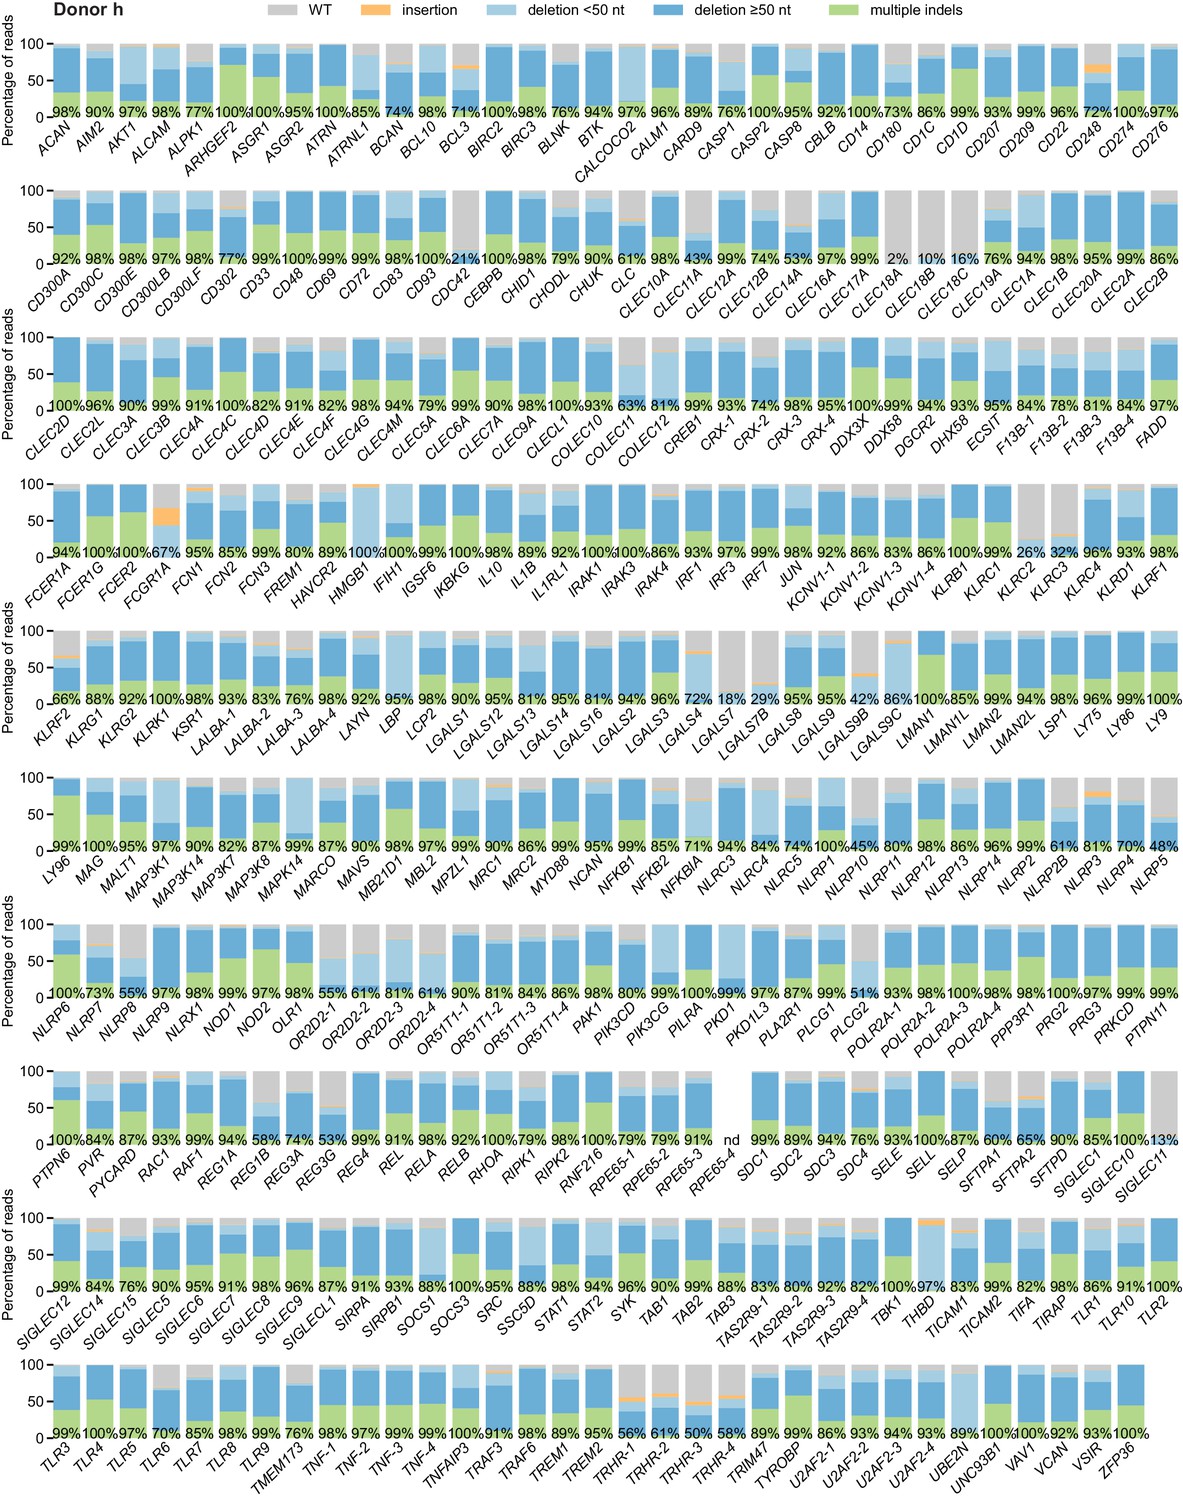
Percentage of genomic DNA reads assigned to different classes of outcomes after targeting each locus in the arrayed genetic screen (donor h).
Labeled values indicate total percentage of on-target reads with a non-WT sequence. For loci with percentages labeled as ‘nd’, sequencing library preparation failed and editing efficiency was not quantified. For genes targeted on each plate, editing efficiency was estimated for each plate individually. Loci are denoted as locus-# with # indicating the plate number.
Figure 3—figure supplement 3
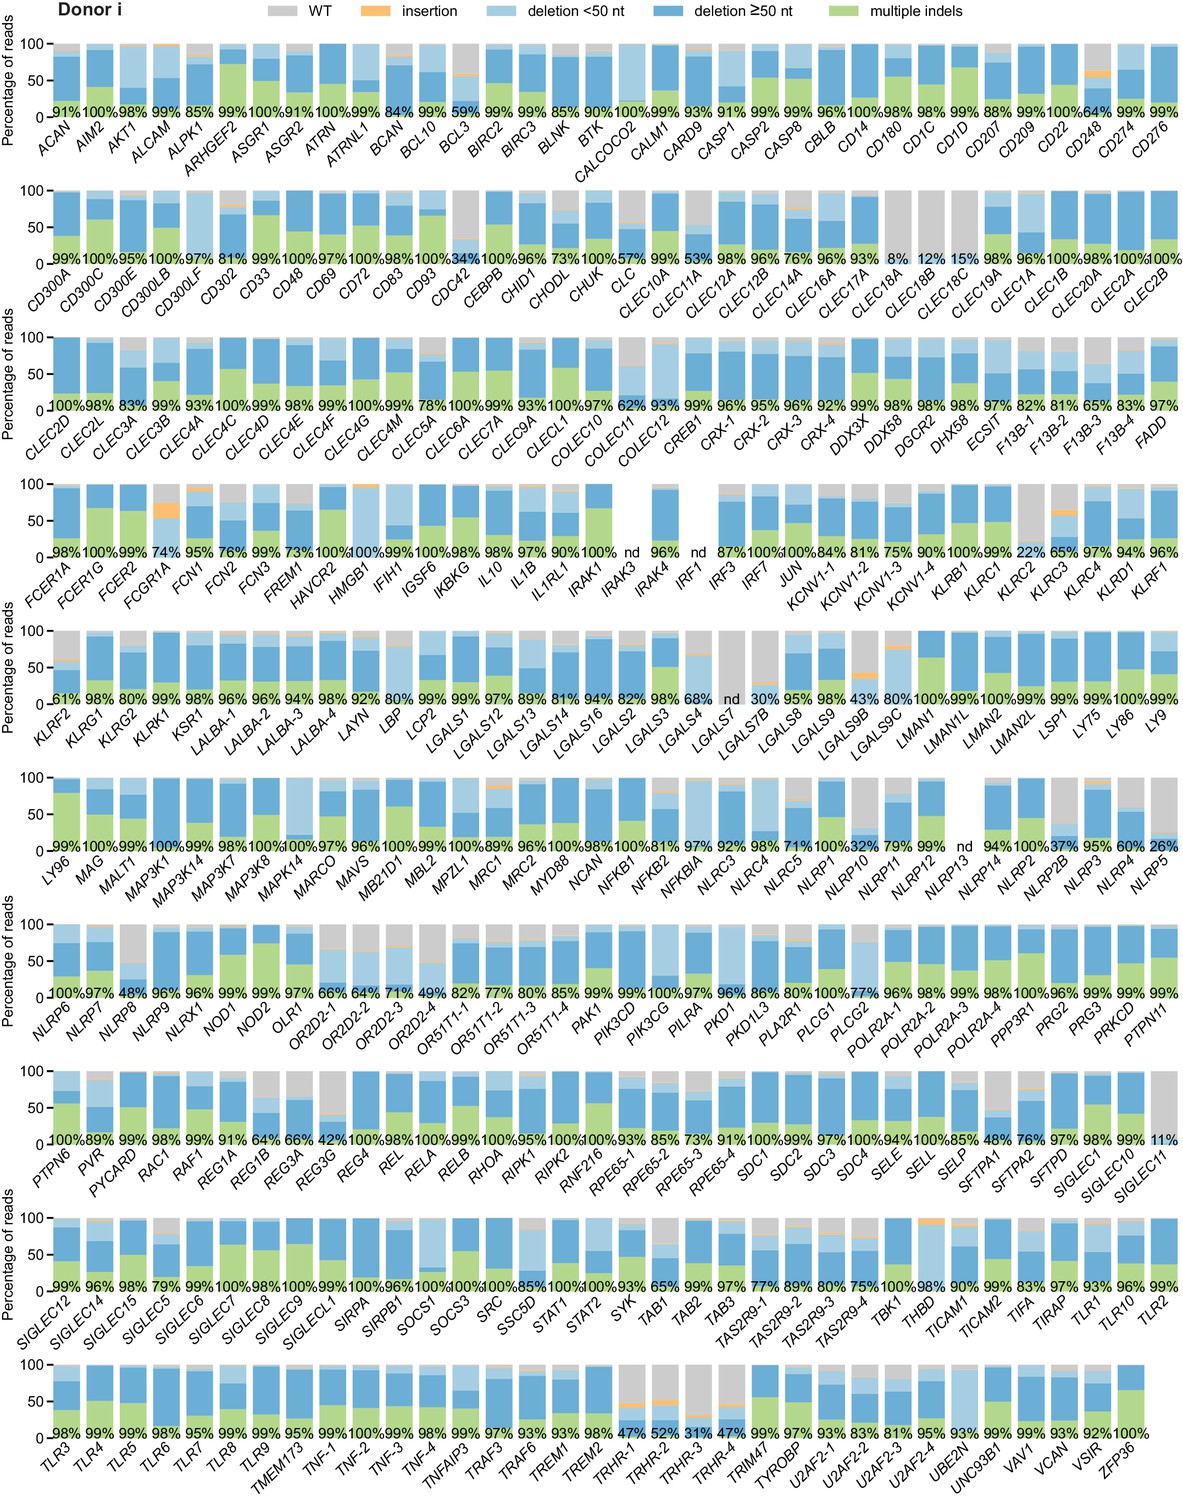
Percentage of genomic DNA reads assigned to different classes of outcomes after targeting each locus in the arrayed genetic screen (donor i).
Labeled values indicate total percentage of on-target reads with a non-WT sequence. For loci with percentages labeled as ‘nd’, sequencing library preparation failed and editing efficiency was not quantified. For genes targeted on each plate, editing efficiency was estimated for each plate individually. Loci are denoted as locus-# with # indicating the plate number.
Figure 3—figure supplement 4
Further analysis of editing outcomes from genetic screens.
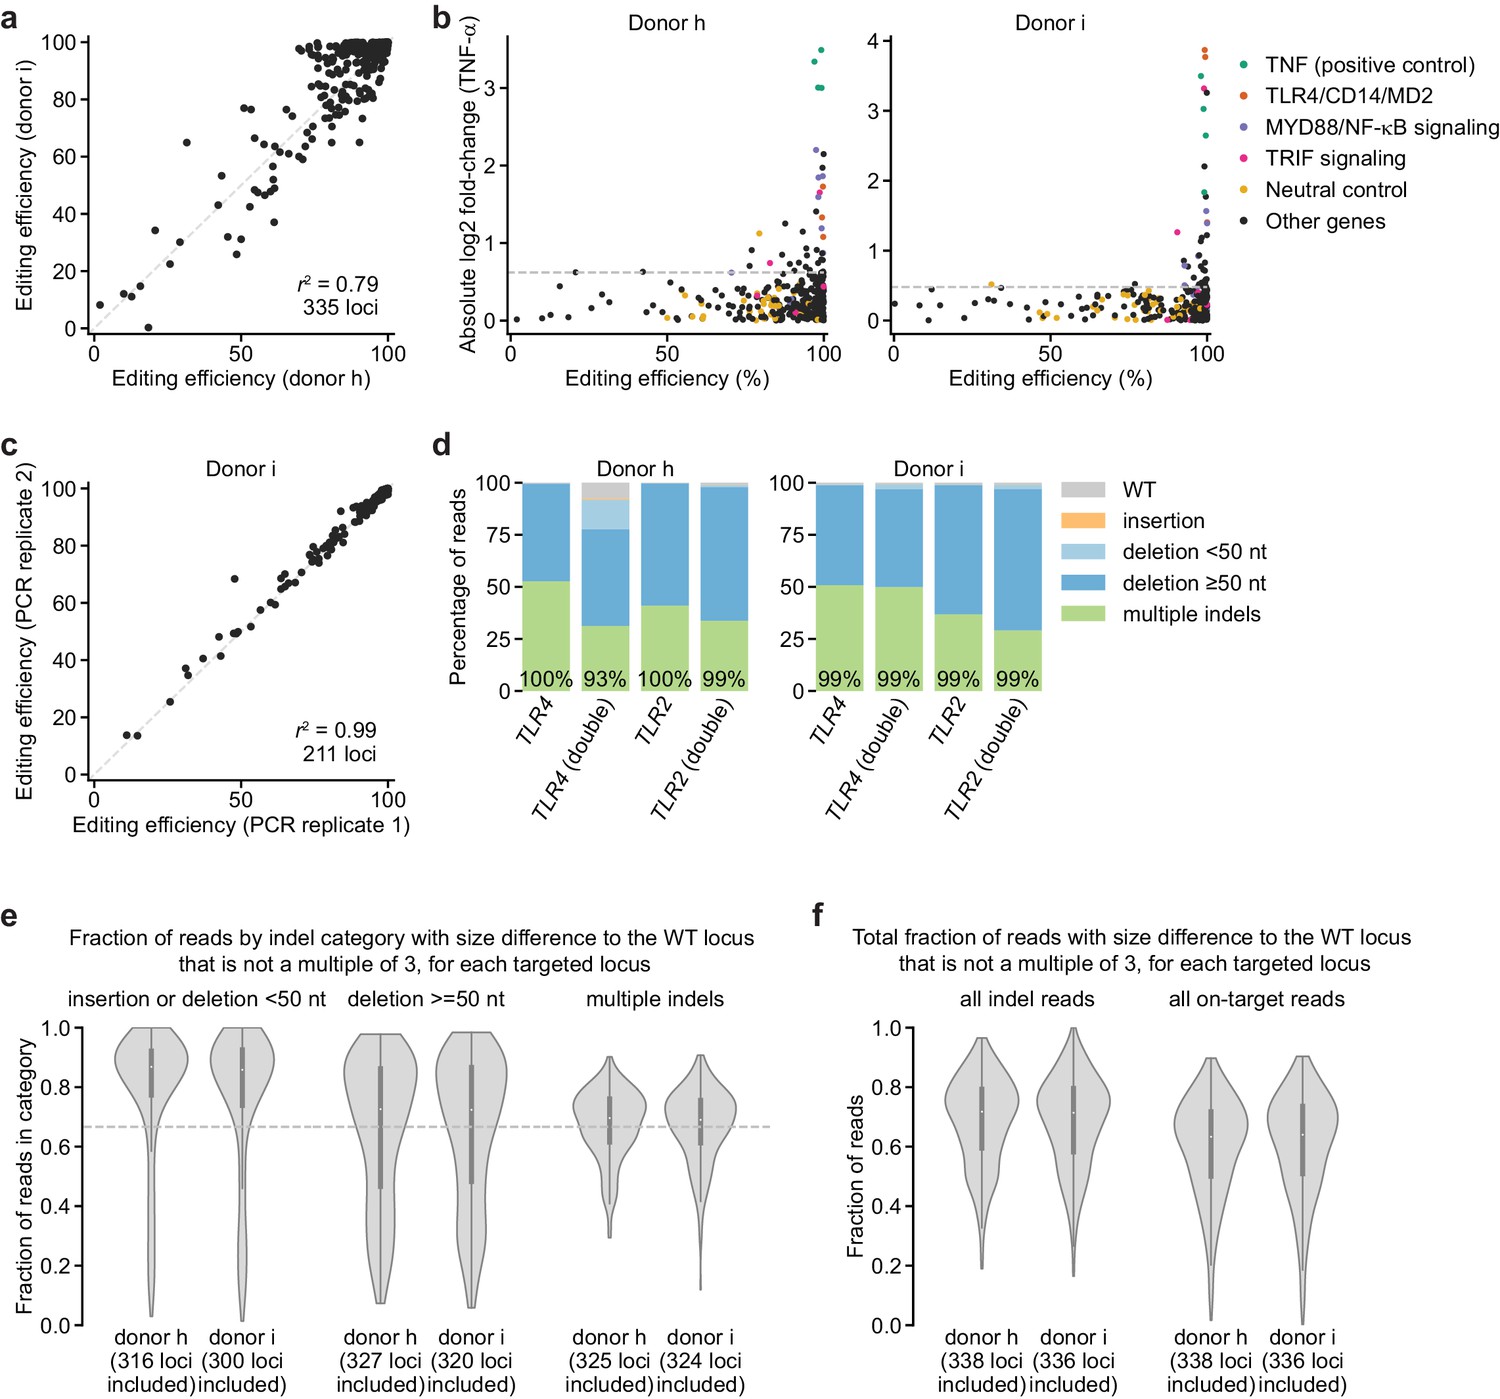
(a) Comparison of editing efficiencies observed in two independent donors for 335 loci. r2 denotes squared Pearson correlation. (b) Comparison of screen phenotype (absolute value of log2 fold-change in TNF-α secretion after stimulation with 100 ng/mL B. theta WT LPS, mean of two treatment replicates) and editing efficiency, suggesting that high editing efficiency is required for a strong screen phenotype. Horizontal dashed lines denote two standard deviations of the log2 fold-changes in TNF-α secretion from all neutral gene controls. (c) Comparison of editing efficiencies observed for two sequencing libraries prepared and sequenced independently, suggesting that the sequencing library preparation protocol and correction for size bias result in reproducible editing efficiencies. The second replicate was only performed for 211 loci. (d) Percentage of genomic DNA reads assigned to different classes of outcomes after targeting indicated loci with Cas9 RNPs. Labeled values indicate total percentage of reads with a non-WT sequence. (e) Distributions of fraction of reads with a net size difference to the WT locus that is not a multiple of 3, which are potential frameshift-containing reads. Distributions are grouped by indel category, and only loci with >100 reads in that category were included (numbers of loci considered for each category are indicated). Horizontal dashed line indicates a fraction of 0.667. (f) Distributions as shown in (e) for all indel-containing reads and all on-target reads for each locus. Note that the simple metric applied here (net size difference to the WT locus that is not a multiple of 3) underestimates the true rate of frameshift mutations, for at least two reasons: First, for some genes, one of three targeting sgRNAs targets an intronic region; thus, some indels disrupt intron-exon boundaries, which is more likely to result in a frameshift. Second, some loci contain separate indels at each sgRNA cut site that together restore the reading frame, but the intervening, frameshifted regions may contain stop codons. We did not give special treatment to such cases. Note also that many in-frame deletions that remove 50–200 nucleotides of a gene may ablate function in the absence of a frameshift.
Figure 3—figure supplement 5
Screen phenotypes.
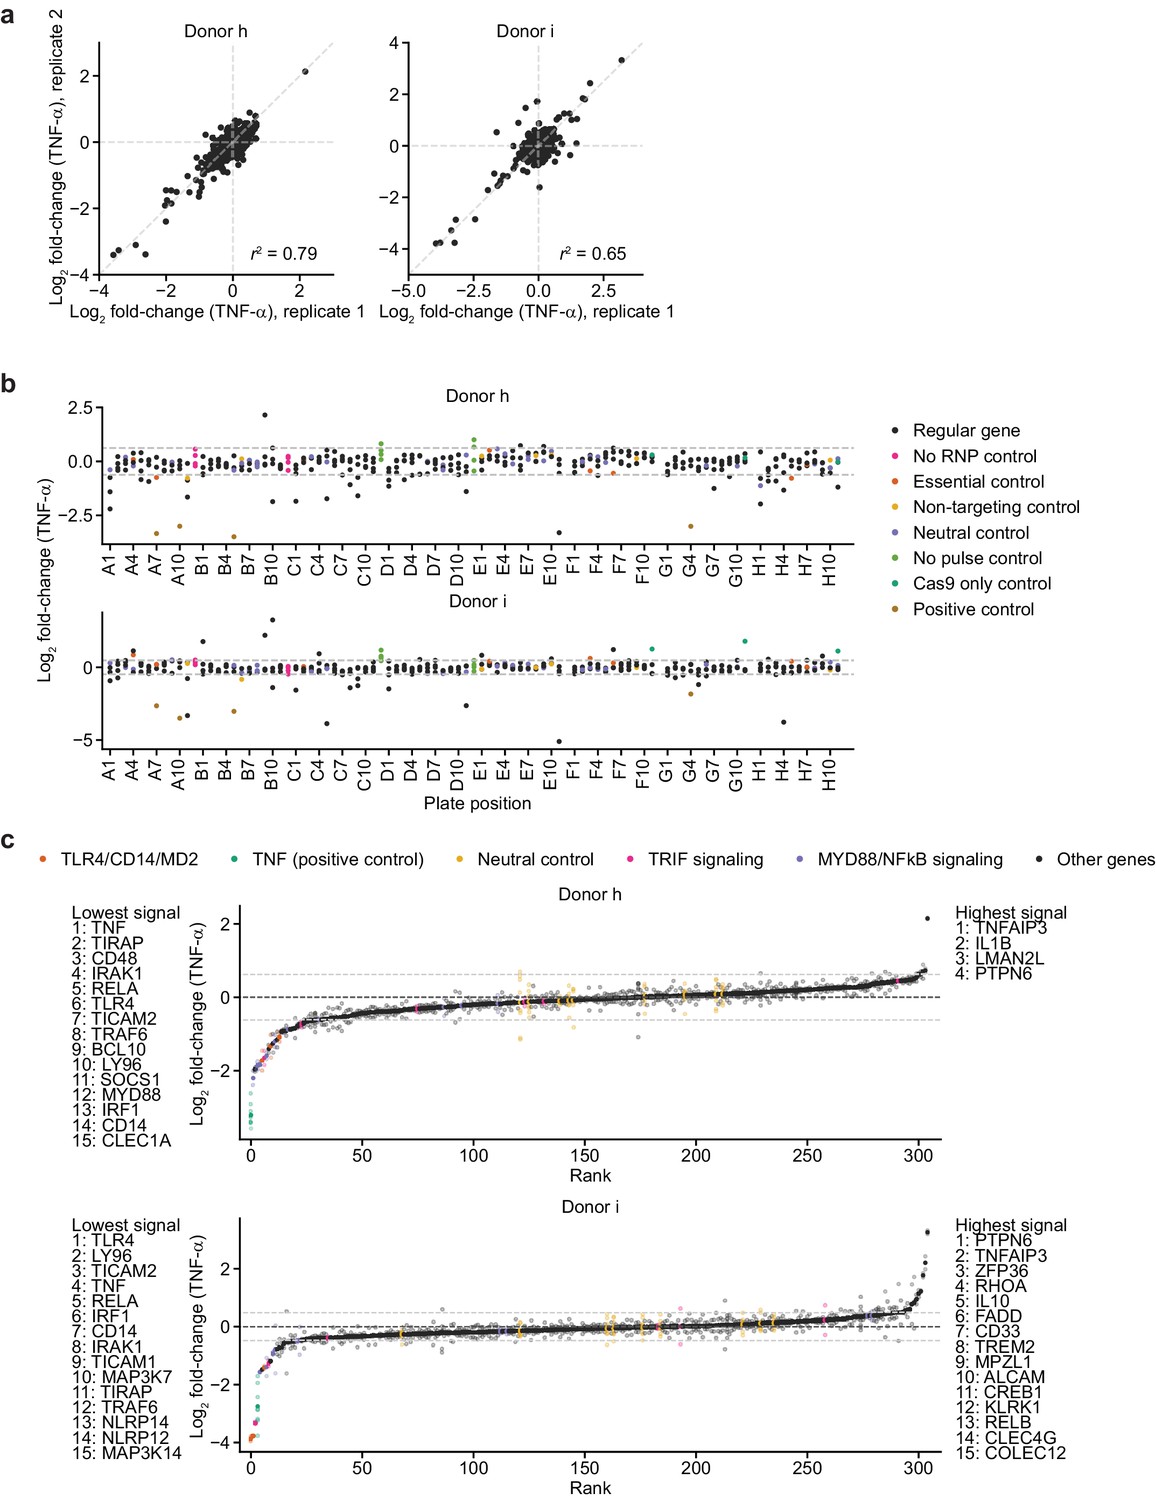
(a) Comparison of phenotypes derived from replicate treatments for each donor. Each data point represents data from treatment with 100 ng/mL B. theta WT LPS and two cell count replicates. r2 denotes squared Pearson correlation. (b) Screen phenotypes (log2 fold-changes in TNF-α secretion after treatment with 100 ng/mL B. theta WT LPS relative to neutral controls) stratified by plate position. Each data point represents the average of two replicate treatments and two cell count replicates. Horizontal dashed lines denote two standard deviations of the phenotypes from all neutral gene controls. (c) Screen phenotypes (log2 fold-changes in TNF-α secretion) ordered by magnitude. Solid points represent the average of all replicate treatments; lower saturation points represent individual treatment measurements. Horizontal dashed lines denote two standard deviations of the phenotypes from all neutral gene controls. Up to 15 genes with the strongest phenotypes greater than two standard deviations (neutral gene controls) in either direction are listed.
Figure 3—figure supplement 6
Validation of screen results in moDCs from two additional, independent donors.
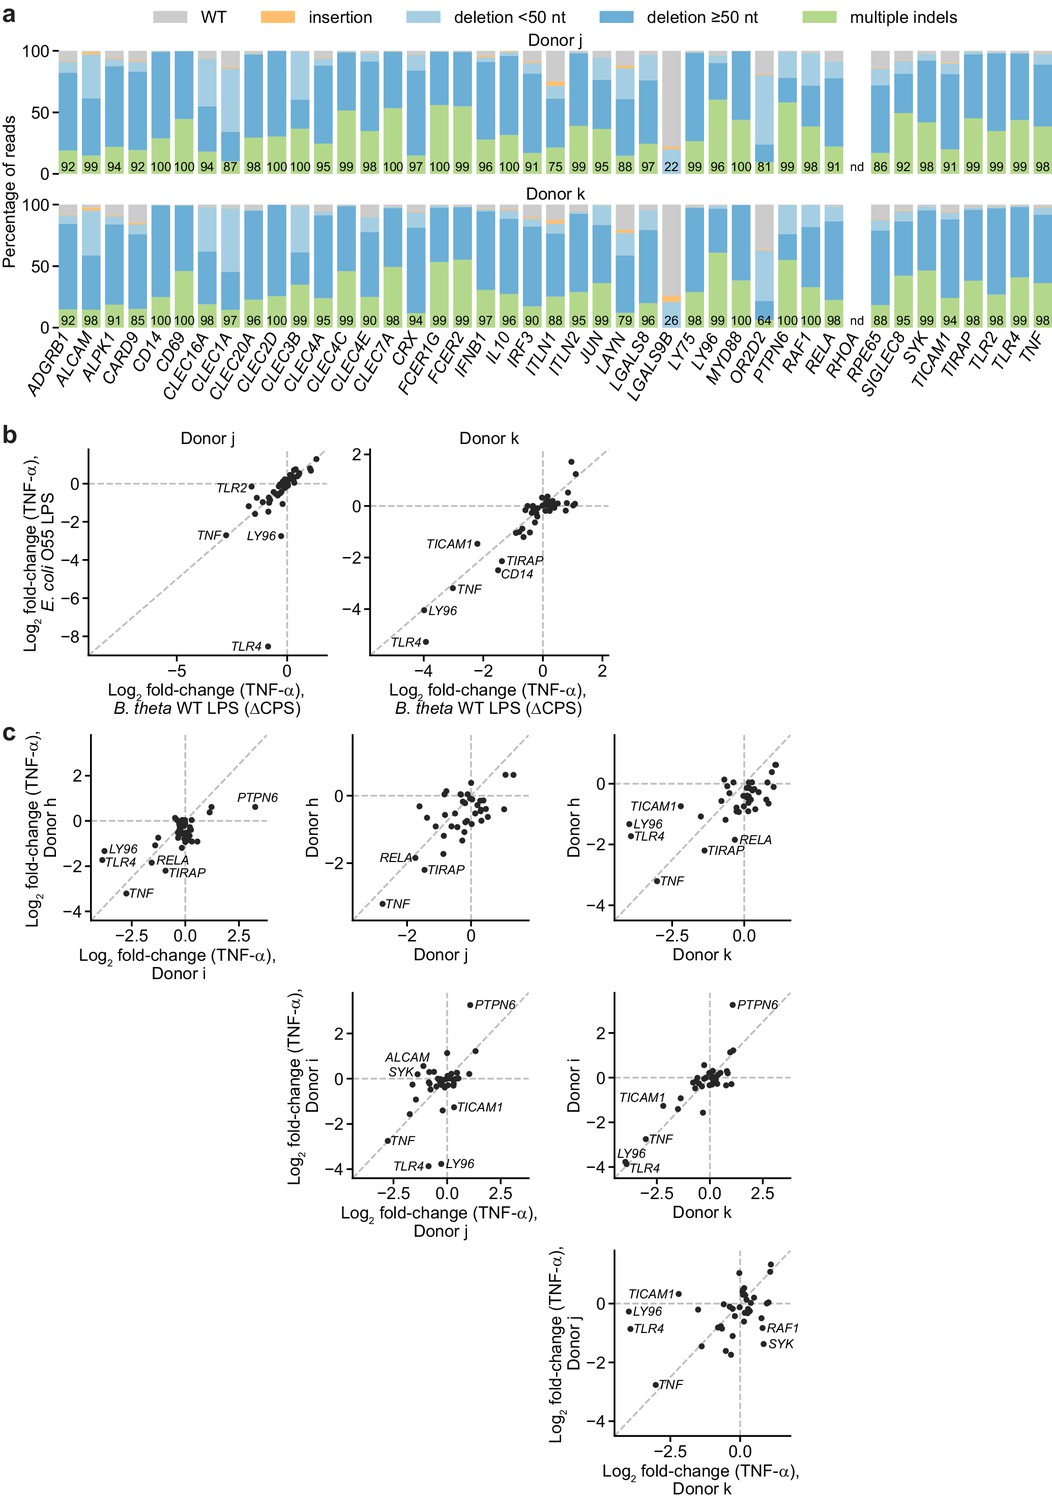
(a) Percentage of genomic DNA reads assigned to different classes of outcomes after targeting indicated loci in cells from two independent donors. Labeled values indicate total percentage of reads with a non-WT sequence. Editing efficiency was not quantified for RHOA. (b) Log2 fold-change in TNF-α production by knockout moDCs challenged with 10 ng/mL E. coli O55 LPS or 100 ng/mL B. theta WT LPS relative to production in moDCs with knockout of neutral genes, normalized to cell counts. For donor j, knockout of TLR2 decreased the response to B. theta WT LPS but not E. coli LPS. Other genes with large log2 fold-changes are also labeled. Each data point represents data from two treatment replicates and a single cell count measurement. (c) Log2 fold-change in TNF-α production by knockout moDCs challenged with 100 ng/mL B. theta WT LPS from four independent donors, relative to production in moDCs with knockout of neutral genes. Data for donors h and i are derived from the arrayed screen. Genes with |log2fold-change| > 1.8 or Δlog2 fold change > 1.3 are labeled.
Tables
Key resources table
| Reagent type (species) or resource | Designation | Source or reference | Identifiers | Additional information |
|---|---|---|---|---|
| Strain, strain background (Bacteroides thetaiotaomicron) | VPI-5482 Δtdk ΔCPS | Rogers et al., 2013 | Referred to as ‘B. theta’ in the text | Acapsular mutant provided by Eric Martens’s lab |
| Strain, strain background (Bacteroides thetaiotaomicron) | VPI-5482 Δtdk ΔBT1854 ΔBT2152 | Jacobson et al., 2018 | Referred to as ‘B. theta 4PP’ in the text | Mutant producing tetra-acylated, di-phosphorylated lipid A in a capsule-producing background |
| Biological sample (human) | PBMCs | AllCells | Freshly isolated from de-identified healthy individuals and shipped overnight | |
| Antibody | Anti-human CD14 (clone HCD14, mouse monoclonal), PE, PerCP-Cy5.5, or BV421 | BioLegend | PE: Cat#: 325605; RRID:AB_830678 PerCP-Cy5.5: Cat#:325621; RRID:AB_893252 BV421: 325627; RRID:AB_2561342 | Flow cytometry (2 µL per test) |
| Antibody | Anti-human CD80 (clone 2D10, mouse monoclonal), APC | BioLegend | Cat#: 305219; RRID:AB_2291403 | Flow cytometry (5 µL per test) |
| Antibody | Anti-human CD83 (clone HB15e, mouse monoclonal), APC-Cy7 | BioLegend | Cat#: 305329; RRID:AB_2566392 | Flow cytometry (4 µL per test) |
| Antibody | Anti-human CD86 (clone BU63, mouse monoclonal), FITC or BV605 | BioLegend | FITC: Cat#: 374203; RRID:AB_2721573 BV605: Cat#: 374213; RRID:AB_2734429 | Flow cytometry (5 µL per test) |
| Antibody | Anti-human HLA-DR (clone L243, mouse monoclonal), PE or FITC | BioLegend | PE: Cat#: 307605; RRID:AB_314683 FITC: Cat#: 307603; RRID:AB_314681 | Flow cytometry (5 µL per test) |
| Antibody | Anti-human CD11b (clone LM2, mouse monoclonal), PE-Cy7 | BioLegend | Cat#: 393103; RRID:AB_2734450 | Flow cytometry (5 µL per test) |
| Antibody | Anti-human CD11c (clone Bu15, mouse monoclonal), Pacific Blue, FITC, or PerCP-Cy5.5 | BioLegend | Pacific Blue: Cat#: 337212; RRID:AB_1595430 FITC: Cat#: 337213; RRID:AB_1877174 PerCP-Cy5.5: Cat#: 337209; RRID:AB_1279071 | Flow cytometry (5 µL per test) |
| Antibody | Anti-human CD205 (clone HD30, mouse monoclonal), PE | BioLegend | Cat#: 342203; RRID:AB_1626209 | Flow cytometry (5 µL per test) |
| Antibody | Anti-human B2M (clone 2M2, mouse monoclonal), PE | BioLegend | Cat#: 316306; RRID:AB_492839 | Flow cytometry (2 µL per test) |
| Antibody | Anti-human TLR4 (clone HTA125, mouse monoclonal), APC | BioLegend | Cat#: 312815; RRID:AB_2562486 | Flow cytometry (4 µL per test) |
| Sequence-based reagent | Purified sgRNAs | This paper/Synthego | Library available from Synthego as ‘Pattern Recognition Receptors and Signaling Pathway arrayed library’ | Sequences and genomic binding locations listed in Supplementary file 1 |
| Sequence-based reagent | Genomic locus amplification primers | This paper | Sequences listed in Supplementary file 1 | |
| Sequence-based reagent | qPCR primers against ACTB, IFNB1, TNF, CXCL10 | Universal Probe Library (Roche) | Sequences included in Materials and methods section | |
| Peptide, recombinant protein | Human GM-CSF | Gemini Bio | Cat#: 300–124P | Used at 50 ng/mL in DC differentiation medium |
| Peptide, recombinant protein | Human IL-4 | Gemini Bio | Cat#: 300–154P | Used at 20 ng/mL in DC differentiation medium |
| Peptide, recombinant protein | Streptococcus pyogenes Cas9 2xNLS | Synthego | Available via Synthego as an ‘Add-On Product’ | |
| Commercial assay or kit | EasySep human monocyte enrichment kit (with or without CD16 depletion) | Stemcell Technologies | With CD16 depletion: Cat# 19059 Without CD16 depletion: Cat# 19058 | |
| Commercial assay or kit | SimpleStep human TNF alpha ELISA kit | Abcam | Cat#: ab181421 | |
| Commercial assay or kit | SimpleStep human IP-10 ELISA kit | Abcam | Cat#: ab173194 | |
| Commercial assay or kit | SimpleStep human IL-10 ELISA kit | Abcam | Cat#: ab185986 | |
| Commercial assay or kit | Stranded mRNA prep ligation kit | Illumina | Cat#: 20040534/20040532 | |
| Chemical compound, drug | Ultrapure E. coli O55:B5 LPS | Invivogen | Cat#: TLRL-PB5LPS | |
| Chemical compound, drug | Rhodobacter sphaeroides LPS | Invivogen | Cat#: TLRL-RSLPS | |
| Chemical compound, drug | Bacteroides thetaiotaomicron WT LPS (ΔCPS) | Jacobson et al., 2018 this paper | Referred to as ‘B. theta LPS’ or ‘B. theta WT LPS (ΔCPS)’ in the text | |
| Chemical compound, drug | Bacteroides thetaiotaomicron 4PP LPS | Jacobson et al., 2018 this paper | Referred to as ‘B. theta 4PP LPS’ in the text | |
| Software, algorithm | Knock-knock v0.3 | https://github.com/jeffhussmann/knock-knock and Canaj et al., 2019 | ||
| Other | Ghost Dye Violet 510 | Tonbio Biosciences | Cat#: 13–0870 T100 | Flow cytometry viability stain (0.1 µL per 100 µL cells) |
Additional files
-
Supplementary file 1
Sequences of sgRNAs and amplicon PCR primers used in this work, including details on sgRNA binding sites.
- https://cdn.elifesciences.org/articles/65856/elife-65856-supp1-v2.xlsx
-
Supplementary file 2
Counts corresponding to different outcomes, corrected for amplicon size, after amplicon sequencing for all donors except donors h and i.
- https://cdn.elifesciences.org/articles/65856/elife-65856-supp2-v2.xlsx
-
Supplementary file 3
Raw and processed TNF-α and IL-10 ELISA and cell count data for the genetic screens.
- https://cdn.elifesciences.org/articles/65856/elife-65856-supp3-v2.xlsx
-
Supplementary file 4
Counts corresponding to different outcomes, corrected for amplicon size, after amplicon sequencing for donors h and i.
- https://cdn.elifesciences.org/articles/65856/elife-65856-supp4-v2.xlsx
-
Transparent reporting form
- https://cdn.elifesciences.org/articles/65856/elife-65856-transrepform-v2.docx
Download links
A two-part list of links to download the article, or parts of the article, in various formats.
Downloads (link to download the article as PDF)
Open citations (links to open the citations from this article in various online reference manager services)
Cite this article (links to download the citations from this article in formats compatible with various reference manager tools)
CRISPR-based functional genomics in human dendritic cells
eLife 10:e65856.
https://doi.org/10.7554/eLife.65856


