Whole-organism eQTL mapping at cellular resolution with single-cell sequencing
- Department of Human Genetics, Department of Biological Chemistry, and Howard Hughes Medical Institute, University of California, Los Angeles, United States
- Department of Biochemistry and Molecular Biology, Institute for Medical Research Israel-Canada, The Hebrew University School of Medicine, Israel
Figures
Figure 1 with 1 supplement

Whole-organism expression quantitative trait loci mapping with single-cell RNA-sequencing (scRNA-seq).
(A) A large population of segregants is dissociated to single cells. Each cell in the suspension has an unknown genotype and cell-type identity. The suspension is profiled using scRNA-seq. Cell-type identity is inferred by clustering cells and comparing the expression of known marker genes. Genotypes are reconstructed from expressed single-nucleotide variants. (B) The Uniform Manifold Approximation and Projection of 55,508 scRNA-seq expression profiles from approximately 200,000 C. elegans F4 segregants collected at the L2 larval stage is shown. Cells are colored based on the inferred cell type.
Figure 1—figure supplement 1
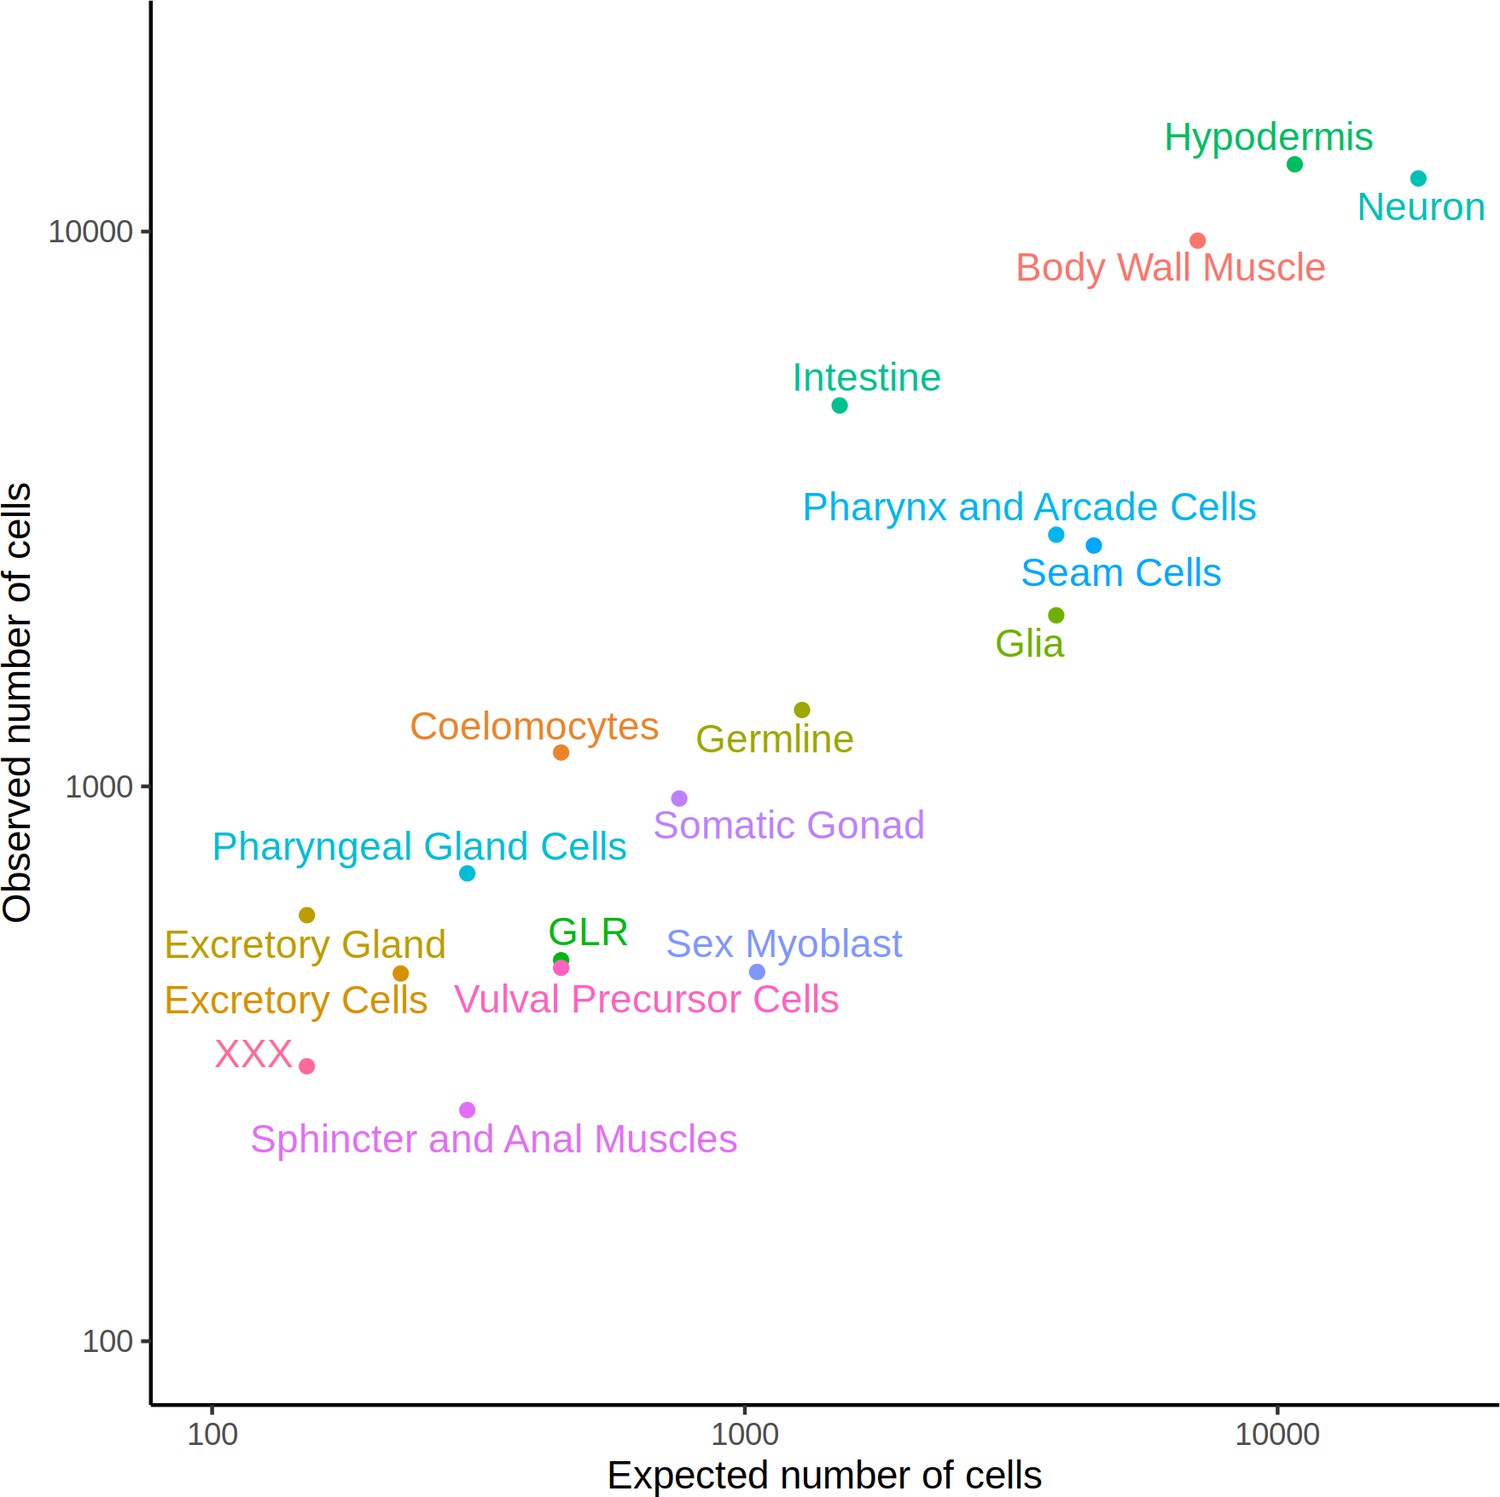
Observed representation of cell types in our dataset compared to expected.
The expected number of cells was calculated by manually curating the cellular lineage information available at https://www.wormatlas.org/ for the L2 stage.
Figure 2
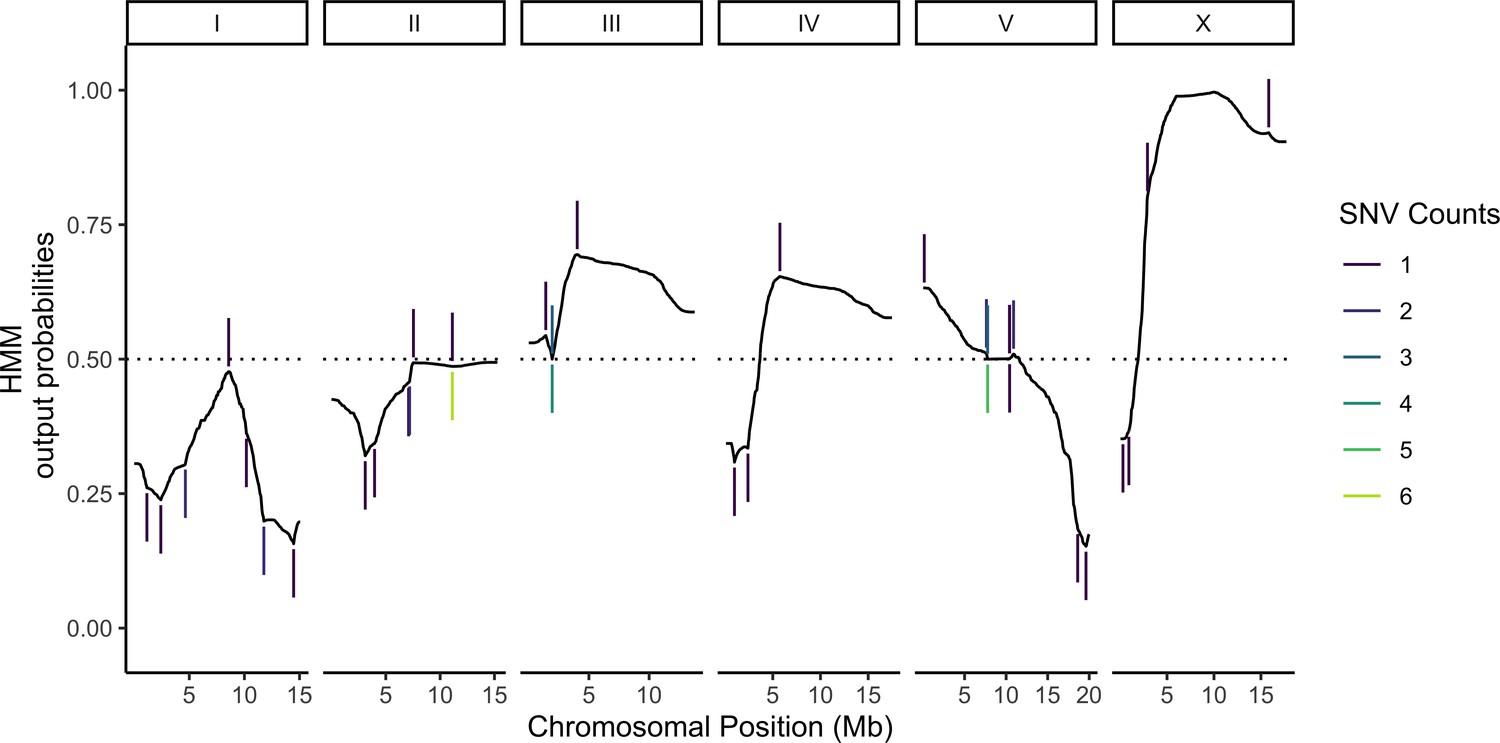
Probabilistic genotyping using a hidden Markov model.
A cell with the median (69) number of unique genotype-informative single-nucleotide variant (SNV) unique molecular identifier (UMI) counts is shown for illustration. The trace is a summation of the probability of a CB4856 homozygous genotype and half the probability of CB4856 heterozygous genotype at each position. Each vertical line is a count for an SNV, and colors correspond to the count depth. Vertical lines pointing upwards denote counts supporting the CB4856 variant, while lines pointing downwards are counts supporting the N2 variant.
Figure 3 with 2 supplements
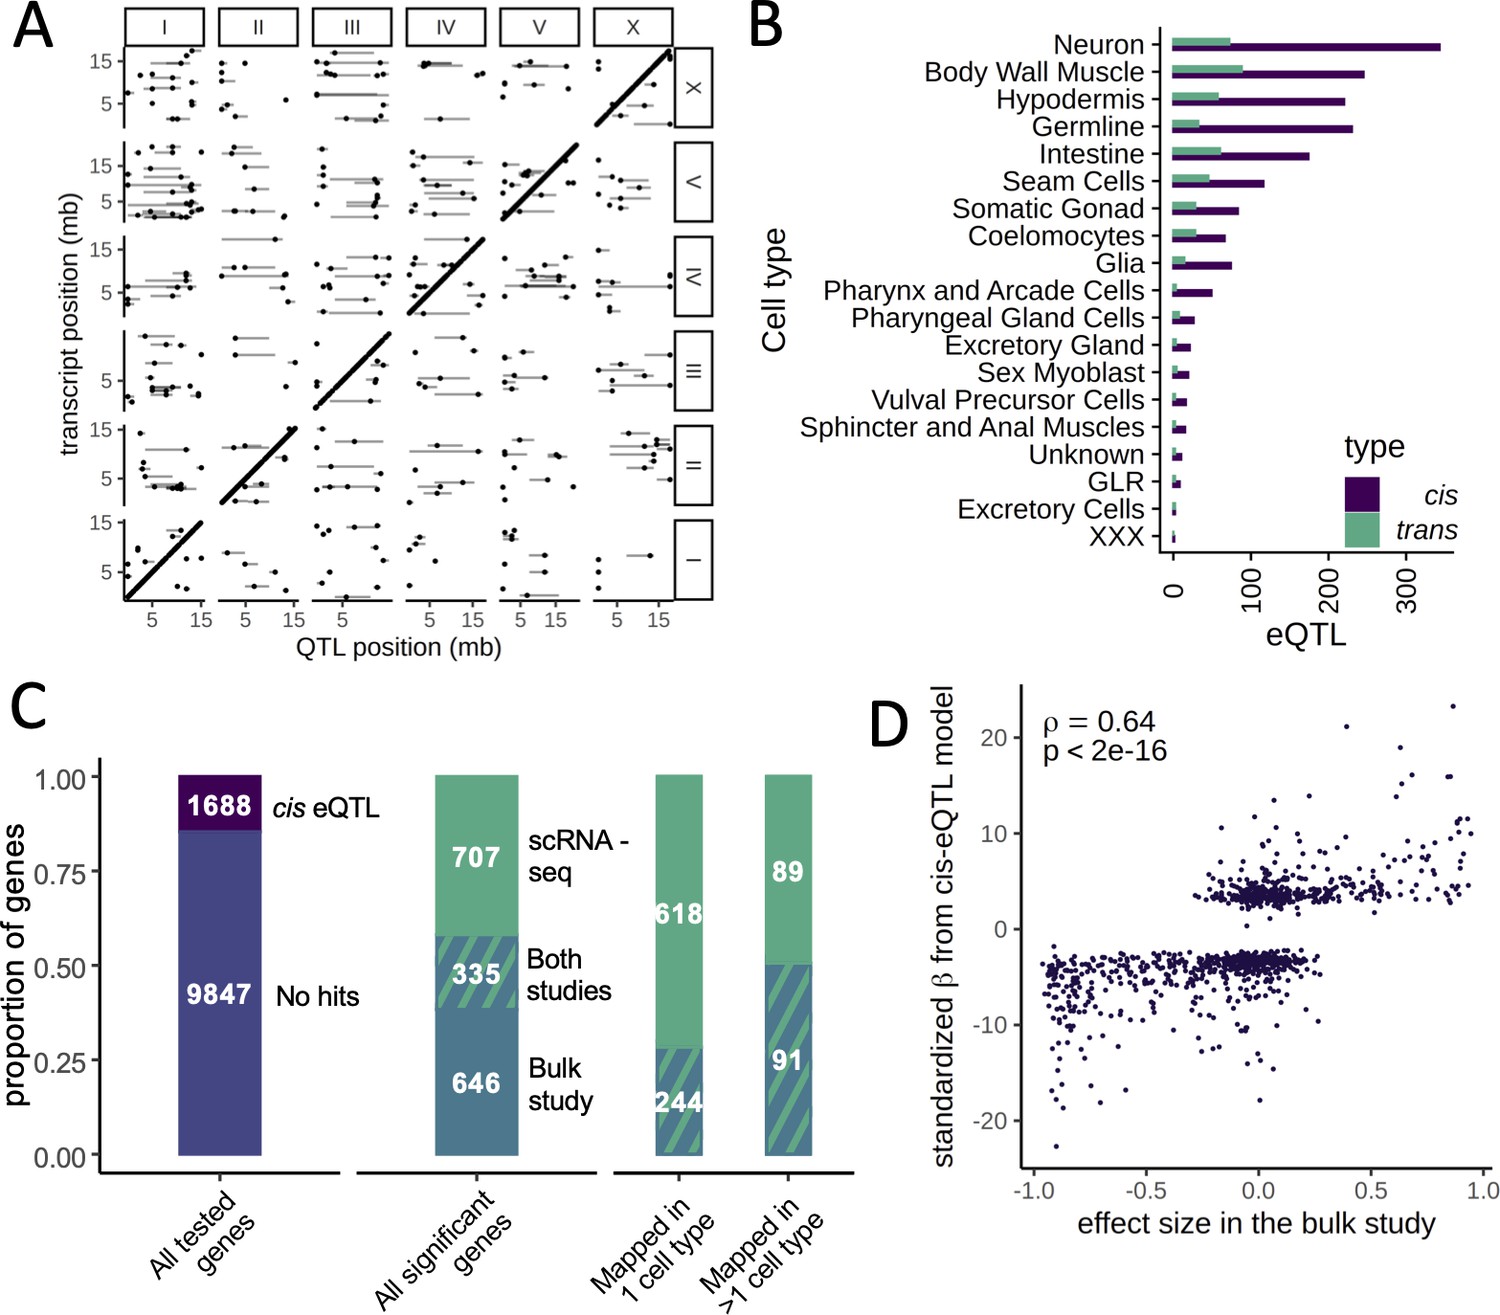
Expression quantitative trait loci (eQTL) mapping in cell types.
(A) A genome-wide map of eQTLs across all cell types is shown. The position of the eQTLs is shown on the x-axis, while the y-axis shows the position of the associated transcripts. Points along the diagonal are cis eQTLs (those mapping to nearby genes). (B) The number of cis and trans eQTLs mapped in each cell type. (C) The overlap between a previous study that mapped eQTLs in whole worms in a panel of recombinant inbred lines and our dataset. (Left) The proportion of genes with a cis eQTL in at least one dataset out of all genes tested. (Middle) Of the 1688 significant cis eQTL genes, 355 had a cis eQTL in both datasets, representing a highly significant enrichment. (Right) Hits mapped in more than one cell type were more likely to also be found in the whole-worm (‘bulk’) dataset. (D) Quantitative comparison between normalized effect sizes in our dataset and in the whole-worm dataset.
Figure 3—figure supplement 1
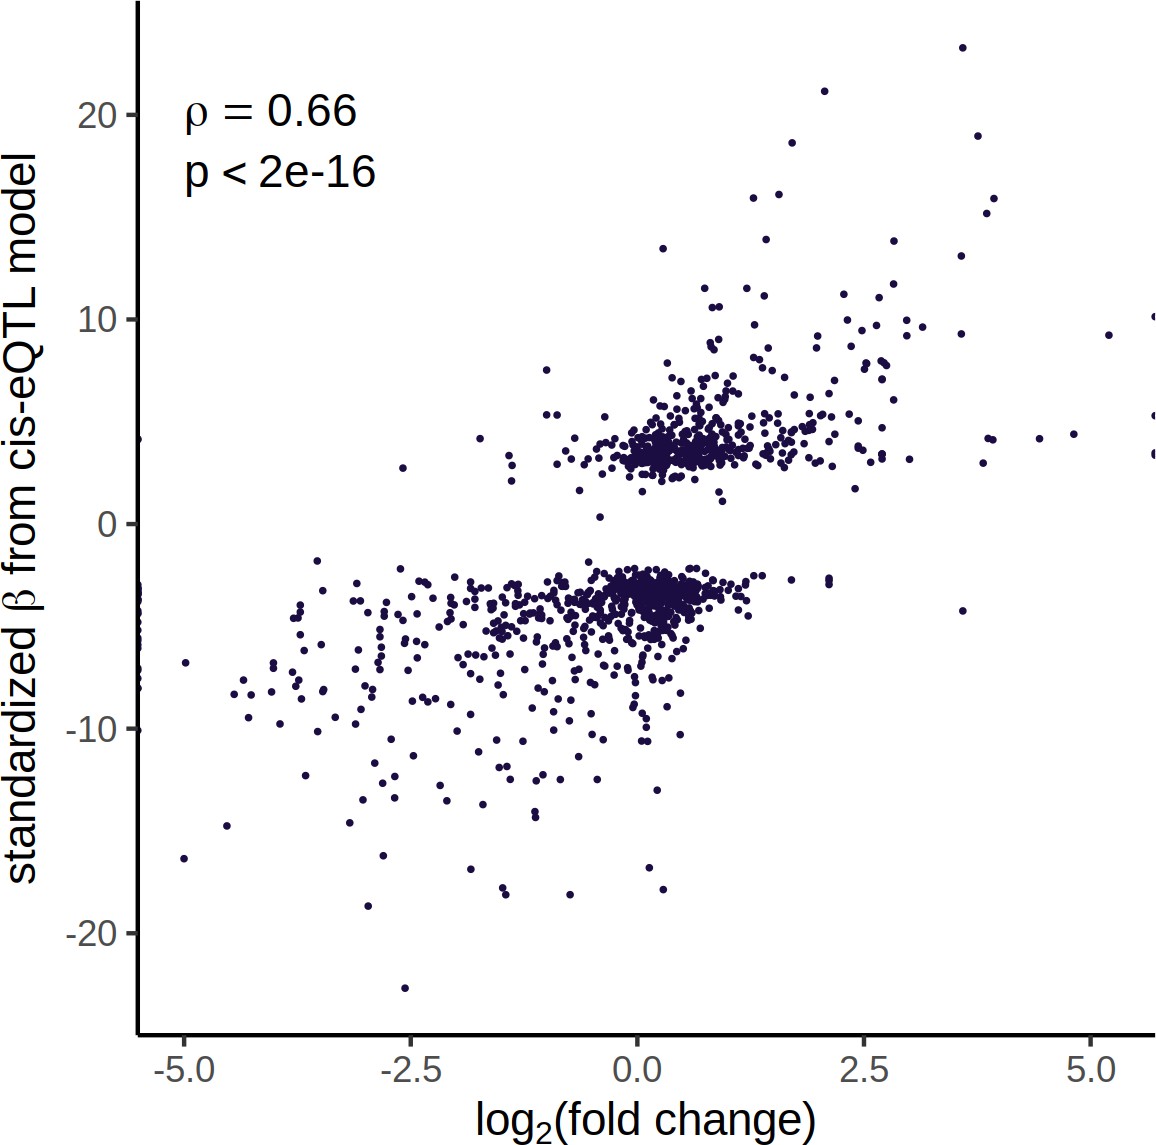
cis expression quantitative trait loci (eQTLs) reflect gene expression differences in the parent strains.
Comparison between cis eQTLs mapped across all cell types and gene expression differences in a dataset of 6721 N2 and 3104 CB4856 cells. For cis eQTLs mapped in multiple cell types, effect sizes were combined using Stouffer’s weighted-Z method (Whitlock, 2005). Differential gene expression between N2 and CB4856 was calculated using R package DEsingle.
Figure 3—figure supplement 2
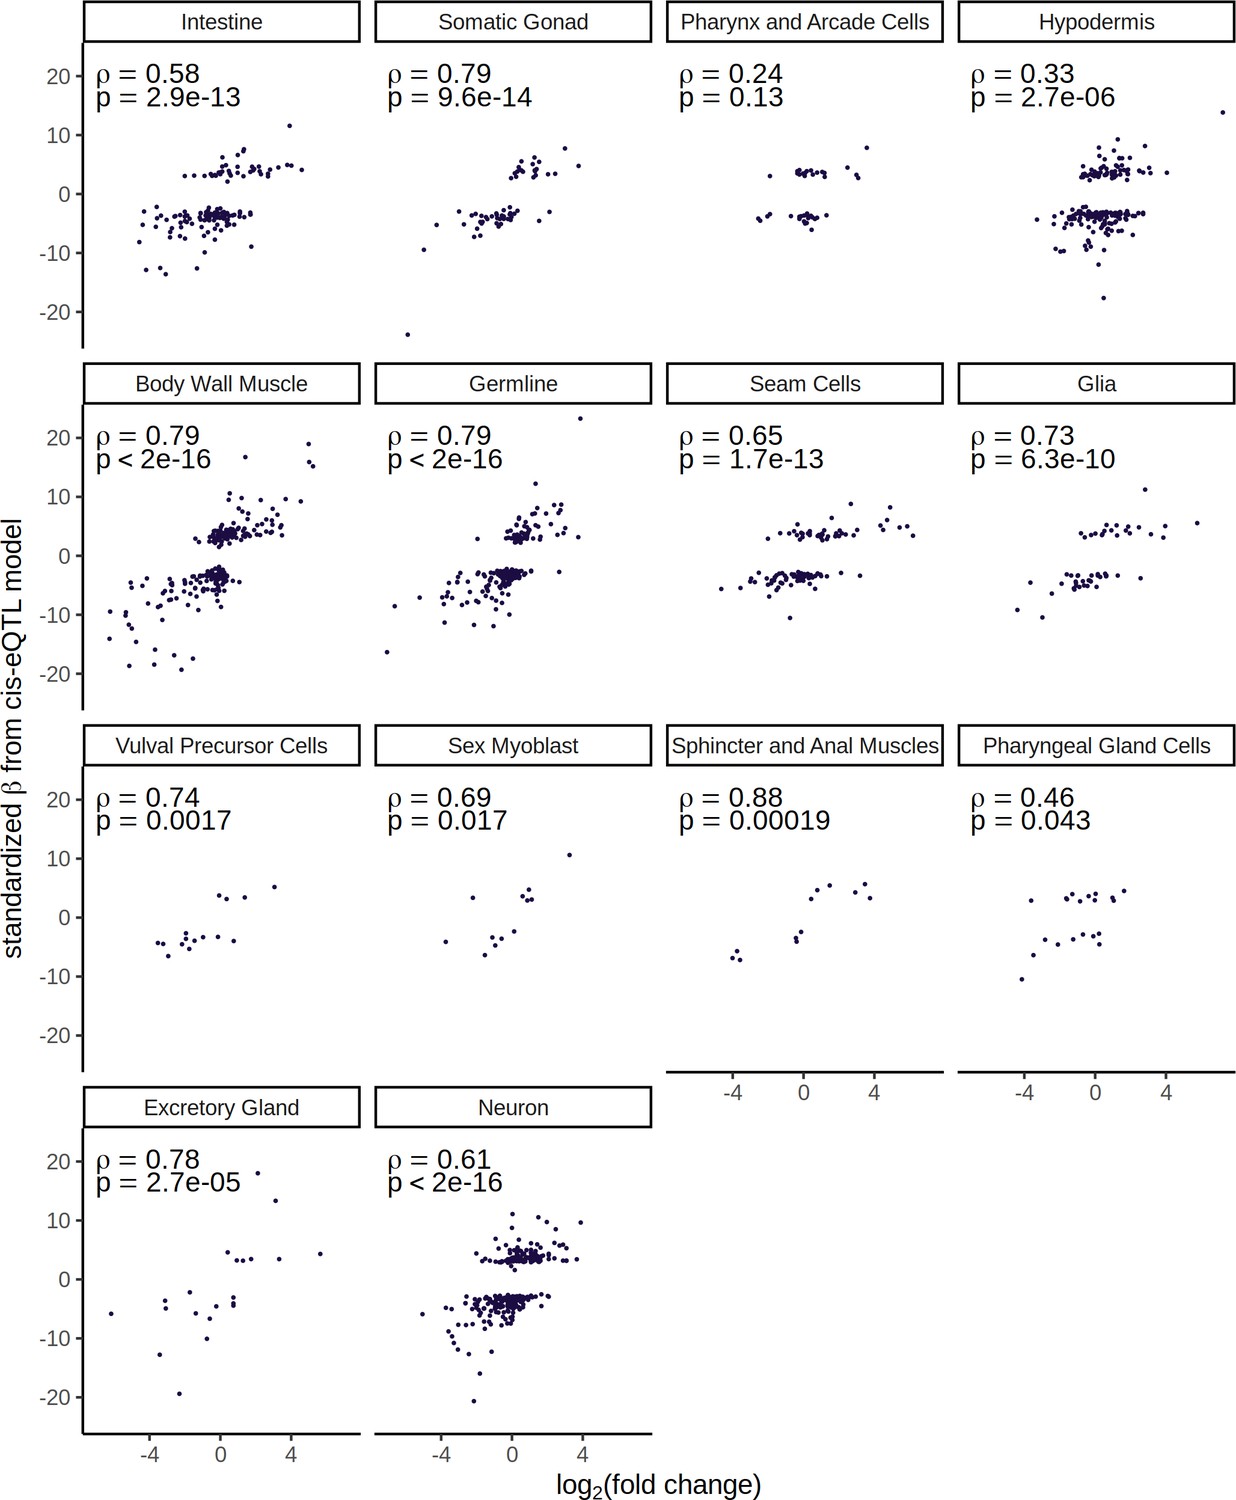
Correlation between cell-type cis expression quantitative trait loci signal and differential gene expression between the parental strains.
The data corresponds to Figure 3—figure supplement 1, split out by each cell type separately.
Figure 4 with 1 supplement
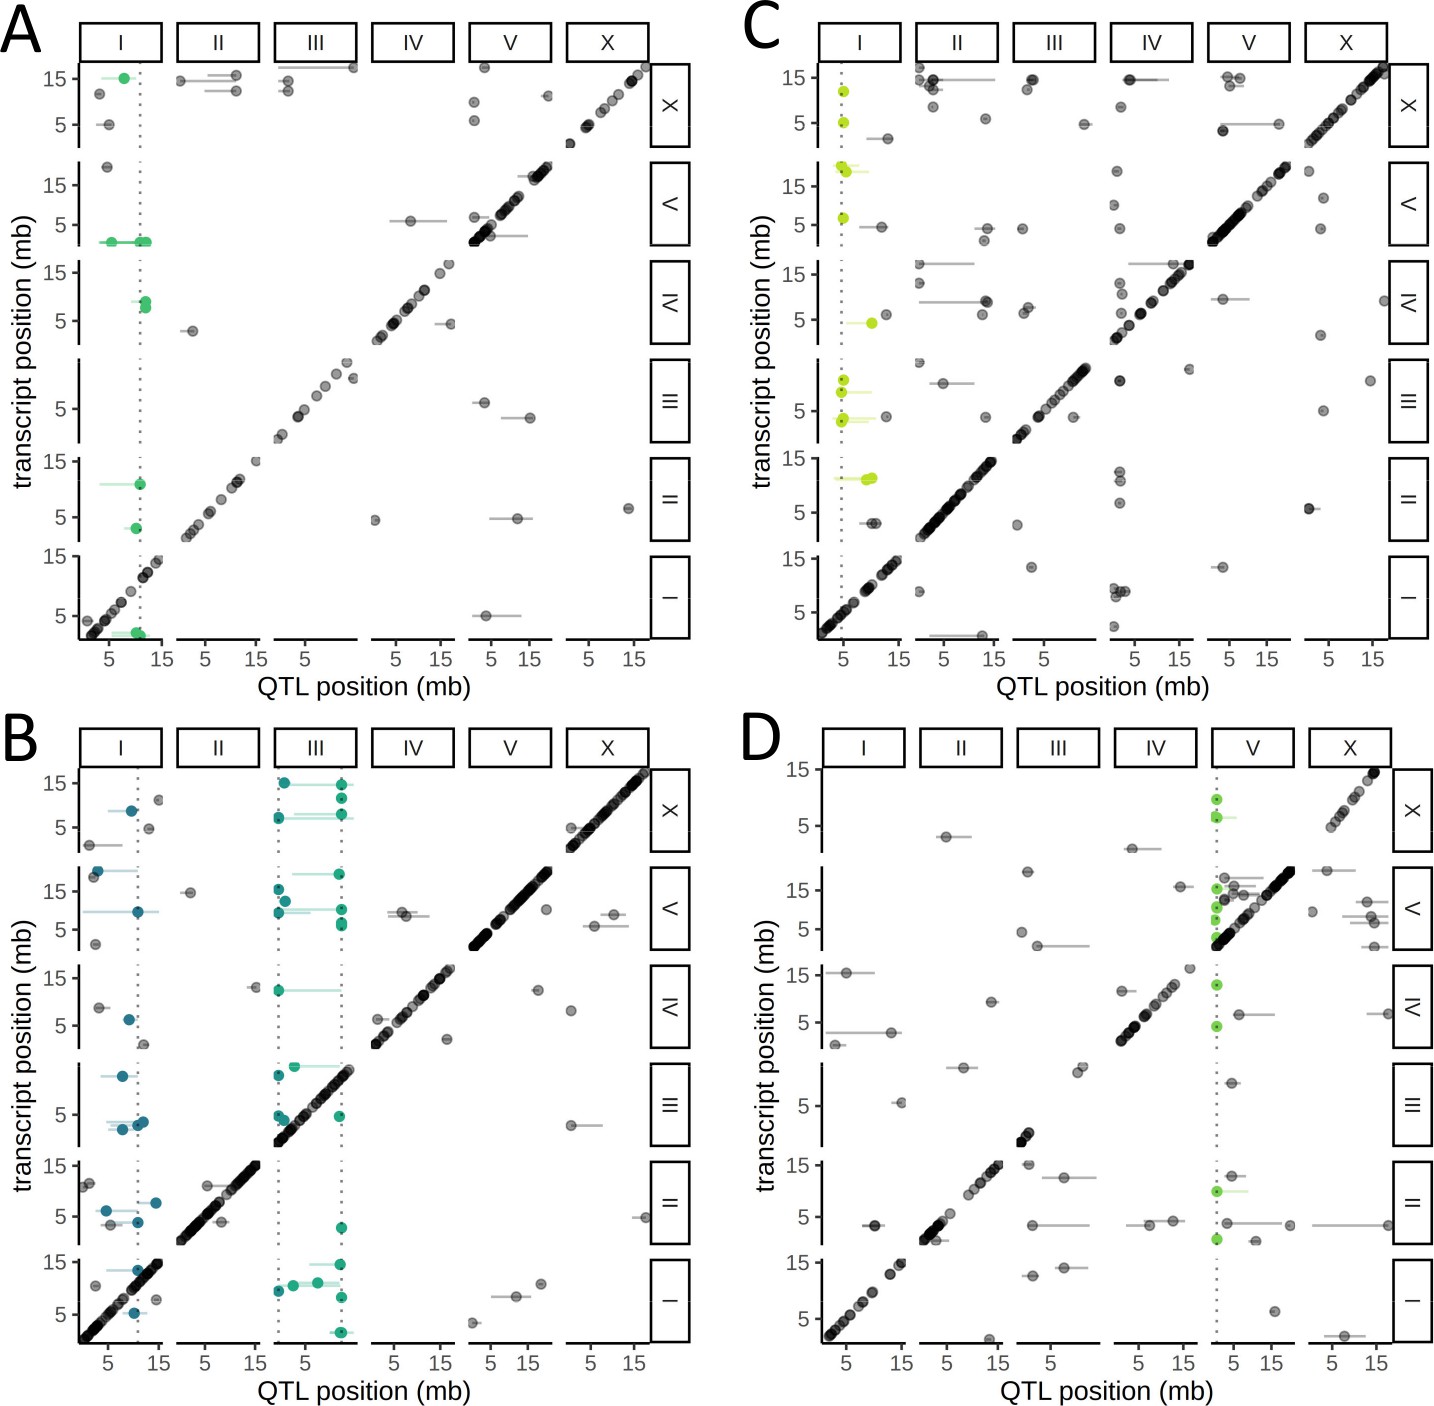
Cell-type-specific trans expression quantitative trait loci (eQTLs) hotspots.
A genome-wide map of eQTLs in seam cells (A), neurons (B), body-wall muscle cells (C), and intestinal cells (D) is shown. The position of the eQTLs is shown on the x-axis, while the y-axis shows the position of the associated transcripts. The dotted line marks the peak position of the hotspot, while targets of each hotspot are colored.
Figure 4—figure supplement 1
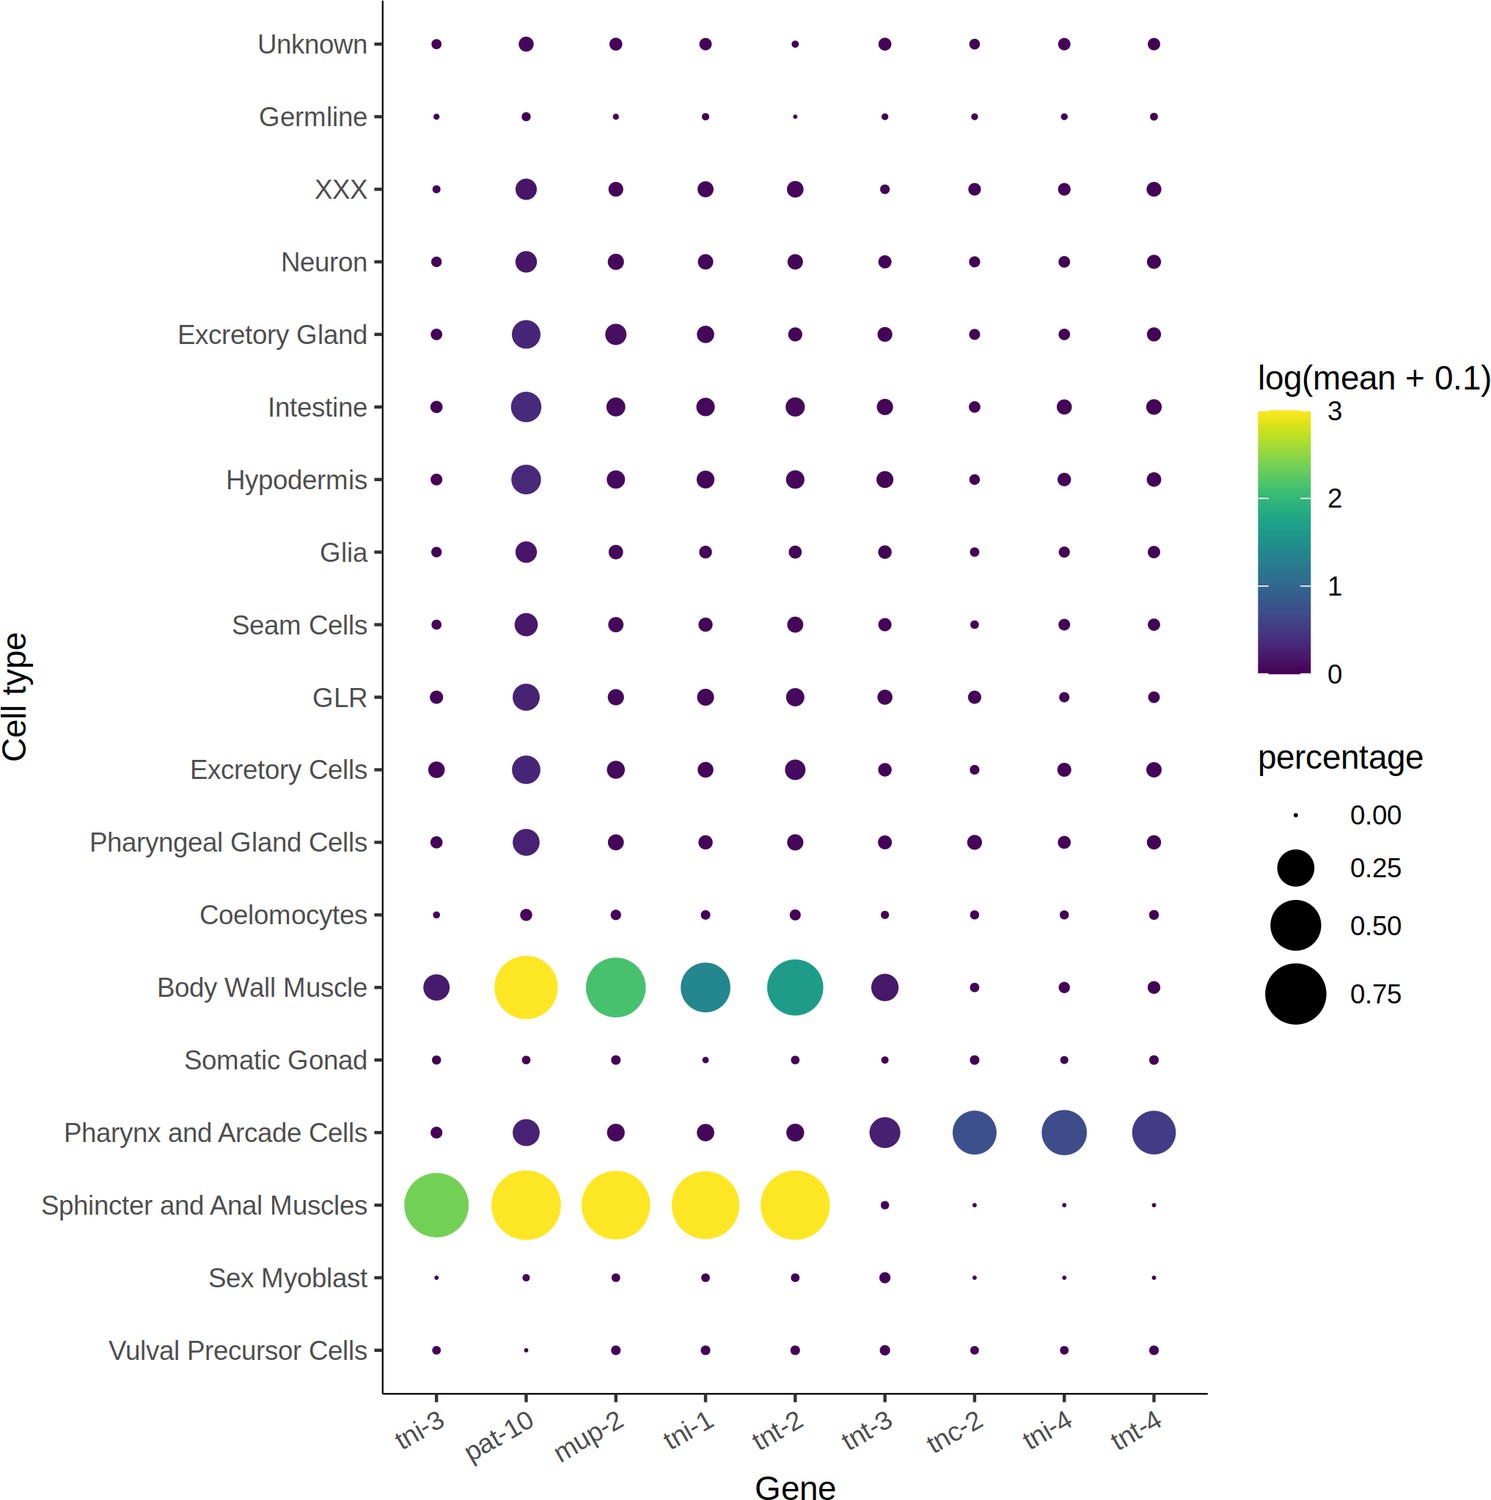
Cell-type expression of genes that form troponin complexes.
Size of circles corresponds to the percentage of cells expressing each gene in each cell type, and the color corresponds to average expression. Of the four troponin genes strongly expressed in the body wall muscle, three are affected by a trans expression quantitative trait loci hotspot on Chr. I.
Figure 5 with 1 supplement

Neuron-specific expression quantitative trait loci (eQTL) mapping.
(A) cis eQTLs mapped in single neuronal subtypes (sn-eQTLs) are shown. The top three rows indicate whether the eQTL was mapped pan-neuronally at a 10% false discovery rate (FDR) threshold (row 1), at a 50% FDR threshold (row 2), and whether the sign of the effect estimate (‘effect direction’) was the same in the pan-neuronal and single-cell mapping (row 3). (B) Comparing the effect direction between the sn-eQTL mapping and mapping in a set of neurons excluding the sn-eQTL neuron shows evidence for subtype-specific effects. The number of genes showing the same (‘purple’) or opposite (‘turquoise’) effect directions is shown for genes with pan-neuronal FDR > 50% (top) and <50% (bottom). (C, D) An eQTL with antagonistic effects in two neurons. Higher expression of the gene nlp-21 in the RIM neuron is associated with the N2 allele (C), while higher expression in the RIC neuron is associated with the CB4856 allele (D). In (C) and (D), a linear fit is shown for illustration. All p-values are FDR-corrected. Read counts were normalized to the number of UMIs in each cell and log-transformed. (E) Expression of nlp-21 in the parental dataset. The direction of effect is concordant between the left panel and (C) (RIM neuron) and between the middle panel and (D) (RIC neuron). Horizontal lines are averages.
Figure 5—figure supplement 1
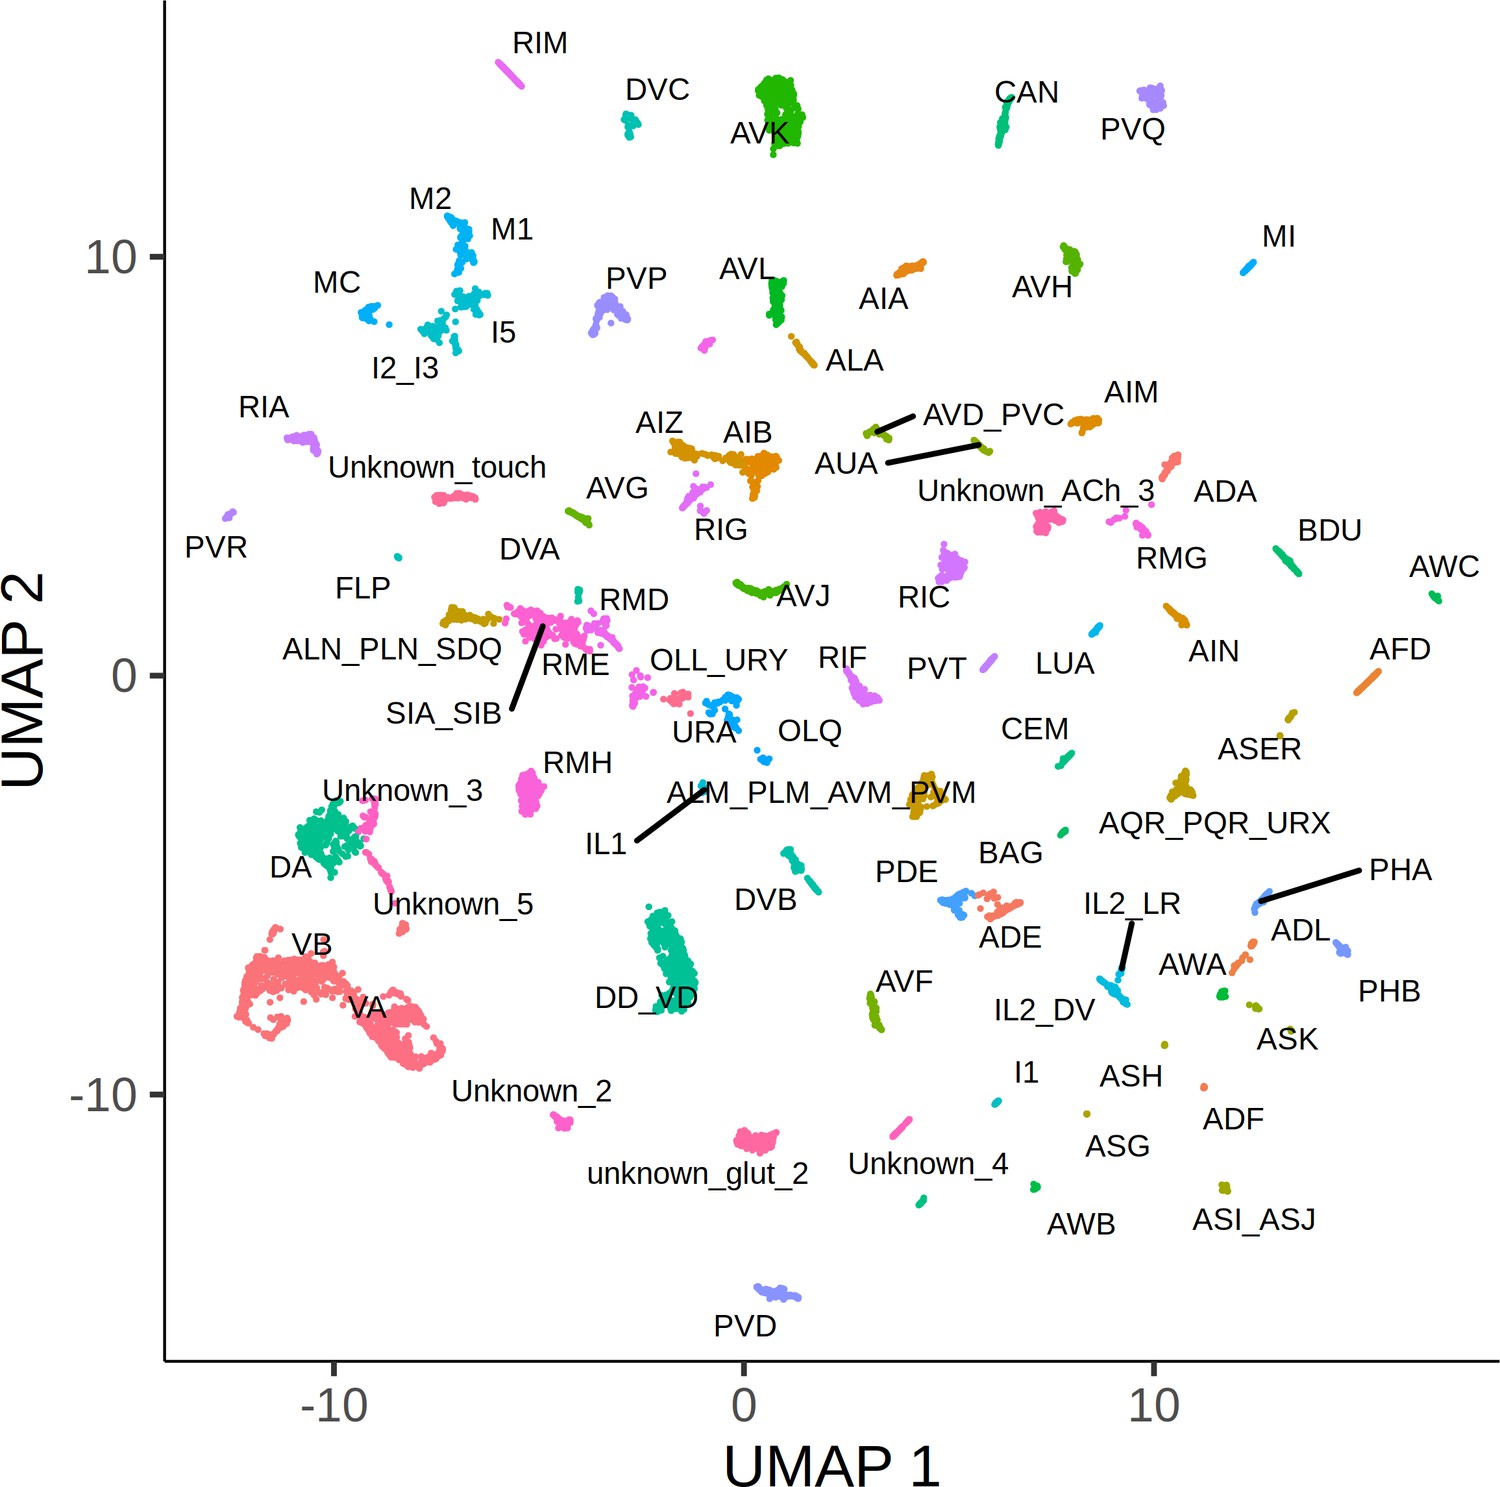
Uniform Manifold Approximation and Projection of 12,468 neurons.
Each cluster is labeled based on the neuronal identity. Clusters represent either single neurons or few neurons with shared function.
Tables
Key resources table
| Reagent type (species) or resource | Designation | Source or reference | Identifiers | Additional information |
|---|---|---|---|---|
| Strain, strain background (Caenorhabditis elegans) | N2 fog-2(q71) V; hsp-90p::GFP II | Burga et al., 2019 | QX2314 | A C. elegans strain carrying a fog-2 and a daf-21p::GFP reporter in the N2 genetic background |
| Strain, strain background (Caenorhabditis elegans) | CB4856 fog-2(kah89) | Burga et al., 2019 | PTM299 | A C. elegans strain carrying a fog-2 mutation in the PTM299 genetic background |
| Commercial assay or kit | Chromium Single Cell 3' v3 | 10x Genomics | CG000201 | |
| Software, algorithm | Monocle3 | Cao et al., 2019 | Available at: https://cole-trapnell-lab.github.io/monocle3/ | |
| Software, algorithm | eQTL mapping code | This paper | Available at: https://github.com/joshsbloom/single_cell_eQTL; copy archived at swh:1:rev:321e29c20cecab726426053bc5a6160b66284691; Ben-David, 2021a | |
| Software, algorithm | Code to reconstruct figures and calculate all numbers in the manuscript | This paper | Available at: https://github.com/eyalbenda/worm_sceQTL; copy archived at; swh:1:rev:e30eb7d2a393459b2367dfe22c07966e44364f20; Ben-David, 2021b |
Additional files
-
Supplementary file 1
Tables S1–S6.
- https://cdn.elifesciences.org/articles/65857/elife-65857-supp1-v2.xlsx
-
Transparent reporting form
- https://cdn.elifesciences.org/articles/65857/elife-65857-transrepform-v2.docx
Download links
A two-part list of links to download the article, or parts of the article, in various formats.
Downloads (link to download the article as PDF)
Open citations (links to open the citations from this article in various online reference manager services)
Cite this article (links to download the citations from this article in formats compatible with various reference manager tools)
Whole-organism eQTL mapping at cellular resolution with single-cell sequencing
eLife 10:e65857.
https://doi.org/10.7554/eLife.65857


