Homoplasy in the evolution of modern human-like joint proportions in Australopithecus afarensis
- Anthropology, Dartmouth College, United States
- Ecology, Evolution, Ecosystems, and Society, Dartmouth College, United States
- Department of Anthropology, Texas A&M University, United States
- Center for the Study of Human Origins, Department of Anthropology, New York University, United States
- New York Consortium in Evolutionary Primatology, United States
Figures
Figure 1
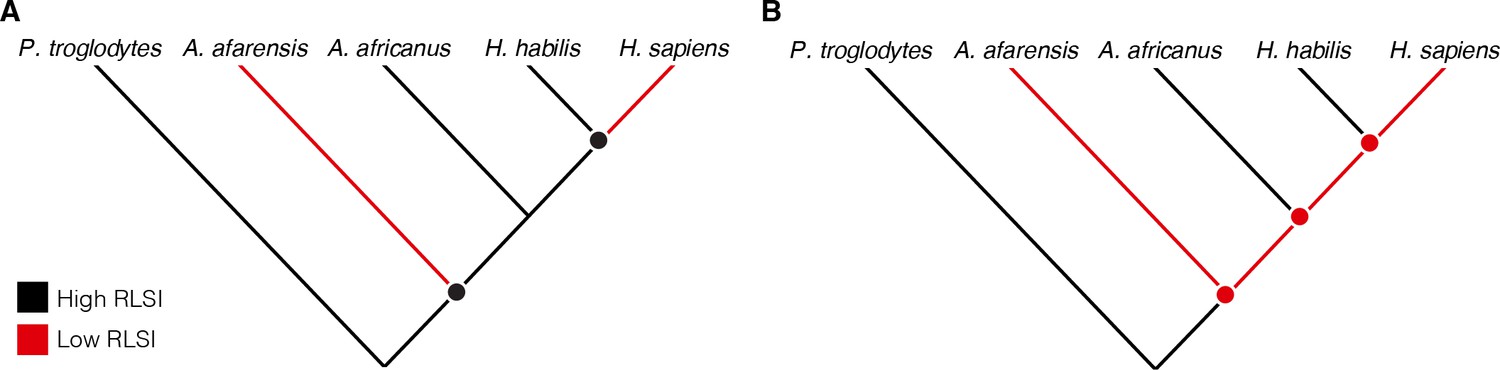
Alternative hypotheses to explain the pattern of limb joint proportions observed in the human fossil record.
Previous work interpreted the human-like ratio of upper to lower limb joint size (relative limb size index [RLSI]) in Australopithecus afarensis to indicate either (A) homoplasy between A. afarensis and Homo sapiens or (B) evolutionary reversals to a more ape-like body form in A. africanus and H. habilis.
Figure 2 with 26 supplements
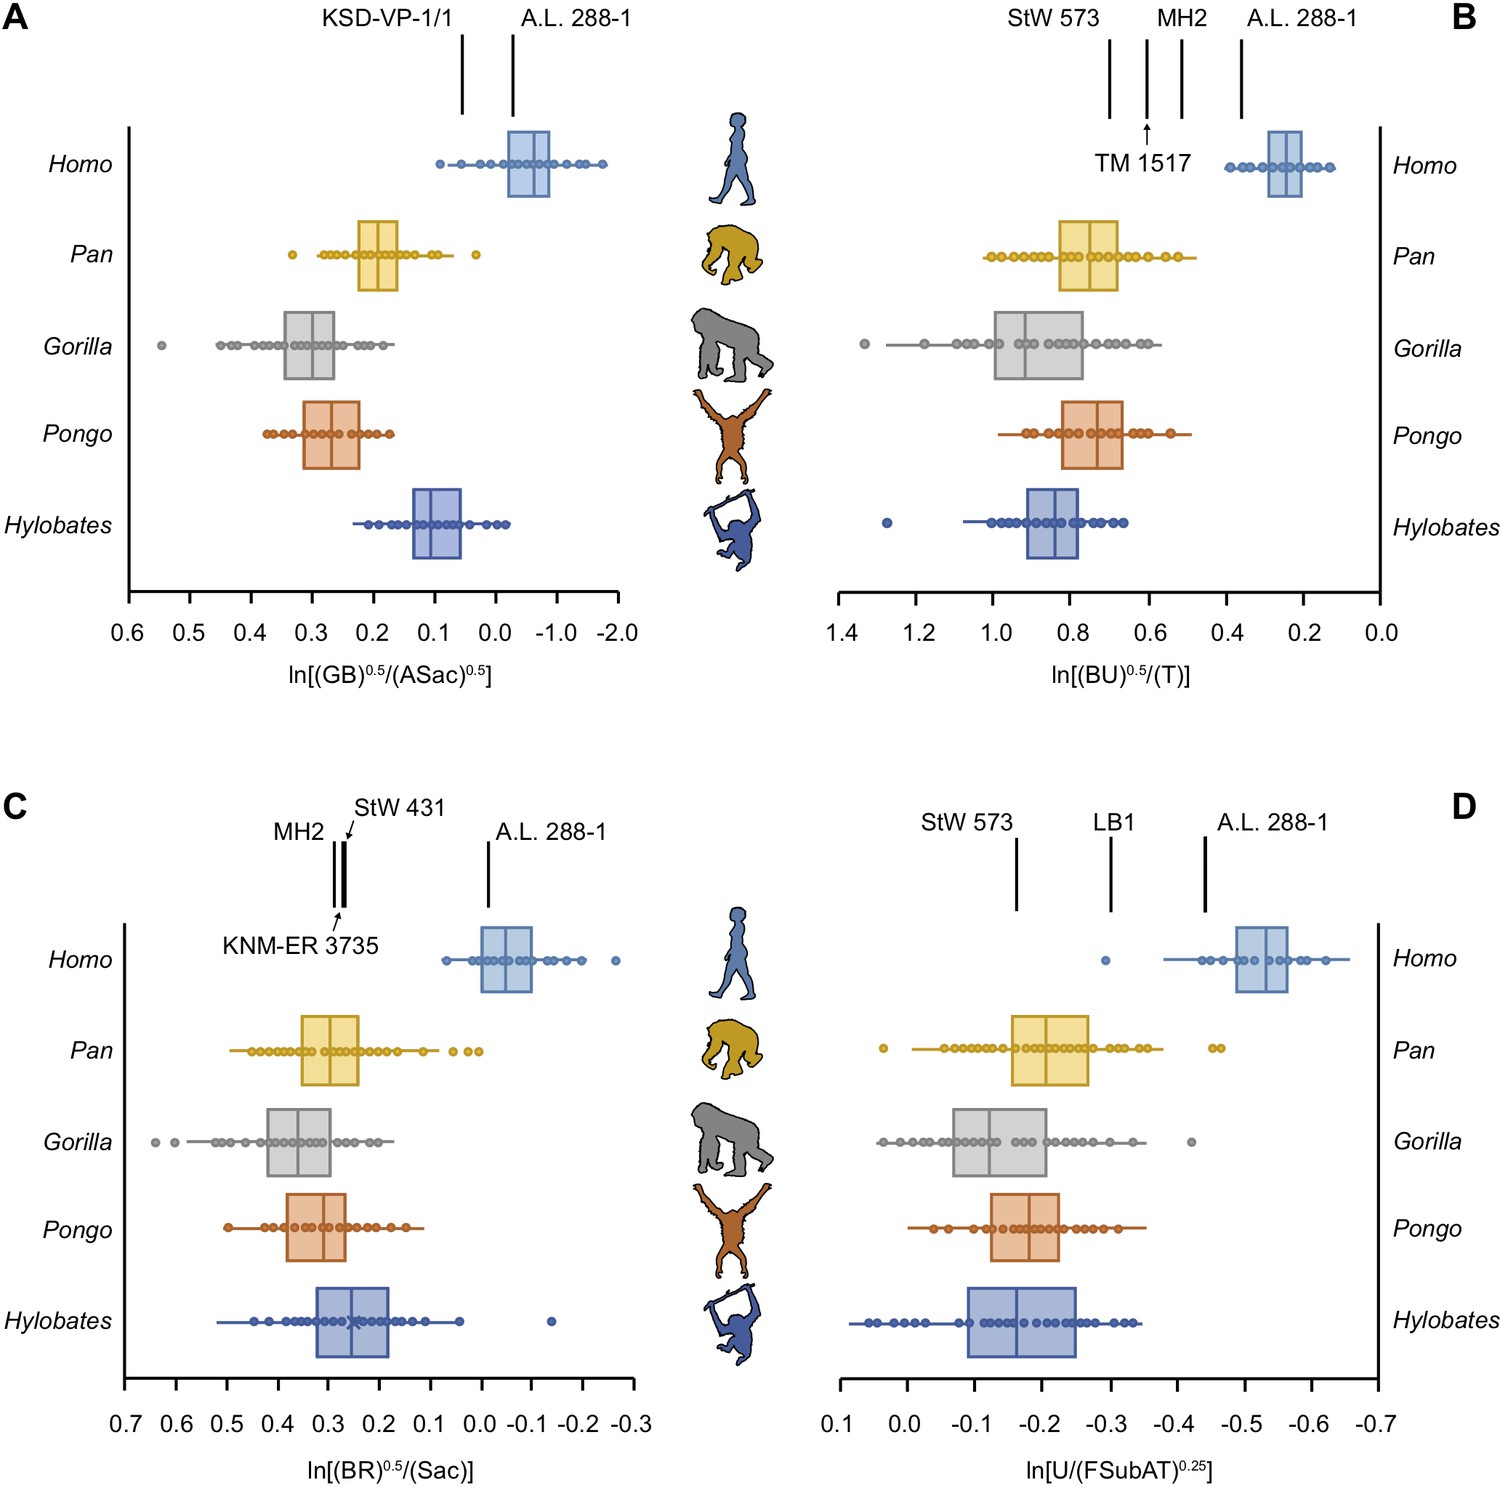
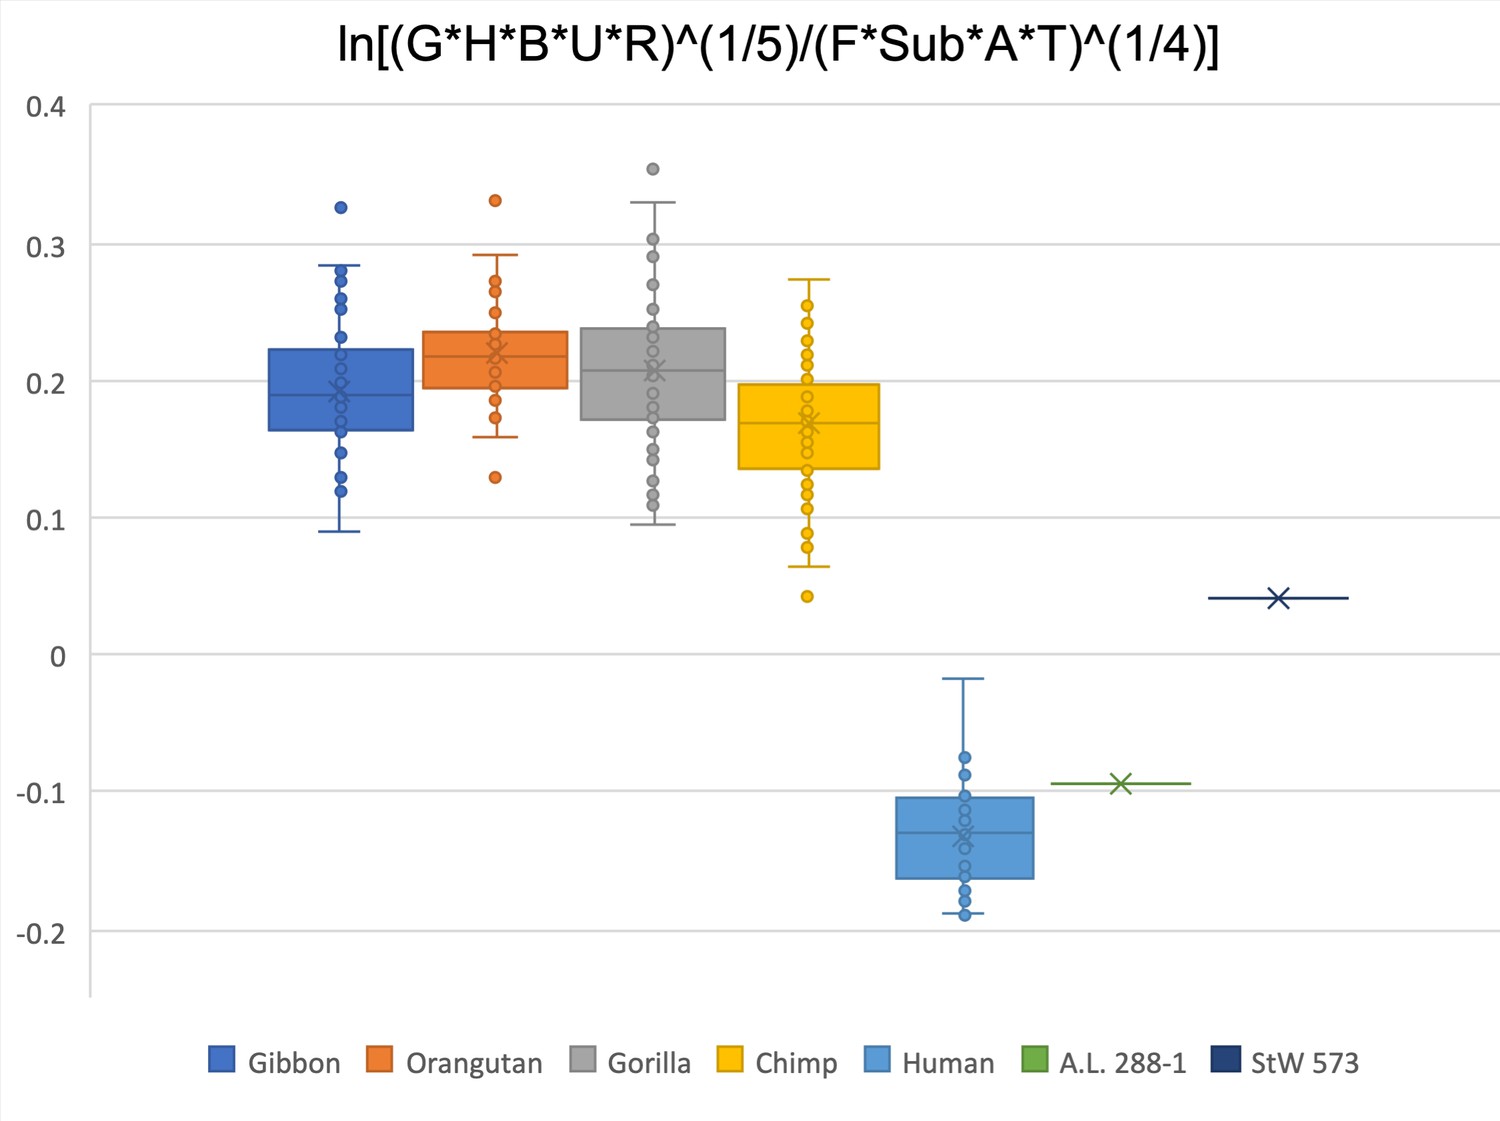
Relative limb size index (RLSI) in modern apes, humans, and fossil hominins.
Notice that A.L. 288-1 (Lucy) falls within the modern human distribution for RLSI no matter which combination of upper to lower limb joint proportions is examined (A–D). (A) Human-like upper to lower limb joint proportions remain human-like on the basis of preserved elements in a second partial skeleton of A. afarensis, KSD-VP-1/1. However, all other partial skeletons of Australopithecus (A–C), Paranthropus (B) and early Homo (C) are more ape-like. A high, ape-like RLSI is present even in the late Pleistocene hominin H. floresiensis (D).
-
Figure 2—source data 1
Raw measurements on extant primate skeletons.
- https://cdn.elifesciences.org/articles/65897/elife-65897-fig2-data2-v1.xlsx
Figure 2—figure supplement 1
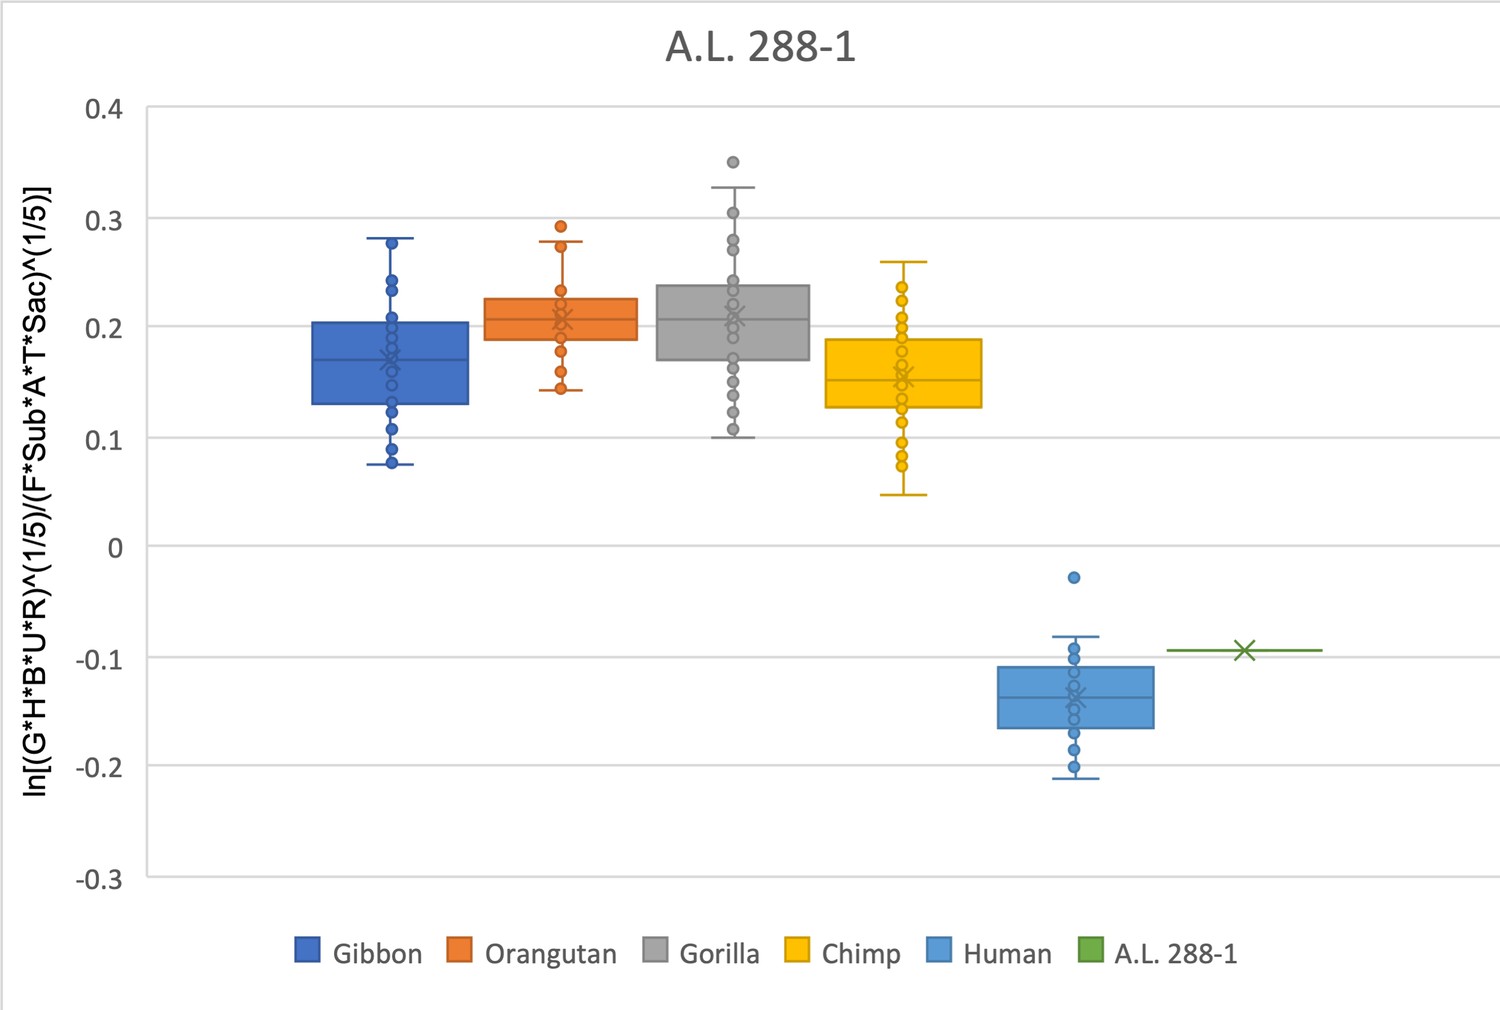
The relative limb size index of A.L. 288-1 falls within the interquartile range of modern humans and well outside the range of any modern ape.
The measurements used were derived from Johanson et al., 1982 and from observations made on both the original fossil material and confirmed on research-quality casts.
Figure 2—figure supplement 2
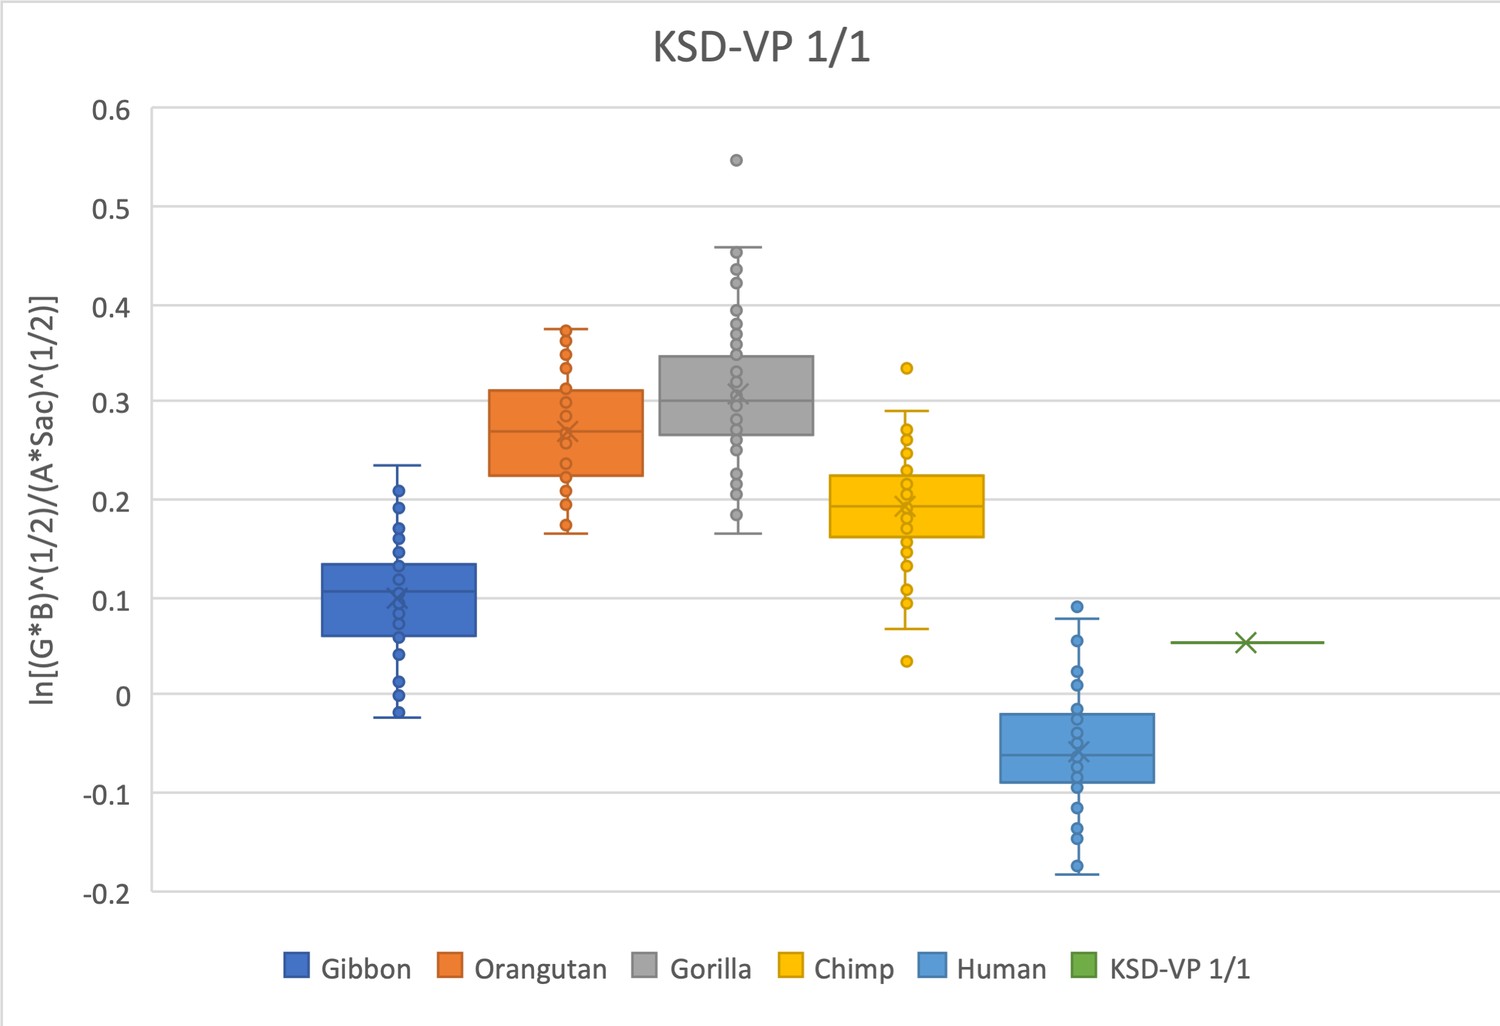
The relative limb size index of KSD-VP-1/1 falls within the interquartile range of modern humans and gibbons and is within the range of Pan when outliers are considered.
The measurements used were derived from Haile-Selassie et al., 2010; Haile-Selassie and Su, 2015 and personal observations made by SW.
Figure 2—figure supplement 3
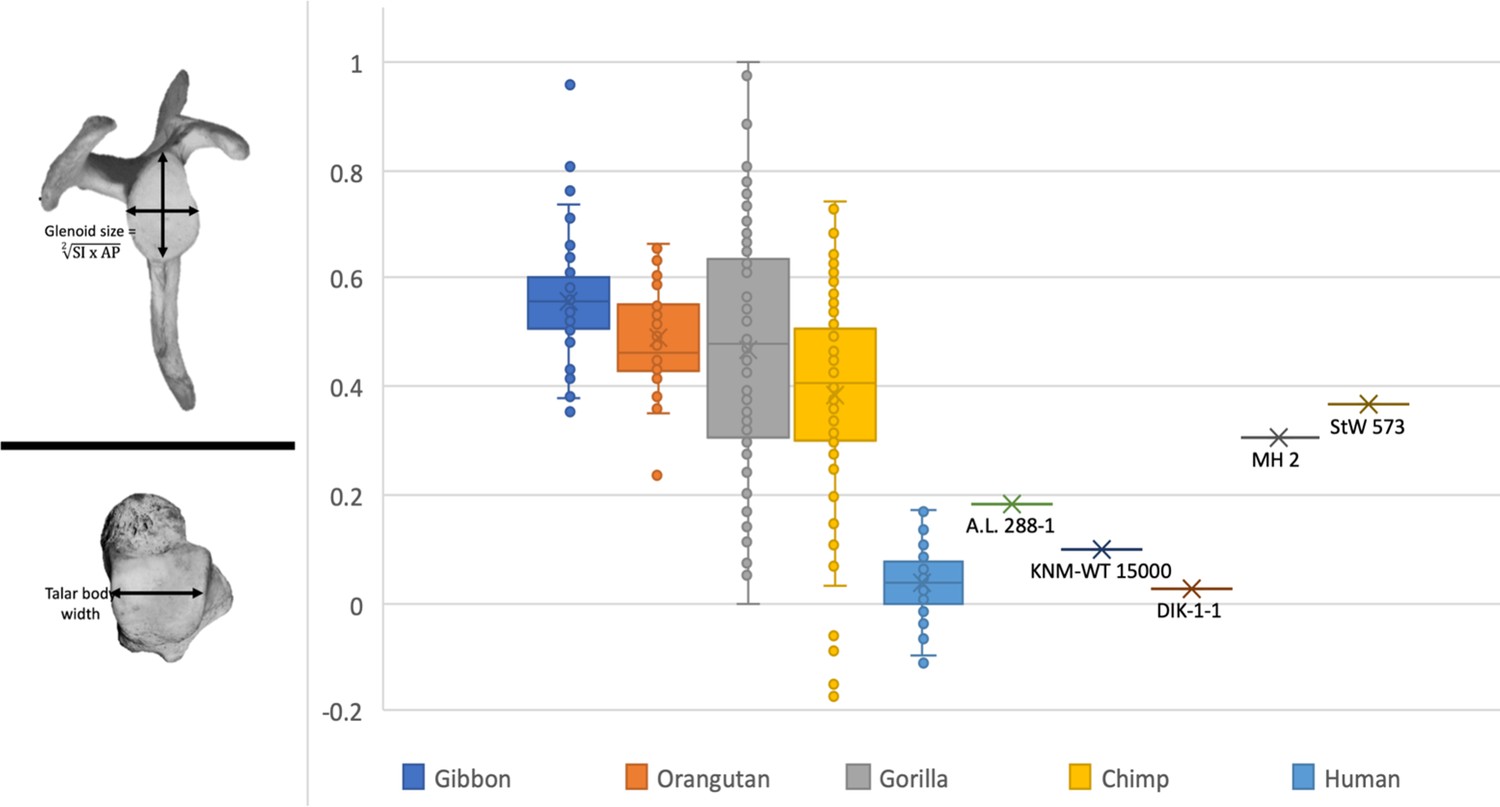
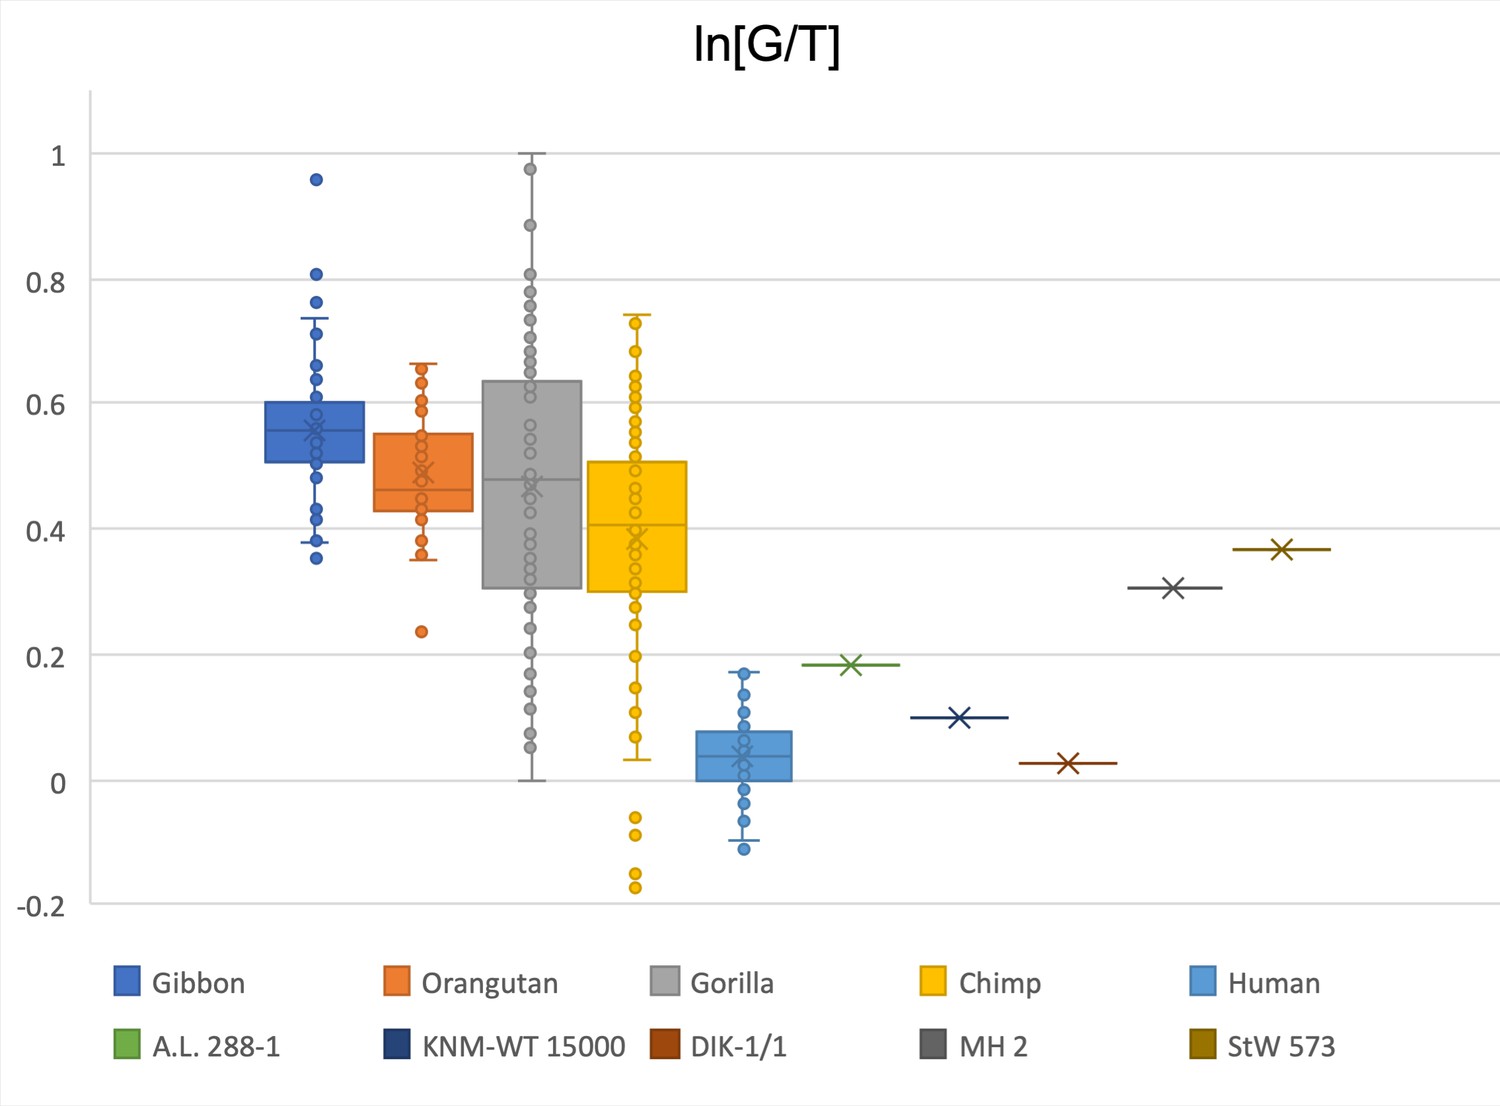
Here, the relative limb size index is a simple ratio of the glenoid size to the width of the talar body—measurements known from the juvenile Australopithecus afarensis skeleton from Dikika, Ethiopia (measurements published in Green and Alemseged, 2012; DeSilva et al., 2018b).
The glenoid size is an average of the left and right values reported in Green and Alemseged, 2012. Even though the comparative data used in this study are from adult apes and humans, the inclusion of DIK-1-1 is consistent with what has been reported throughout this study: A. afarensis had human-like proportions, whereas other australopiths—in this case, A. sediba (MH2) and StW 573—have African ape-like limb joint proportions. Nevertheless, the findings reported here should be re-evaluated with a juvenile sample from extant apes and humans.
Figure 2—figure supplement 4
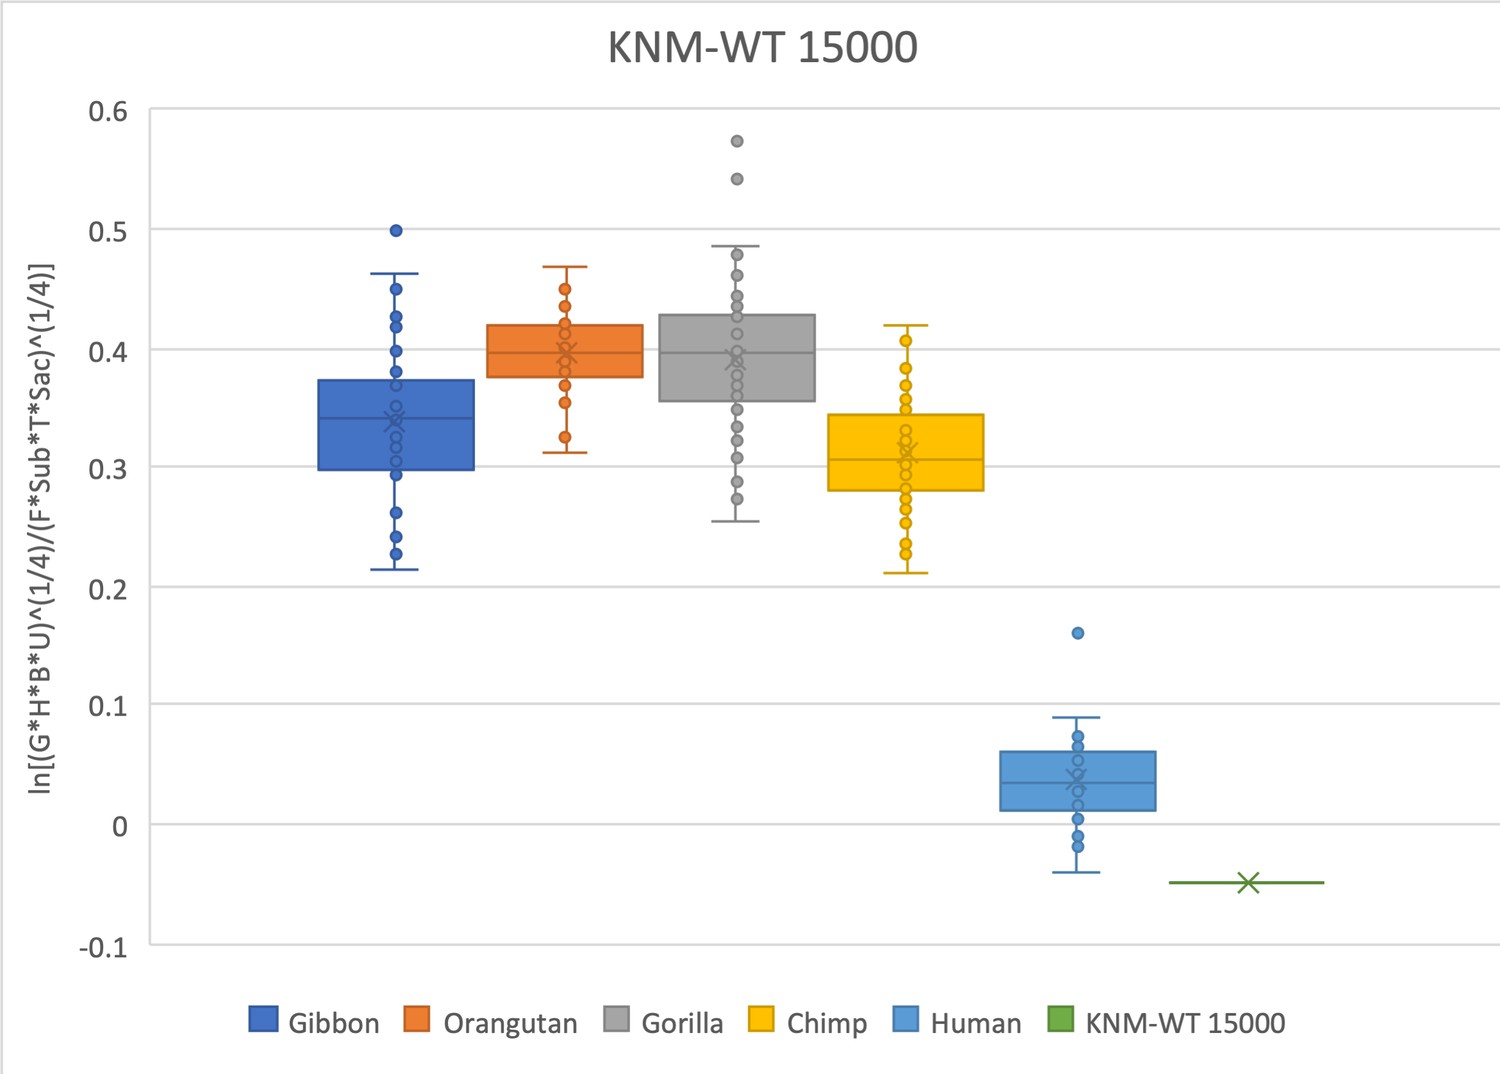
The relative limb size index of KNM-WT 15000 is human-like and well outside the range of modern apes.
Measurements were derived from Walker and Leakey, 1993 and confirmed with observations made on the original fossils and high-quality research casts from the National Museums of Kenya. Note that KNM-WT 15000 is a juvenile individual and is compared here with extant specimens that are skeletally adult. The talus was not recovered and was estimated from the mediolateral width of the talar facet of the distal tibia using an equation (y = 0.9887x * 0.7606) obtained from associated tibiae and tali of N = 79 Homo sapiens reported in DeSilva, 2011.
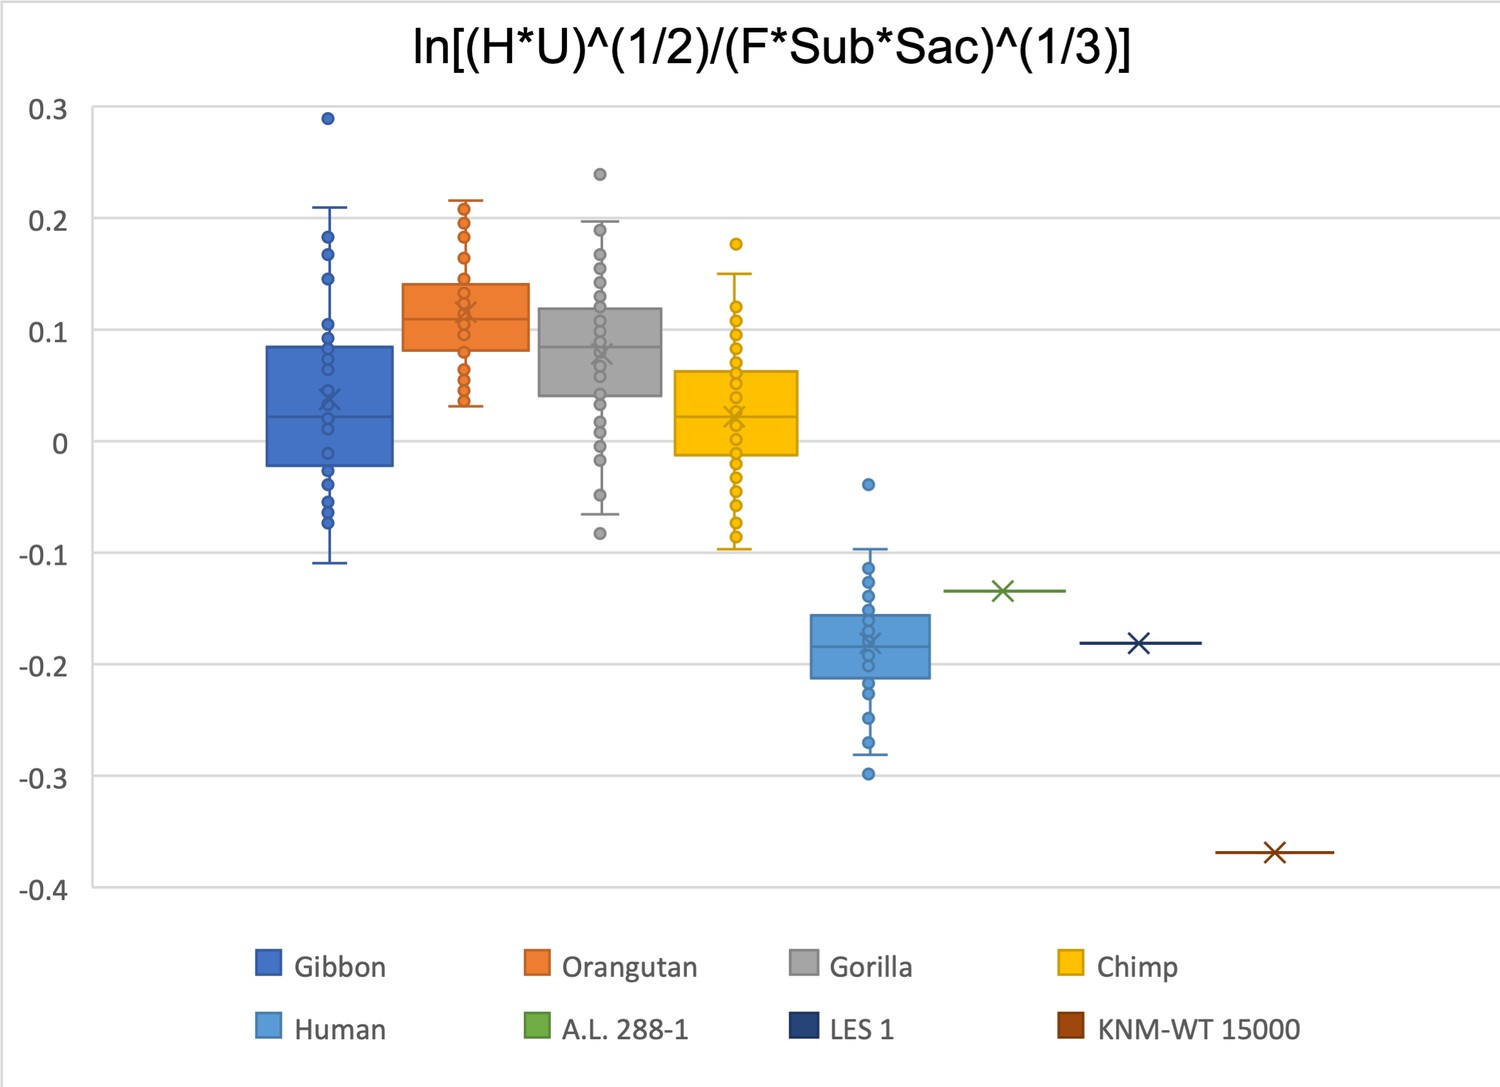
Figure 2—figure supplement 5

Relative limb size index (RLSI) of LES 1 (Neo) from Homo naledi.
Notice that the RLSI of LES 1 is decidedly human-like, falling well outside the range of distribution in any extant ape. Measurements were derived from the literature (Hawks et al., 2017; Feuerriegel et al., 2019; Walker et al., 2019) and confirmed with observations made on the original fossil material and 3D printouts generated from surface scans available on www.morphosource.org.
Figure 2—figure supplement 6
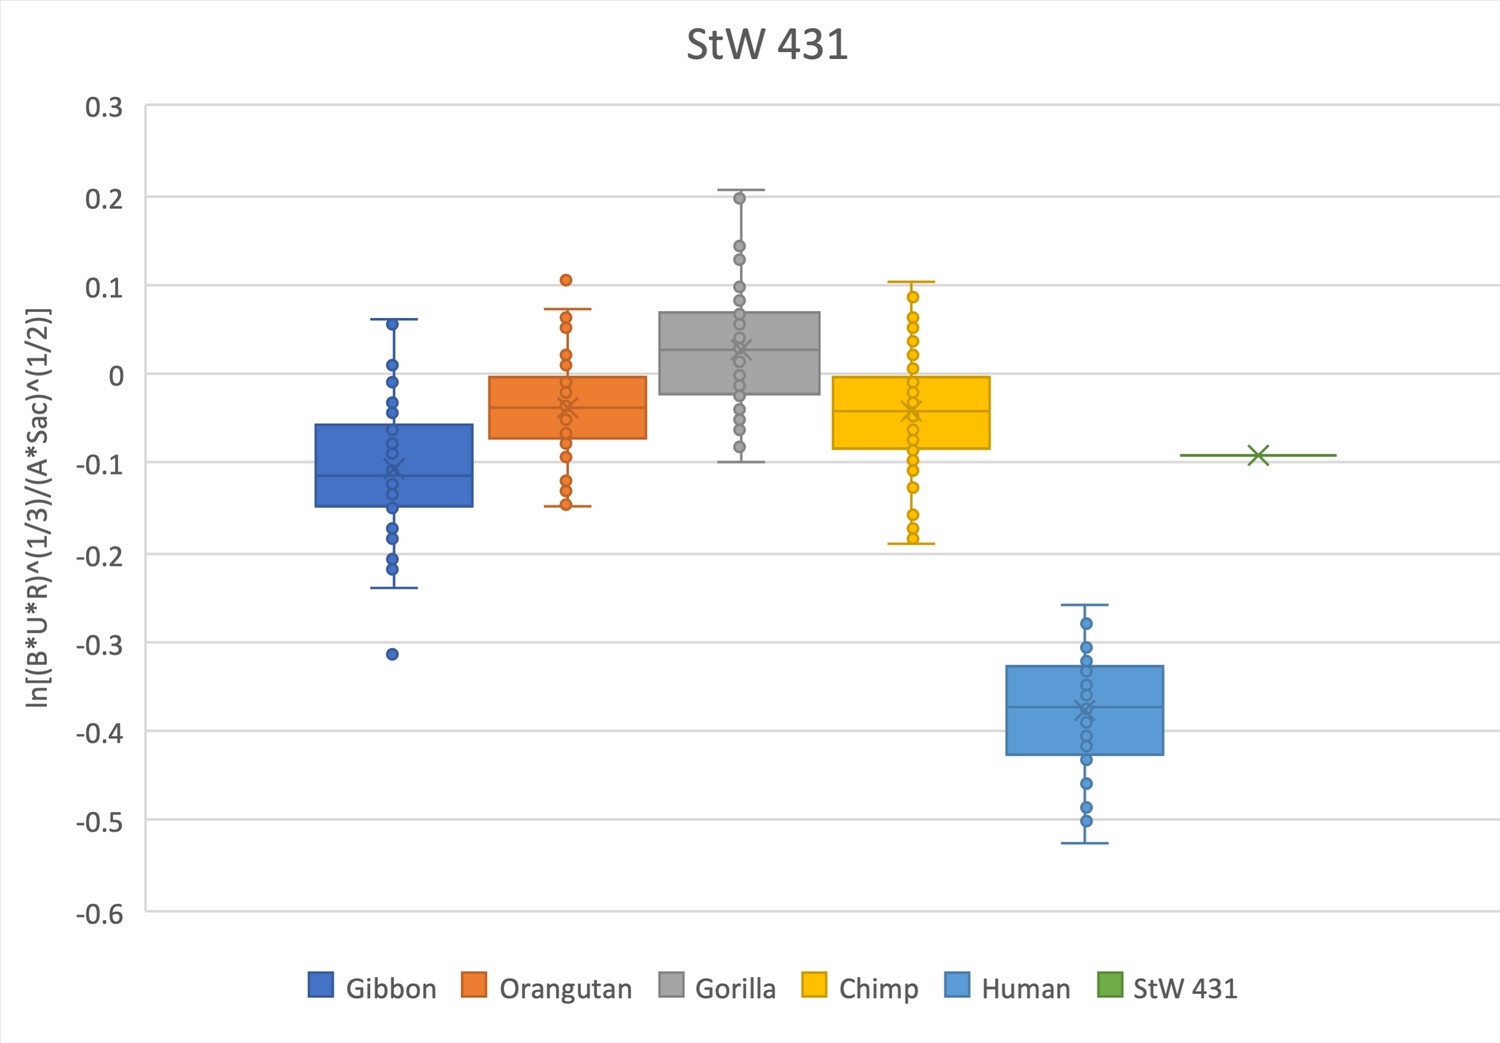
The relative limb size index of StW 431 is decidedly ape-like, positioned within the interquartile range of hylobatids and within the range of all modern great apes, well outside the distribution of modern humans.
The measurements used were taken on the original fossil material.
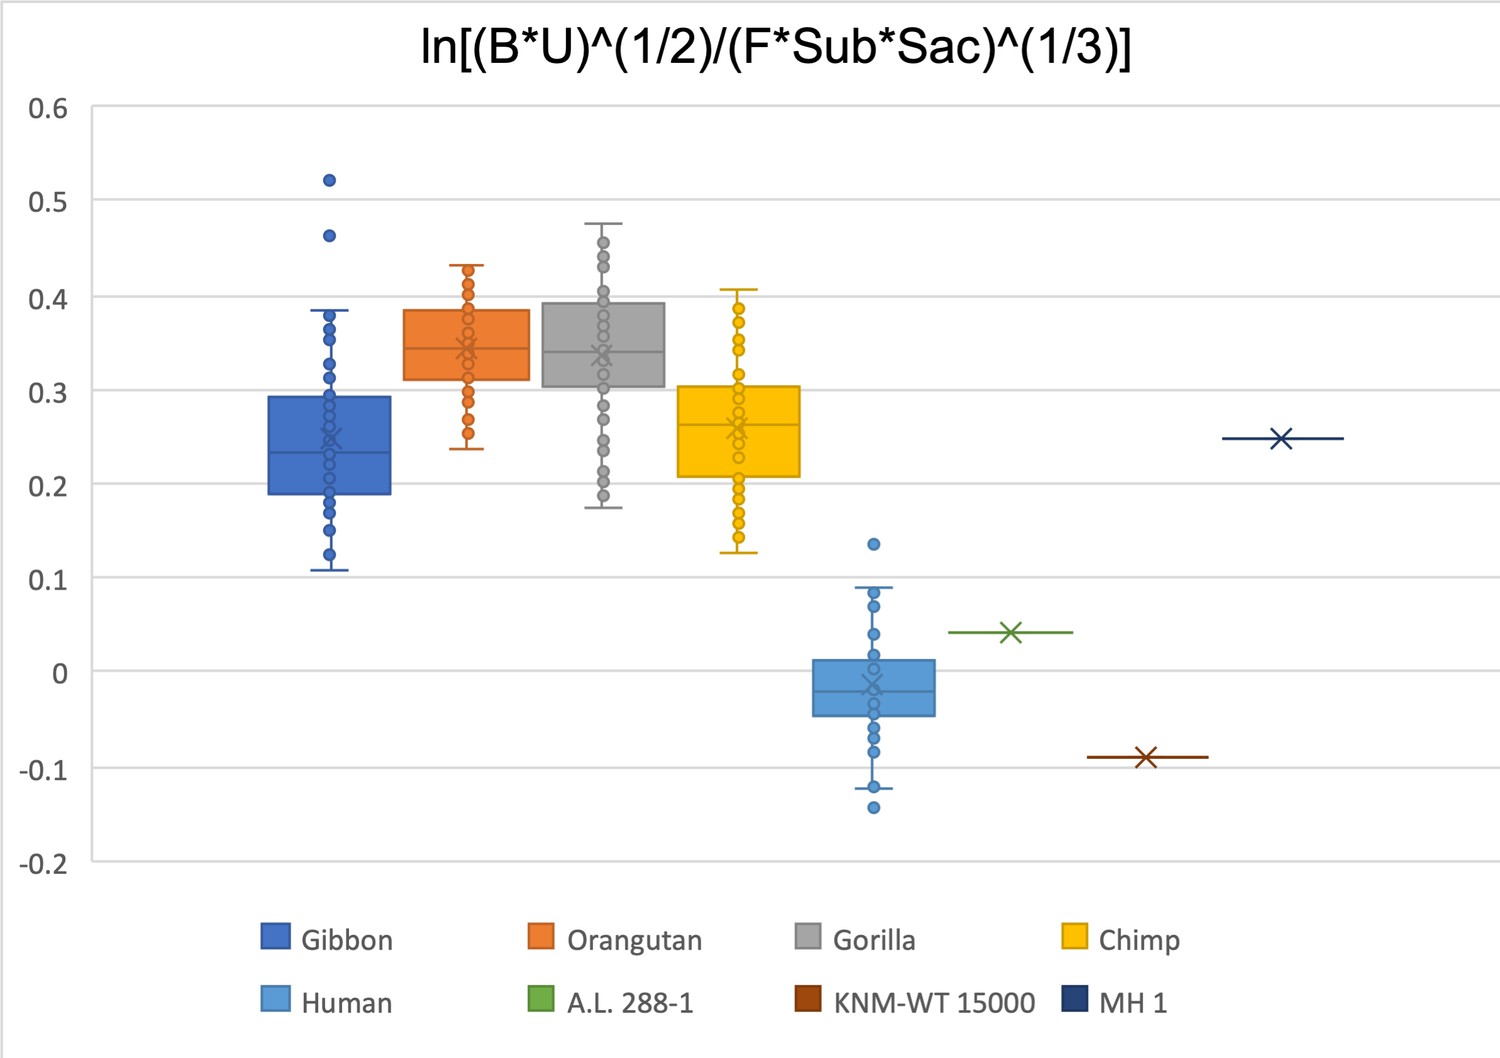
Figure 2—figure supplement 7
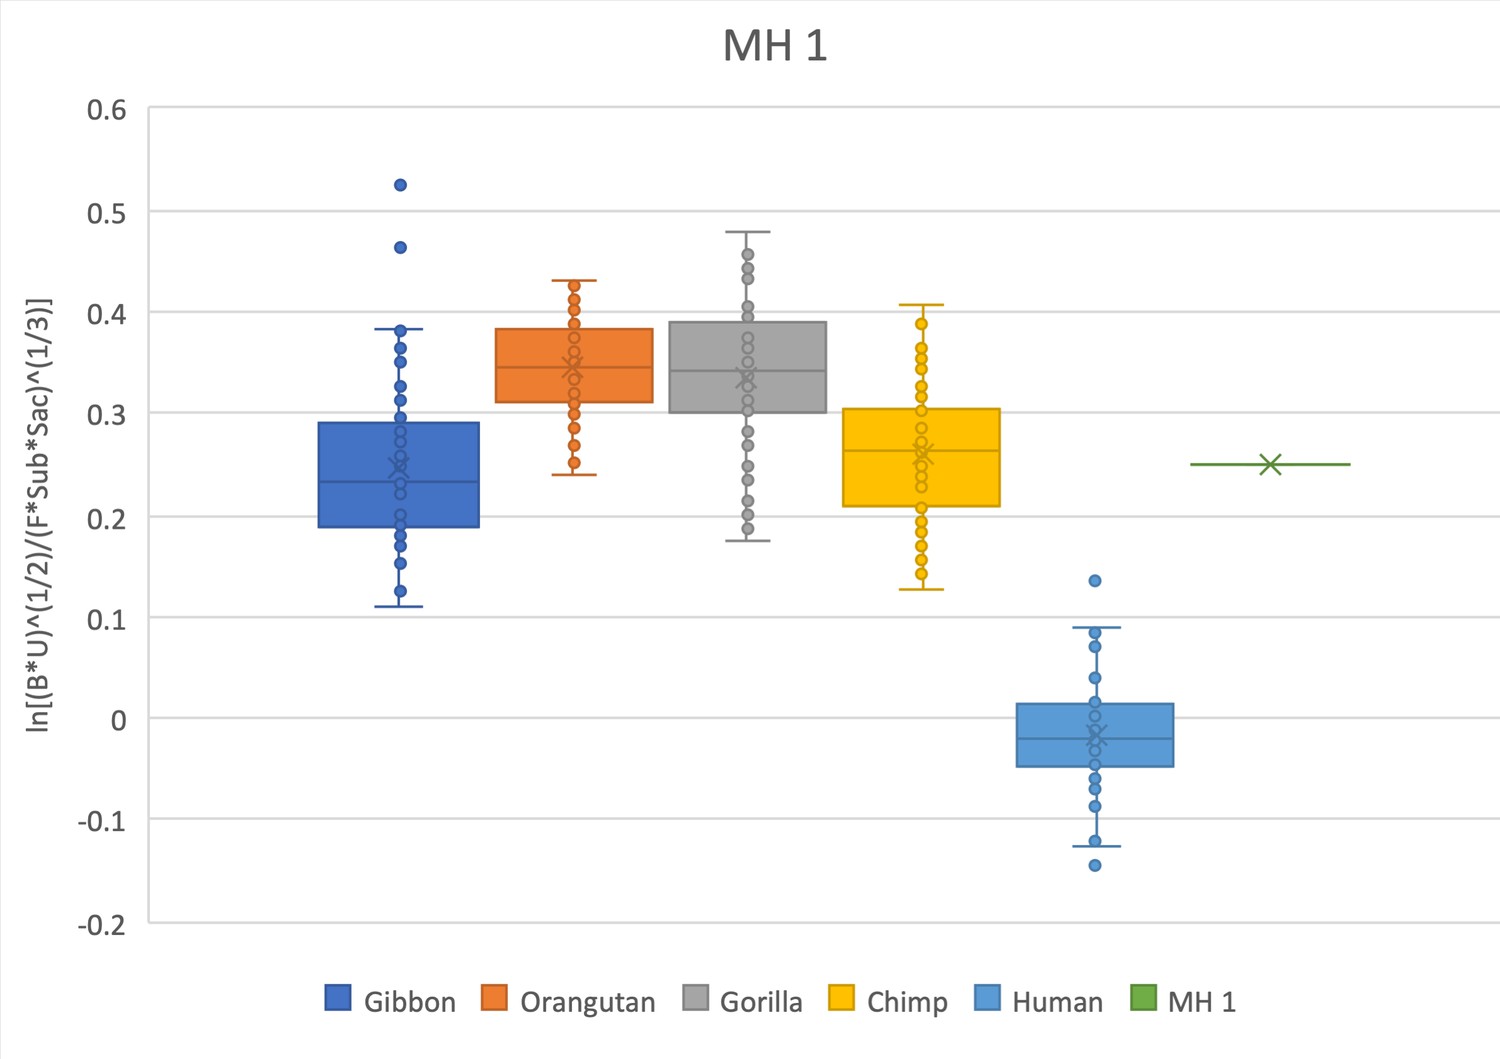
The relative limb size index of MH1 is decidedly ape-like, positioned within the interquartile range of hylobatids and chimpanzees and within the range of gorillas and orangutans, well outside the distribution of modern humans.
The measurements used were taken on the original fossil material and can be found in Churchill et al., 2019; DeSilva et al., 2018a; Williams et al., 2018. The sacrum measurements were previously unpublished and were independently taken by SW and JD on a block that is currently being prepared. Note that MH1 is a juvenile individual and is compared here with extant specimens that are skeletally adult.
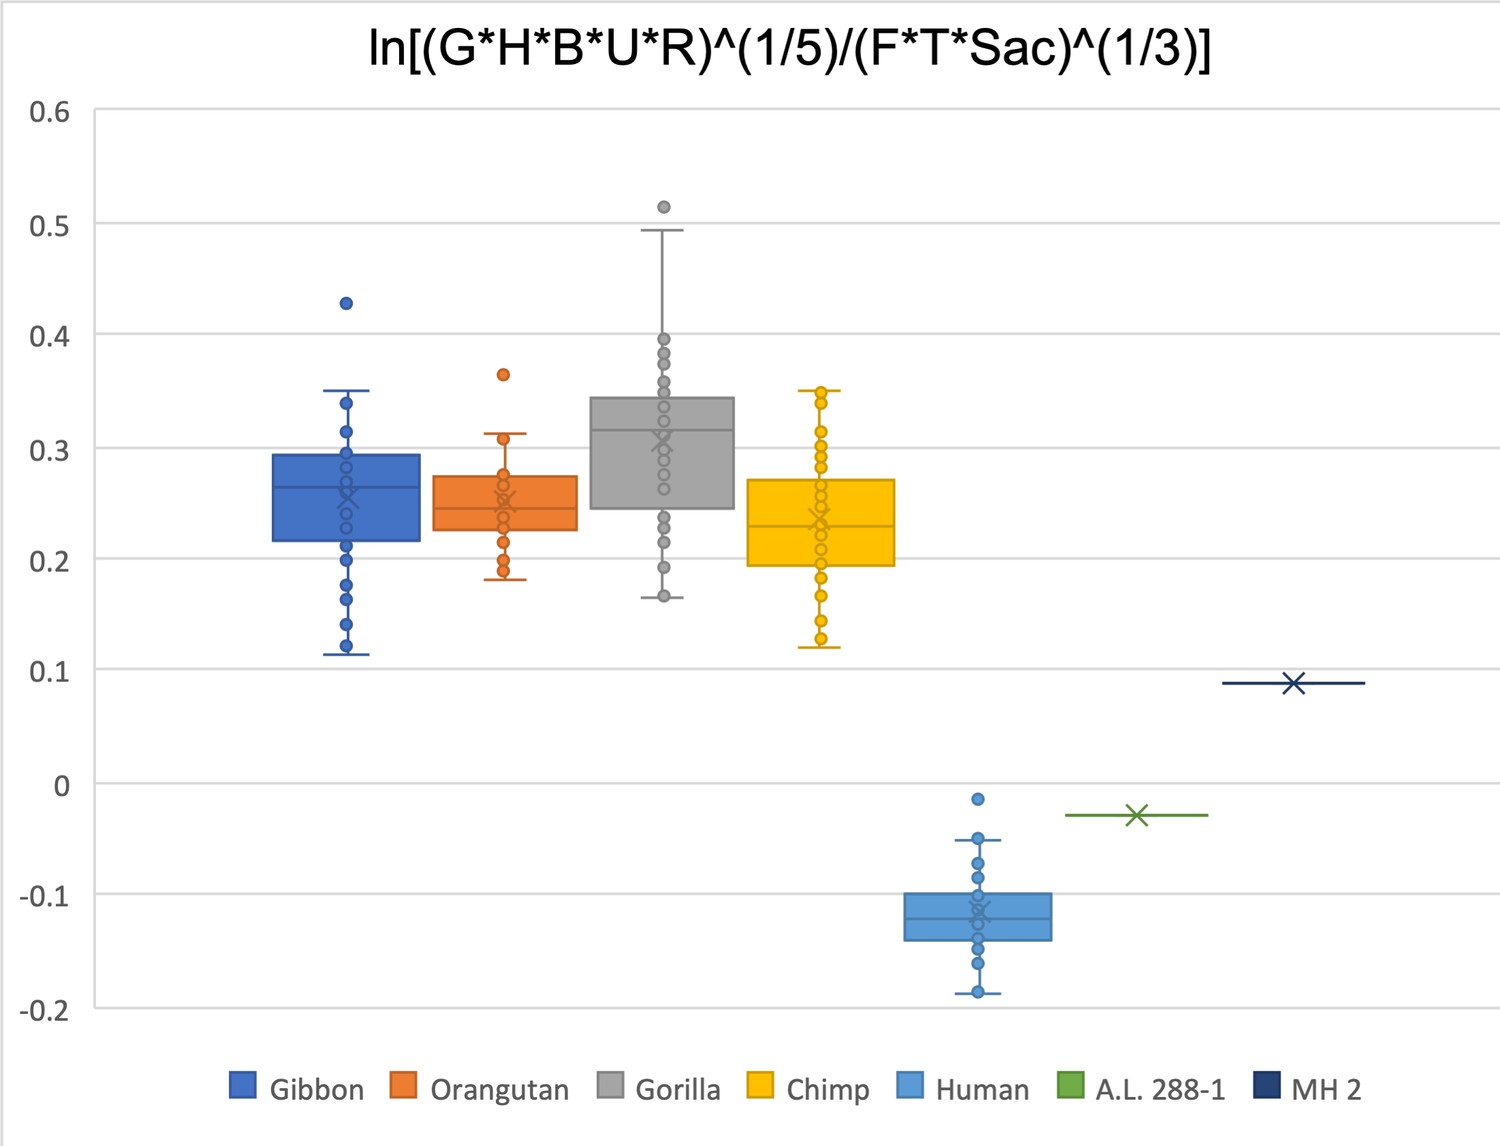
Figure 2—figure supplement 8
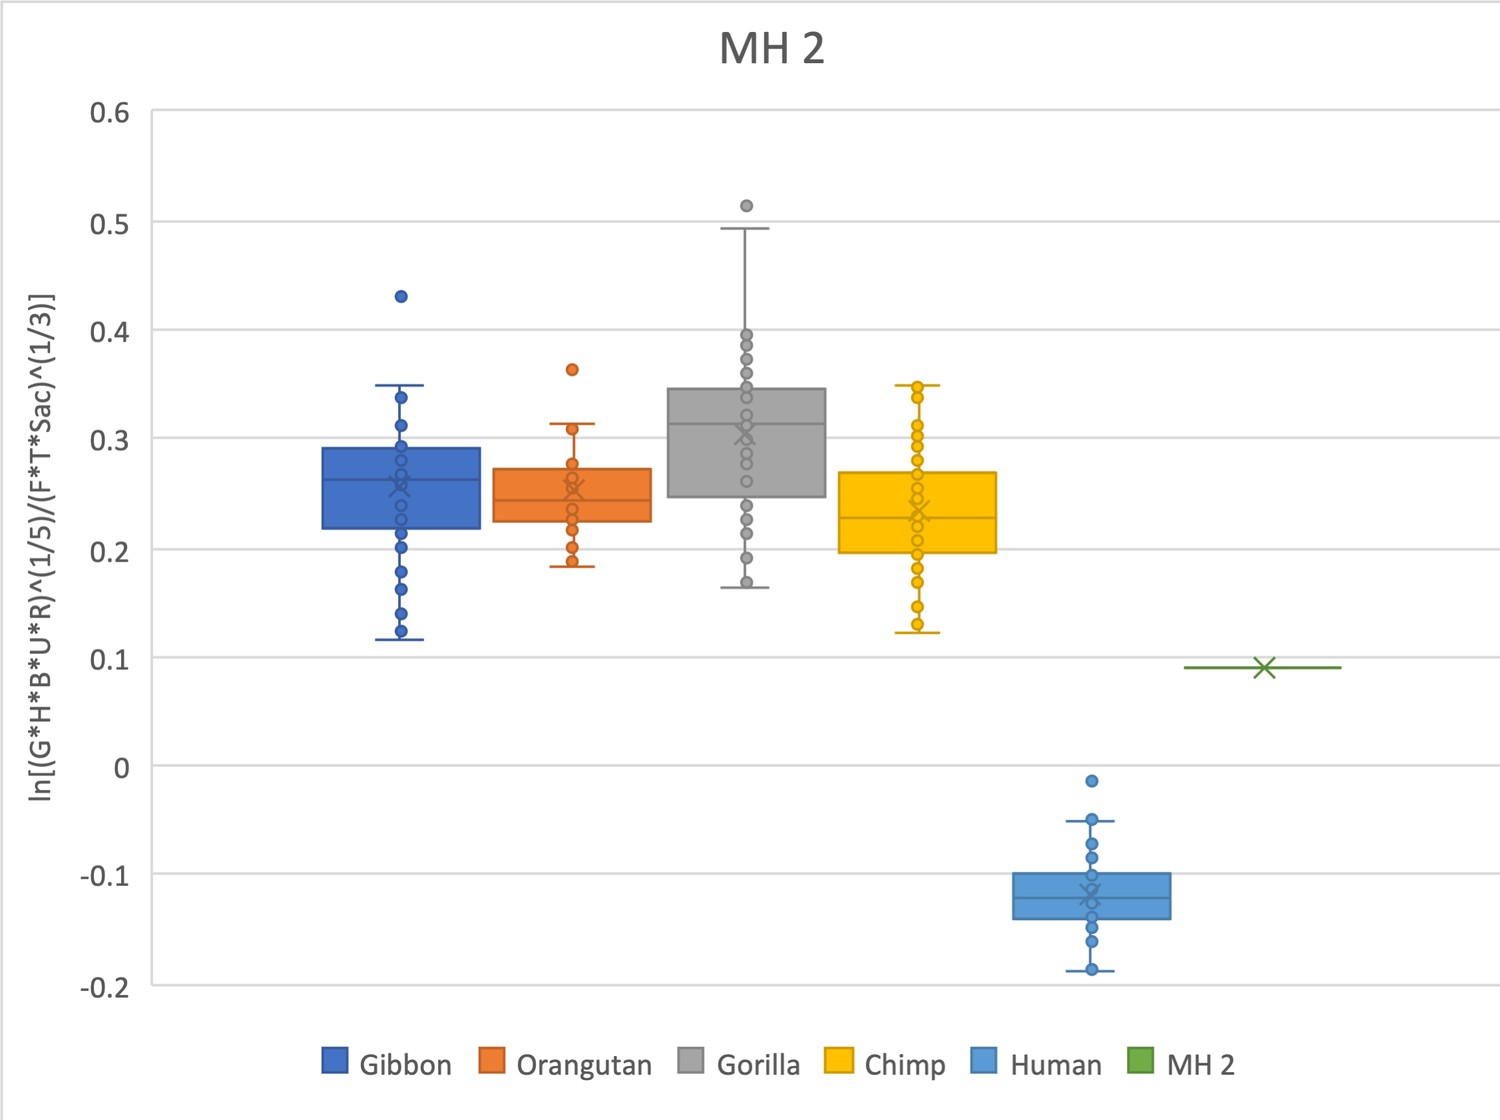
The relative limb size index of MH2 falls between the distribution in modern apes and modern humans, with the closest extant values being gibbons and chimpanzees.
The measurements used were taken on the original fossil material and can be found in Churchill et al., 2019; DeSilva et al., 2018a; Williams et al., 2018.
Figure 2—figure supplement 9

The relative limb size index of StW 573 falls between the distribution in modern apes and modern humans, with the closest extant value being a chimpanzee outlier.
The measurements used were derived from Heaton et al., 2019 and from observations made on the original fossil material.
Figure 2—figure supplement 10
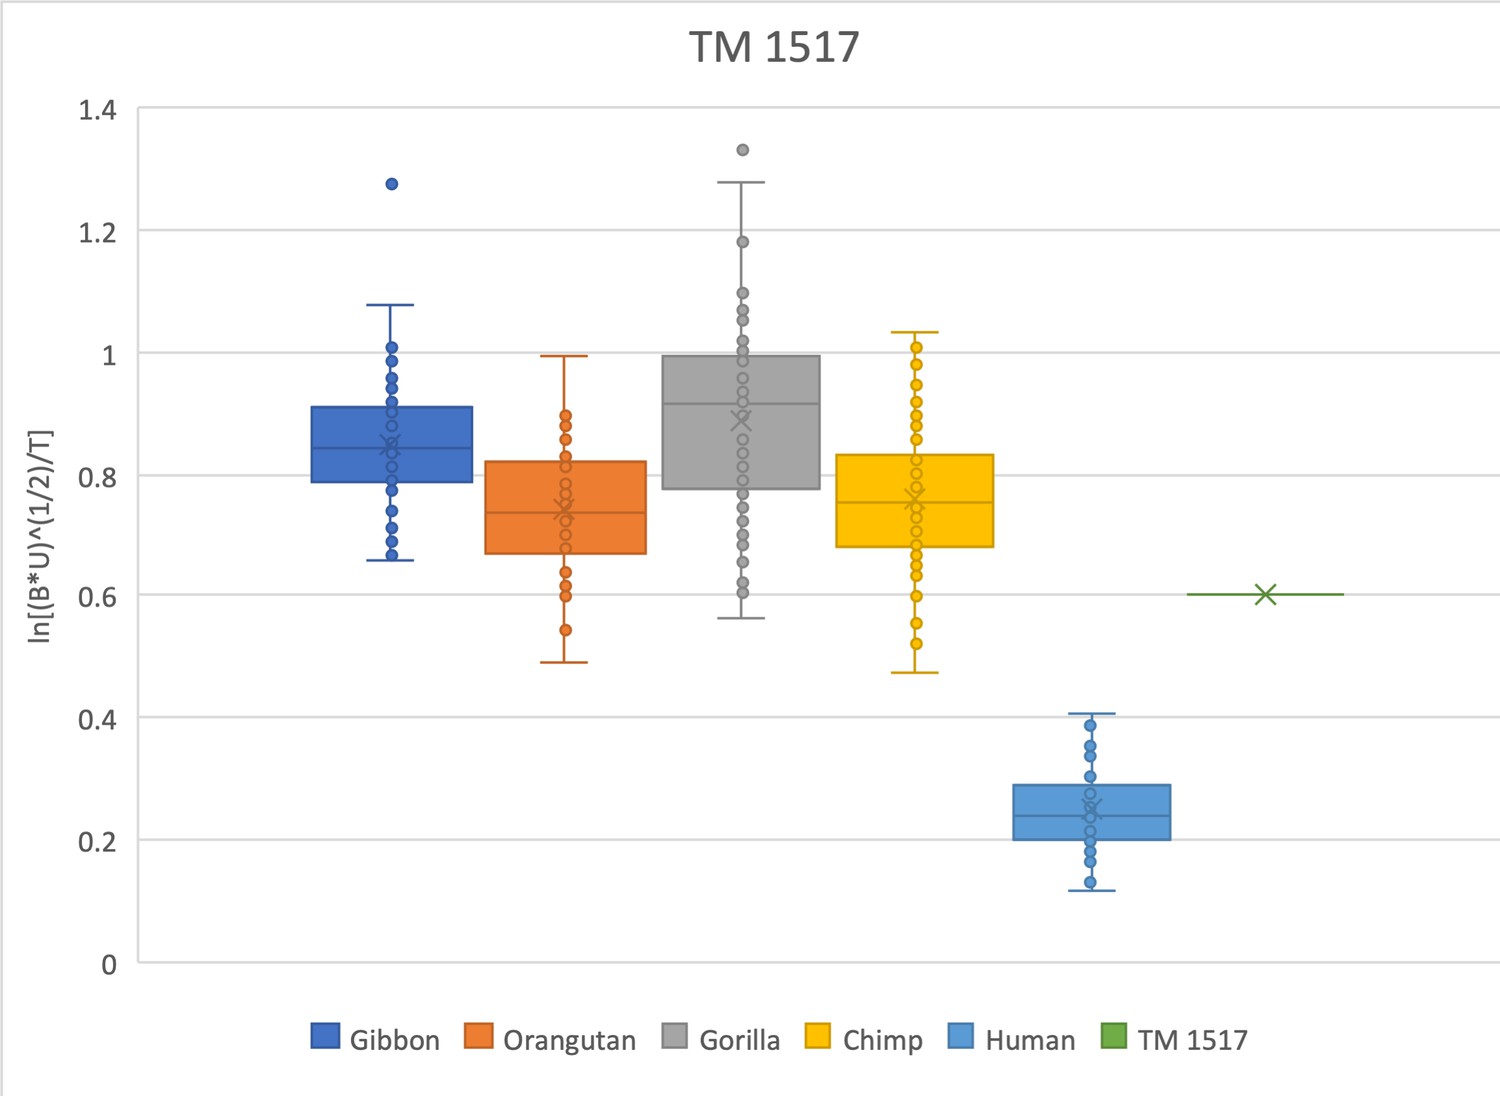
The relative limb size index of TM 1517 is ape-like, positioned within the range of gorillas, chimpanzees, and orangutans, well outside the distribution of modern humans.
The measurements used were derived from Robinson, 1972 and confirmed on both the original fossil material and on high-quality research casts. Some of the postcranial material originally collected with TM 1517 has been identified as cercopithecoid (Day and Thornton, 1986), calling into question the association of the craniodental and postcranial material. Recent reanalysis confirms that the hominin TM 1517 material came from a single, immature individual (Cazenave et al., 2020). TM 1517 is compared here with extant specimens that are skeletally adult.
Figure 2—figure supplement 11
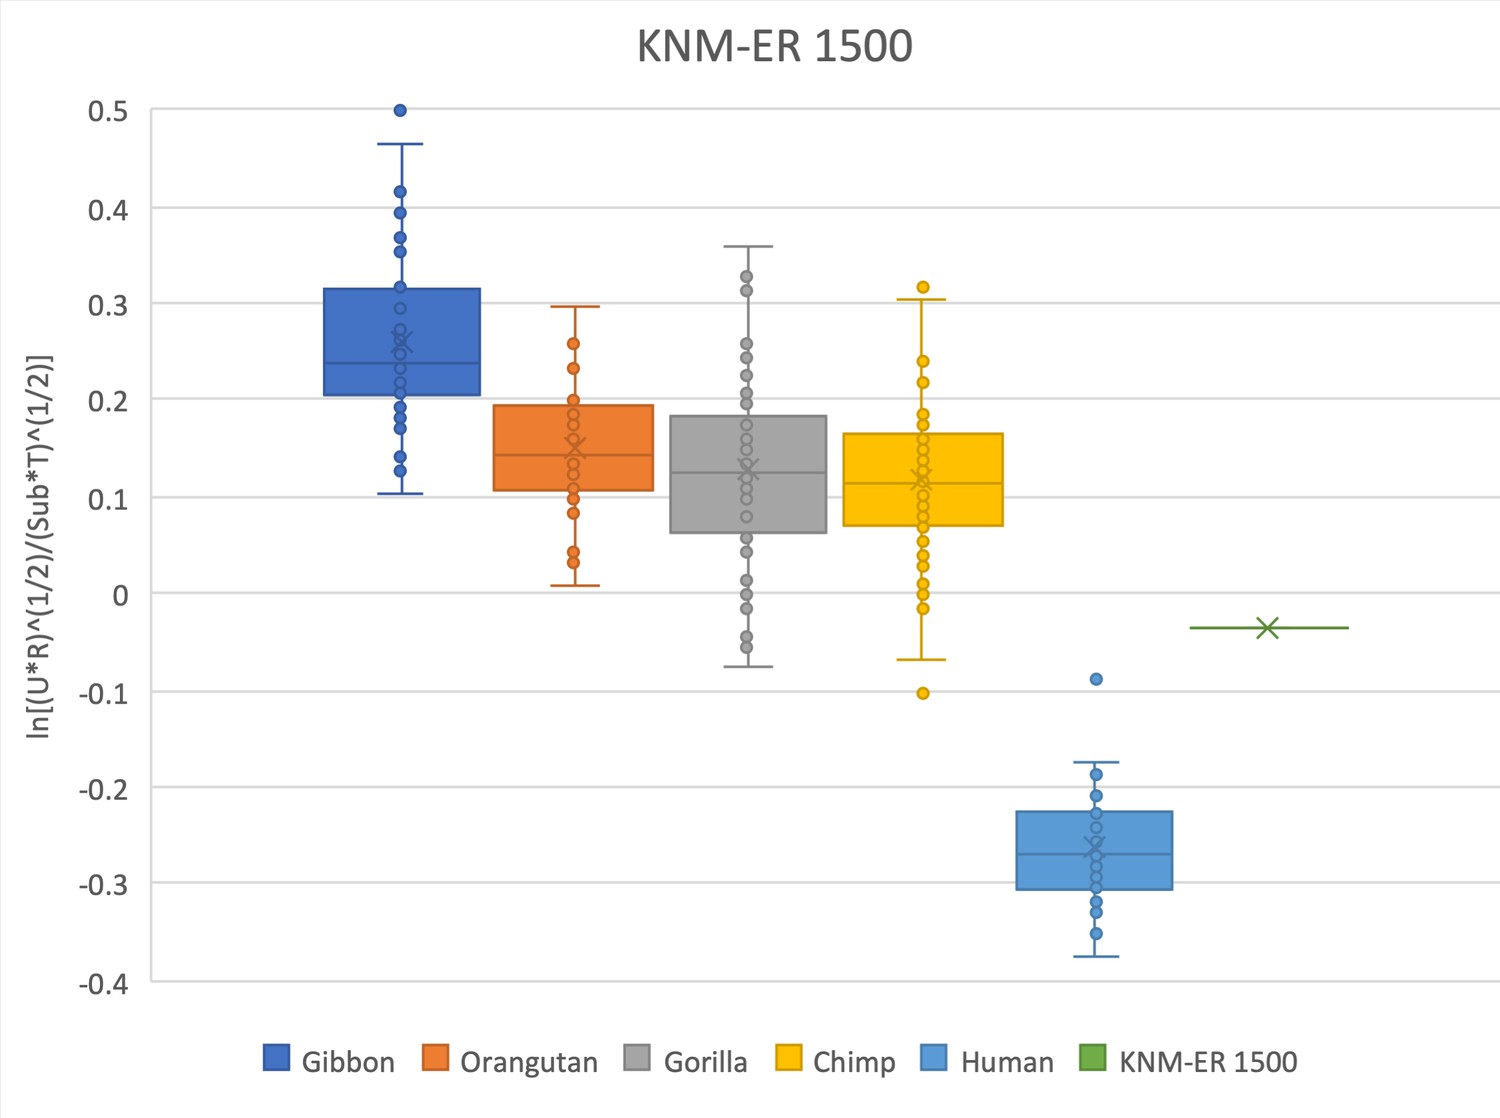
The relative limb size index of KNM-ER 1500 falls within the range of data in African apes and is outside the range of modern humans.
Measurements were derived from Day et al., 1976 and confirmed with observations made on the original fossils and high-quality research casts from the National Museums of Kenya. The attribution of the KNM-ER 1500 partial skeleton to P. boisei is hypothesized (see Grausz et al., 1988) but remains in question (see Wood and Constantino, 2007), and these data should be interpreted with caution. The talus was not recovered and was estimated from the mediolateral width of the talar facet of the distal tibia using an equation (y = 0.9887x * 0.7606) obtained from associated tibiae and tali of N = 79 Homo sapiens reported in DeSilva, 2011.
Figure 2—figure supplement 12

The relative limb size index of OH 80 is chimpanzee-like, falling within the range of data in the other apes, and outside the range in modern humans.
Measurements were derived from Domínguez-Rodrigo et al., 2013 and checked against high-quality research casts generously provided by M. Domínguez-Rodrigo.
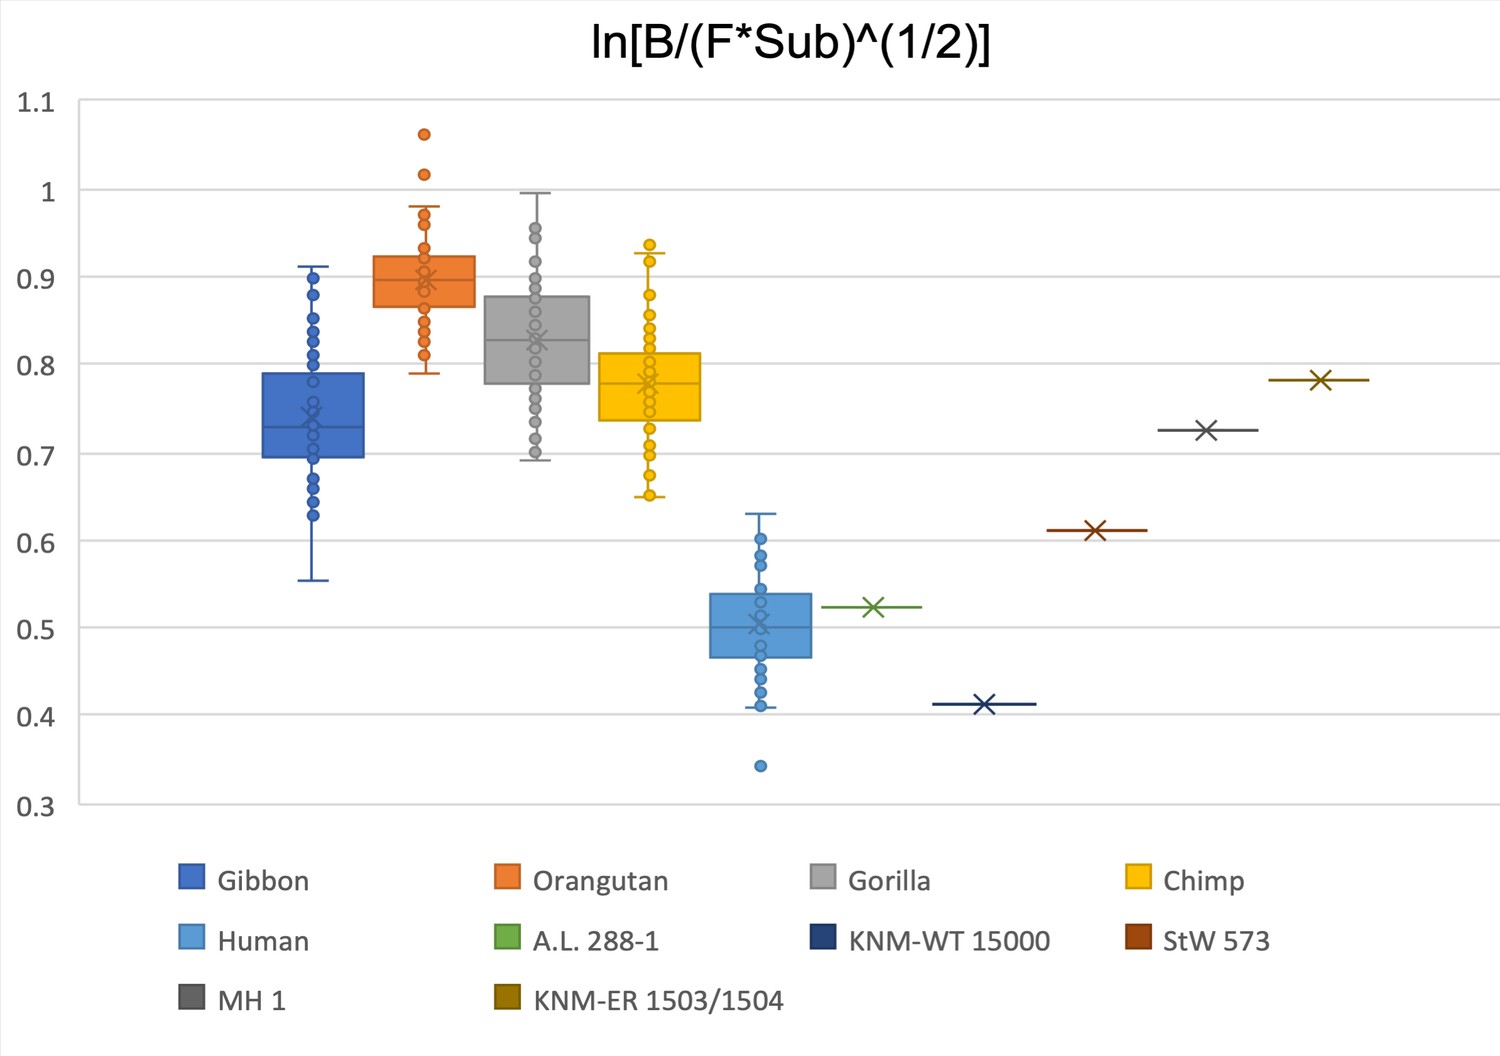
Figure 2—figure supplement 13
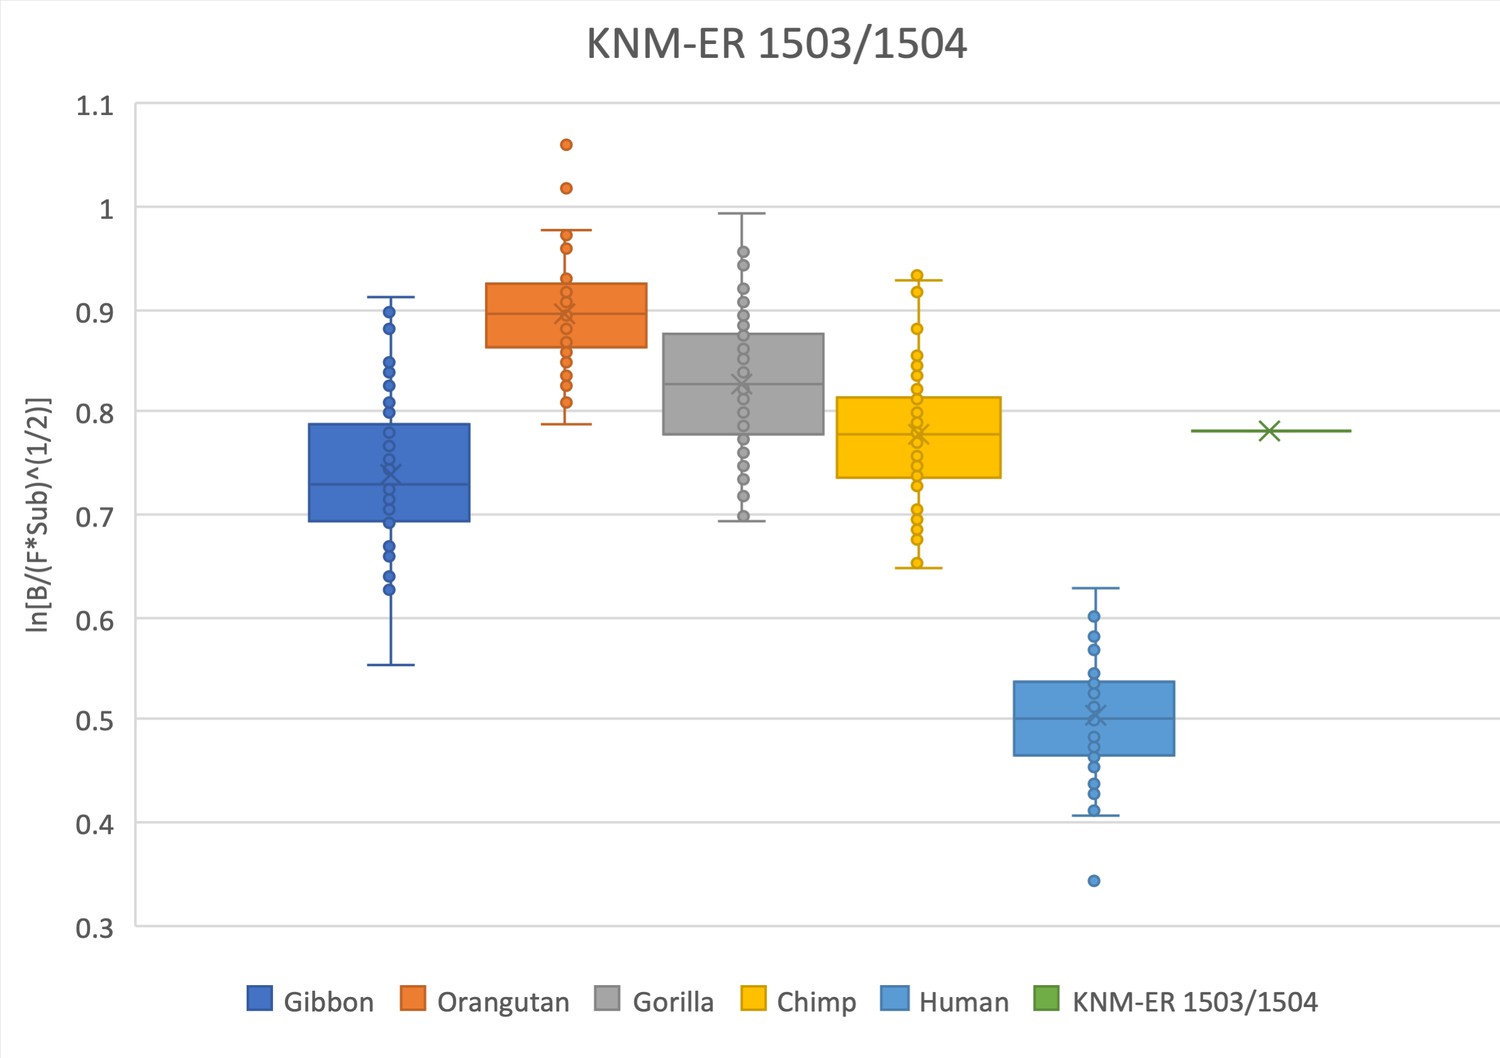
The relative limb size index of KNM-ER 1503/1504 is African ape-like, falling within the interquartile range of chimpanzees, within the range of gibbons, and outside the range in modern humans.
Measurements were derived from Day et al., 1976 and confirmed with observations made on the original fossils and high-quality research casts from the National Museums of Kenya. The association of these two elements is suspected but unconfirmed (see Leakey, 1973; Leakey and Leakey, 1978). Furthermore, their attribution to P. boisei is hypothesized (see Day, 1973) but remains in question (see Wood and Constantino, 2007), and these data should be interpreted with caution.
Figure 2—figure supplement 14

The relative limb size index of BOU-VP-12/1 falls within the interquartile range of gorillas and within the full range of chimpanzees.
Only a single modern human outlier positions this fossil within the modern human distribution. The measurements used were derived from DeGusta, 2004. While this partial skeleton was originally described in the same pages that established A. garhi (Asfaw et al., 1999), it is important to note that direct association between these postcranial remains and the craniodental material assigned to A. garhi was never established, and therefore, the taxonomic assignation of BOU-VP-12/1 remains unknown.
Figure 2—figure supplement 15
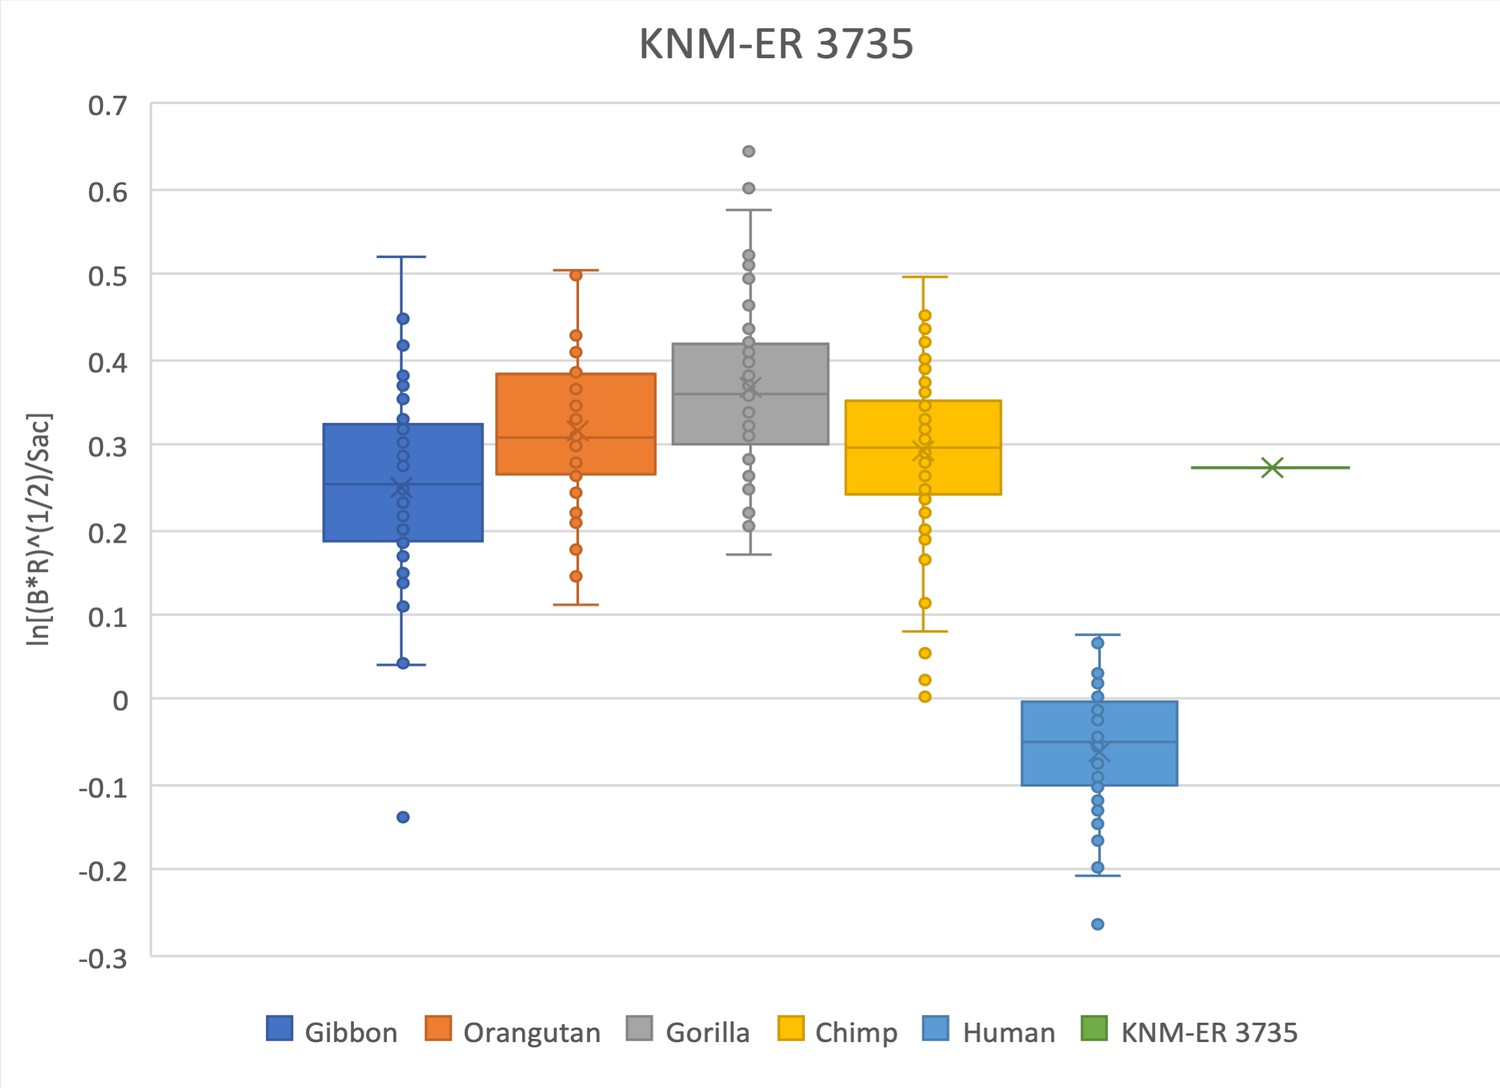
The relative limb size index of KNM-ER 3735 is decidedly ape-like, falling with the range of distribution of chimpanzees, gorillas, orangutans, and gibbons, and well outside the range of modern humans.
Measurements were derived from the literature (Haeusler and McHenry, 2007; Leakey et al., 1987) and confirmed with observations made on the original fossils and high-quality research casts from the National Museums of Kenya.
Figure 2—figure supplement 16
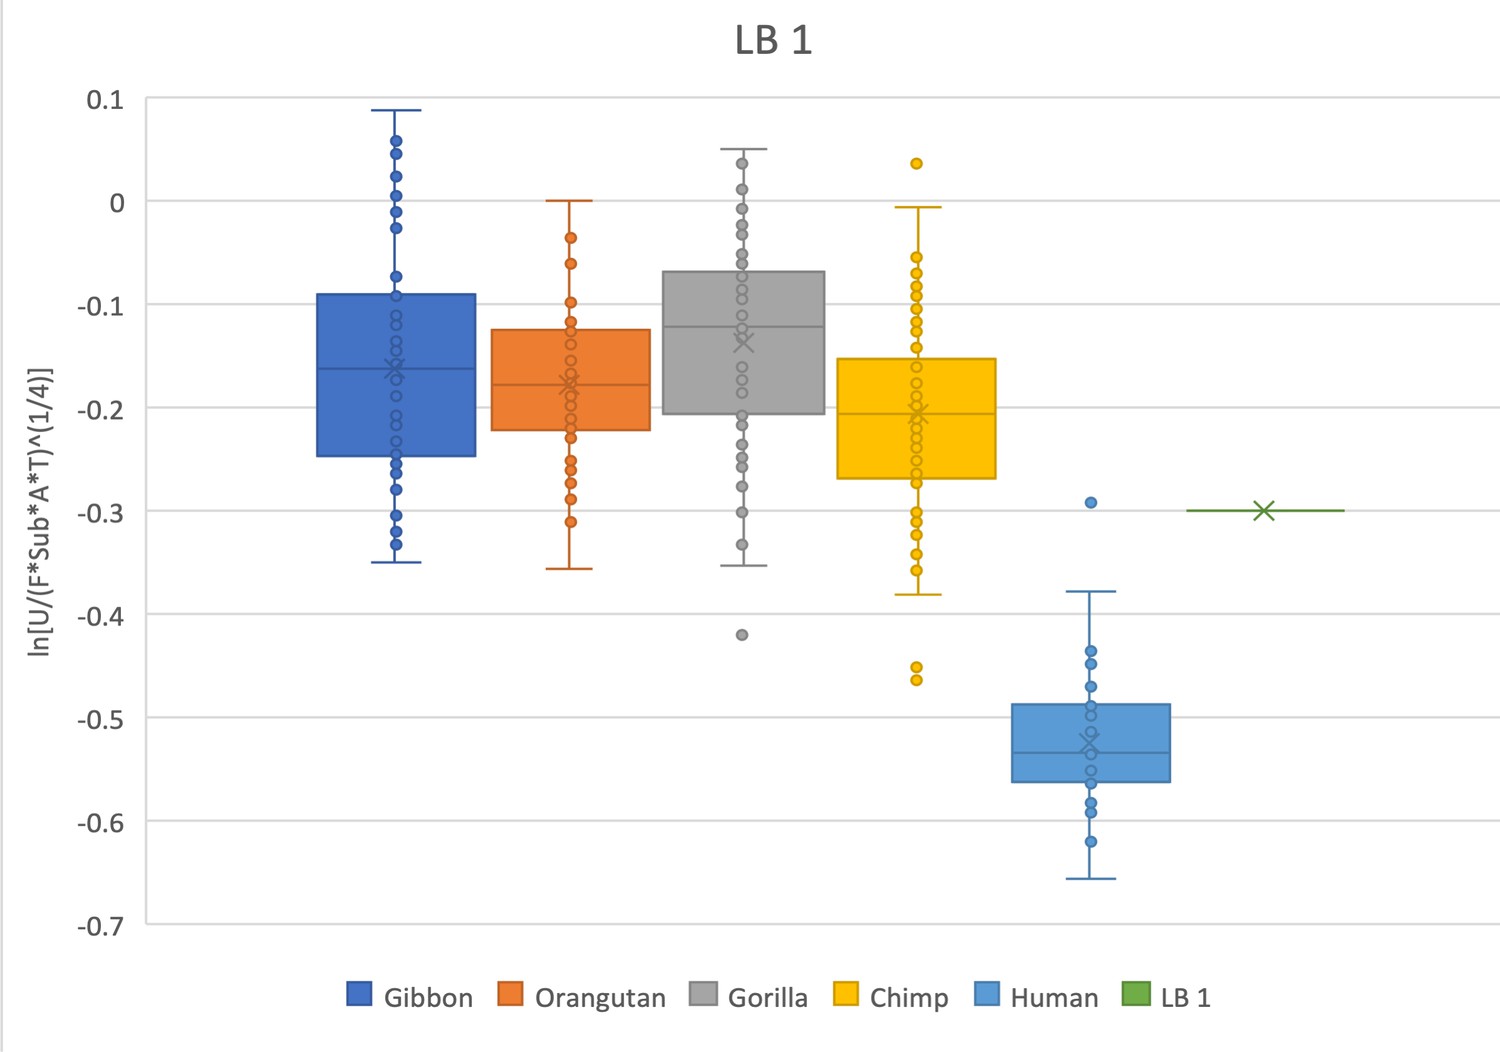
Relative limb size index of LB 1 (Flo) from Homo floresiensis.
LB 1 falls within the lower range for all of the extant apes and is outside the range of modern humans except for a single human outlier. Measurements were derived from the literature (Larson et al., 2009; Jungers et al., 2009) and confirmed with observations made on high-quality printouts of the 3D scanned skeleton provided by the Smithsonian National Museum of Natural History.
Figure 2—figure supplement 17
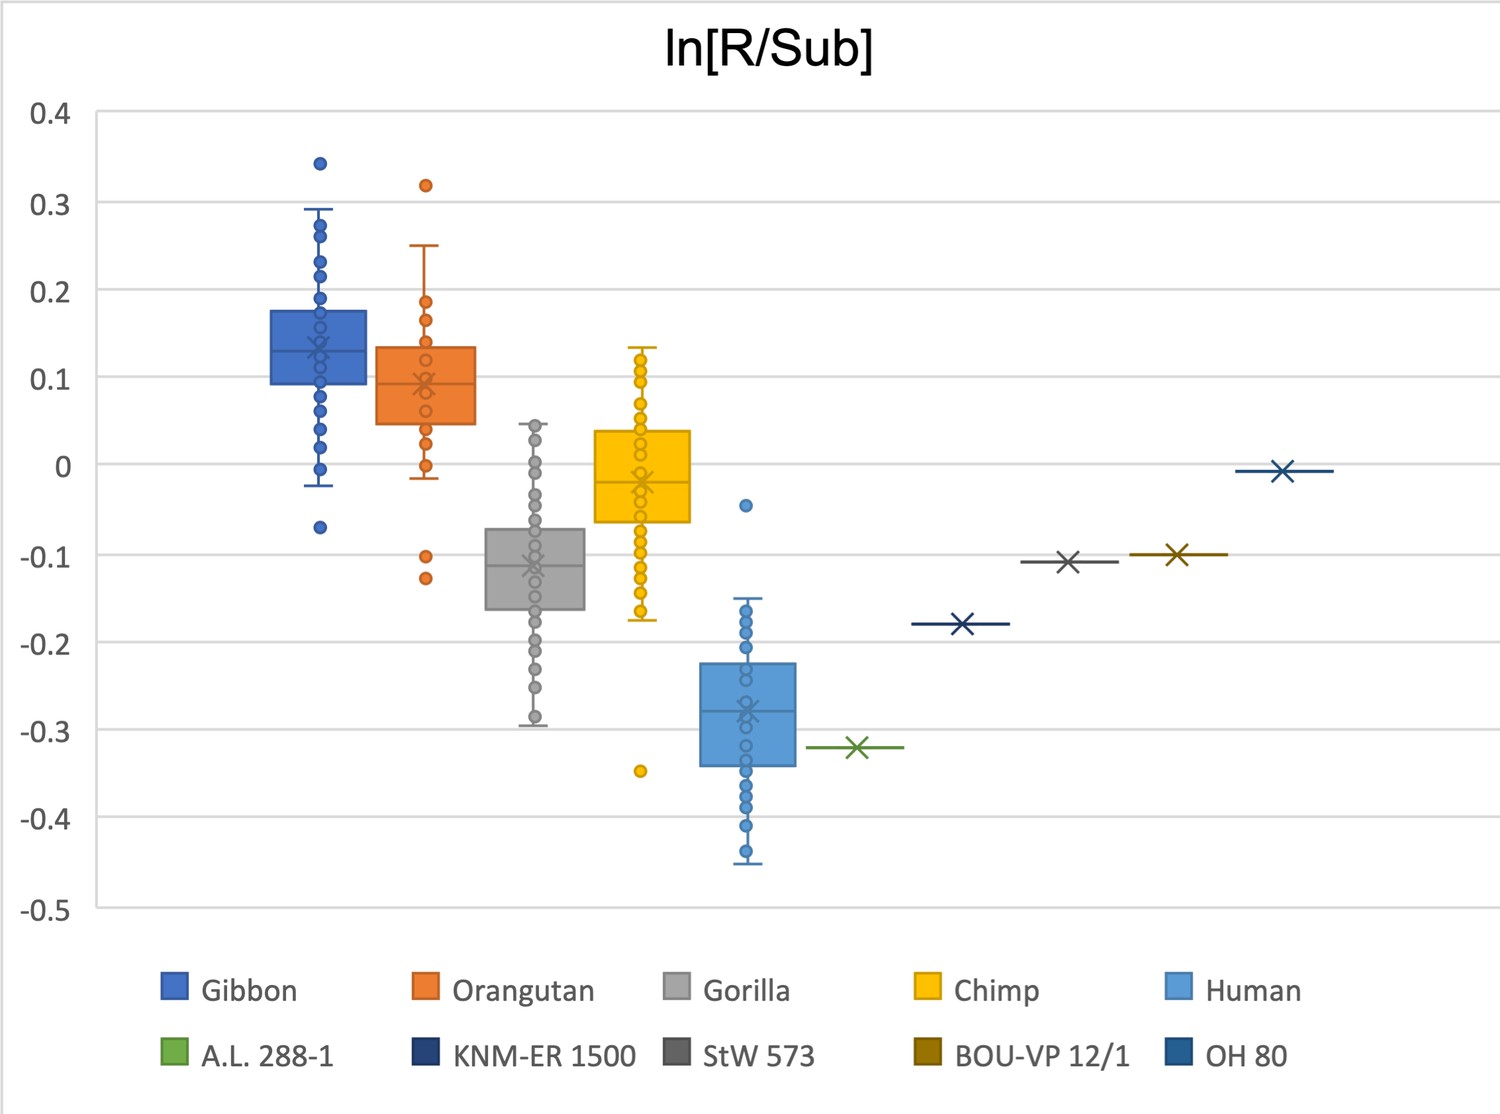
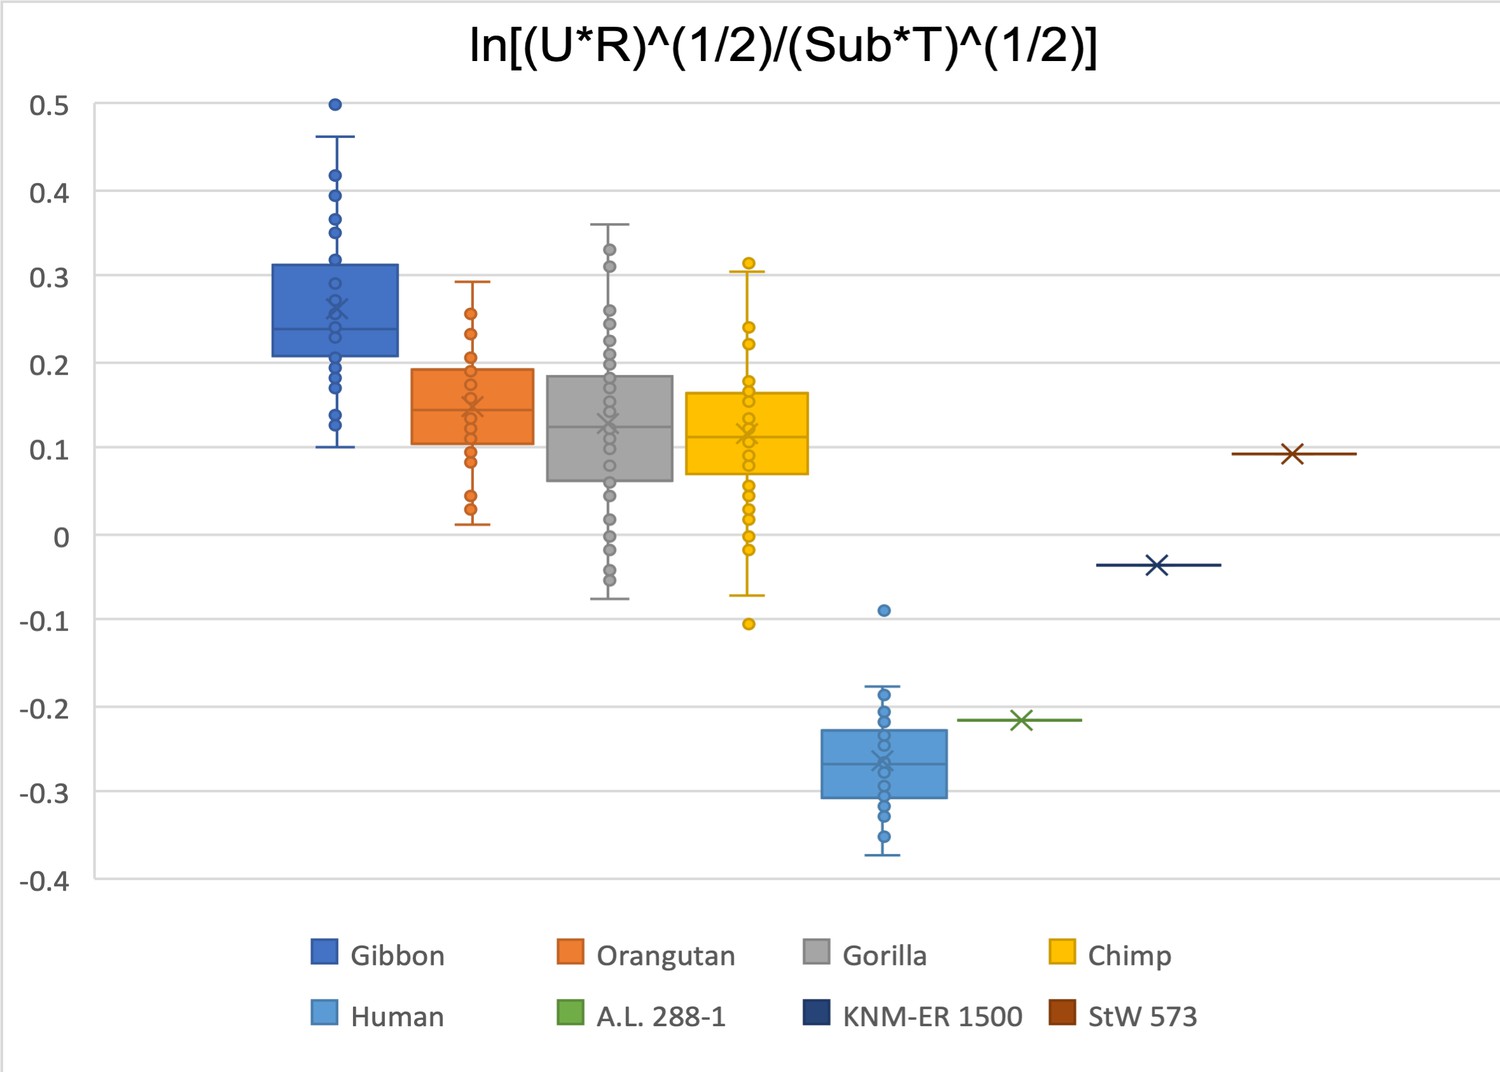
Limiting the comparison to a ratio between the radial head and the subtrochanteric region of the femur, only A.L. 288-1 falls within the interquartile range of Homo sapiens.
KNM-ER 1500 falls within the data range of both humans and gorillas. StW 573 and BOU-VP-12/1 are gorilla-like, while OH 80 is chimpanzee-like.
Figure 2—figure supplement 18
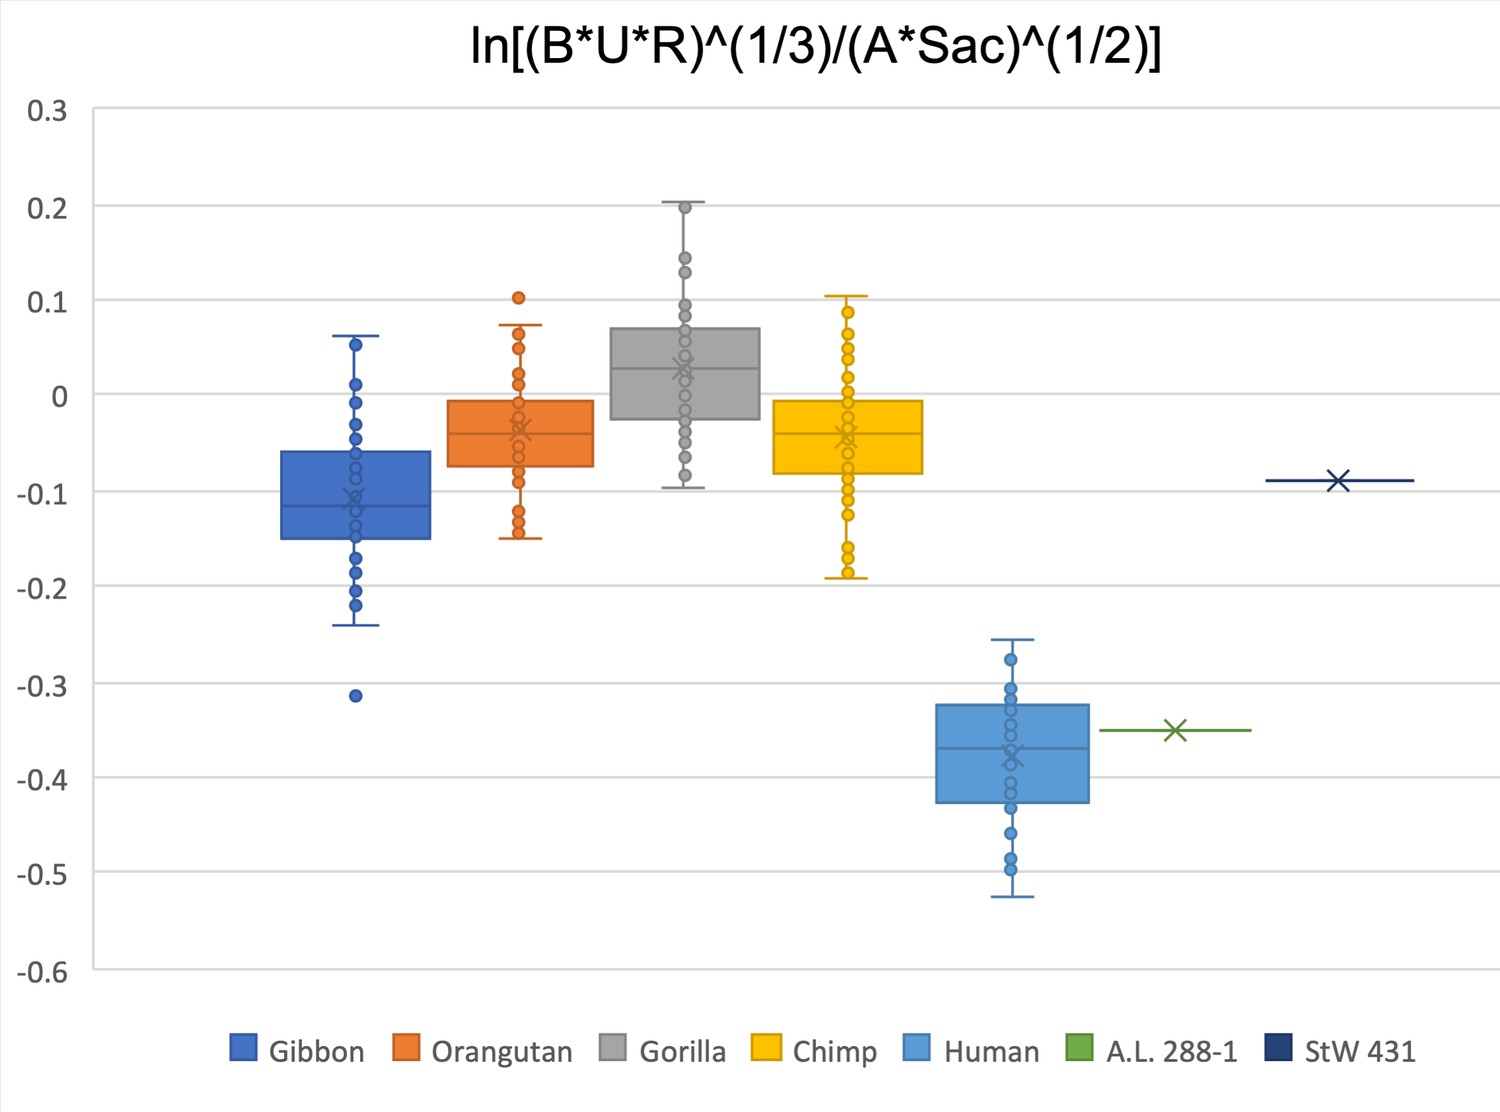
Limiting the comparison to the biepicondylar breadth of humerus, radial head, ulna olecranon width, acetabulum height, and sacral size, only A.L. 288-1 falls within the interquartile range of Homo sapiens.
StW 431 is within the gibbon interquartile range.
Figure 2—figure supplement 19
Limiting the comparison to the biepicondylar breadth of humerus, ulna olecranon width, femoral head diameter, femoral subtrochanteric size, and sacral size, A.L. 288-1 and KNM-WT 15000 both fall within the human data range.
MH1 is within the chimpanzee and gibbon interquartile range.
Figure 2—figure supplement 20
Limiting the comparison to humeral head diameter, ulna olecranon width, femoral head diameter, femoral subtrochanteric size, and sacral size, A.L. 288-1 and LES 1 fall within the human distribution while KNM-WT 15000 is below the human data range.
Figure 2—figure supplement 21
Limiting the comparison to glenoid size, humeral head diameter, biepicondylar width of humerus, radial head width, ulna olecranon width, femoral head diameter, talar trochlea width, and sacral size, A.L. 288-1 is barely within the human range while MH 2 is just below the range of extant apes.
Figure 2—figure supplement 22
Limiting the comparison to biepicondylar width of humerus, femoral head diameter, and femoral subtrochanteric size, A.L. 288-1 and KNM-WT 15000 are within the human range.
StW 573 is in the overlapping space between gibbons and humans. MH1 and KNM-ER 1503/1504 are within the gibbon and chimpanzee interquartile range.
Figure 2—figure supplement 23
Limiting the comparison to glenoid size, humeral head diameter, biepicondylar width, ulna olecranon width, radial head, femoral head diameter, femoral subtrochanteric size, acetabulum height, and talar trochlea width, A.L. 288-1 is within the human range and StW 573 is at the bottom of the chimpanzee data range.
Figure 2—figure supplement 24
Limiting the comparison to ulna olecranon width, radial head width, femoral subtrochanteric size, and talar trochlea width, A.L. 288-1 is within the human range, KNM-ER 1500 is in the bottom range of gorillas and chimpanzees, and StW 573 is within the interquartile range of the gorillas and chimpanzees.
Figure 2—figure supplement 25
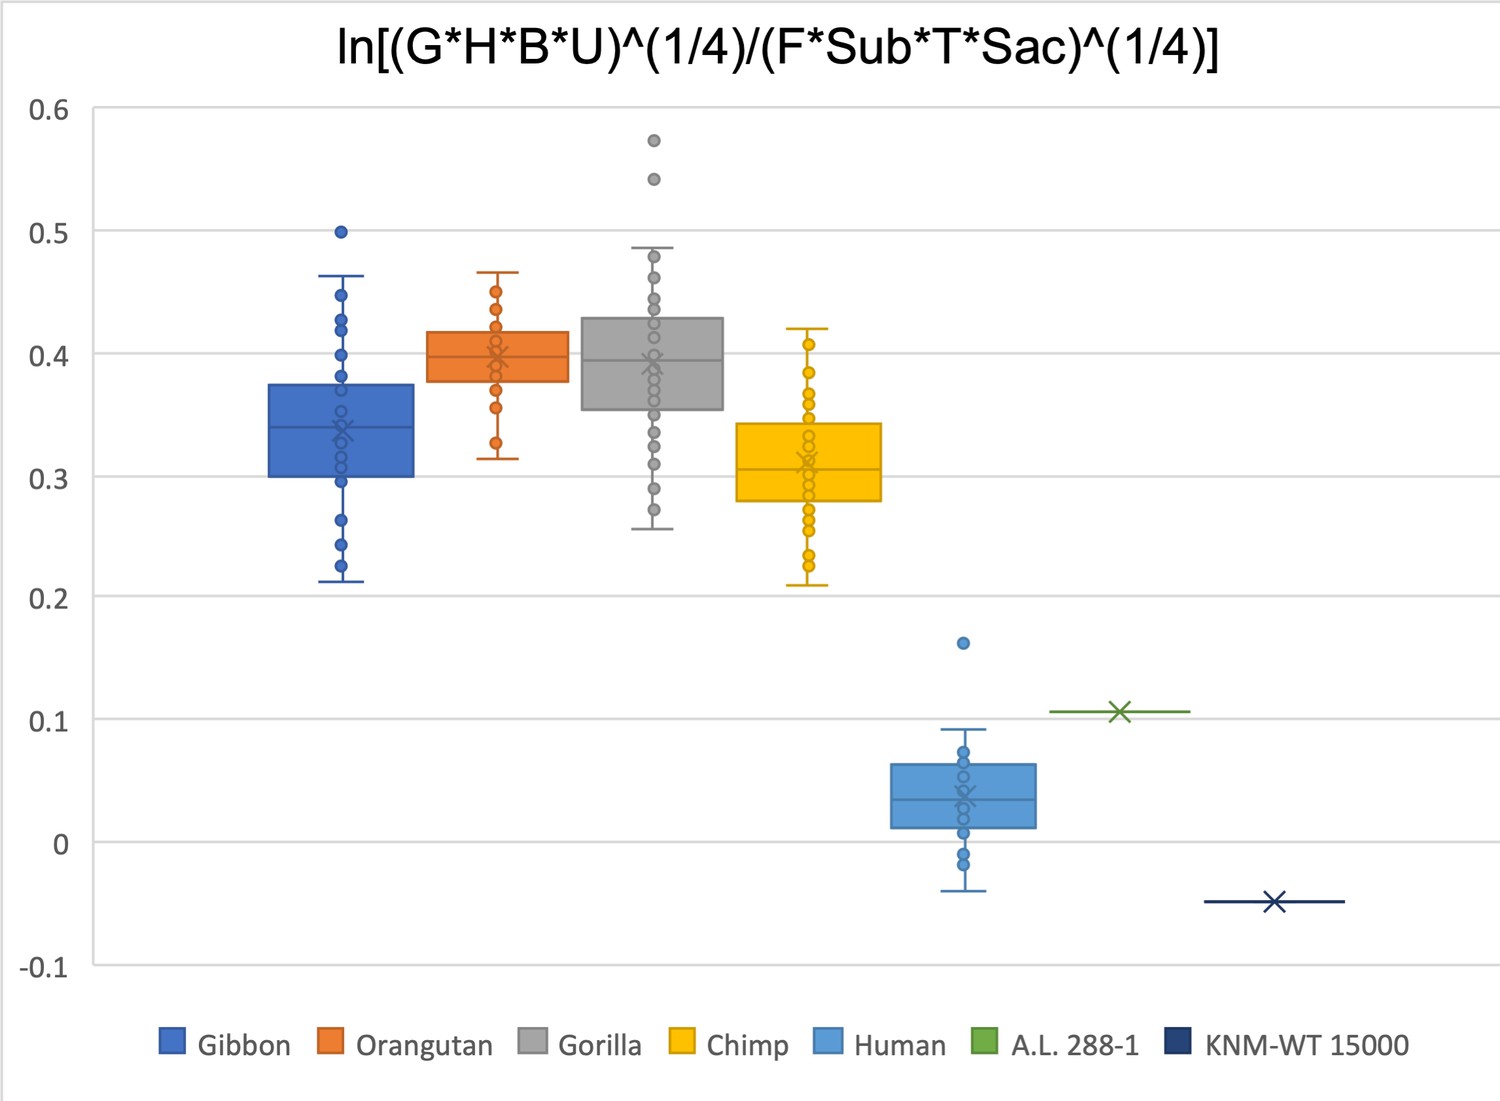
Limiting the comparison to glenoid size, humeral head diameter, biepicondylar width, ulna olecranon width, femoral head diameter, femoral subtrochanteric size, talar trochlea width, and sacral size, A.L. 288-1 is within the human range, while KNM-WT 15000 is just outside (below) the human range.
Figure 2—figure supplement 26
Limiting the comparison to glenoid size and talar trochlea width, KNM-WT 15000 and DIK-1/1 are within the modern human range while A.L. 288-1 is just beyond the human data range, within the chimpanzee and gorilla range.
MH2 and StW 573 are squarely within the chimpanzee and gorilla interquartile range.
Figure 3
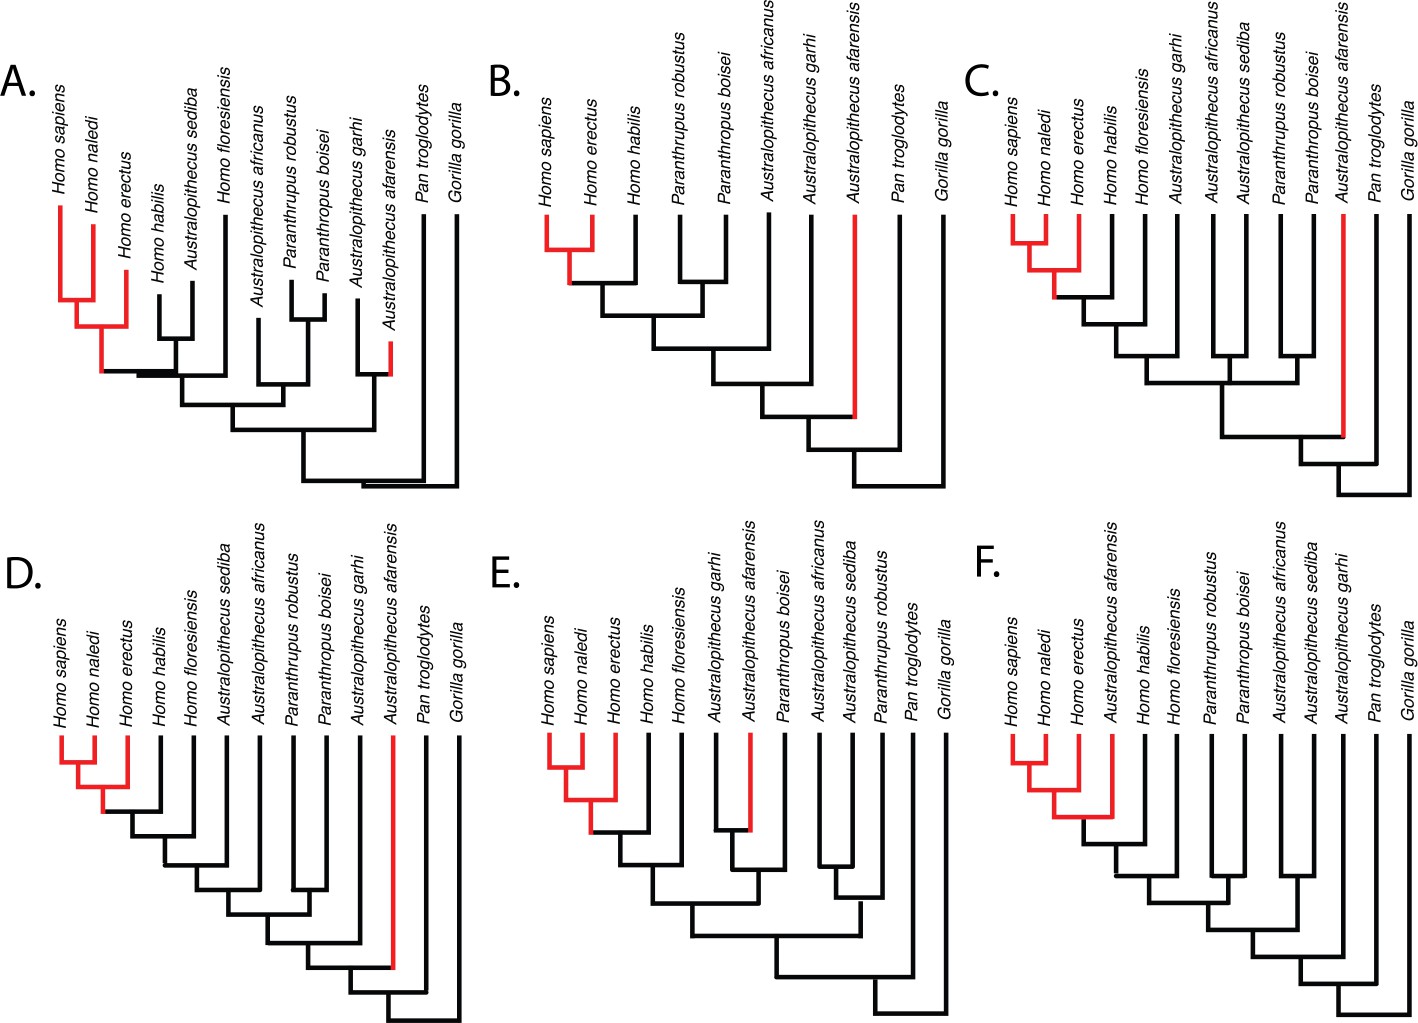
Relative limb size index (RLSI; high in black; low in red) for the taxa examined in this study.
The phylogenies in (A) and (B) are from Dembo et al., 2016 (A) and Mongle et al., 2019 (B). The phylogenies in (C–E) presented above are informed by various hypotheses about the relationships of Australopithecus and Paranthropus taxa that have been published but not recovered in formal phylogenetic analyses. These include the hypothesis that Australopithecus garhi is a unique ancestor of Homo (C; Asfaw et al., 1999), that Australopithecus sediba is a unique ancestor of Homo (D; Berger et al., 2010; Irish et al., 2013), and the hypothesis that Paranthropus is actually polyphyletic (E; topology based on hypothetical tree presented in Wood and Schroer, 2017). A hypothetical phylogeny in which Australopithecus afarensis is more derived than two species of Homo as well as all other Australopithecus and Paranthropus species (such as shown in F) would need to be correct for the pattern of RLSI in hominins to be best explained as anything other than homoplasy between A. afarensis and some later Pleistocene Homo.
Figure 4 with 4 supplements
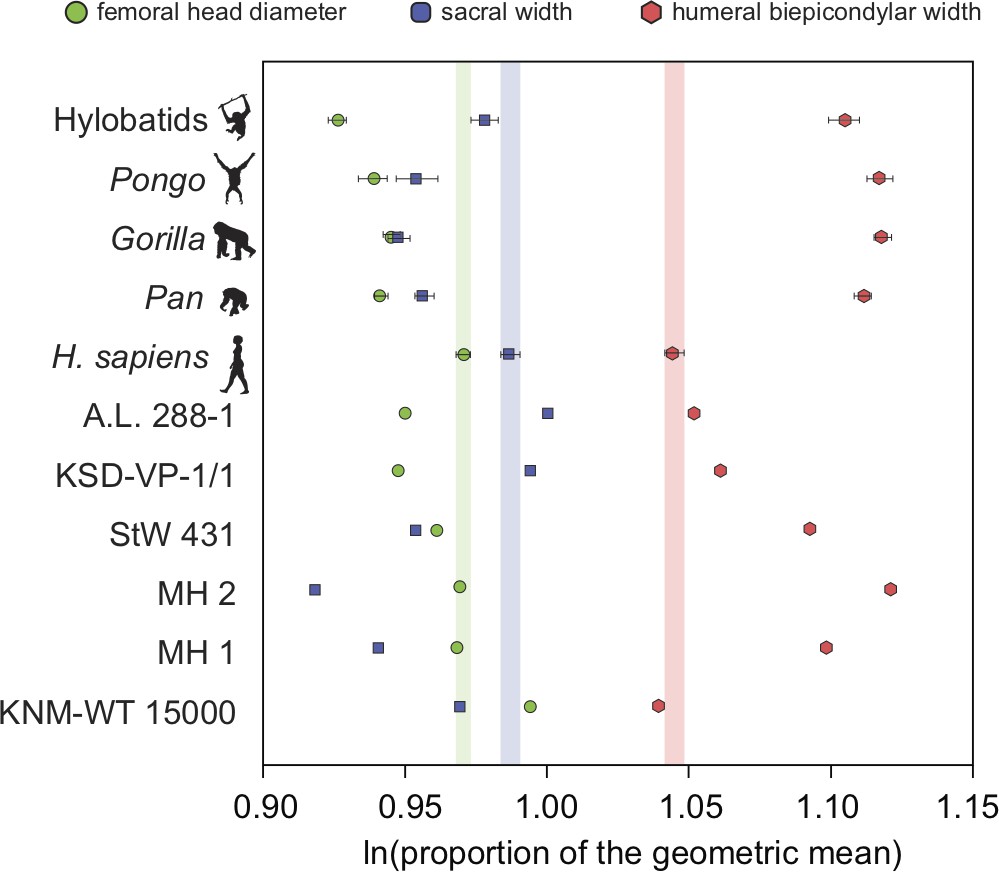
Additional evidence for homoplasy in relative limb size index (RLSI) between A.afarensis and H. sapiens is presented here.
Only femoral head diameter, sacral width, and humeral biepicondylar width are considered in this analysis and all extant apes and hominin fossils are shown relative to the modern human condition (vertical-colored stripes). Horizontal bars are 95% confidence intervals (with those of human highlighted in vertical colored bars). Note that as in apes, A. africanus (StW 431) and A. sediba (MH1 and MH2) have a relatively large humeral biepicondylar width and relatively small sacrum. A. afarensis (A.L. 288-1 and KSD-VP-1/1) has a slightly larger biepicondylar breadth and sacral width with a slightly smaller femoral head relative to modern humans, though as already demonstrated, the overall RLSI is human-like. However, while H. erectus (KNM-WT 15000) also possesses a human-like RLSI, it is accomplished in a different anatomical manner. Notice that the colored dots (blue and green) are reversed in H. erectus relative to both A. afarensis and H. sapiens, meaning that in H. erectus the sacrum is smaller than expected (as in other australopiths) and the femoral head larger than expected. The BSN49/P27 H. erectus pelvis possesses a similarly small sacrum, indicating that this result is not solely a result of the juvenile status of KNM-WT 15000.
Figure 4—figure supplement 1
Same as for Figure 2—figure supplement 1, except in this relative limb size index (RLSI) analysis the sacrum has been removed.
Doing so gives the hylobatids a slightly higher RLSI.
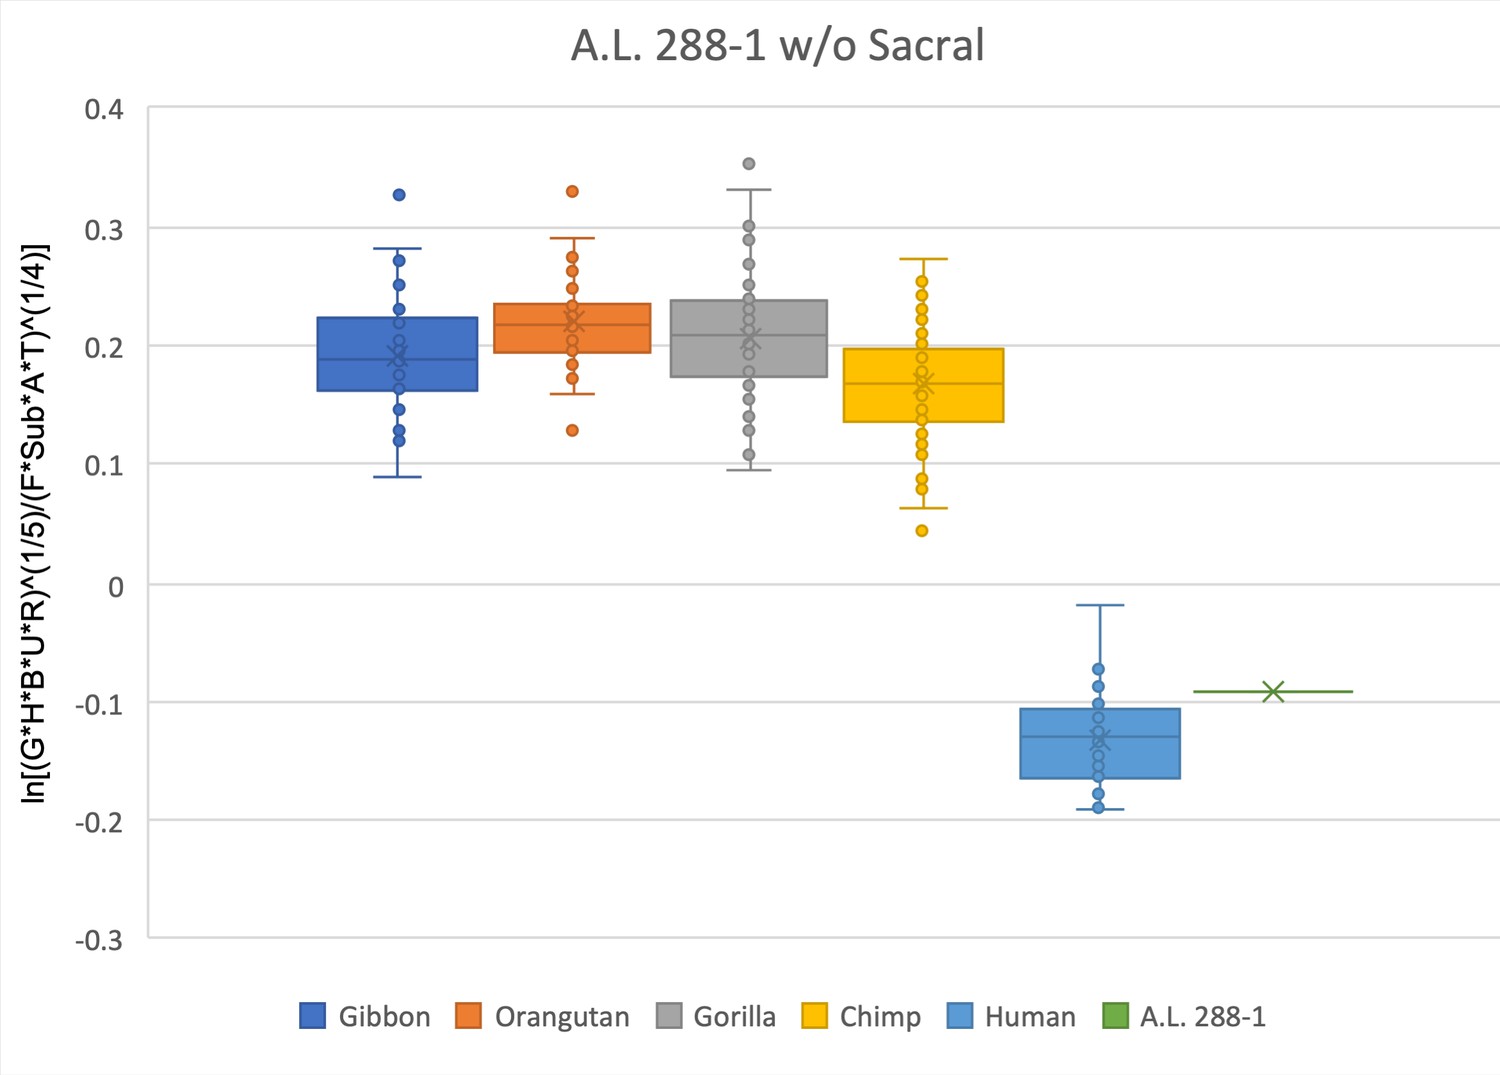
Figure 4—figure supplement 2

Same as for Figure 2—figure supplement 2, except in this relative limb size index (RLSI) analysis the sacrum has been removed.
Doing so gives the hylobatids a slightly higher RLSI.
Figure 4—figure supplement 3
Same as for Figure 2—figure supplement 4, except in this relative limb size index (RLSI) analysis the sacrum has been removed.
Doing so gives the hylobatids a slightly higher RLSI.
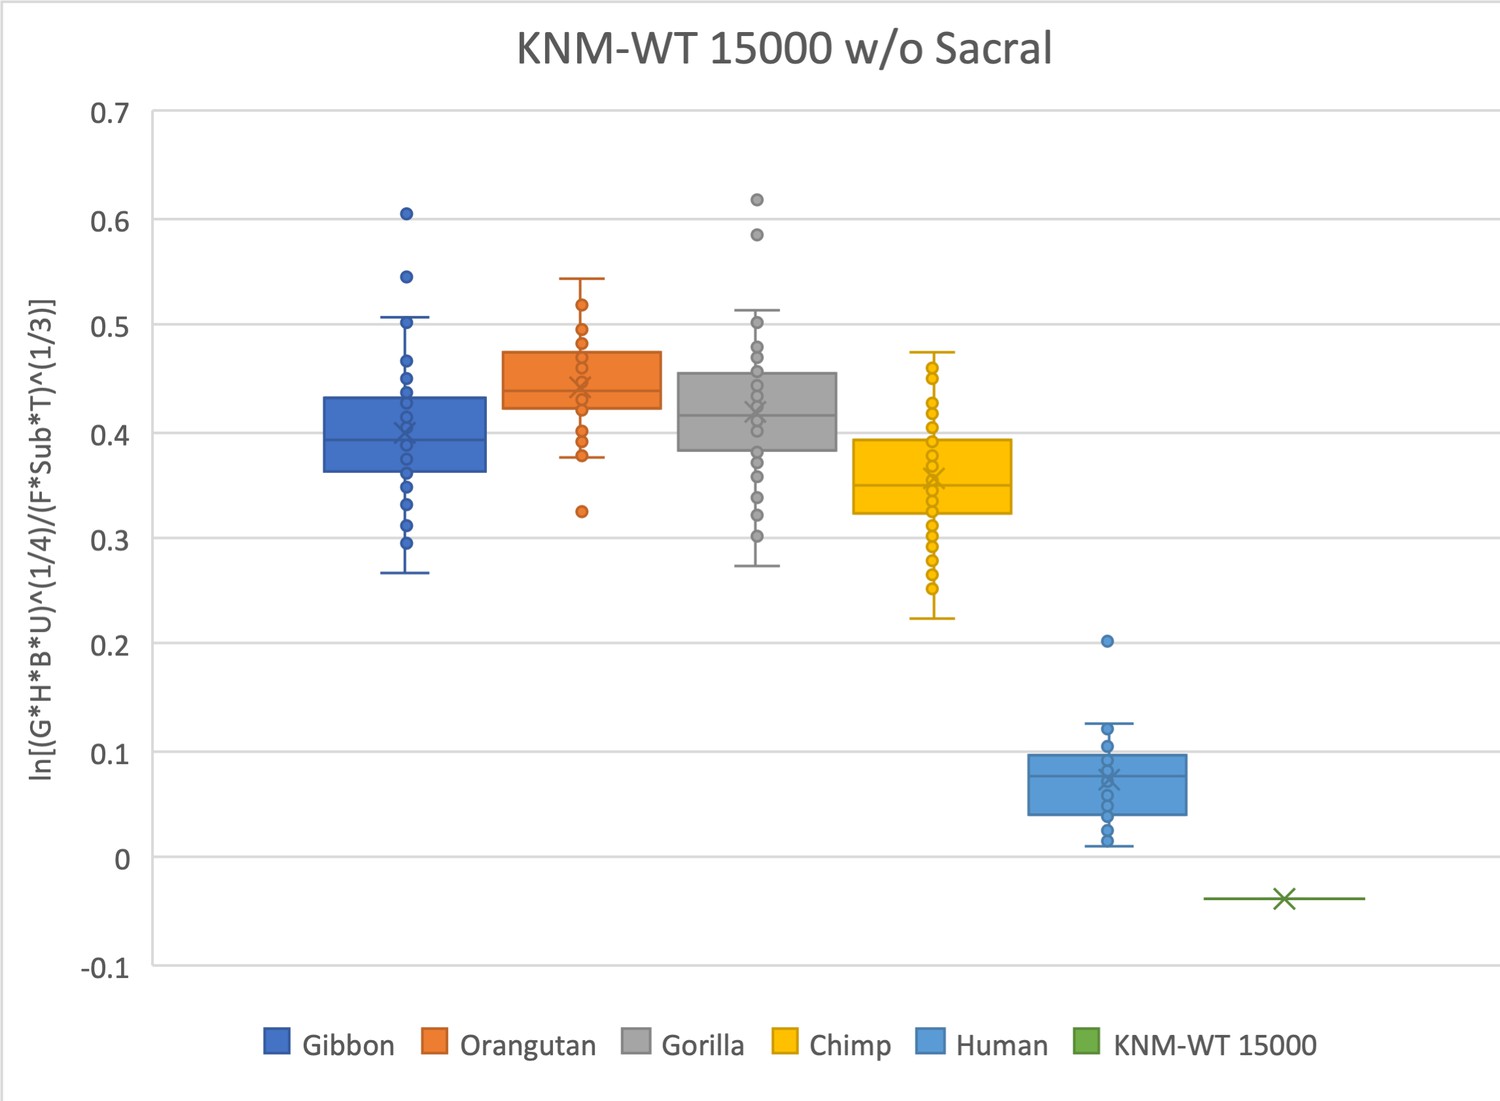
Figure 4—figure supplement 4
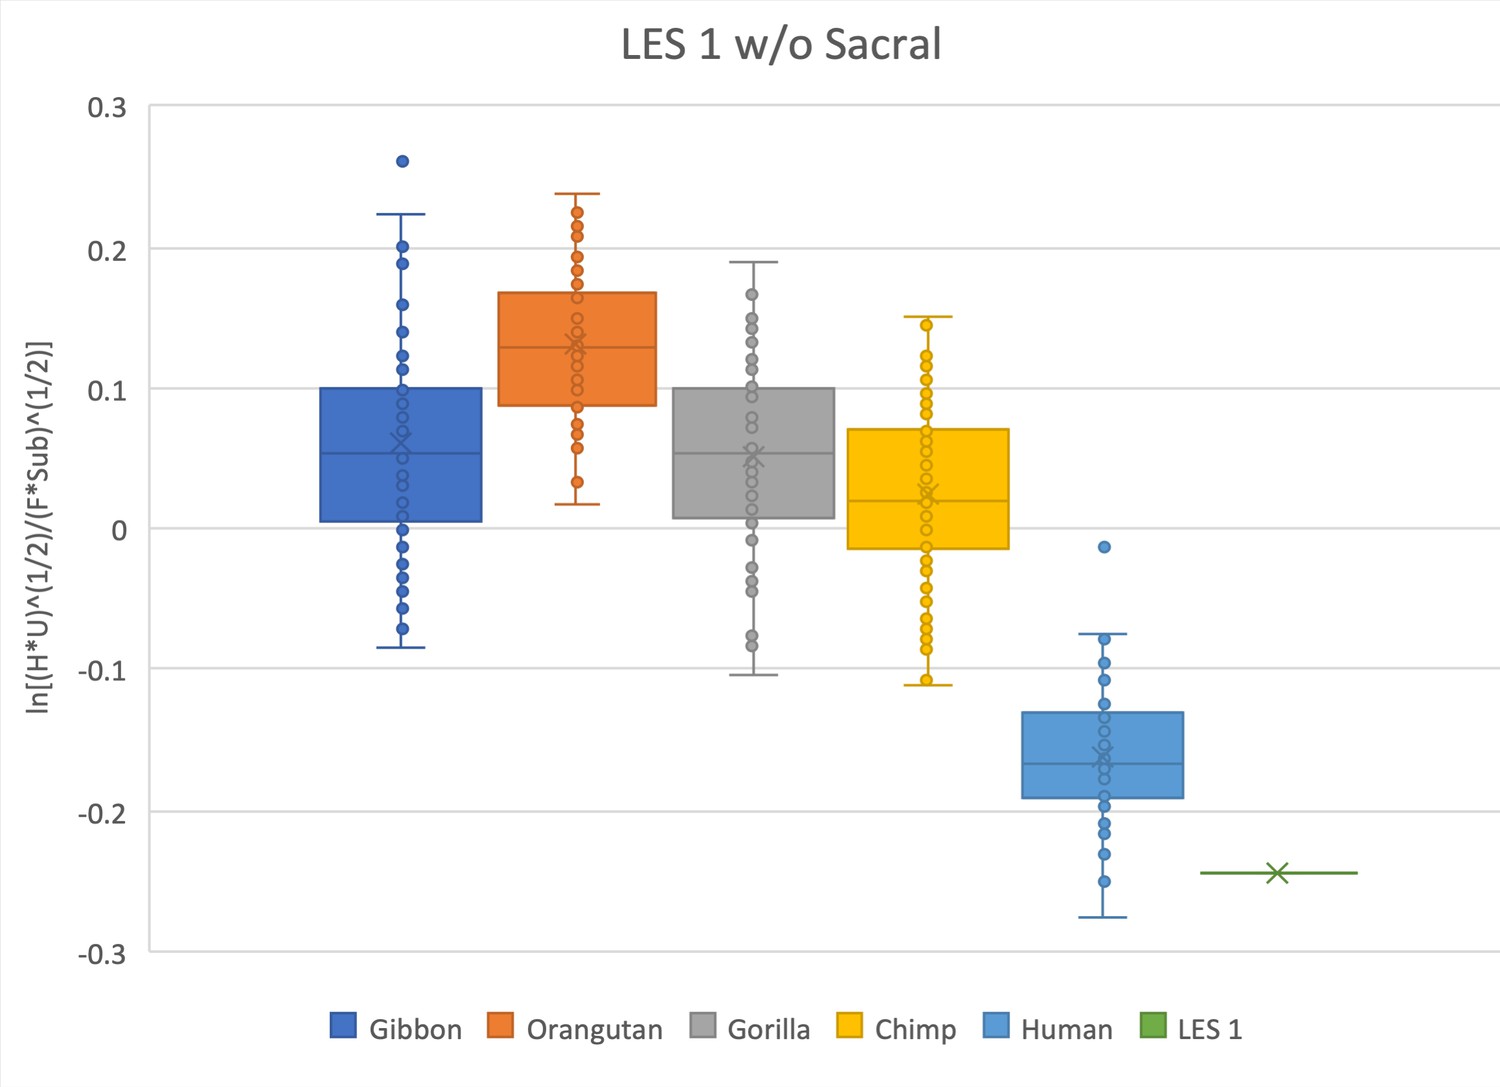
Same as for Figure 2—figure supplement 5, except in this relative limb size index (RLSI) analysis the sacrum has been removed.
Doing so gives the hylobatids a slightly higher RLSI.
Figure 5
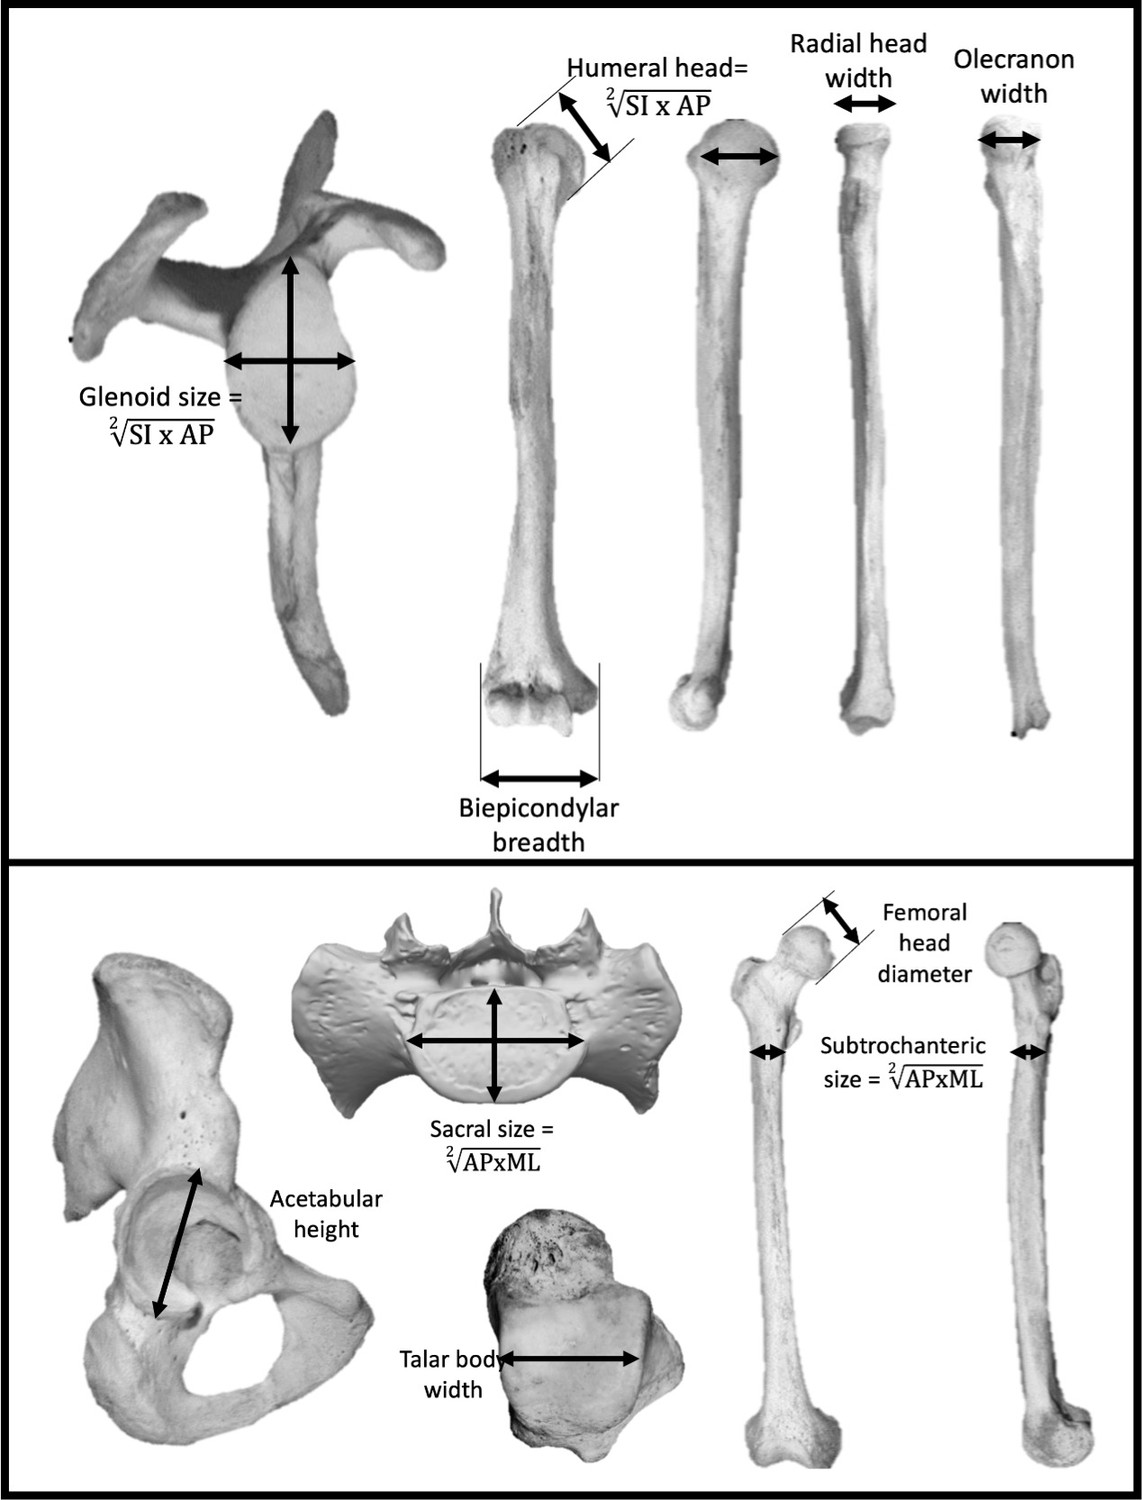
Linear measurements were taken on the upper limb (top) and lower limb (bottom).
Limb joint proportions were calculated using the relative limb size index, which is the logged ratio of geometric means calculated from forelimb and hindlimb measurements shown above (Green et al., 2007).
Tables
Table 1
Fossil hominin and extant hominoid measurements.
| Specimen | Taxon | G | H | B | U | R | F | Sub | A | T | Sac |
|---|---|---|---|---|---|---|---|---|---|---|---|
| Homo sapiens | 29.5 ± 2.7 (N = 67) | 42.3 ± 3.5 (N = 67) | 59.1 ± 4.7 (N = 52) | 21.8 ± 1.9 (N = 51) | 21.7 ± 2.1 (N = 51) | 44.5 ± 3.5 (N = 67) | 28.6 ± 2.1 (N = 52) | 51.2 ± 3.5 (N = 67) | 28.2 ± 2.0 (N = 66) | 38.6 ± 3.1 (N = 67) | |
| Pan | 26.6 ± 2.4 (N = 113) | 38.2 ± 3.1 (N = 113) | 62.5 ± 5.5 (N = 95) | 22.5 ± 2.8 (N = 95) | 24.5 ± 1.8 (N = 94) | 32.8 ± 2.5 (N = 120) | 25.0 ± 2.0 (N = 98) | 38.6 ± 3.3 (N = 116) | 18.1 ± 34.1 (N = 116) | 28.4 ± 3.9 (N = 109) | |
| Gorilla | 39.2 ± 5.5 (N = 119) | 54.9 ± 7.3 (N = 122) | 93.0 ± 13.0 (N = 94) | 33.4 ± 5.7 (N = 89) | 31.7 ± 4.4 (N = 91) | 46.6 ± 5.9 (N = 125) | 35.7 ± 4.9 (N = 93) | 53.1 ± 6.9 (N = 114) | 24.9 ± 5.6 (N = 108) | 37.7 ± 5.8 (N = 102) | |
| Pongo | 29.2 ± 3.6 (N = 47) | 40.0 ± 4.8 (N = 49) | 63.9 ± 7.1 (N = 45) | 22.1 ± 3.2 (N = 46) | 22.8 ± 2.8 (N = 46) | 32.9 ± 4.0 (N = 49) | 20.8 ± 2.6 (N = 45) | 39.0 ± 4.7 (N = 49) | 18.0 ± 2.7 (N = 46) | 28.0 ± 4.1 (N = 43) | |
| Hylobatids | 13.2 ± 1.7 (N = 62) | 18.5 ± 2.3 (N = 66) | 28.0 ± 3.1 (N = 66) | 11.0 ± 1.5 (N = 66) | 12.6 ± 1.5 (N = 69) | 16.4 ± 2.1 (N = 65) | 11.0 ± 1.5 (N = 65) | 20.6 ± 3.0 (N = 66) | 7.5 ± 1.0 (N = 59) | 14.7 ± 2.3 (N = 58) | |
| A.L. 288-1 | A. afarensis | 21.6 | 28.9 | 41.1 | 16.1 | 15.1 | 28.6 | 20.8 | 37.0 | 18.0 | 25.3 |
| KSD-VP-1/1 | A. afarensis | 30.1 | 58.8 | 49.0 | 32.4 | ||||||
| DIK-1-1 | A. afarensis | 13.5 | 13.1 | ||||||||
| StW 573 | A. prometheus (?); A. africanus | 25.9 | 31.3 | 54.0 | 24.3 | 21.9 | 35.2 | 24.5 | 43.0 | 18.0 | |
| StW 431 | A. africanus | 59.0 | 25.7 | 21.9 | 45.0 | 27.5 | |||||
| MH1 | A. sediba | 57.0 | 18.9 | 33.0 | 23.2 | 22.0 | |||||
| MH2 | A. sediba | 24.6 | 30.1 | 52.4 | 17.4 | 18.8 | 32.7 | 18.1 | 23.6 | ||
| BOU-VP-12/1 | A. garhi(?) | 21.4 | 23.7 | ||||||||
| TM 1517 | P. robustus | 54.0 | 22.0 | 18.9 | |||||||
| OH 80 | P. boisei | 26.3 | 26.5 | ||||||||
| KNM-ER 1500 | P. boisei | 21.4 | 20.2 | 24.2 | 19.2* | ||||||
| KNM-ER 1503/1504 | P. boisei | 57.0 | 30.6 | 22.2 | |||||||
| KNM-ER 3735 | H. habilis | 55.0 | 20.0 | 25.3 | |||||||
| KNM-WT 15000 | H. erectus | 27.6 | 31.6 | 55.0 | 19.0 | 46.0 | 28.8 | 25.0* | 33.6 | ||
| LES 1 | H. naledi | 33.2 | 16.1 | 36.0 | 24.2 | 24.5 | |||||
| LB 1 | H. floresiensis | 19.5 | 31.0 | 22.1 | 36.0 | 19.5 |
-
*Estimated from tibial plafond width.
-
G: glenoid size (geomean of SI height and AP width); H: humeral head diameter (geomean of SI height and AP width); B: humeral biepicondylar breadth; U: ulna olecranon width; R: radial head diameter; F: femoral head diameter; Sub: femoral subtrochanteric width (geomean of ML width and AP breadth); A: acetabulum height; T: talar mediolateral width; Sac: sacral size (geomean of ML width and AP breadth). ±1 standard deviation is given with sample size (N=#).
Additional files
-
Supplementary file 1
The table shows which joint measurements were taken for each fossil specimen as well as the formula used to express its relative upper limb to lower limb ratio as a geometric mean.
G: glenoid size; H: humeral head diameter; B: humeral biepicondylar breadth; U: ulna olecranon width; R: radial head diameter; F: femoral head diameter; Sub: femoral subtrochanteric size; A: acetabulum height; T: talar width; Sac: sacral size. Cases in which only a single upper and/or lower limb measurement was possible (DIK-1-1, BOU-VP-12/1, OH 80, KNM-ER 1503/1504, KNM-ER 3735); the reported ratio does not include a geometric mean.
- https://cdn.elifesciences.org/articles/65897/elife-65897-supp1-v1.docx
-
Transparent reporting form
- https://cdn.elifesciences.org/articles/65897/elife-65897-transrepform1-v1.docx
Download links
A two-part list of links to download the article, or parts of the article, in various formats.
Downloads (link to download the article as PDF)
Open citations (links to open the citations from this article in various online reference manager services)
Cite this article (links to download the citations from this article in formats compatible with various reference manager tools)
Homoplasy in the evolution of modern human-like joint proportions in Australopithecus afarensis
eLife 10:e65897.
https://doi.org/10.7554/eLife.65897


