Naa12 compensates for Naa10 in mice in the amino-terminal acetylation pathway
- Department of Life Science and College of Natural Sciences, Ewha Womans University, Republic of Korea
- Laboratory Animal Resource Center Korea ResearchInstitute of Bioscience and Biotechnology, Republic of Korea
- Stanley Institute for Cognitive Genomics, Cold Spring Harbor Laboratory, United States
- Department of Chemistry, University of Pennsylvania, United States
- Abramson Family Cancer Research Institute, Perelman School of Medicine, University of Pennsylvania, United States
- Department of Biomedicine, University of Bergen, Norway
- Department of Molecular Biology, New York State Institute for Basic Research in Developmental Disabilities, United States
- Department of Human Genetics, New York State Institute for Basic Research in Developmental Disabilities, United States
- Research Design and Analysis Service, New York State Institute for Basic Research in Developmental Disabilities, United States
- Center for Cardiovascular Research, Washington University School of Medicine, United States
- Center for Theragnosis, Korea Institute of Science and Technology, Republic of Korea
- Herman B. Wells Center for Pediatric Research, Indiana University School of Medicine, United States
- Department of Converging Science and Technology, KHU-KIST, Kyung Hee University, Republic of Korea
- Department of Life Sciences, Pohang University of Science and Technology, Republic of Korea
- Department of Biological Sciences, University of Bergen, Norway
- Department of Surgery, Haukeland University Hospital, Norway
- Department of Biochemistry and Biophysics, Perelman School of Medicine, University of Pennsylvania, United States
- Biology PhD Program, The Graduate Center, The City University of New York, United States
- George A. Jervis Clinic, New York State Institute for Basic Research in Developmental Disabilities, United States
Figures
Figure 1 with 2 supplements
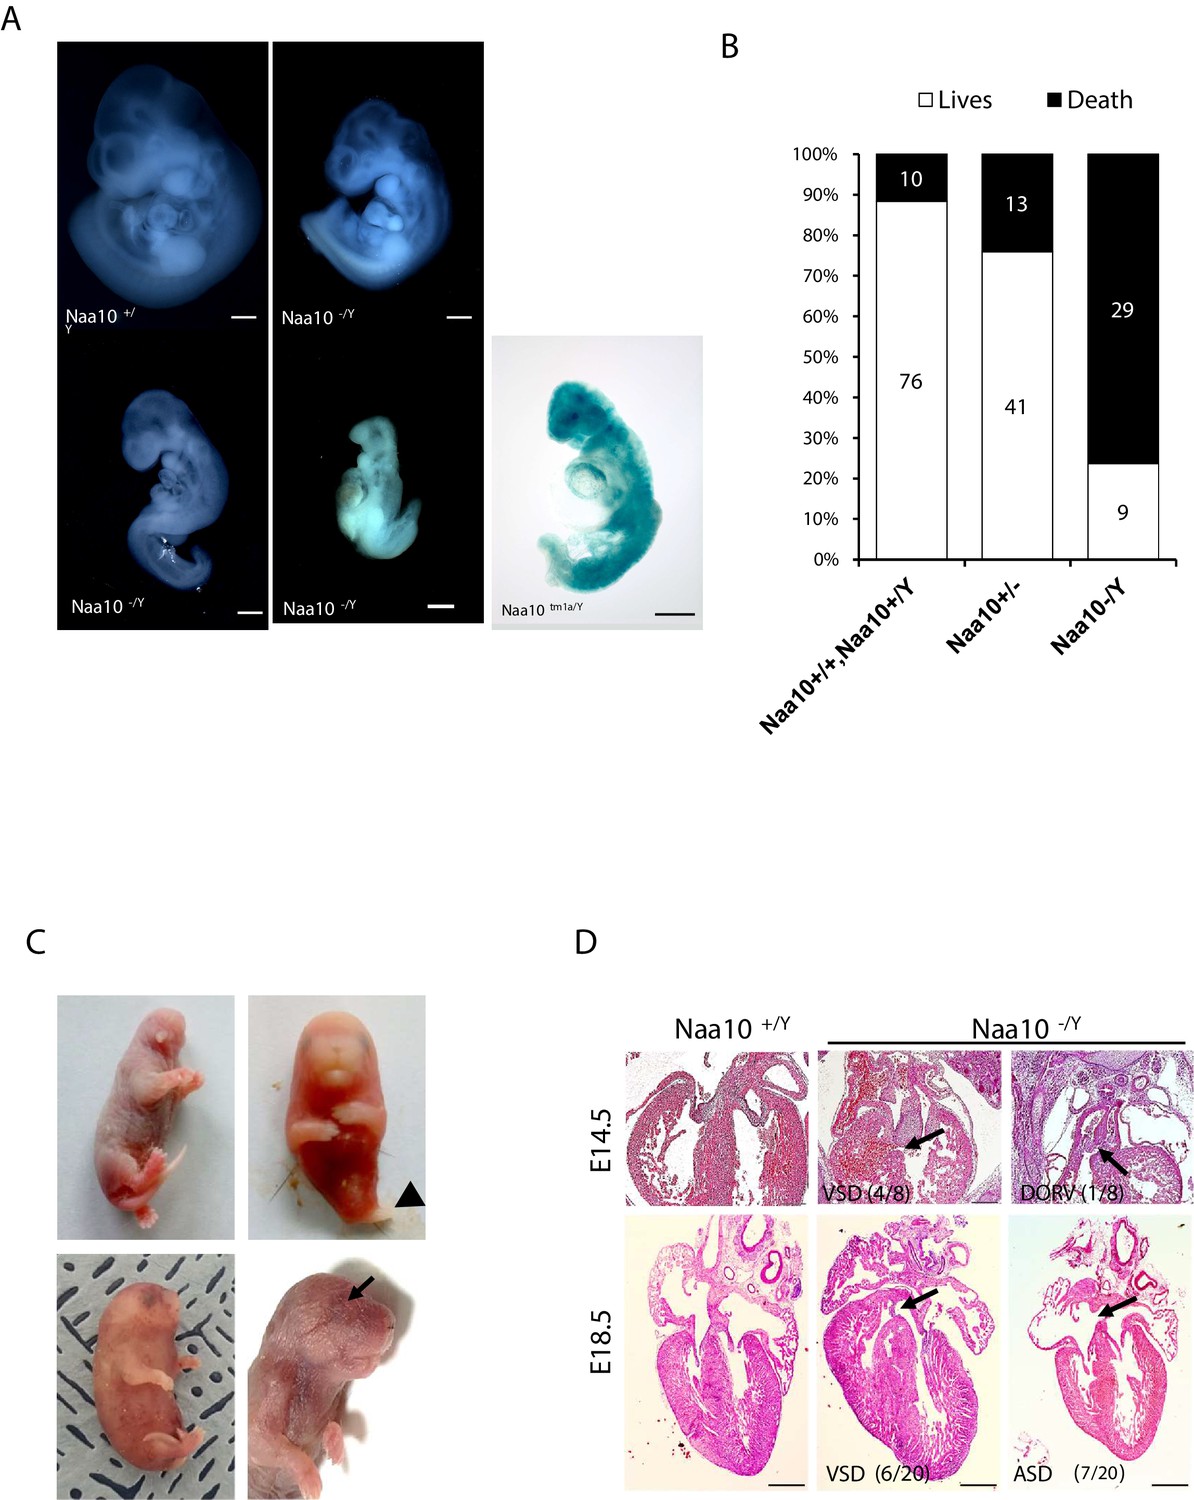
Deficiency of Naa10 leads to abnormal development and postnatal lethality.
(A) Naa10+/Y, Naa10-/Y, and Naa10tm1a/Y embryos at E10.5. Growth retardation (5/33, more than five somites lower or undersized compared to littermate controls), kinky trunk, and developmental arrest are shown in Naa10-/Y (4/33) and Naa10tm1a/Y (1/5). Scale bars: 500 μm. (B) The percentage lethality in newborns, comparing Naa10 wildtype (WT) (Naa10+/Y and Naa10+/+), Naa10-/+ and Naa10-/Y pups until P3, derived from matings between heterozygous females and WT males. Approximately 11.6% (10/86) of WT, 24% (13/54) of Naa10+/-, and 76.3% (29/38) of Naa10-/Y mice were found dead before P3. (C) Representative images of Naa10-/Y pups during early postnatal days compared with Naa10+/Y. Severe developmental defects such as malformations of head and lower body (one leg; black arrowheads), whole-body edema, and anophthalmia (black arrows) are shown (N = 1 each). (D) Hematoxylin and eosin (H&E)-stained heart transverse section at E14.5 and vertical section at E18.5, comparing Naa10+/Y and Naa10-/Y embryos. Naa10-/Y embryo shows a ventricular septal defect (VSD) at E14.5 and E18.5. Also, at E18.5, Naa10-/Y embryo shows atrial septal defect (ASD). Arrow indicates VSD, ASD, and double outlet right ventricle (DORV). Scale bars: 20 μm.
Figure 1—figure supplement 1
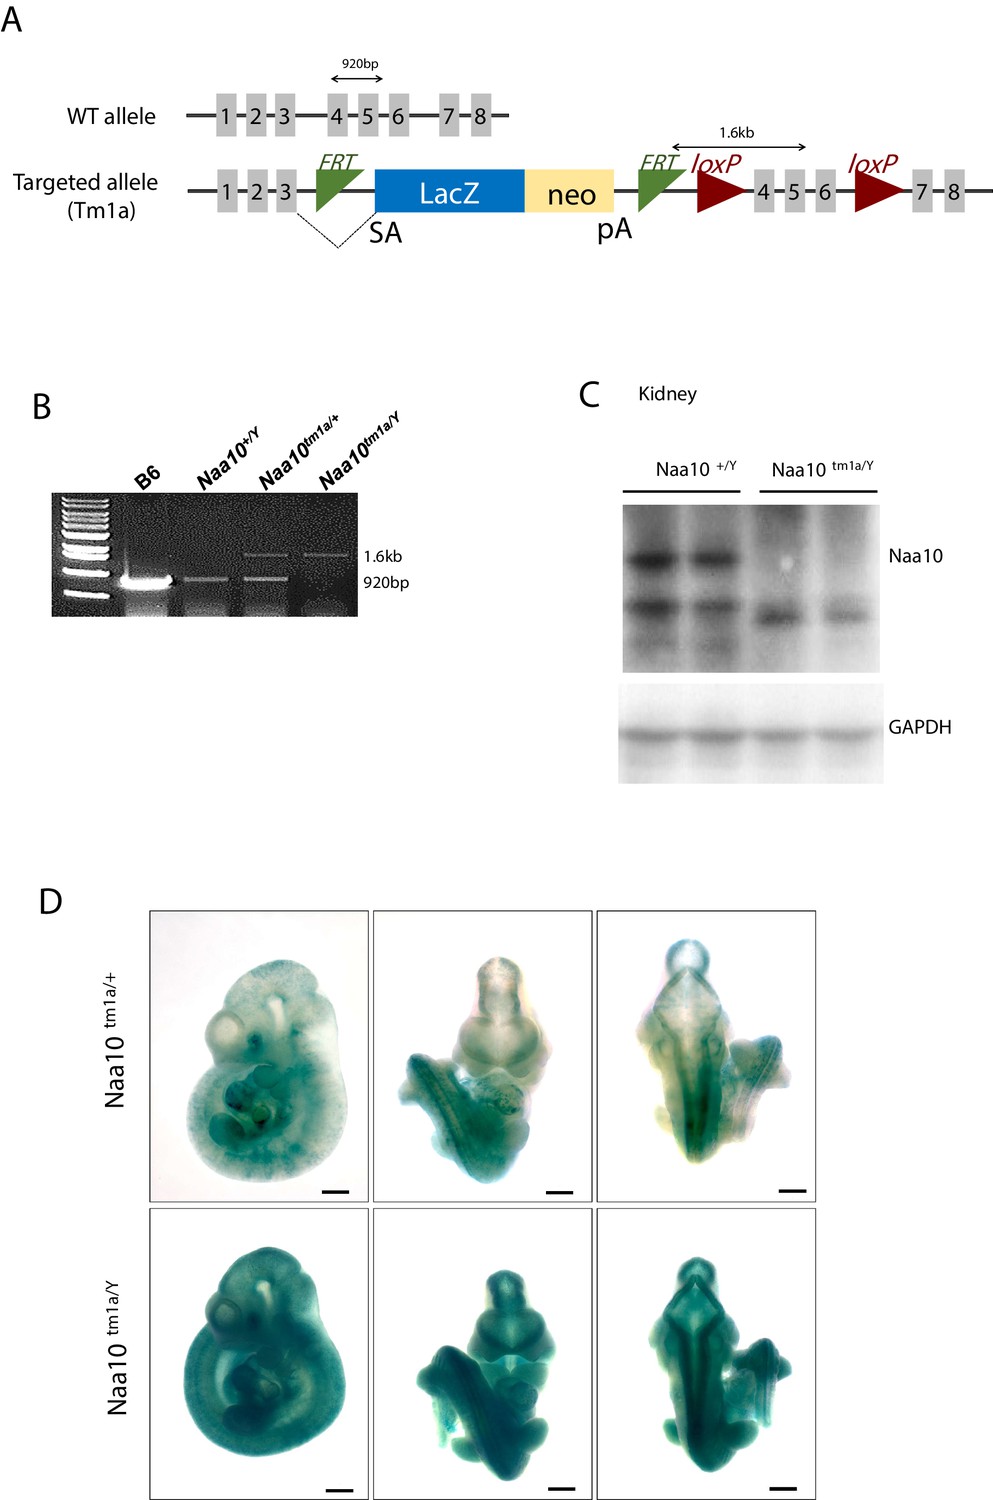
Generation and confirmation of Naa10tm1a mice.
(A) Schematic illustration of the Naa10tm1a mice. (B) PCR confirmation of Naa10 deficiency. (C) Confirmation of Naa10 protein in kidney tissue by western blot. Naa10 protein is not detected in Naa10-/Y mouse. (D) Expression pattern of Naa10 in the embryo. β-Gal staining represents Naa10 localization.
-
Figure 1—figure supplement 1—source data 1
Generation and confirmation of Naa10tm1a mice.
- https://cdn.elifesciences.org/articles/65952/elife-65952-fig1-figsupp1-data1-v3.pdf
-
Figure 1—figure supplement 1—source data 2
Generation and confirmation of Naa10tm1a mice.
- https://cdn.elifesciences.org/articles/65952/elife-65952-fig1-figsupp1-data2-v3.pdf
-
Figure 1—figure supplement 1—source data 3
Generation and confirmation of Naa10tm1a mice.
- https://cdn.elifesciences.org/articles/65952/elife-65952-fig1-figsupp1-data3-v3.pdf
Figure 1—figure supplement 2
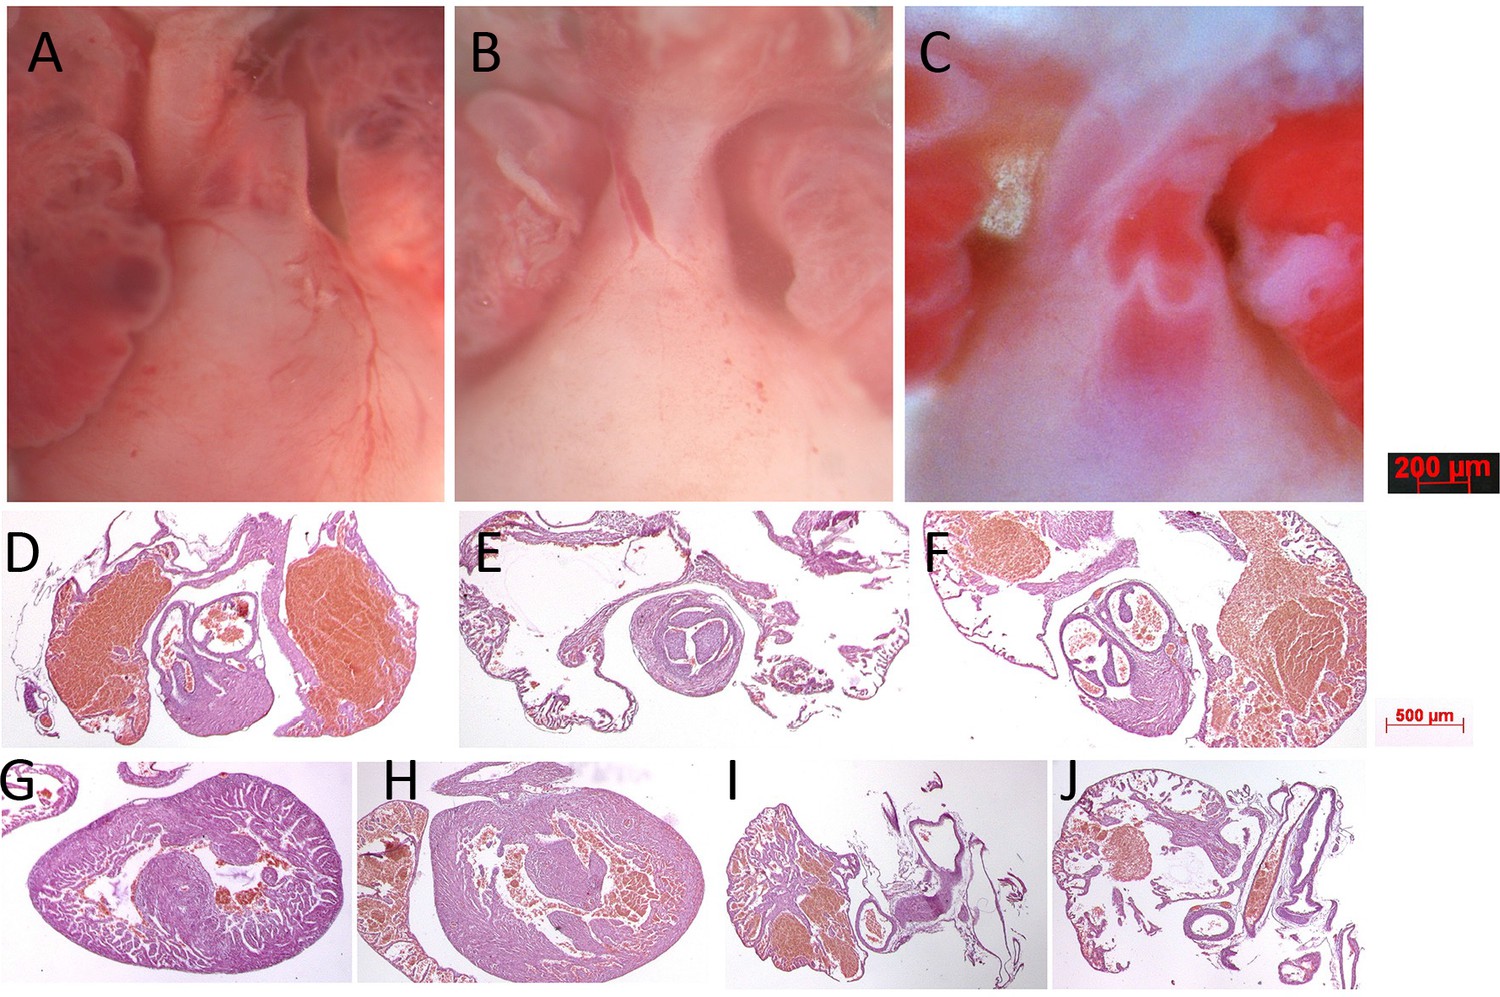
Gross anatomy and histology of neonatal mouse hearts.
(A) Wildtype male heart outflow tract region indicating separate aorta and pulmonary trunks nestled between left and right atria. (B) Naa10-/- female heart from dying P0 pup only has a single outflow tract emerging from the right ventricle, resulting in persistent truncus arteriosus. (C) Naa10-/y male heart from dying P0 pup has separate outflow tracts but both emerge from the right ventricle, resulting in double outlet right ventricle. (D) Normal histology from wildtype male heart of pulmonary artery exiting the right ventricle. (E) Histology from Naa10-/- heart of single outflow tract exiting the right ventricle with tricuspid valve leaflets. (F) Histology from Naa10-/y heart of both pulmonary and aortic arteries emerging from right ventricle within the same plane. (G) Naa10-/- histology showing membranous ventricular septal defect (VSD). (H) Naa10-/y histology showing muscular VSD. (I) Normal heart revealing closed ductus arterious. (J) Naa10-/- histology showing open ductus arterious leading to pulmonary overload and likely lethality.
Figure 2 with 2 supplements
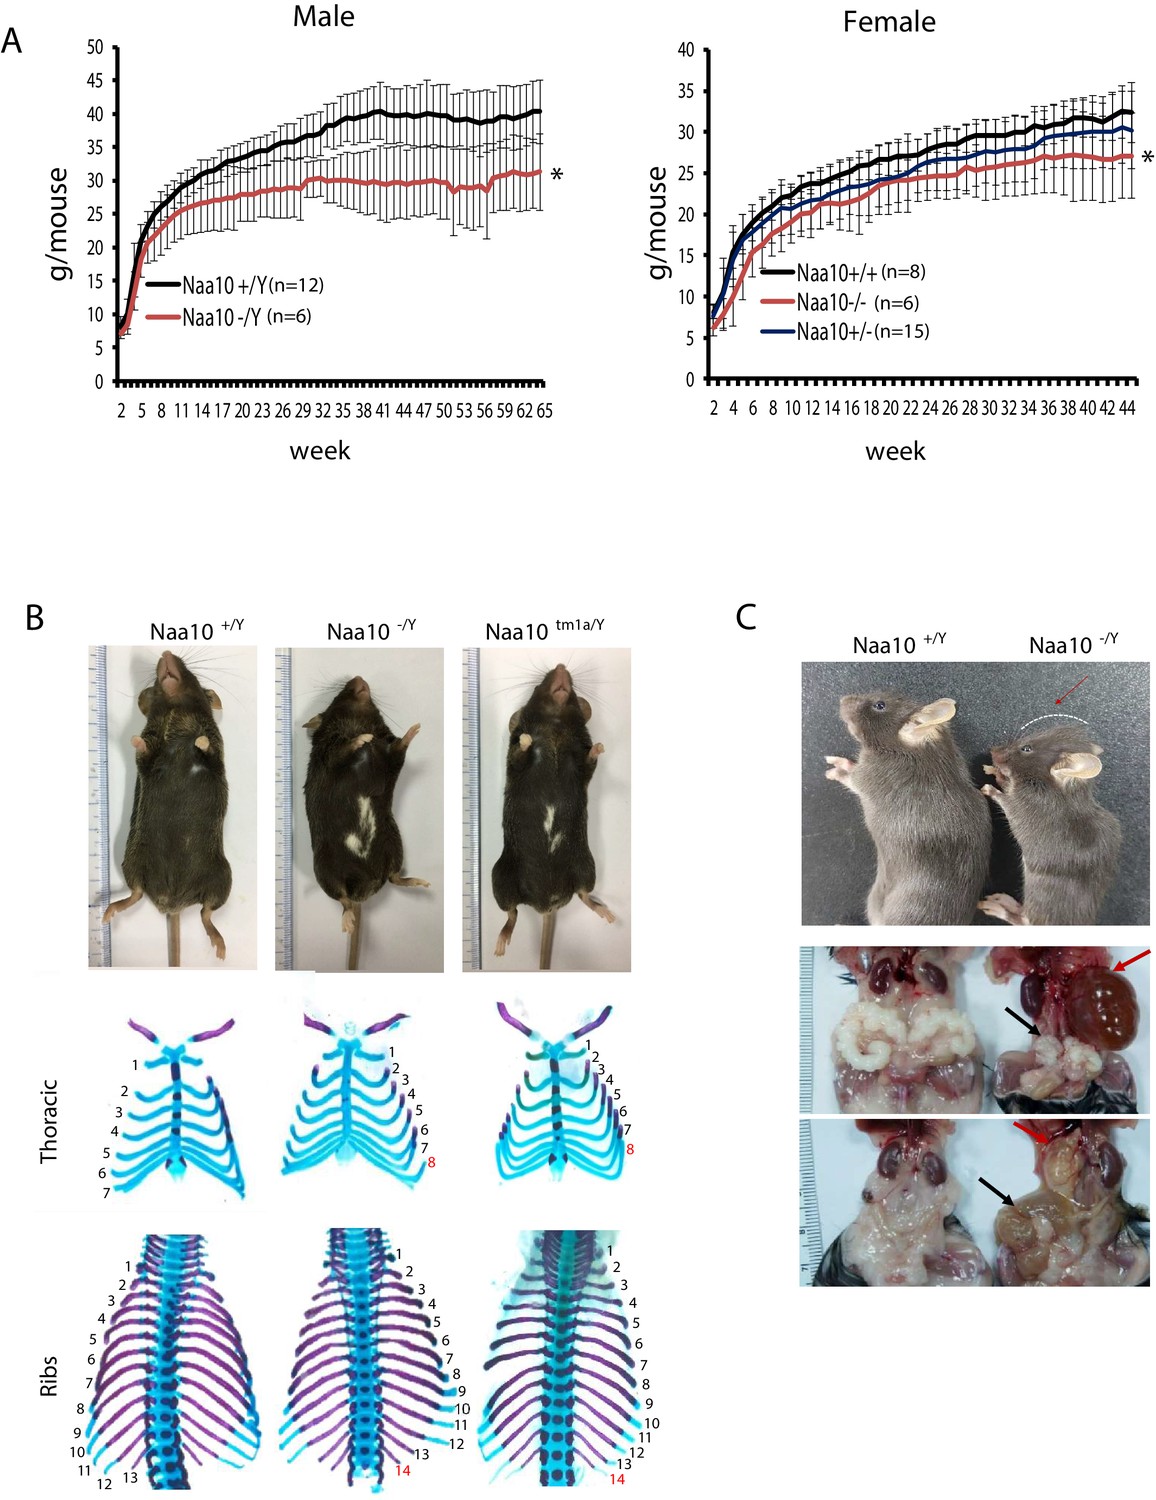
Pleiotropic phenotypes of Naa10 knockout (KO) mice.
(A–C) Representative images of abnormalities in Naa10-/Y compared with Naa10+/Y. (A) Body weight of male (left) and female (right) versus ages was monitored from 2 weeks. The weight of Naa10-/Y and Naa10-/- mice is markedly reduced compared with that of the wildtype (WT) mice. Asterisks indicate a statistical difference calculated by Student’s t-test: *p<0.05. (B) Representative images of completely penetrant phenotypes. Hypopigmentation (Naa10+/Y, n = 243; Naa10-/Y, n = 121; Naa10tm1a/Y, n = 17) and supernumerary ribs (Naa10+/Y, n = 3; Naa10-/Y, n = 6; Naa10tm1a/Y, n = 2; E18.5) were found 100% in Naa10-deficient mice. (C) Naa10-/Y is smaller in size and has round-shaped head (Naa10+/Y 0/59, Naa10-/Y 7/33). Over time, hydrocephaly became apparent (N = 14/29 [~48%] for >P7 male Naa10-Y; N = 7/19 [~36%] for >P7 female Naa10-/-). Hydronephrosis (red arrow, Naa10+/Y 0/23, Naa10-/Y 14/29, Naa10+/+ 0/5, Naa10-/- 7/19) and abnormal genitalia (black arrow) of male (middle, Naa10+/Y 0/23, Naa10-/Y 16/29) and female (bottom, hydrometrocolpos, Naa10+/+ 0/5, Naa10-/- 7/19) are shown.
Figure 2—figure supplement 1
Skeletal phenotype by CT scanning.
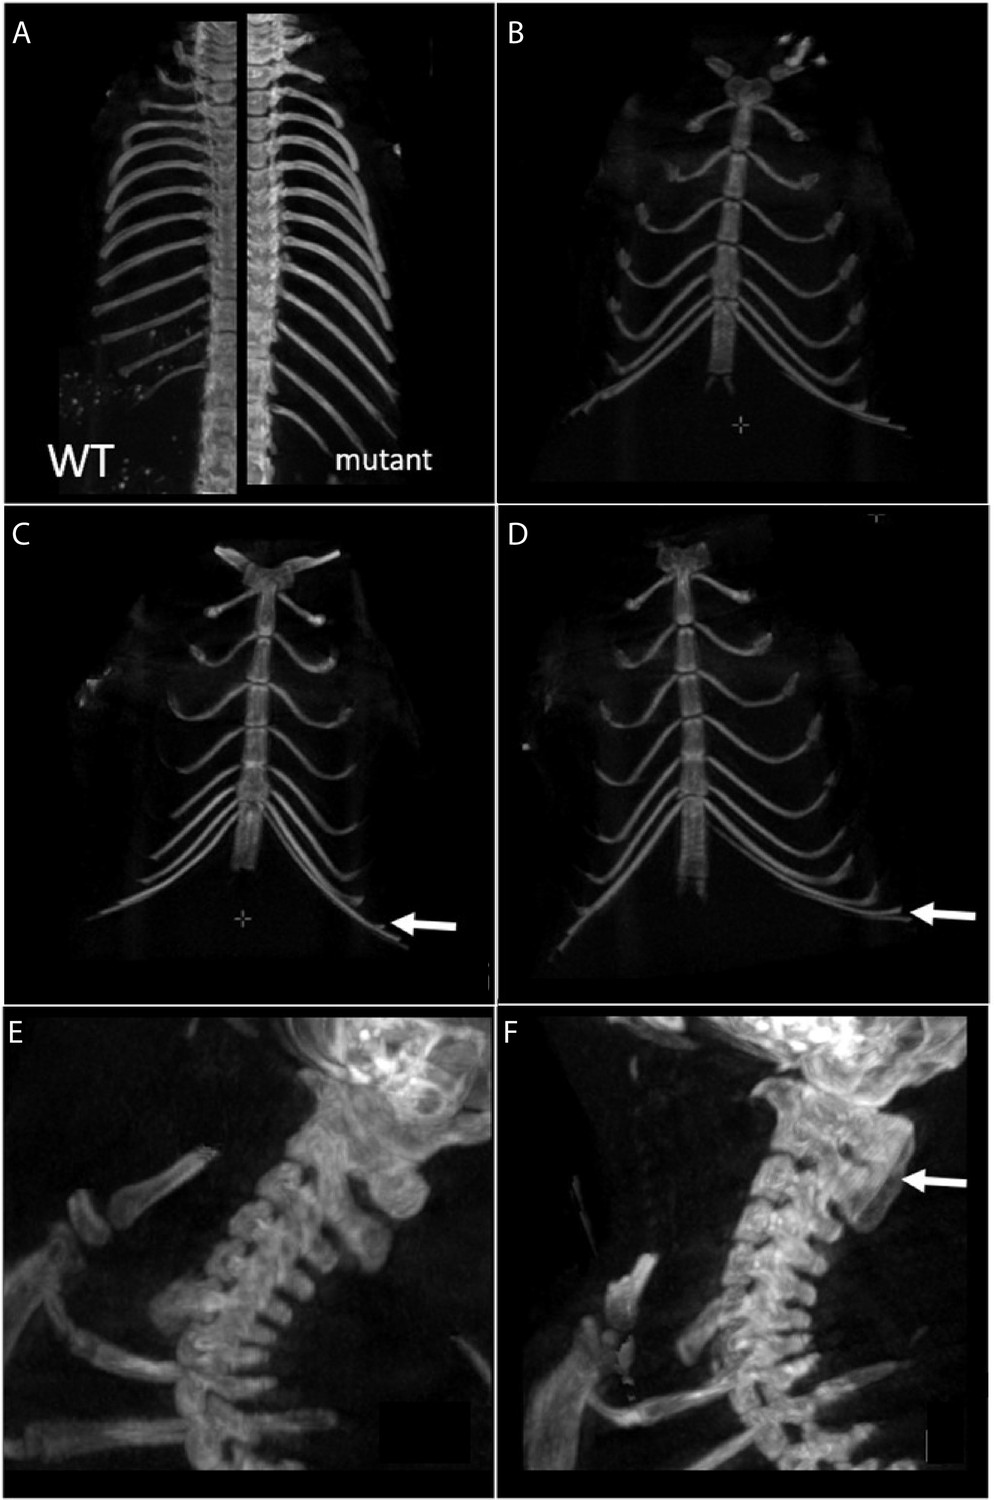
(A) In wildtype (WT) mice, 13 thoracic vertebrae and ribs are numbered, whereas 14 thoracic vertebrae and ribs are counted in mutants (Naa10-/Y) (WT on the left, mutant on the right). n = 11 CT scans for Naa10-/Y compared to n = 18 Naa10+/Y. (B–D) Different number of ribs are linking the sternum between in Naa10-/Y, Naa10-/-, and WT. (B) Seven ribs linking the sternum in WT. (C) Eight ribs linking the sternum (the white arrow shows the eighth rib) in Naa10-/Y. (D) Seven on one side plus seven and one almost linking on the other side. In two mice, an asymmetrical link was observed. White arrow shows the eighth asymmetrical rib. (E, F) Abnormalities in the cervical phenotype. (E) Cervical WT/morphology. (F) Partial fusion of C1 and C2 dorsal arch in one mutant mouse.
Figure 2—figure supplement 2
Hydronephrosis and hydrocephaly in Naa10 KO mice.
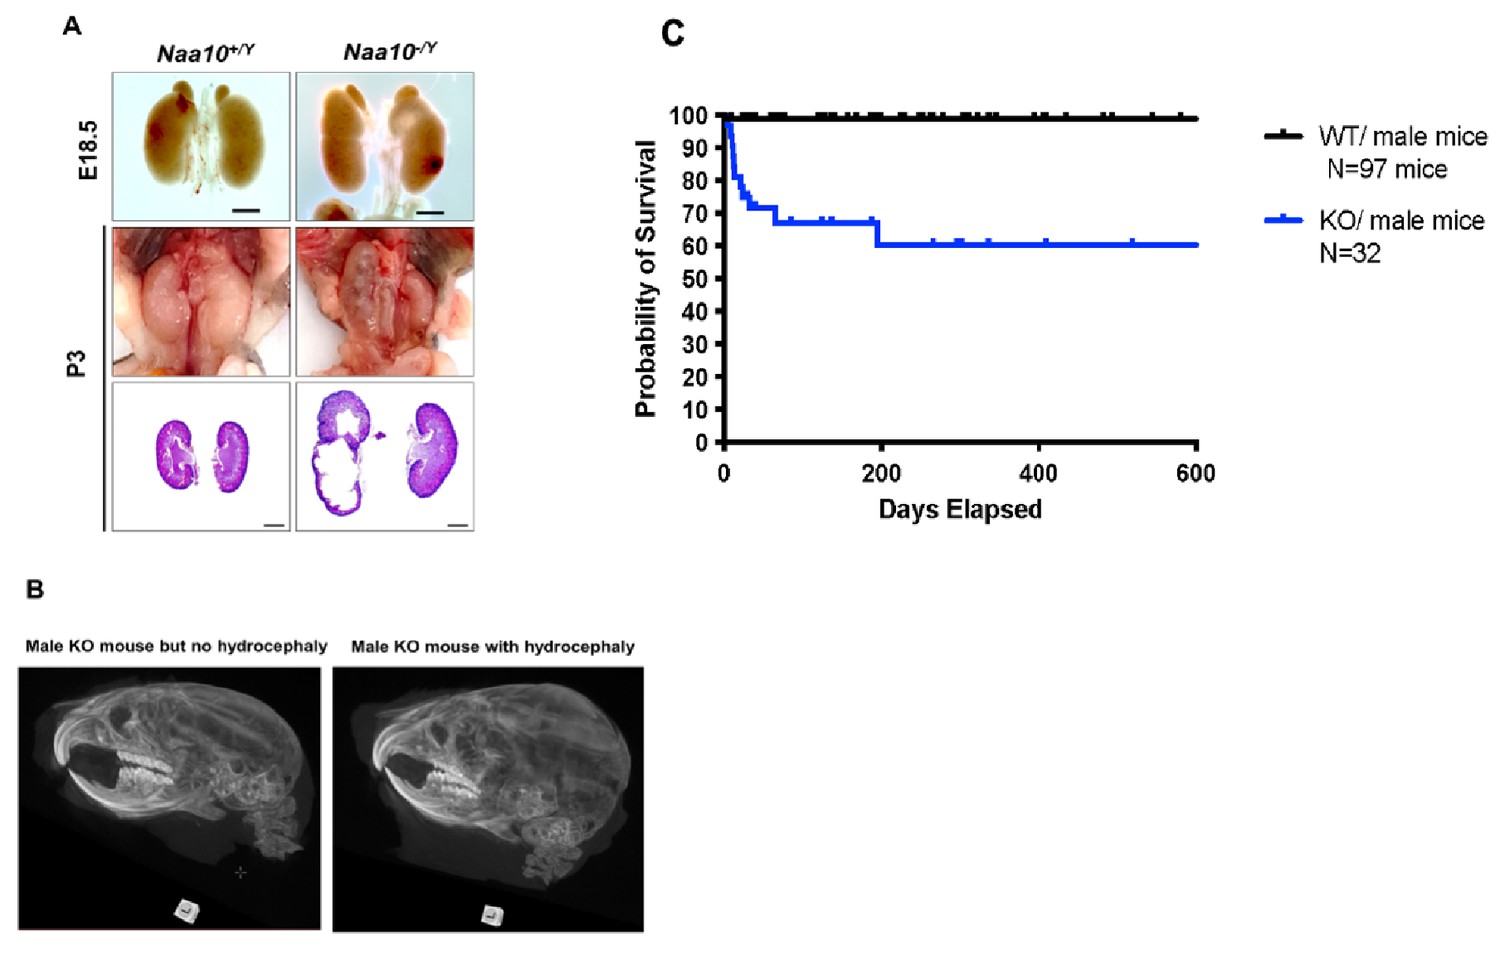
(A) Representative images and histology of renal defects at E18.5 (n = 6 out of 39 examined) and P3 (n = 4 out of 11 examined). (B) Hydrocephaly (n = 3 CT scans for Naa10-/Y mice with hydrocephaly compared to n = 3 Naa10-/Y mice without hydrocephaly). (C) Kaplan–Meier survival curve of the Naa10+/Y and Naa10-/Y male mice starting at 4 days of life, thus not including any mice that died in the first three days of life.
Figure 3 with 1 supplement

Activity measurement of NatA from wildtype (WT) and Naa10 knockout (KO) mice.
(A) Correlation of Naa10 alteration state on amino-terminal acetylation in mouse embryonic fibroblasts (MEFs). Each dot (n = 533) represents the average amino-terminal acetylation percentage of five replicates of Naa10+/Y and Naa10-/Y, respectively. Dashed lines are the borders of ±10% difference. Except for the 10 dots, 522 of the 533 dots are within the borders. The marginal histograms show the distribution of amino-terminal acetylation data points. (B) Immunoprecipitation of Naa15. Liver tissue from WT and Naa10 KO mouse was lysed and incubated with anti-Naa15 antibody to retrieve NatA complexes. Proteins were separated by SDS-PAGE and immunoblots probed with anti-Naa15 antibody and anti-NAA10 antibody. (C) Catalytic activity of immunoprecipitated NatA. The catalytic activity of NatA precipitated from WT and Naa10 KO mouse liver tissue by anti-Naa15 was measured towards the NatA substrate peptide SESS24 in an in vitro [14C]-Ac-CoA–based acetylation assay. Control reactions were performed with no enzyme or no peptide to account for background signal. The immunoprecipitation (IP) and activity measurements were performed in three independent setups, each with three technical replicates per assay. One representative setup is shown.
-
Figure 3—source data 1
Identification of a potential Naa10 homolog.
- https://cdn.elifesciences.org/articles/65952/elife-65952-fig3-data1-v3.pdf
Figure 3—figure supplement 1
Identification of a potential Naa10 homolog.
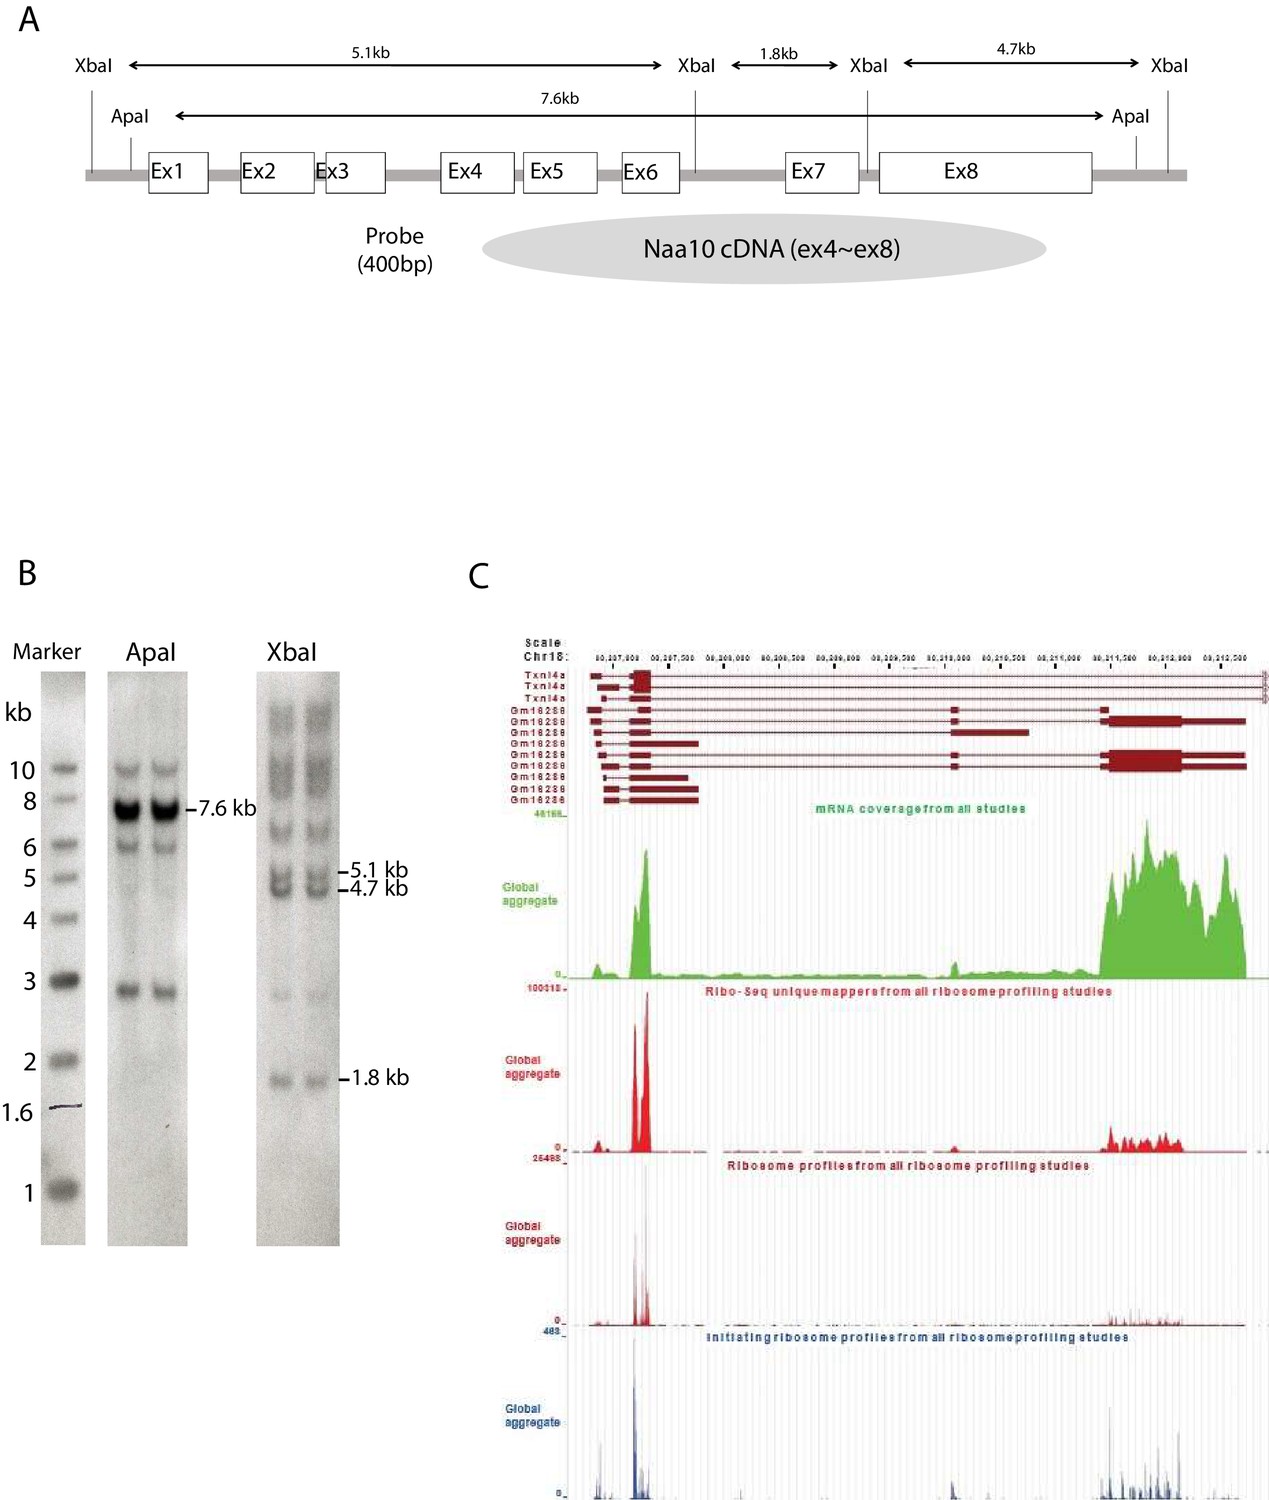
(A) Construction of Naa10 Southern blot probe. (B) Southern blot membrane after hybridization with a Naa10 probe. Expected size band, restricted with Apa I and Xba I, are shown. (C) Ribosome profiling traces for the potential Naa10 paralog (Gm16286, UniProt: Q9CQX6). Picture was modified from GWIPS genome browser, Chr 18, 80206601–80212942.
-
Figure 3—figure supplement 1—source data 1
Identification of a potential Naa10 homolog.
- https://cdn.elifesciences.org/articles/65952/elife-65952-fig3-figsupp1-data1-v3.pdf
Figure 4 with 2 supplements
Characterization of Naa12.
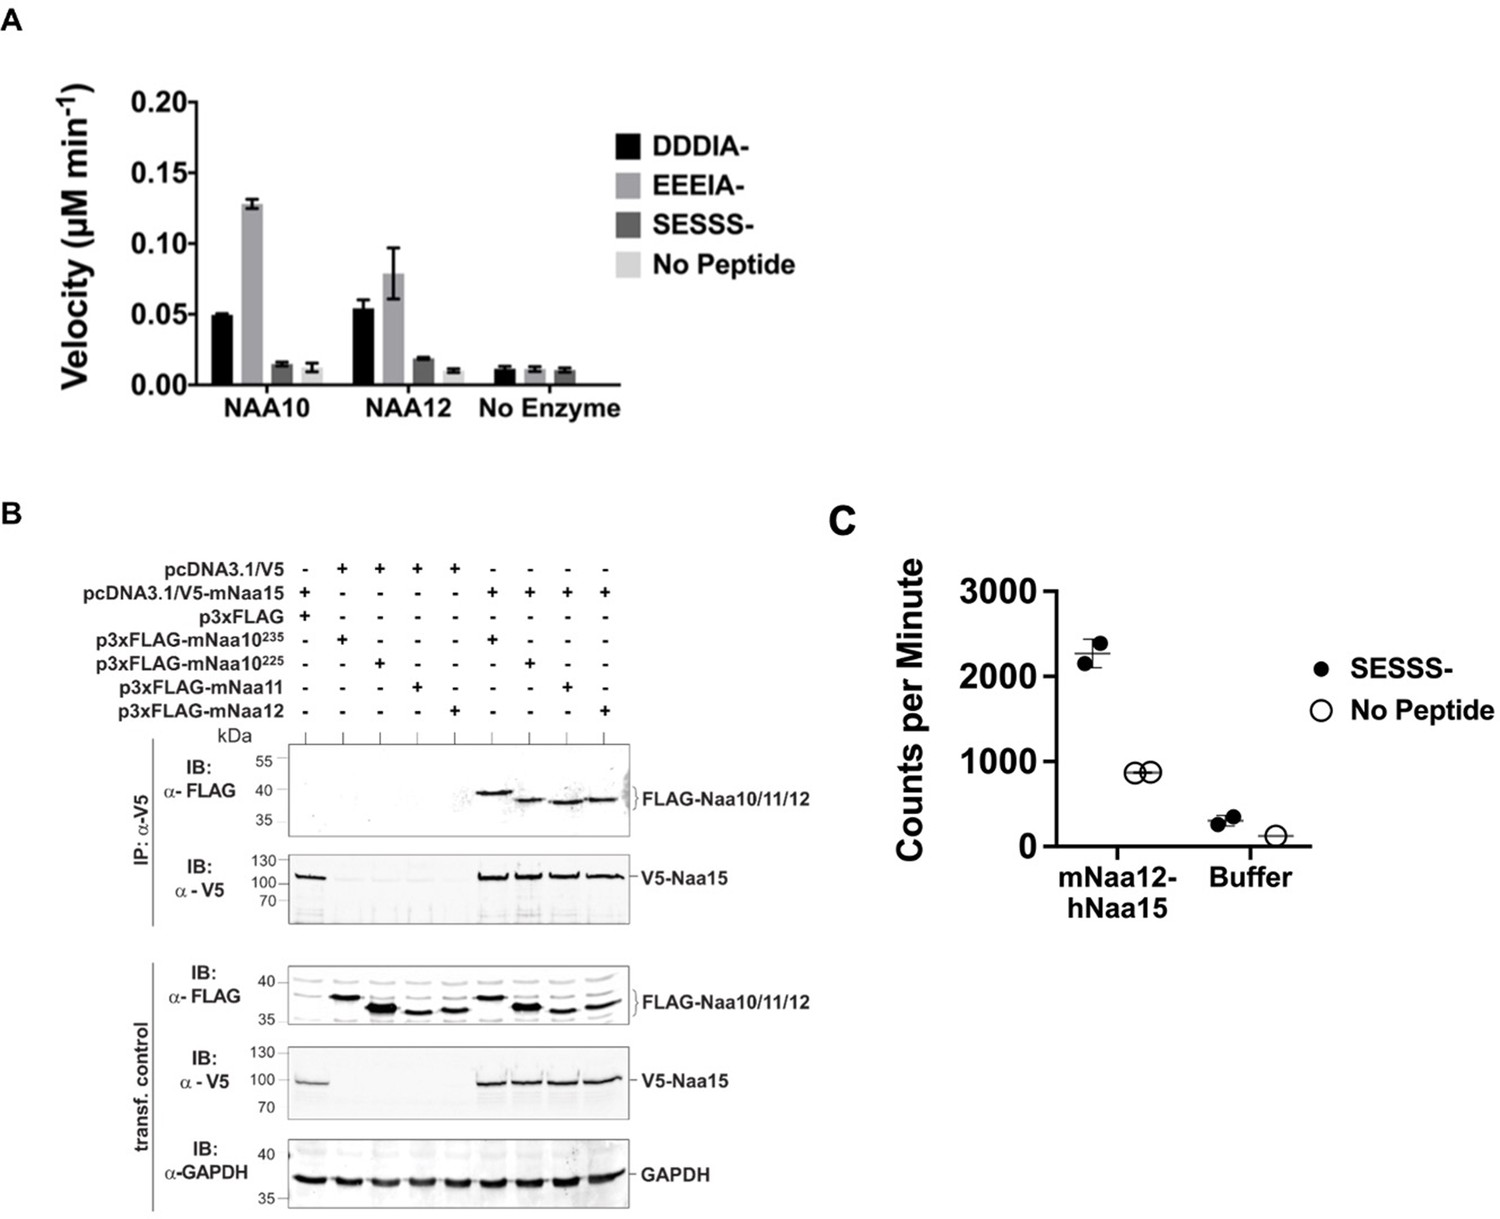
(A) In vitro N-terminal acetyltransferase radioactive-based assay. Comparison of mouse Naa10 and Naa12 towards Naa10 peptide substrates, beta-actin (DDDIA-) and gamma-actin (EEEIA-), and the optimal NatA complex peptide substrate, SESSS-. Background control reactions were performed in the absence of either peptide or enzyme. Assays were performed in triplicate; error bars represent SEM. (B) Co-immunoprecipitation assay. HEK293 cells were transfected as indicated and lysed after 48 hr. Cell lysates were incubated with 1 μg anti-V5 antibody to precipitate V5-tagged Naa15. The isolated complexes were separated on SDS-PAGE and probed with the indicated antibodies. (C) Recombinant mouse Naa12/human Naa15 chimera complex activity. Radioactive acetyltransferase activity assay evaluating the activity of mNaa12-hNaa15 towards peptide (closed circles, ‘mNaa12-hNaa15’) and peptide chemical acetylation in the absence of enzyme (closed circles, ‘Buffer’) as well as chemical acetylation of the enzyme in the absence of peptide (open circles) assay and background (open circles). Error bars represent SD of two technical replicates. These are the same results from fraction #14 (both SESSS- and No Peptide) and both Buffer and Background used to illustrate the size-exclusion-purified mNaa12-hNaa15 complex activity in Figure 4—figure supplement 1F.
-
Figure 4—source data 1
Characterization of a potential Naa10 homolog.
- https://cdn.elifesciences.org/articles/65952/elife-65952-fig4-data1-v3.pdf
Figure 4—figure supplement 1
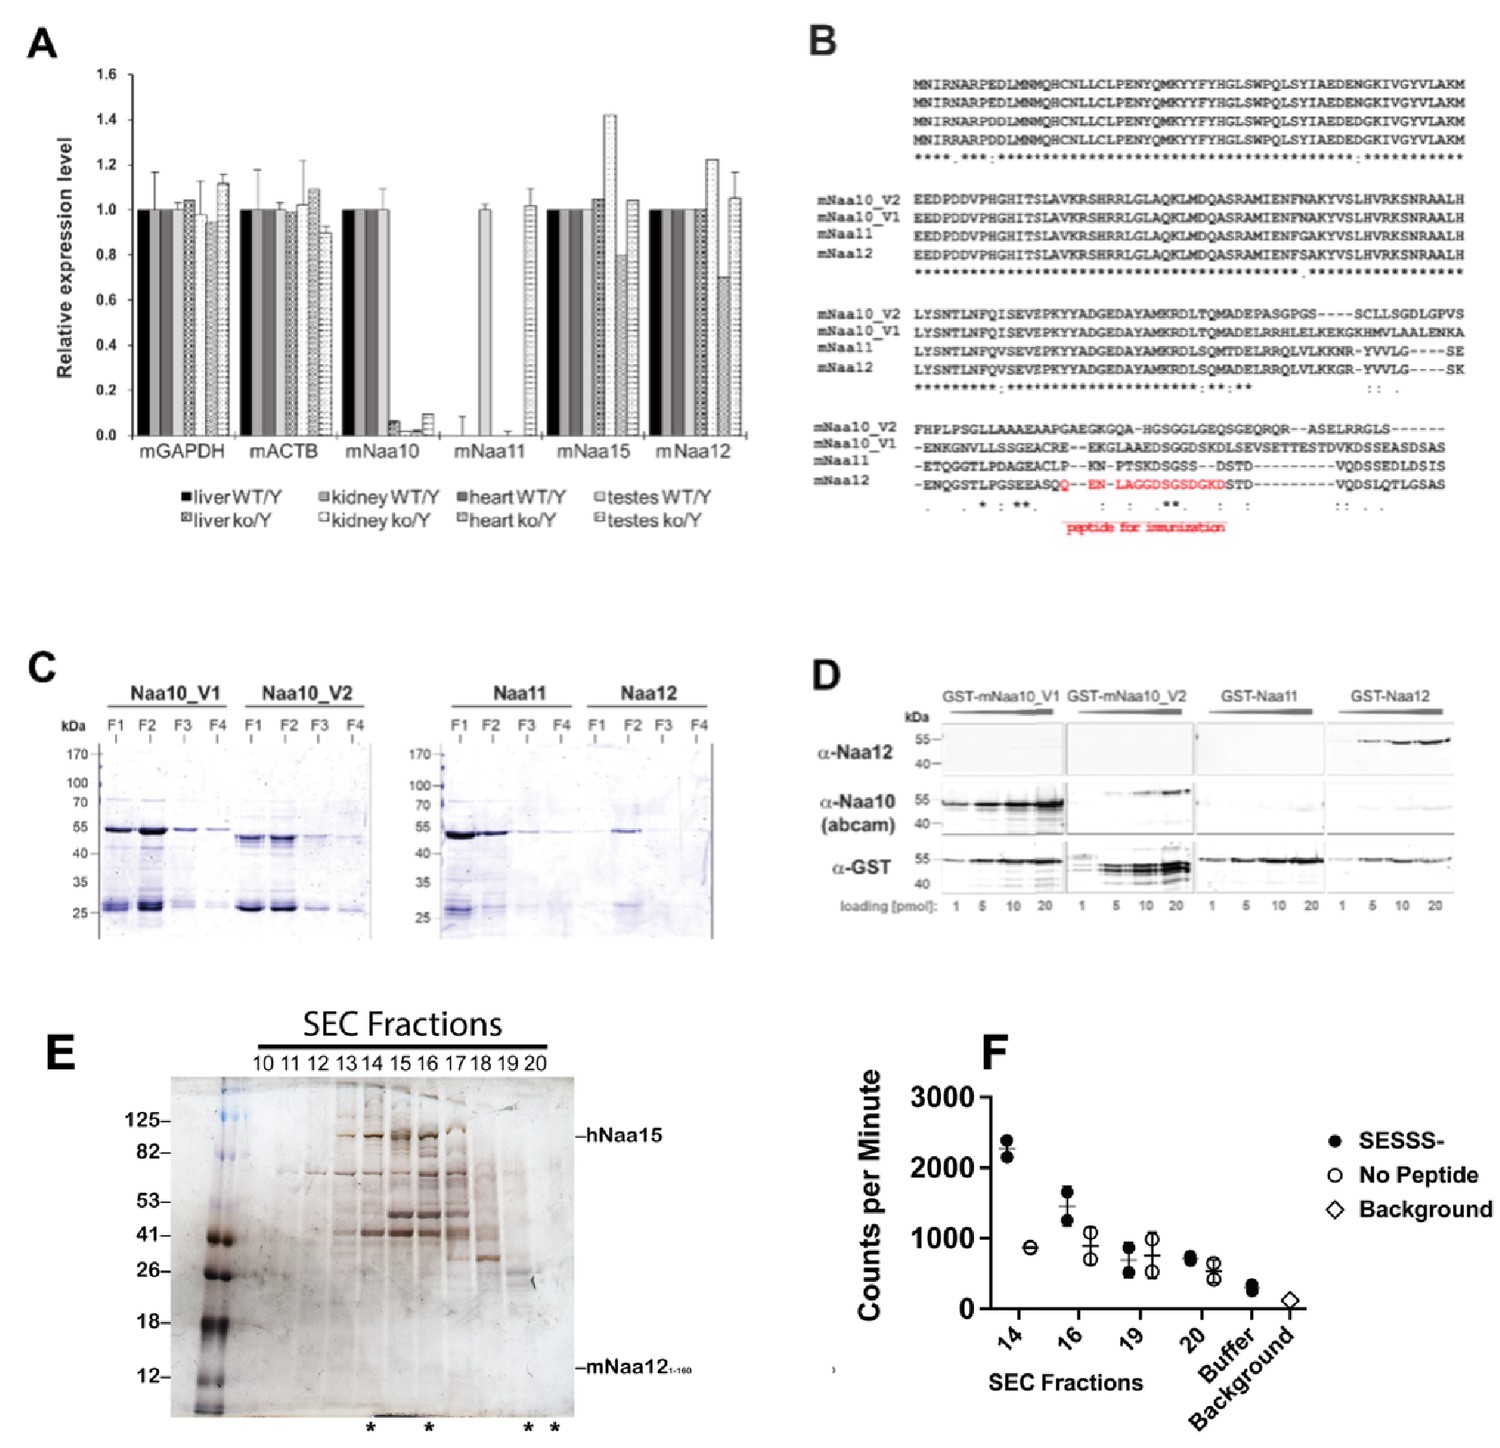
Characterization of a potential Naa10 homolog.
(A) qPCR analyses of mouse NATs (mNATs) in Naa10 wildtype (WT) and knockout (KO) adult mouse tissue. (B) Sequence alignment of mNaa10 isoforms and paralogs, including the potential Naa10 paralog mNaa12 (Gm16286, UniProt: Q9CQX6) using Clustal Omega (EMBL-EBI). The peptide used for immunization of rabbits to generate a specific antibody is indicated in red. (C) Full-length mNAT cDNA from mouse was amplified and cloned into pGEX-4T1. Proteins were expressed in E. coli BL21 (DE3) and purified via GSH-Sepharose. Shown is a Coomassie stain of fraction 1–4. (D) Cross-reactivity and sensitivity of the used NAT antibodies. 1–20 pmol of GST-mNAT proteins were separated on SDS-PAGE followed by western blot, probed with the indicated antibodies. (E) Recombinant mouse Naa12/human Naa15 chimera complex. Silver-stained denaturing SDS-PAGE (left) containing fractions (#10–20) eluted from an S200 size-exclusion chromatography (SEC) column with fractions evaluated for NatA-type activity indicated (asterisks, below gel) with (F) corresponding radioactive acetyltransferase activity assay comparing the activity of indicated fractions and buffer control (chemical acetylation) towards the SESSS- peptide (filled circles), in the absence of peptide (open circles), and assay background (x). Error bars represent SD of two technical replicates.
-
Figure 4—figure supplement 1—source data 1
Characterization of a potential Naa10 homolog.
- https://cdn.elifesciences.org/articles/65952/elife-65952-fig4-figsupp1-data1-v3.pdf
-
Figure 4—figure supplement 1—source data 2
Characterization of a potential Naa10 homolog.
- https://cdn.elifesciences.org/articles/65952/elife-65952-fig4-figsupp1-data2-v3.pdf
-
Figure 4—figure supplement 1—source data 3
Characterization of a potential Naa10 homolog.
- https://cdn.elifesciences.org/articles/65952/elife-65952-fig4-figsupp1-data3-v3.pdf
-
Figure 4—figure supplement 1—source data 4
Characterization of a potential Naa10 homolog.
- https://cdn.elifesciences.org/articles/65952/elife-65952-fig4-figsupp1-data4-v3.pdf
Figure 4—figure supplement 2
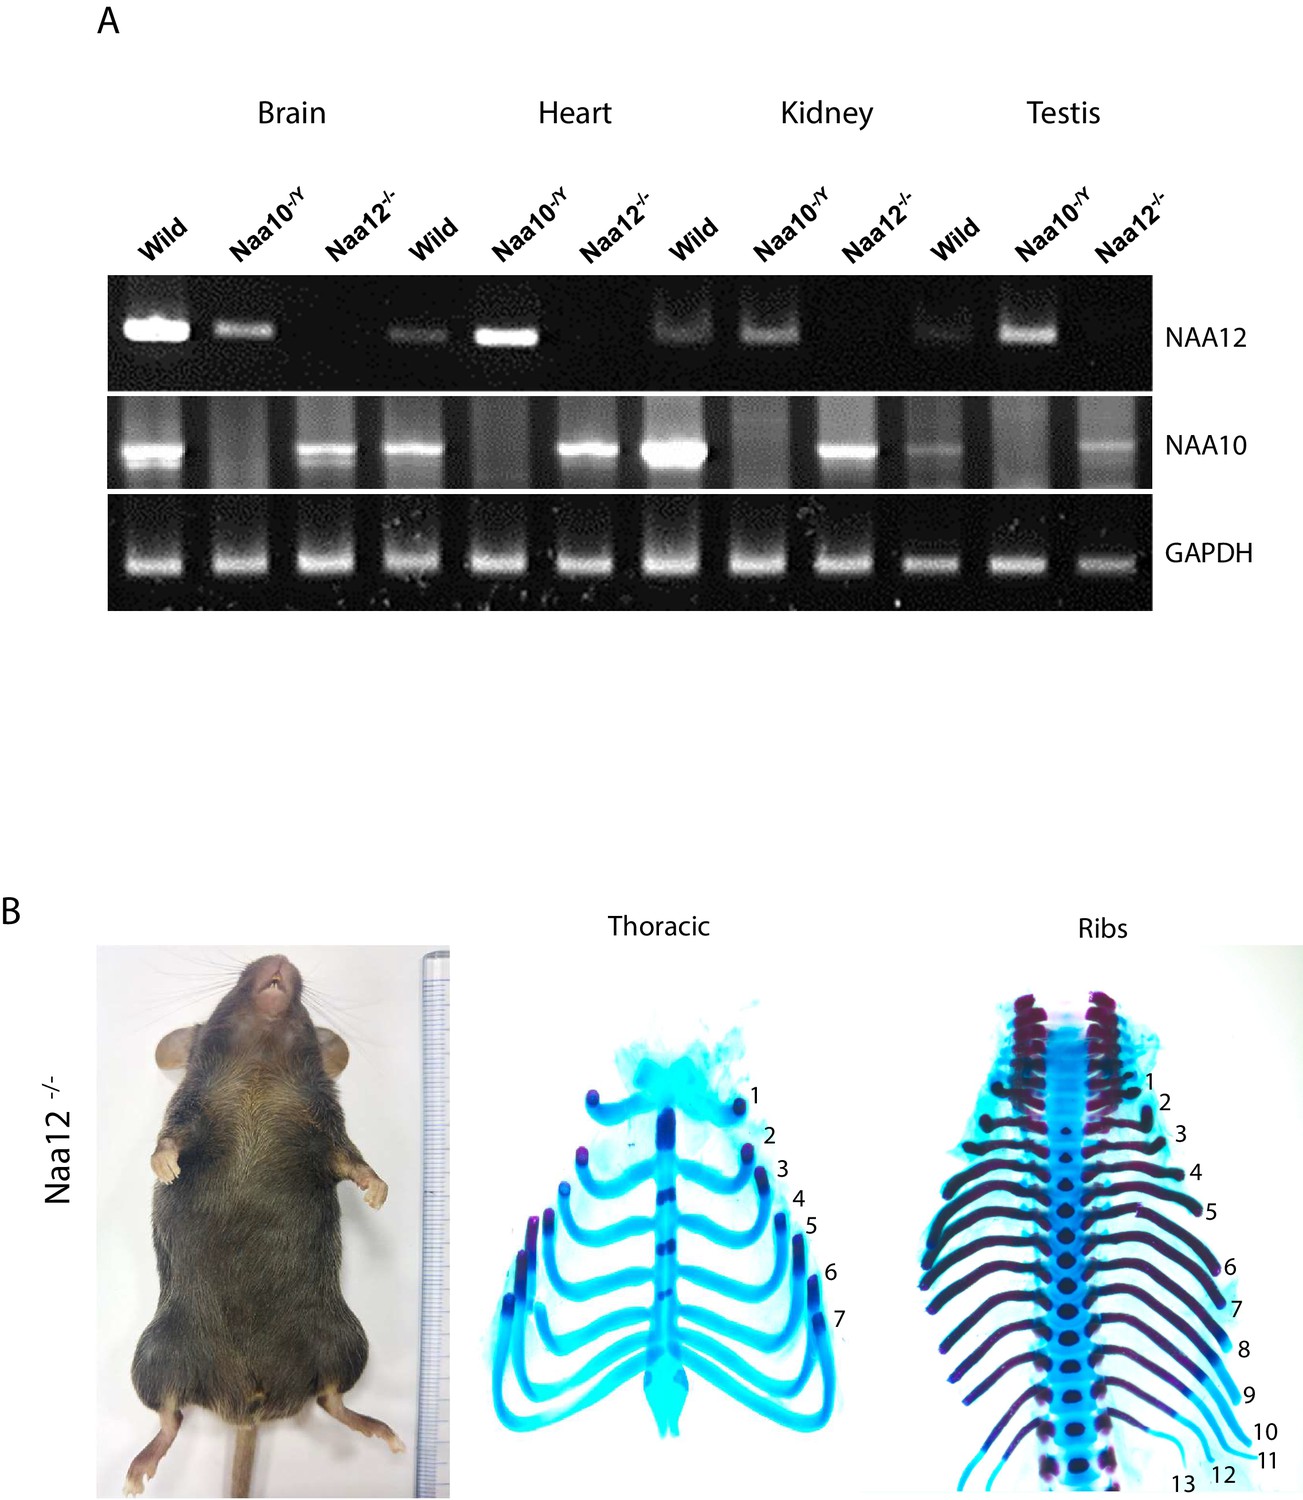
Confirmation and characterization of Naa12 knockout (KO) mice.
(A) Expression of Naa10 and Naa12 in wildtype (WT), Naa10 KO and Naa12 KO tissues, adult mice 13 weeks of age, (brain, heart, kidney, and testis) by RT-PCR. Expression of GAPDH was analyzed as an endogenous control. (B) Phenotypes in Naa12 KO mice. Lack of hypopigmentation (upper; N = 29) and lack of supernumerary ribs (middle and bottom; E18.5; N = 7) in Naa12 KO mouse.
Figure 5
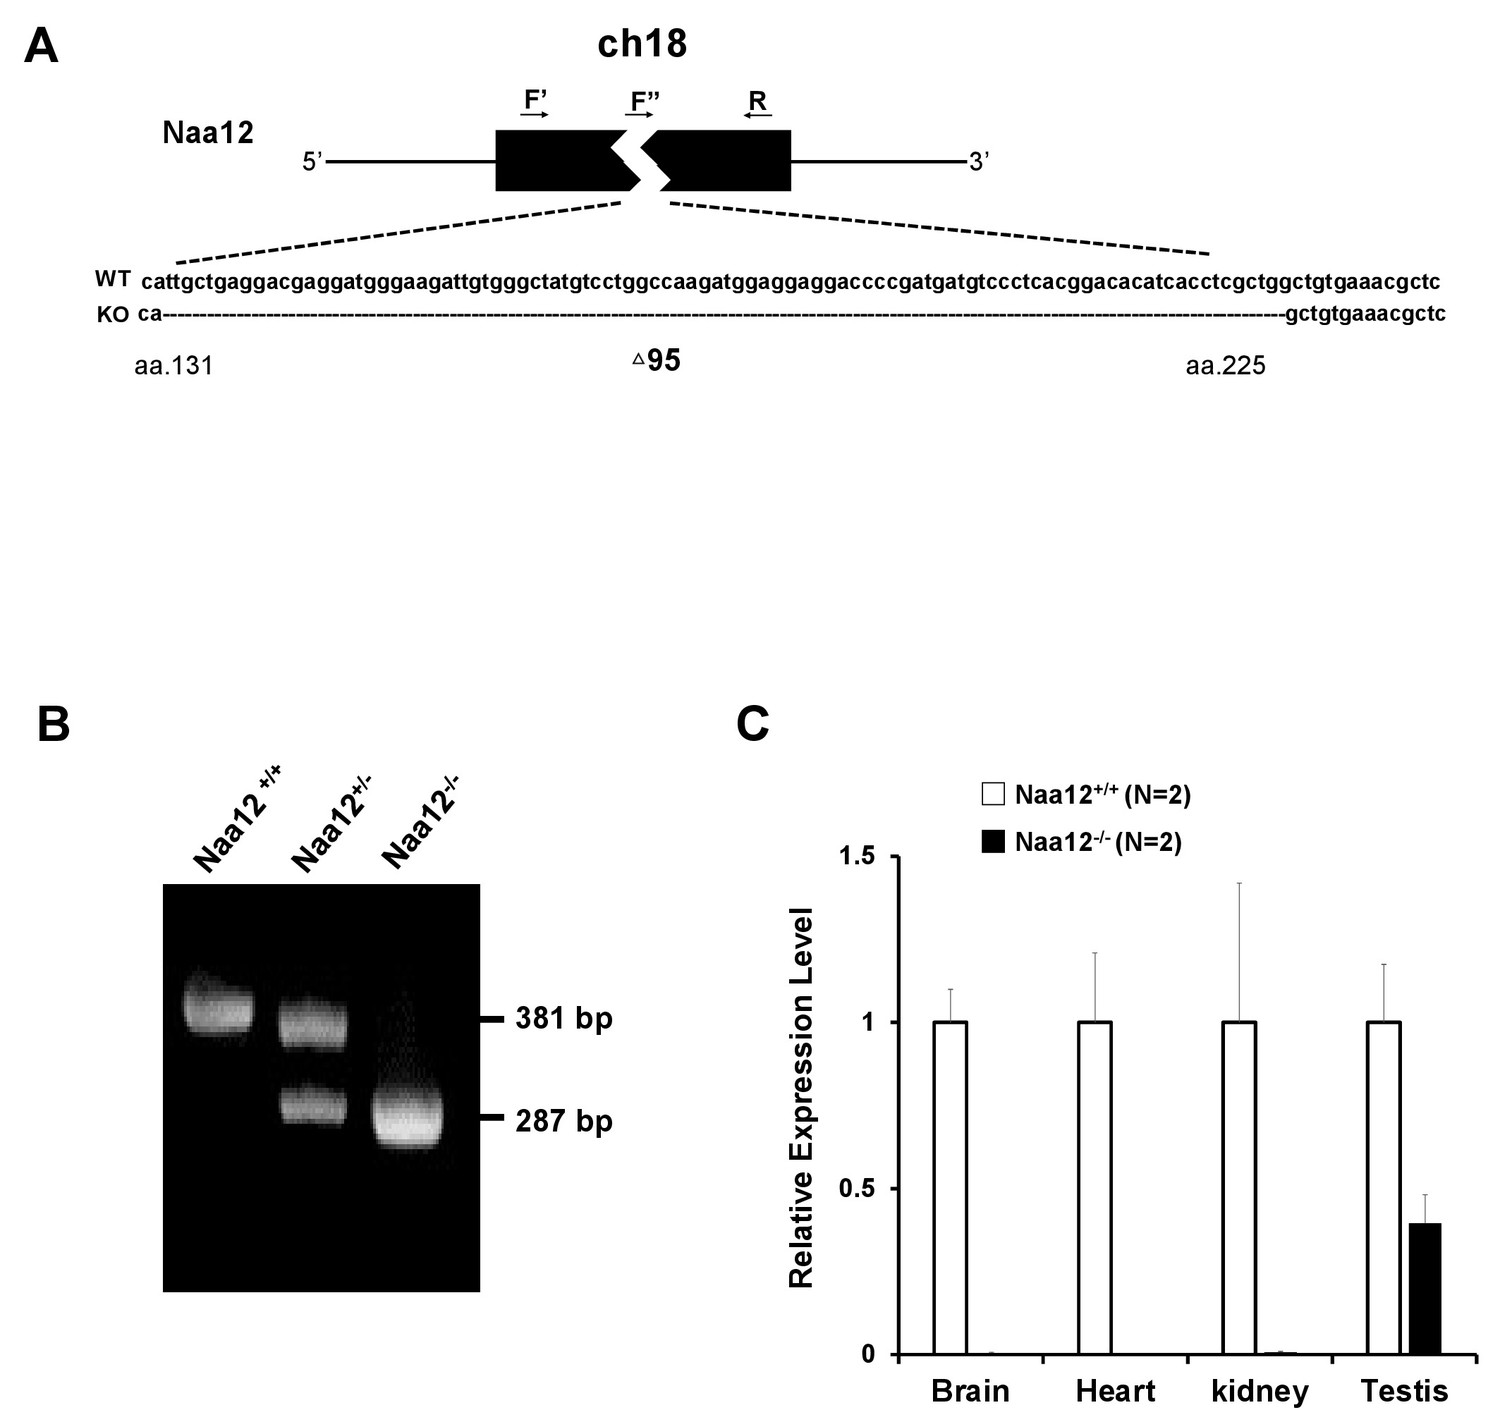
Generation of Naa12 knockout (KO) mice.
(A) Scheme of Naa12 (Gm16286, UniProt: Q9CQX6) deletion used to generate Naa12 KO mouse. 95 base pairs (131–225) were deleted. F′: genomic DNA forward primer; F′′: cDNA forward primer; R: reverse primer. (B) Genotyping of Naa12 KO mice by PCR. Wildtype (WT) allele size was 381 bp and targeted allele size was 287 bp. (C) mRNA level of Naa12 was analyzed in selected tissues by qPCR. Relative expression level of WT (white bars) and Naa12 KO (black bars) after normalizing to that of GAPDH.
-
Figure 5—source data 1
Generation of Naa12KO mice.
- https://cdn.elifesciences.org/articles/65952/elife-65952-fig5-data1-v3.pdf
Figure 6 with 5 supplements
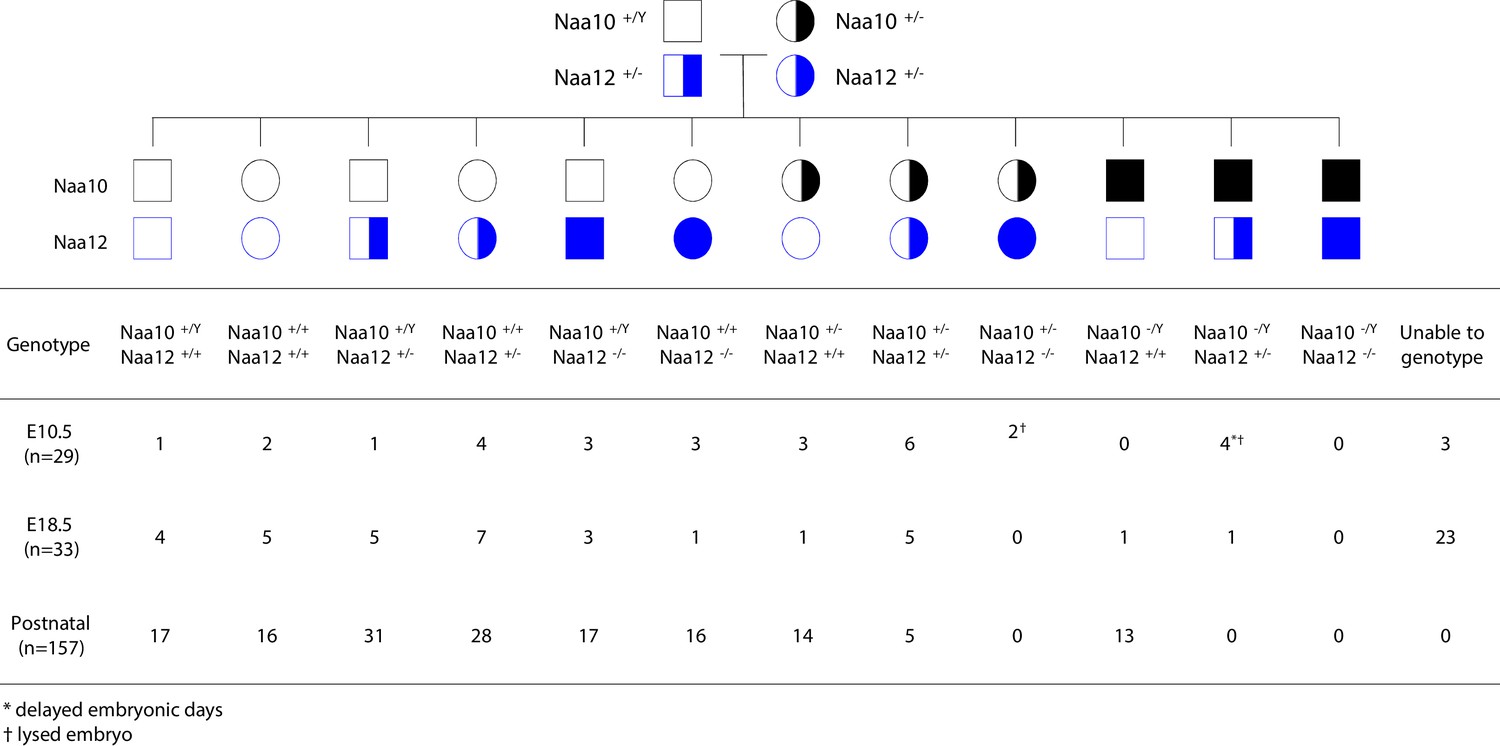
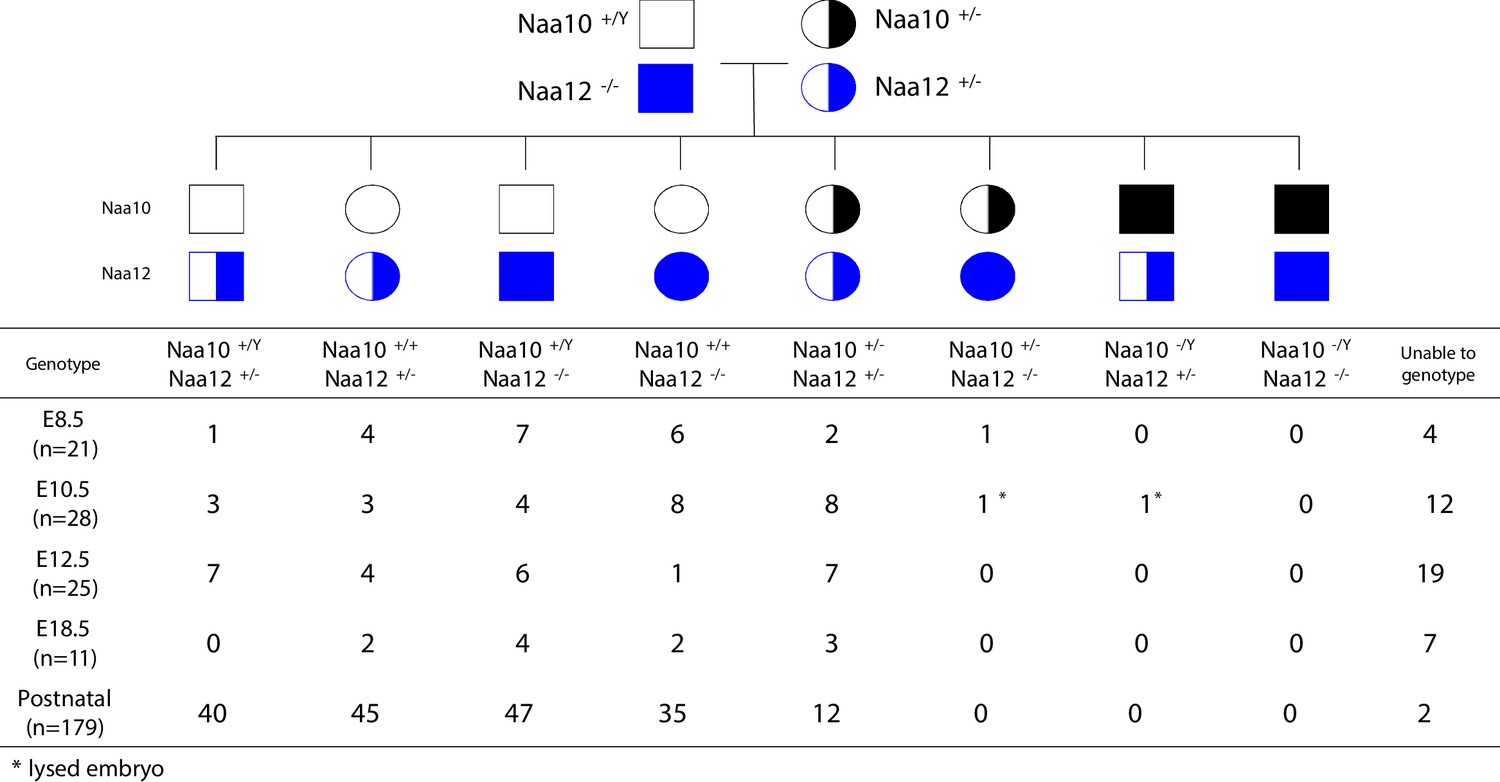
Lethality in Naa10 Naa12 double-knockout (DKO) mice.
Naa10 Naa12 DKO exhibit embryonic lethality. Pedigree and genotypes of pups and embryos at E10.5 and E18.5 from Naa10+/- Naa12+/- female mice crossed to the Naa10+/Y Naa12+/- male mice.
Figure 6—figure supplement 1
Genotypes of offspring from Naa10+/- Naa12+/- female mice crossed to the Naa10+/Y Naa12-/- male mice.
Naa10 Naa12 double-knockout (DKO) exhibit embryonic lethality. Pedigree of mating and genotypes of pups and embryos at E8.5, E10.5, E12.5, and E18.5.
Figure 6—figure supplement 2
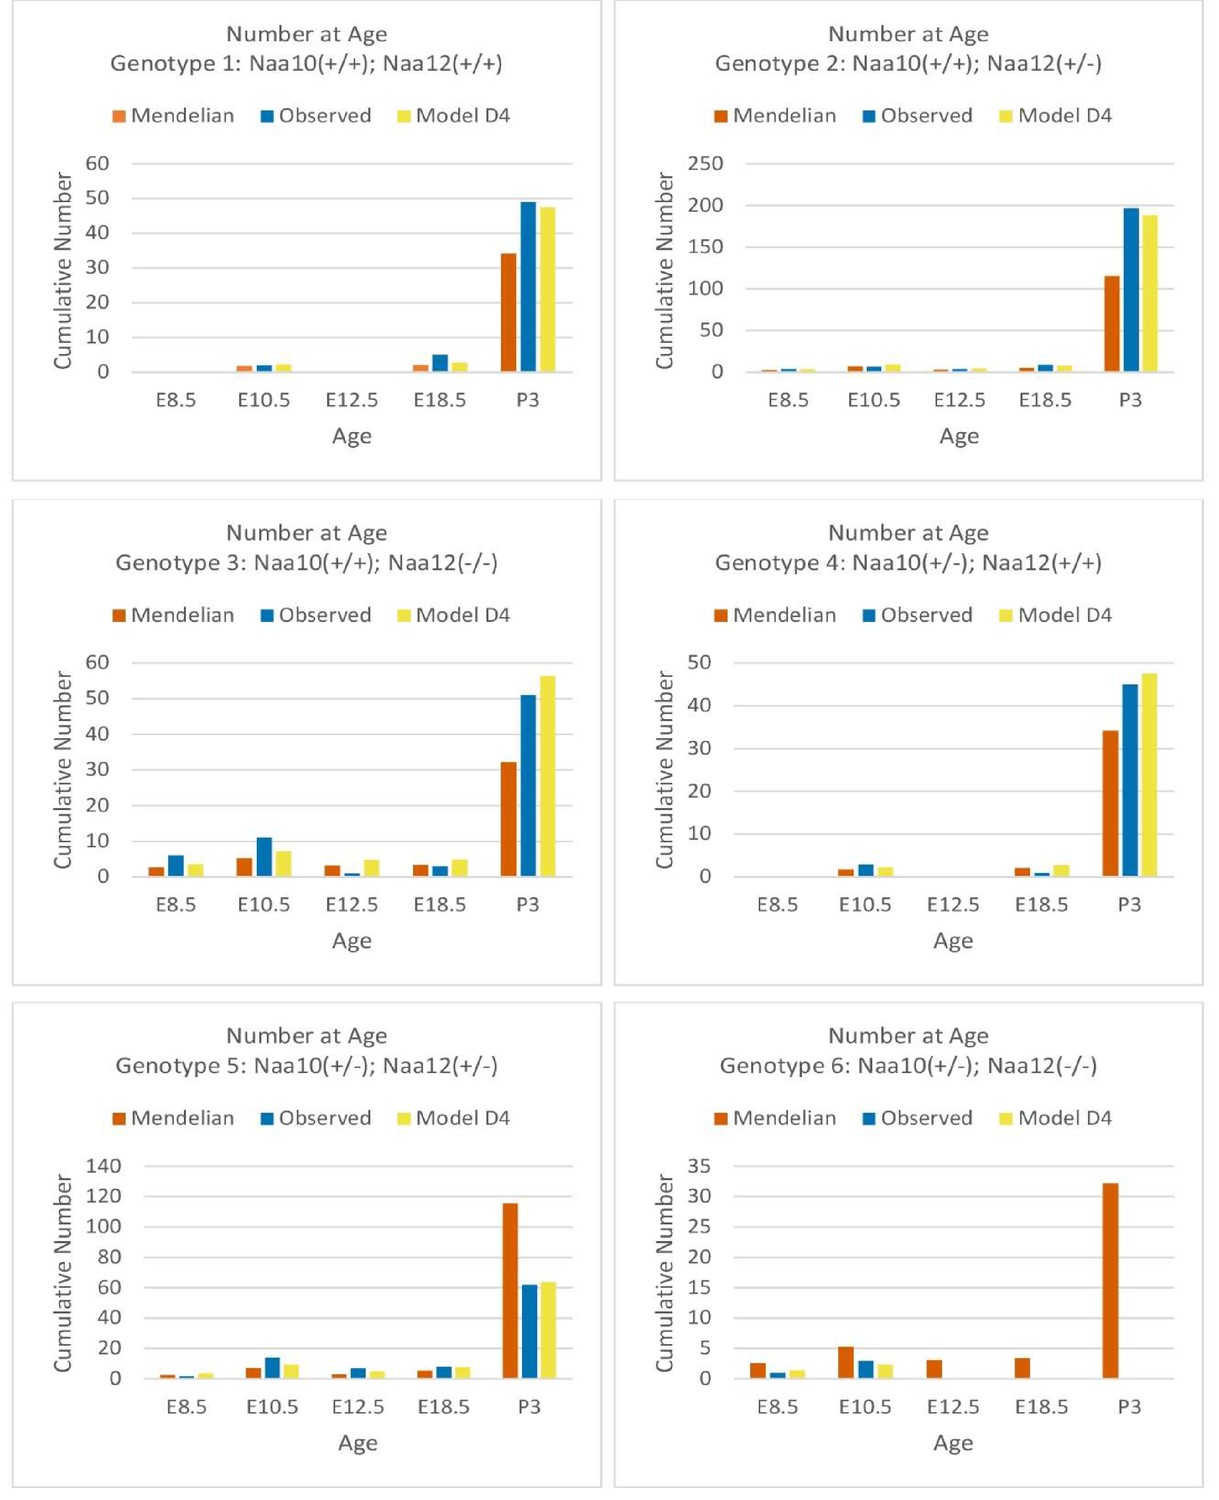
Comparisons of Mendelian predicted, observed, and model D4 predicted offspring numbers for female genotypes (#1–#6) at each age.
Figure 6—figure supplement 3
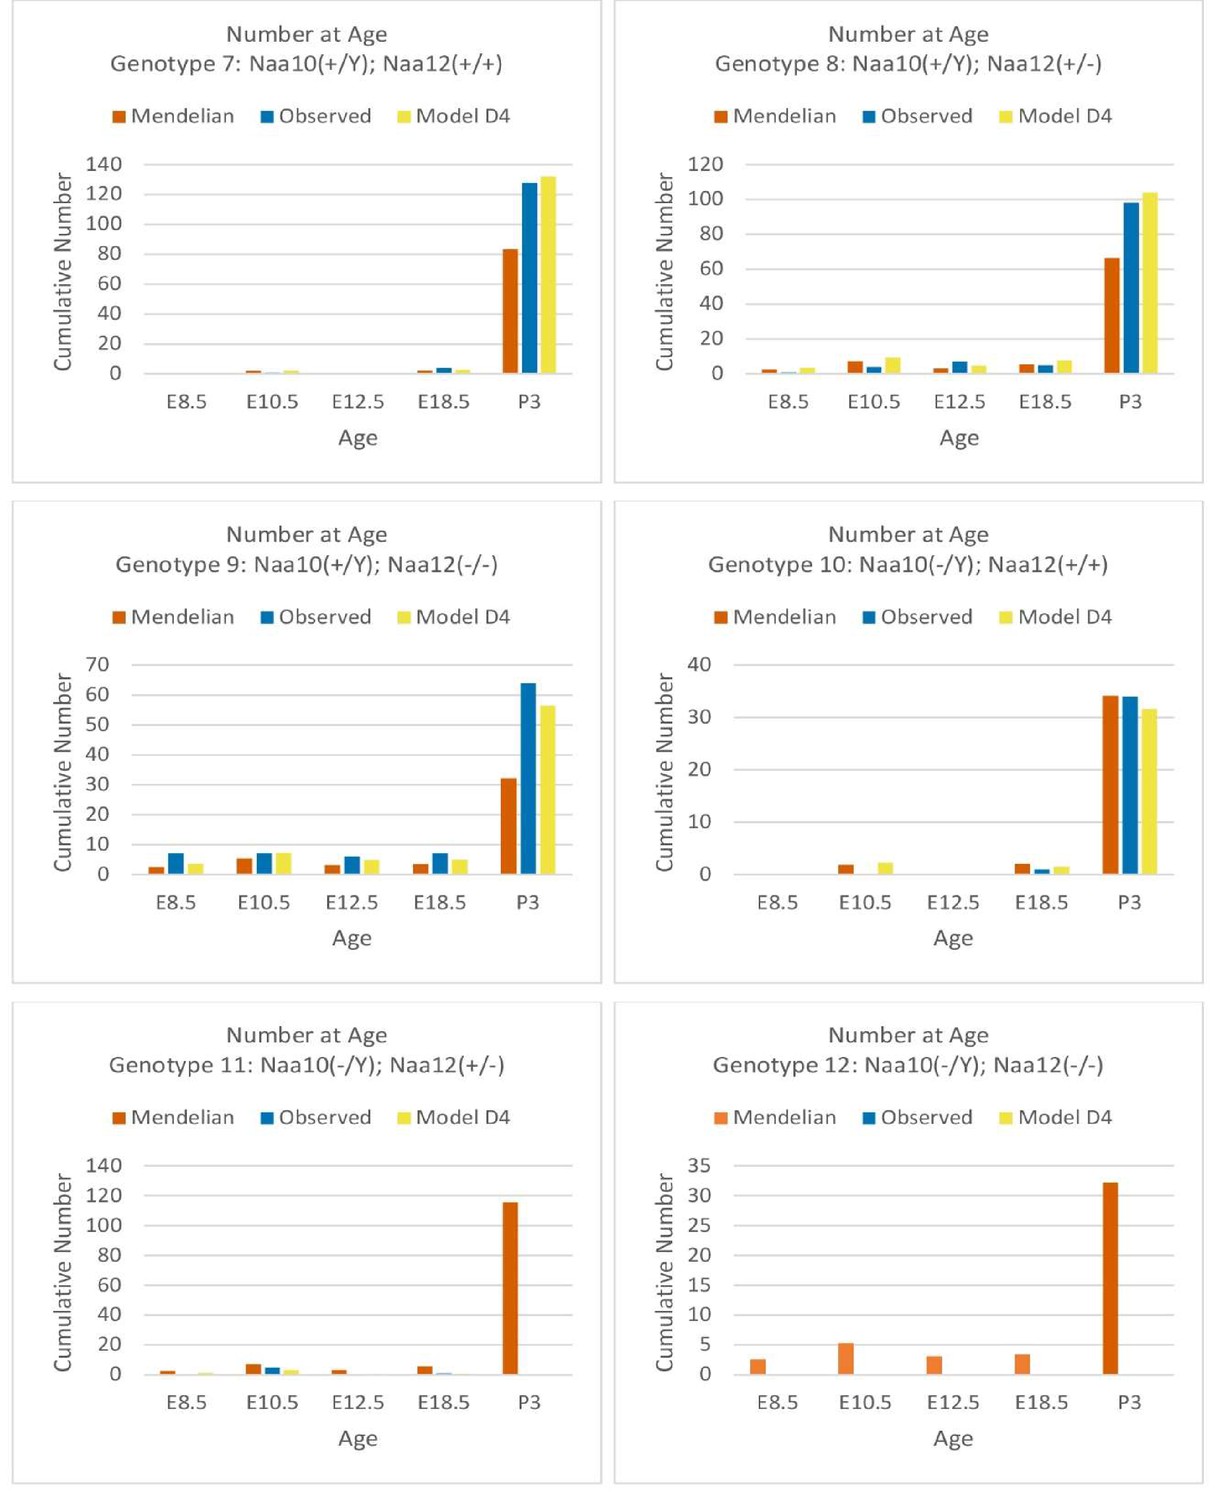
Comparisons of Mendelian predicted, observed, and model D4 predicted offspring numbers for male genotypes (#7–#12) at each age.
Figure 6—figure supplement 4
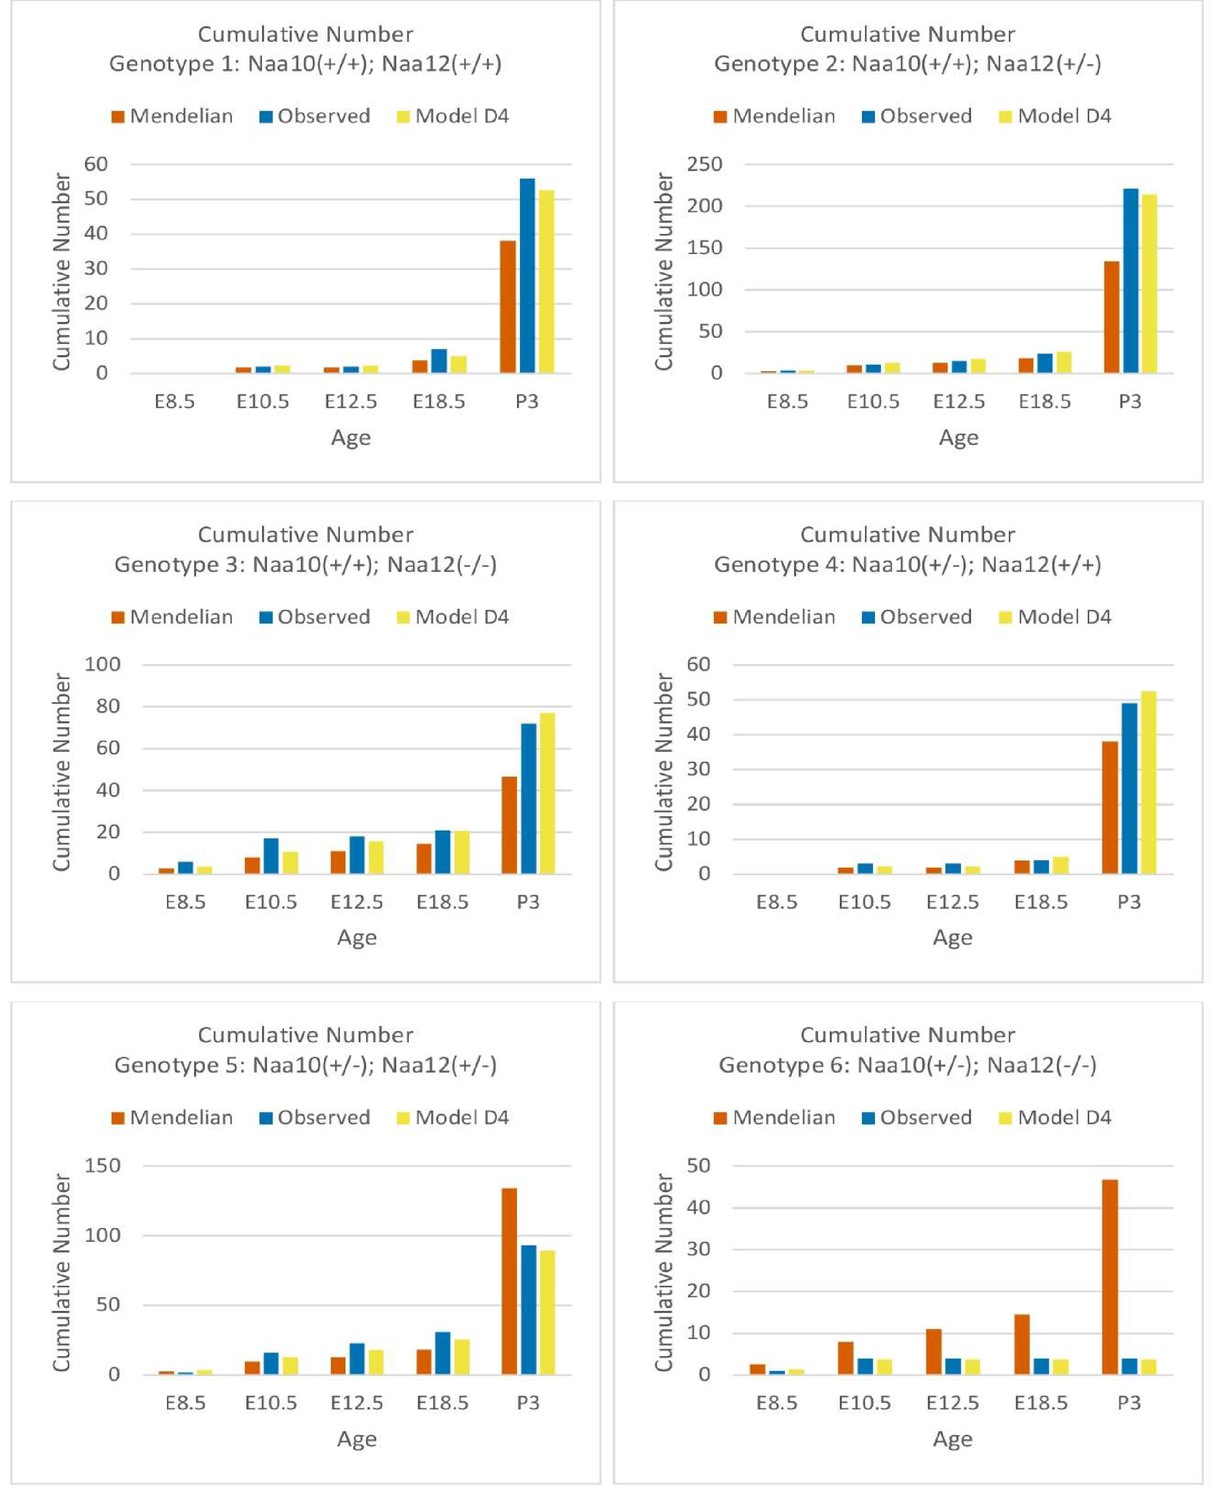
Comparisons of cumulative Mendelian predicted, observed, and model D4 predicted offspring numbers for female genotypes (#1–#6) at each age.
Figure 6—figure supplement 5
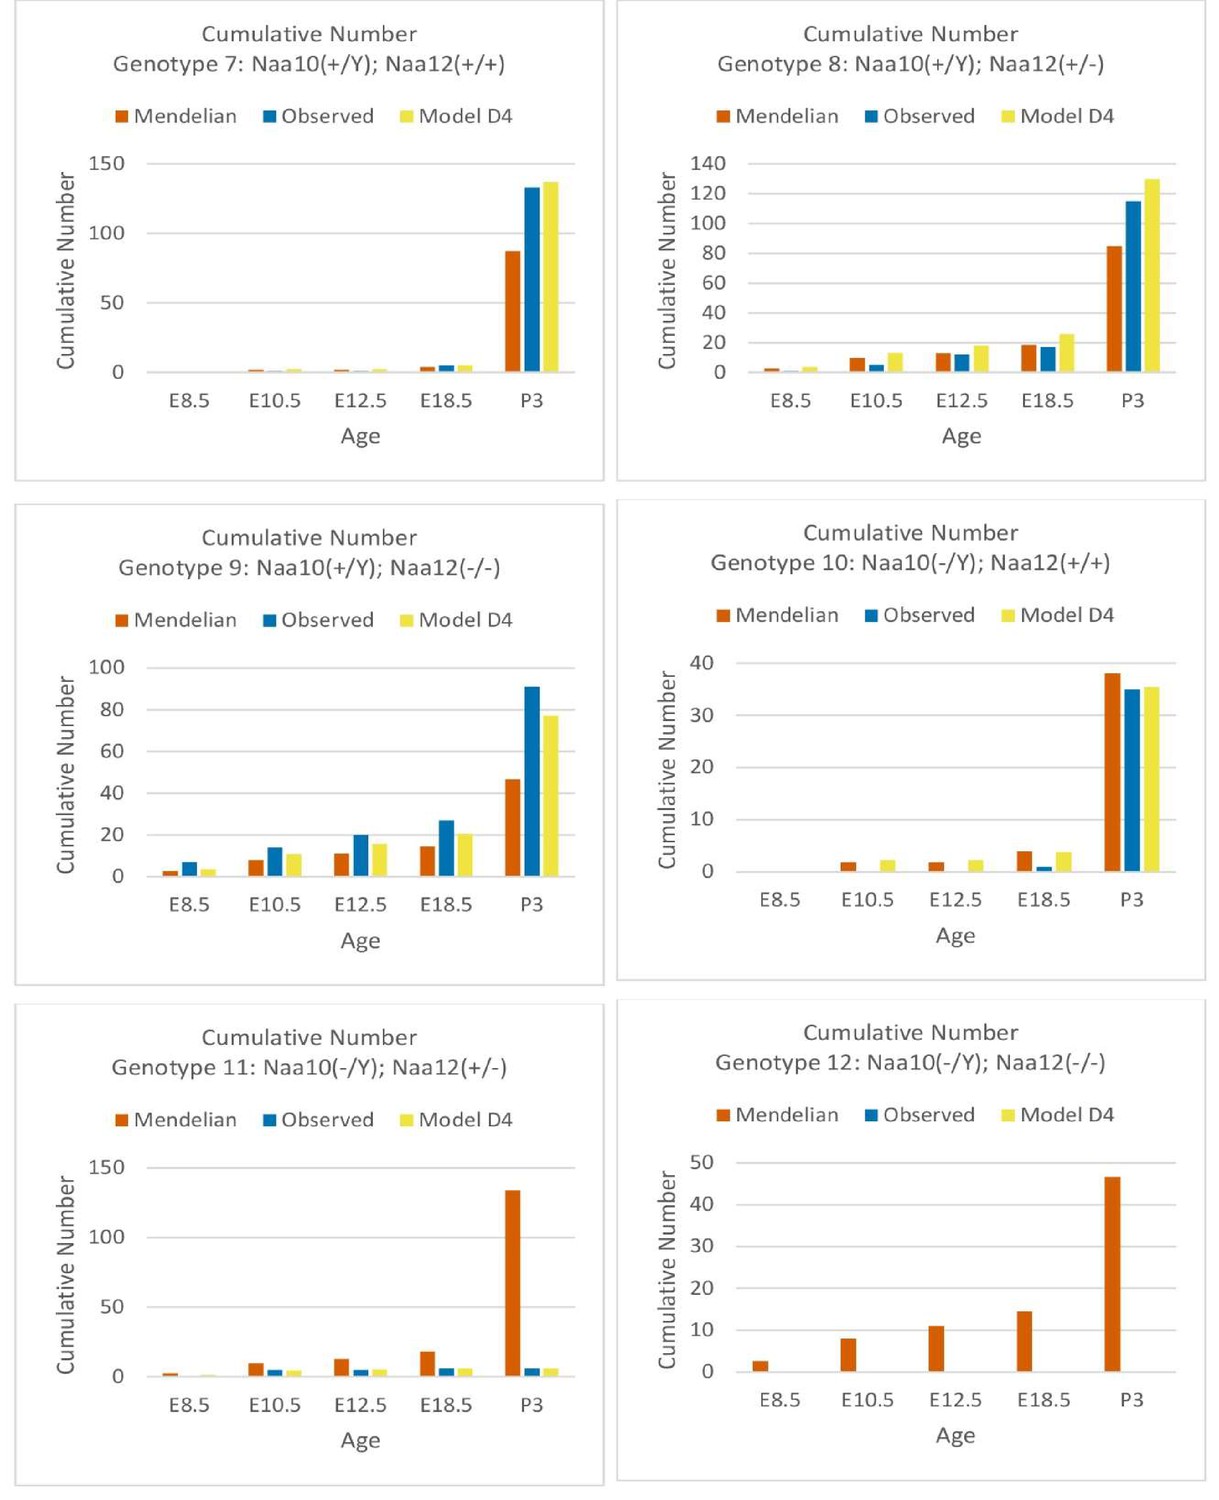
Comparisons of cumulative Mendelian predicted, observed, and model D4 predicted offspring numbers for male genotypes (#7–#12) at each age.
Figure 7

Decreased body weight in compound heterozygous females.
(A) Male body weight for the Naa10 mice on inbred genetic background (eight backcrosses to C57bl6/J). (B) Female body weight for the Naa10 mice on inbred genetic background (eight backcrosses to C57bl6/J). (C) Male body weight for the Naa10 and Naa12 mice on mixed genetic background. (D) Female body weight for the Naa10 and Naa12 mice on mixed genetic background.
Tables
Table 1
Skeletal analyses for ribs, sternebrae, and vertebrae.
| Naa10+/Y (n = 50) | Naa10+/+ (n = 10) | Naa10+/- (n = 17) | Naa10-/Y (n = 17) | Naa10-/- (n = 1) | ||||||
|---|---|---|---|---|---|---|---|---|---|---|
| 4 sternebrae | 7 (14.0%) | 1 (10%) | 3 (17.6%) | 9 (52.9%) | 1 (100%) | |||||
| 3 sternebrae | 27 (54.0%) | 8 (80%) | 11 (64.7%) | 5 (29.4%) | 0 (0%) | |||||
| 4 sternebrae but with 3/4 fusion | 16 (32%) | 1 (10%) | 3 (17.6%) | 3 (17.6%) | 0 (0%) | |||||
| 14 ribs total bilaterally | 0 (0%) | 0 (0%) | 0 (0%) | 17 (100%) | 1 (100%) | |||||
| 13 ribs total bilaterally | 50 (100%) | 10 (100%) | 17 (100%) | 0 (0%) | 0 (0%) | |||||
| 8 ribs attached to sternum bilaterally | 0 (0%) | 0 (0%) | 0 (0%) | 17 (100%) | 1 (100%) | |||||
| 7 ribs attached to sternum bilaterally | 50 (100%) | 10 (100%) | 17 (100%) | 0 (0%) | 0 (0%) | |||||
| 14 thoracic vertebrae | 0 (0%) | 0 (0%) | 0 (0%) | 17 (100%) | 1 (100%) | |||||
| 13 thoracic vertebrae | 50 (100%) | 10 (100%) | 17 (100%) | 0 (0%) | 0 (0%) | |||||
-
Tabulation regarding the number of sternebrae found in skeletons, including ones in which there was partial fusions between the third and fourth sternebrae.
Table 2
Naa10, Naa11, and Naa12 peptides identified by LC-MS/MS analysis in Naa15 IP samples from WT and Naa10-KO mouse.
| Gene name | Peptide sequence | Log2 LFQ intensity Naa15-IP | |
|---|---|---|---|
| WT mouse | Naa10-KO mouse | ||
| Naa12 | AMIENFSAK | 23.8144 | 27.5563 |
| Naa12 | DLSQMADELRR | 25.2637 | 28.38 |
| Naa12 | ENQGSTLPGSEEASQQENLAGGDSGSDGK | 21.299 | 22.09 |
| Naa12 | RDLSQMADELR | - | 22.20 |
| Naa12 | RDLSQMADELRR | - | 27.77 |
| Naa10 | AALHLYSNTLNFQISEVEPK | 26.7672 | - |
| Naa10 | AMIENFNAK | 27.3981 | - |
| Naa10 | DLTQMADELRR | 25.5107 | - |
| Naa10 | GNVLLSSGEACREEK | 25.0717 | - |
| Naa10 | HMVLAALENK | 25.5293 | - |
| Naa10 | NARPEDLMNMQHCNLLCLPENYQMK | 25.8928 | - |
| Naa10 | YYFYHGLSWPQLSYIAEDENGK | 26.5915 | - |
| Naa12;Naa11 | AALHLYSNTLNFQVSEVEPK | - | 27.3833 |
| Naa12;Naa11 | YYFYHGLSWPQLSYIAEDEDGKIVGYVLAK | - | 25.2517 |
| Naa12;Naa11;Naa10 | IVGYVLAK | 28.0873 | 25.7753 |
| Naa12;Naa11;Naa10 | MEEDPDDVPHGHITSLAVK | 29.1069 | 29.265 |
| Naa12;Naa11;Naa10 | MEEDPDDVPHGHITSLAVKR | 24.7605 | 21.7784 |
| Naa12;Naa11;Naa10 | YVSLHVR | 22.8611 | 23.7383 |
| Naa12;Naa11;Naa10 | YYADGEDAYAMK | - | 27.2083 |
| Naa12;Naa11;Naa10 | YYADGEDAYAMKR | 27.2319 | 27.1689 |
-
Samples were run in technical duplicates and the average log2 LFQ intensity of the peptides is presented.
IP: immunoprecipitation; WT: wildtype; KO: knockout; LFQ: label-free quantification.
Table 3
Litter size of Naa10 × Naa12 matings.
| Genotypes of Naa10; Naa12 breeders (♀ x ♂) | Total number of pups | Total number of litters | Average litter size (pups/litters) | SD of litter size |
|---|---|---|---|---|
| Naa10+/+ Naa12+/+ × Naa10+/Y Naa12+/+ | 206 | 24 | 8.6 | 1.6 |
| Naa10+/- Naa12+/- × Naa10+/Y Naa12+/- | 157 | 32 | 4.9 | 1.5 |
| Naa10+/- Naa12+/- × Naa10+/Y Naa12-/- * | 225 | 63 | 3.6 | 1.7 |
-
*This mating was performed at IBR in Staten Island, New York, whereas the other two matings were performed at Ewha Womans University, Seoul, Republic of Korea.
SD: standard deviation.
Table 4
Model D4 genotype survival by age.
| #* | Genotype | E8.5 (%) | E10.5 (%) | E12.5 (%) | E18.5 (%) | Postnatal (%) |
|---|---|---|---|---|---|---|
| 12 | Naa10-/Y; Naa12-/- | 0 | 0 | 0 | 0 | 0 |
| 11 | Naa10-/Y; Naa12+/- | 40 | 35 | 10 | 10 | 0 |
| 6 | Naa10+/-; Naa12-/- | 40 | 33 | 0 | 0 | 0 |
| 5 | Naa10+/-; Naa12+/- | 100 | 100 | 100 | 100 | 35 |
| 10 | Naa10-/Y; Naa12+/+ | 100 | 100 | 100 | 55 | 55 |
| All Others | 100 | 100 | 100 | 100 | 100 |
-
*Genotype number according to Supplementary file 1h.
E: embryonic day.
Key resources table
| Reagent type (species) or resource | Designation | Source or reference | Identifiers | Additional information |
|---|---|---|---|---|
| Gene (Mus musculus) | Naa10 | GenBank | MGI:MGI:1915255 | |
| Gene (M. musculus) | Naa15 | GenBank | MGI:MGI:1922088 | |
| Gene (M. musculus) | Naa11 | GenBank | MGI:MGI:2141314 | |
| Gene (M. musculus) | Naa12 | This paper | Gm16286, UniProt: Q9CQX6 | Provided by corresponding author, Gholson J. Lyon |
| Genetic reagent (M. musculus) | Naa10-/- | Nature Communication Yoon et al., 2014 | Provided by corresponding author, Goo Taeg Oh | |
| Genetic reagent (M. musculus) | Naa12-/- | This paper | Gm16286, UniProt: Q9CQX6 | Provided by corresponding author, Gholson J. Lyon |
| Cell line (Homo sapiens) | HEK293 (normal, embryonic kidney cells) | ATCC | CRL-1573 | |
| Biological sample (M. musculus) | Primary mouse embryonic fibroblasts | This paper | Freshly isolated from mouse embryos (E13.5) | |
| Antibody | Anti-Naa10 (rabbit polyclonal) | Abcam | Cat# ab155687 | (1:1000) |
| Antibody | Anti-Naa10 (rabbit polyclonal) | Protein Tech | Cat# 14803-1-AP | (1:3000) |
| Antibody | Anti-Naa10 (rabbit monoclonal) | Cell Signaling | Cat# 13357 | (1:1000) |
| Antibody | Anti-Naa10 (goat polyclonal) | Santa Cruz | Cat# sc-33256 | (1:1000) |
| Antibody | Anti-Naa10 (rabbit polyclonal) | Santa Cruz | Cat# sc-33820 | (1:1000) |
| Antibody | Anti-Naa11 (rabbit polyclonal) | Novus Biologicals | Cat# NBP1-90853 | (1:1000) |
| Antibody | Anti-Naa15/NARG1 (mouse monoclonal) | Abcam | Cat# ab60065 | (1:1000) |
| Antibody | Anti-NAA15 (rabbit polyclonal) | Biochemical Journal (reference 12 in this paper) Arnesen et al., 2005 | (1:2000) Provided by author Thomas Arnesen, | |
| Antibody | Anti-NAA50 (rabbit polyclonal) | LifeSpan BioSciences | Cat# LS-C81324-100 | (1:3000) |
| Antibody | Anti-FLAG (rabbit polyclonal) | Sigma-Aldrich | Cat# F7425 | (2 μg/mL) |
| Antibody | Anti-GAPDH (mouse monoclonal) | Abcam | Cat# ab9484 | (1:3000) |
| Antibody | Anti-actin (goat polyclonal) | Santa Cruz | Cat# 1615 | (1:3000) |
| Antibody | Anti-GST (mouse monoclonal) | GenScript | Cat# A00865 | (1 µg/mL) |
| Antibody | Anti-V5 (mouse monoclonal) | Life Technologies | Cat# R960-25 | (1:1000) |
| Antibody | Anti-Naa12 (rabbit polyclonal) | This paper | Gm16286, UniProt: Q9CQX6 | C-terminus (aa191-205: QENLAGGDSGSDGKD-C) conjugated to OVA by PrimmBiotech Provided by corresponding author, Gholson J. Lyon |
| Sequence-based reagent | mNaa10-Exon2/3_F | This paper | PCR primers | ctcttggccccagctttctt Provided by corresponding author, Goo Taeg Oh |
| Sequence-based reagent | mNaa10-Exon3/4_R | This paper | PCR primers | tcgtctgggtcctcttccat Provided by corresponding author, Goo Taeg Oh |
| Sequence-based reagent | mNaa11_F | This paper | PCR primers | accccacaagcaaagacagtg Provided by corresponding author, Goo Taeg Oh |
| Sequence-based reagent | mNaa11_R | This paper | PCR primers | agcgatgctcaggaaatgctct Provided by corresponding author, Goo Taeg Oh |
| Sequence-based reagent | mNaa12(Gm16286)_F | This paper | PCR primers | acgcgtatgctatgaagcga Provided by corresponding author, Gholson J. Lyon |
| Sequence-based reagent | mNaa12(Gm16286)__R | This paper | PCR primers | ccaggaagtgtgctaccctg Provided by corresponding author, Gholson J. Lyon |
| Sequence-based reagent | mNaa15_F | This paper | PCR primers | gcagagcatggagaaaccct Provided by corresponding author, Gholson J. Lyon |
| Sequence-based reagent | mNaa15_R | This paper | PCR primers | tctcaaacctctgcgaacca Provided by corresponding author, Gholson J. Lyon |
| Sequence-based reagent | mNaa50_F | This paper | PCR primers | taggatgccttgcaccttacc Provided by corresponding author, Gholson J. Lyon |
| Sequence-based reagent | mNaa50_R | This paper | PCR primers | gtcaatcgctgactcattgct Provided by corresponding author, Gholson J. Lyon |
| Sequence-based reagent | mGAPDH_F | This paper | PCR primers | aggtcggtgtgaacggatttg Provided by corresponding author, Gholson J. Lyon |
| Sequence-based reagent | mGAPDH_R | This paper | PCR primers | tgtagaccatgtagttgaggtca Provided by corresponding author, Gholson J. Lyon |
| Sequence-based reagent | mACTB_F | This paper | PCR primers | ggctgtattcccctccatcg Provided by corresponding author, Gholson J. Lyon |
| Sequence-based reagent | mACTB_R | This paper | PCR primers | ccagttggtaacaatgccatgt Provided by corresponding author, Gholson J. Lyon |
| Software, algorithm | Zen 3.0 SR | ZEISS | Version 16.0.1.306 | Black 64bit edition |
| Other | Alcian Blue 8GX | Sigma-Aldrich | Cat# A5268 | 0.03% |
| Other | Alizarin Red | Sigma-Aldrich | Cat# A5533 | 0.05% |
| Other | Hematoxylin | Sigma-Aldrich | Cat# MHS80 | |
| Other | Eosin | Sigma-Aldrich | Cat# HT110116 |
Additional files
-
Supplementary file 1
Tables related to genotypes, phenotypes and Mendelian ratios.
(a) Genotypes of offspring from Naa10+/- female mice crossed to the Naa10+/Y male mice. Expected and observed Mendelian ratio of genotypes in offspring at E10.5, E13.5, E18.5 and adults from crosses of Naa10+/- female and Naa10+/Y male mice. The percentage of adult Naa10-/Y mice significantly decreases. (b) Genotypes of offspring from Naa10+/tm1a female mice crossed to the Naa10+/Y male mice. Expected and observed Mendelian ratio of genotypes in offspring at E10.5, E13.5, E18.5 and adults from crosses of Naa10+/tm1a female and Naa10+/Y male mice. The percentage of adults Naa10tm1a/Y mice significantly decreases. (c) Cervical fusion skeletal analyses in Naa10 knockout (KO) mice. (d) Matings and litter size analyses. (e) Genotypes of offspring from Naa12+/- female mice crossed to the Naa12+/- male mice. Expected and observed Mendelian ratio of genotypes in offspring from crosses. (f) Genotypes of offspring from Naa10+/- Naa12+/+ female mice crossed to the Naa10+/y Naa12+/- male mice. Expected and observed Mendelian ratio of genotypes in offspring from crosses. (g) Genotypes of offspring from Naa10+/- Naa12+/+ female mice crossed to the Naa10+/y Naa12-/- male mice. Expected and observed Mendelian ratio of genotypes in offspring from crosses. (h) Mendelian and observed offspring distributions from Naa10(+/Y); Naa12(+/-) male and Naa10(+/-); Naa12(+/-) female breeding. (i) Mendelian and observed offspring distributions from Naa10(+/Y); Naa12(-/-) male and Naa10(+/-); Naa12(+/-) female breeding. (j) Mendelian and observed postnatal offspring distributions from Naa10(+/Y); Naa12(+/-) male and Naa10(+/-); Naa12(+/+) female breeding. (k) Mendelian and observed postnatal offspring distributions from Naa10(+/Y); Naa12(-/-) male and Naa10(+/-); Naa12(+/+) female breeding. (l) Mendelian and observed age-specific offspring distributions from four crosses. (m) Mendelian and observed cumulative offspring distributions from all four crosses. (n) Mice analyzed by weighing, according to genotype. (o) Effects of Naa10 KO on growth rate of Naa10 mice on pure genetic background. (p) Effects of Naa10 and Naa12 KOs on growth rate on mixed genetic background.
- https://cdn.elifesciences.org/articles/65952/elife-65952-supp1-v3.docx
-
Supplementary file 2
Mass spectrometry analyses.
(a) N-termini detected in mouse embryonic fibroblasts (MEFs) (Excel sheet). (b) N-termini detected in all MEF samples (Excel sheet). (c) Header Key, showing the abbreviation meanings for (a) and (b) (Excel sheet). (d) Mass spectrometry of immunoprecipitated Naa15 complexes (Excel sheet).
- https://cdn.elifesciences.org/articles/65952/elife-65952-supp2-v3.xlsx
-
Transparent reporting form
- https://cdn.elifesciences.org/articles/65952/elife-65952-transrepform-v3.docx
Download links
A two-part list of links to download the article, or parts of the article, in various formats.
Downloads (link to download the article as PDF)
Open citations (links to open the citations from this article in various online reference manager services)
Cite this article (links to download the citations from this article in formats compatible with various reference manager tools)
Naa12 compensates for Naa10 in mice in the amino-terminal acetylation pathway
eLife 10:e65952.
https://doi.org/10.7554/eLife.65952


