Competitive binding of STATs to receptor phospho-Tyr motifs accounts for altered cytokine responses
- Division of Cell Signalling and Immunology, School of Life Sciences, University of Dundee, United Kingdom
- Department of Applied Mathematics, School of Mathematics, University of Leeds, United Kingdom
- Department of Biology and Centre of Cellular Nanoanalytics, University of Osnabrück, Germany
- Université de Lille, INSERM UMR1277 CNRS UMR9020–CANTHER and Institut pour la Recherche sur le Cancer de Lille (IRCL), France
- Department of Statistics, School of Mathematics, University of Leeds, United Kingdom
- Univ. Lille, Univ. LilleInserm, CHU Lille, U1286 - INFINITE - Institute for Translational Research in Inflammation, France
- T-6 Theoretical Division, Los Alamos National Laboratory, United States
Figures
Figure 1 with 3 supplements
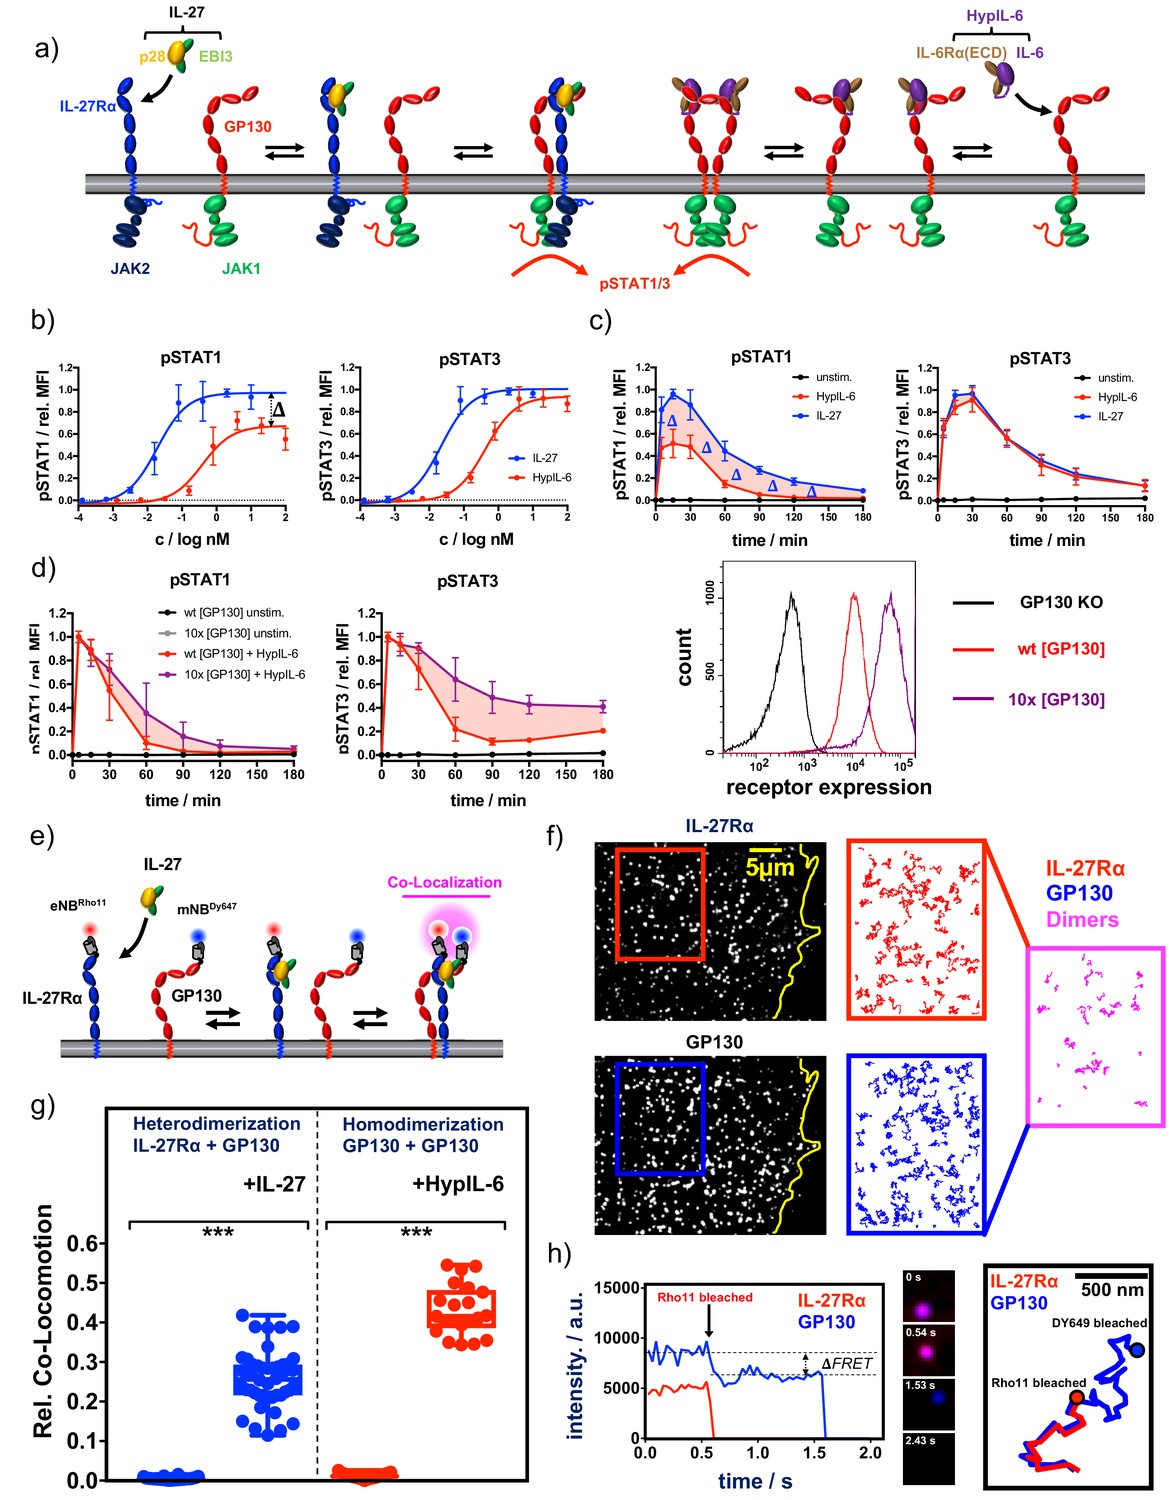
Cytokine receptor activation by IL-27 and (Hyp)IL-6: (a) Cartoon model of stepwise assembly of the IL-27 and HypIL-6-induced receptor complex and subsequent activation of STAT1 and STAT3.
(b) Dose-dependent phosphorylation of STAT1 and STAT3 as a response to IL-27 and HypIL-6 stimulation in TH-1 cells, normalized to maximal IL-27 stimulation. Data was obtained from three biological replicates with each two technical replicates, showing mean ±std dev. (c) Phosphorylation kinetics of STAT1 and STAT3 followed after stimulation with saturating concentrations of IL-27 (2 nM) and HypIL-6 (20 nM) or unstimulated TH-1 cells, normalized to maximal IL-27 stimulation. Data was obtained from five biological replicates with each two technical replicates, showing mean ±std dev. (d) Top: Phosphorylation kinetics of STAT1 and STAT3 followed after stimulation with HypIL-6 (20 nM) or left unstimulated, comparing wt RPE1 and RPE1 GP130KO reconstituted with high levels of mXFPm-GP130 (=10 x [GP130]). Data was normalized to maximal stimulation levels of each treatment. Left: cell surface GP130 levels comparing RPE1 GP130KO, wt RPE1 and RPE1 GP130KO stably expressing mXFPm-GP130 measured by flow cytometry. Data was obtained from one biological replicate with each two technical replicates, showing mean ±std dev. Bottom right: cell surface levels of GP130 measured by flow cytometry for indicated cell lines. (e) Cartoon model of cell surface labeling of mXFP-tagged receptors by dye-conjugated anti-GFP nanobodies (NB) and identification of receptor dimers by single molecule dual-color co-localization. (f) Raw data of dual-color single-molecule TIRF imaging of mXFPe-IL-27RαNB-RHO11 and GP130NB-DY649 after stimulation with IL-27. Particles from the insets (IL-27Ra: red and GP130: blue) were followed by single molecule tracking (150 frames ~ 4.8 s) and trajectories > 10 steps (320 ms) are displayed. Receptor heterodimerization was detected by co-localization/co-tracking analysis. (g) Relative number of co-trajectories observed for heterodimerization of IL-27Rα and GP130 as well as homodimerization of GP130 for unstimulated cells or after indicated cytokine stimulation. Each data point represents the analysis from one cell with a minimum of 23 cells measured for each condition. Two-tailed Student’s T-test: *p<0.05, **p≤0.01,***p≤0.001; n.s., not significant. (h) Stoichiometry of the IL-27–induced receptor complex revealed by bleaching analysis. Left: Intensity traces of mXFPe-IL-27RαNB-RHO11 and GP130NB-DY649 were followed until fluorophore bleaching. Middle: Merged imaging raw data for selected timepoints. Right: overlay of the trajectories for IL-27Rα (red) and GP130 (blue).
Figure 1—figure supplement 1
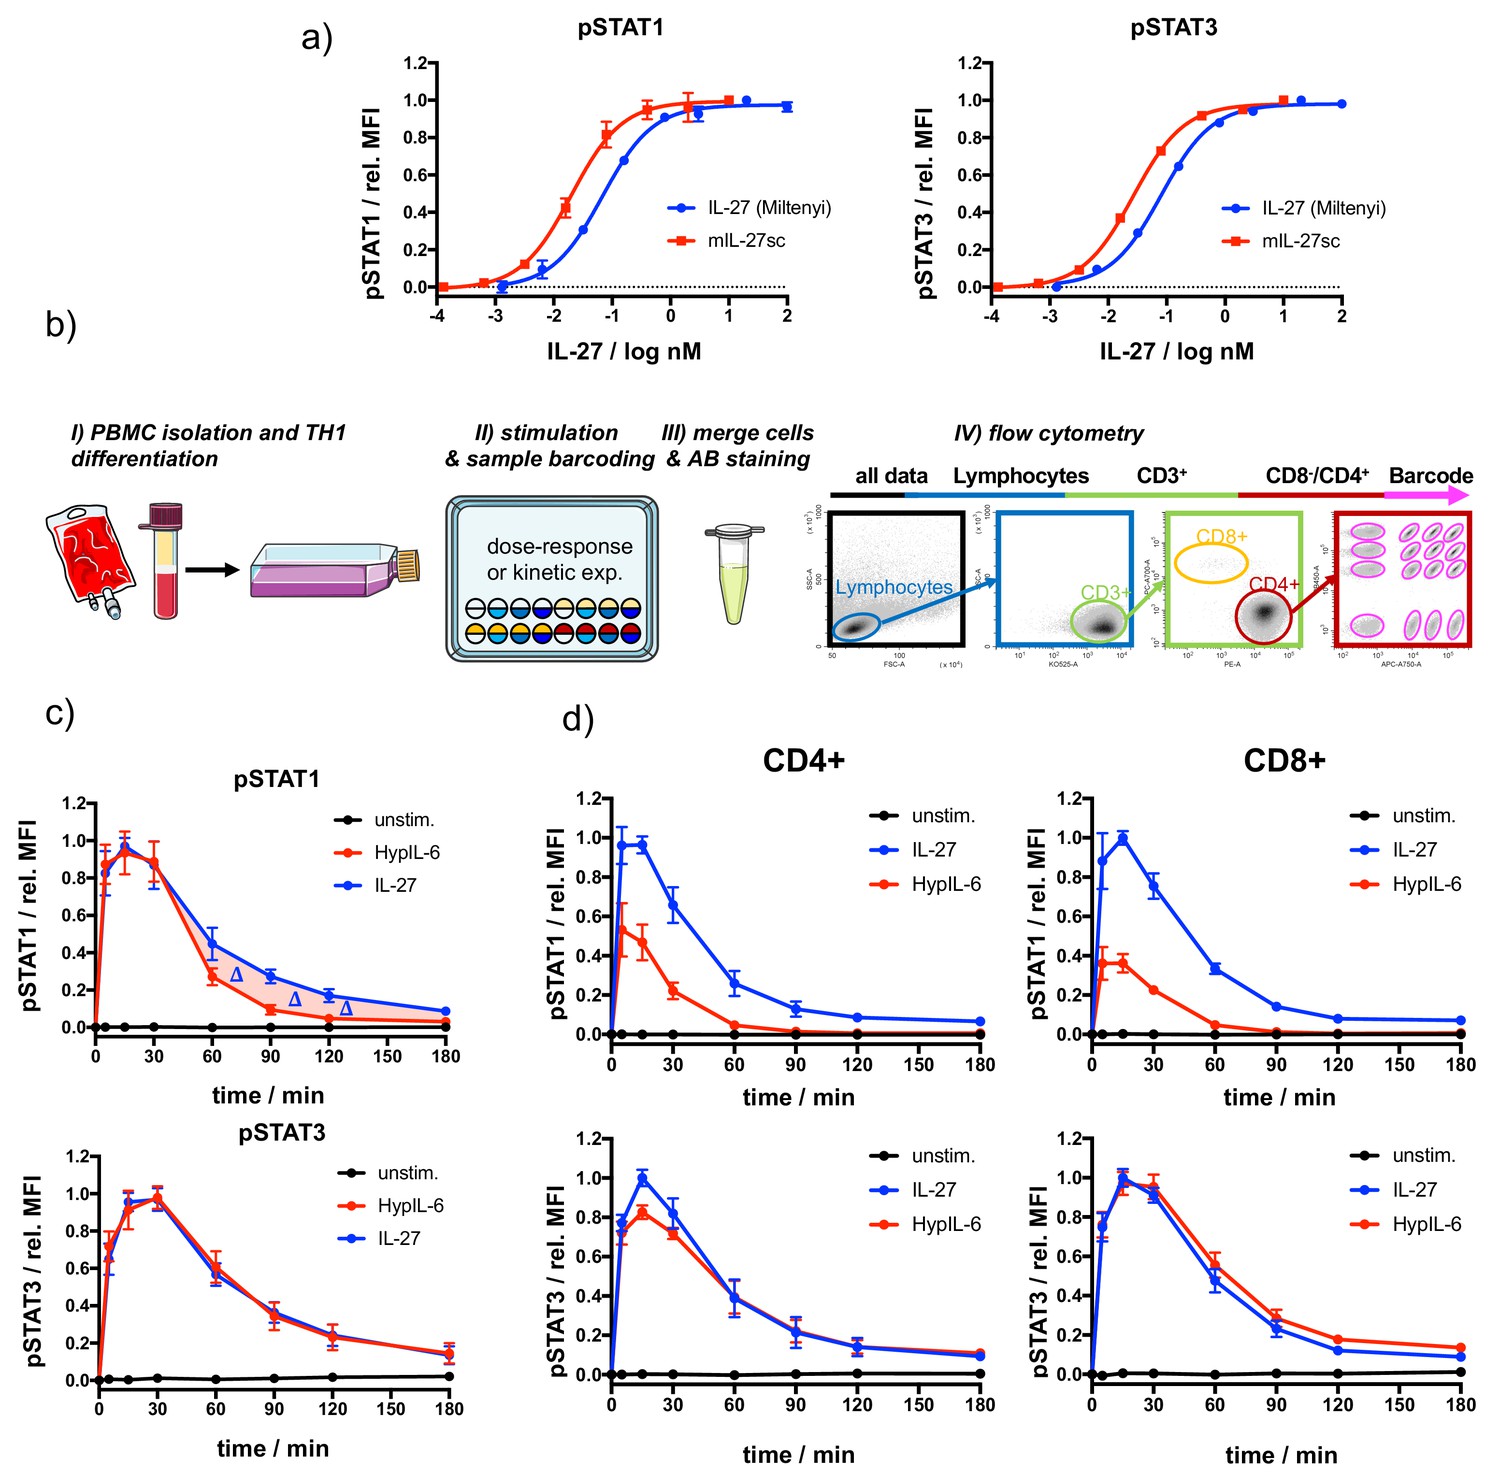
Characterization of IL-27 and HypIL-6 signaling in T-cell subsets followed by high-throughput flow-cytometry.
(a) Comparison of dose-dependent phosphorylation (STAT1/3) of purchased IL-27 and mIL-27sc in activated CD4 + cells, normalized to maximal MFI levels. The EC50 for purchased IL-27 for pSTAT1 was ~70 pM, for pSTAT3 was ~80 pM. The EC50 for mIL-27sc for pSTAT1 was ~20 pM, for pSTAT3 was ~30 pM. Data was obtained from one (purchased) or two (mIL-27sc) biological replicates with each two technical replicates, showing mean ± std dev. (b) Schematic workflow of T-cell isolation, TH1 differentiation, fluorescence barcoding and gating strategy for high-throughput flow cytometry. (c) Phosphorylation kinetics of STAT1 and STAT3 followed after stimulation with IL-27 (10 nM) and HypIL-6 (20 nM) or unstimulated TH1 cells. Data (from Figure 1c) was normalized to maximal MFI levels for each cytokine. Data was obtained from five biological replicates with each two technical replicates, showing mean ± std dev. (d) Phosphorylation kinetics of activated PBMCs (CD4+, CD8+) of STAT1 and STAT3 followed after stimulation with IL-27 (2 nM) and HypIL-6 (20 nM) or unstimulated cells. Data was normalized to maximal IL-27 stimulation. Data was obtained from two biological replicates with each two technical replicates, showing mean ± std dev.
Figure 1—figure supplement 2
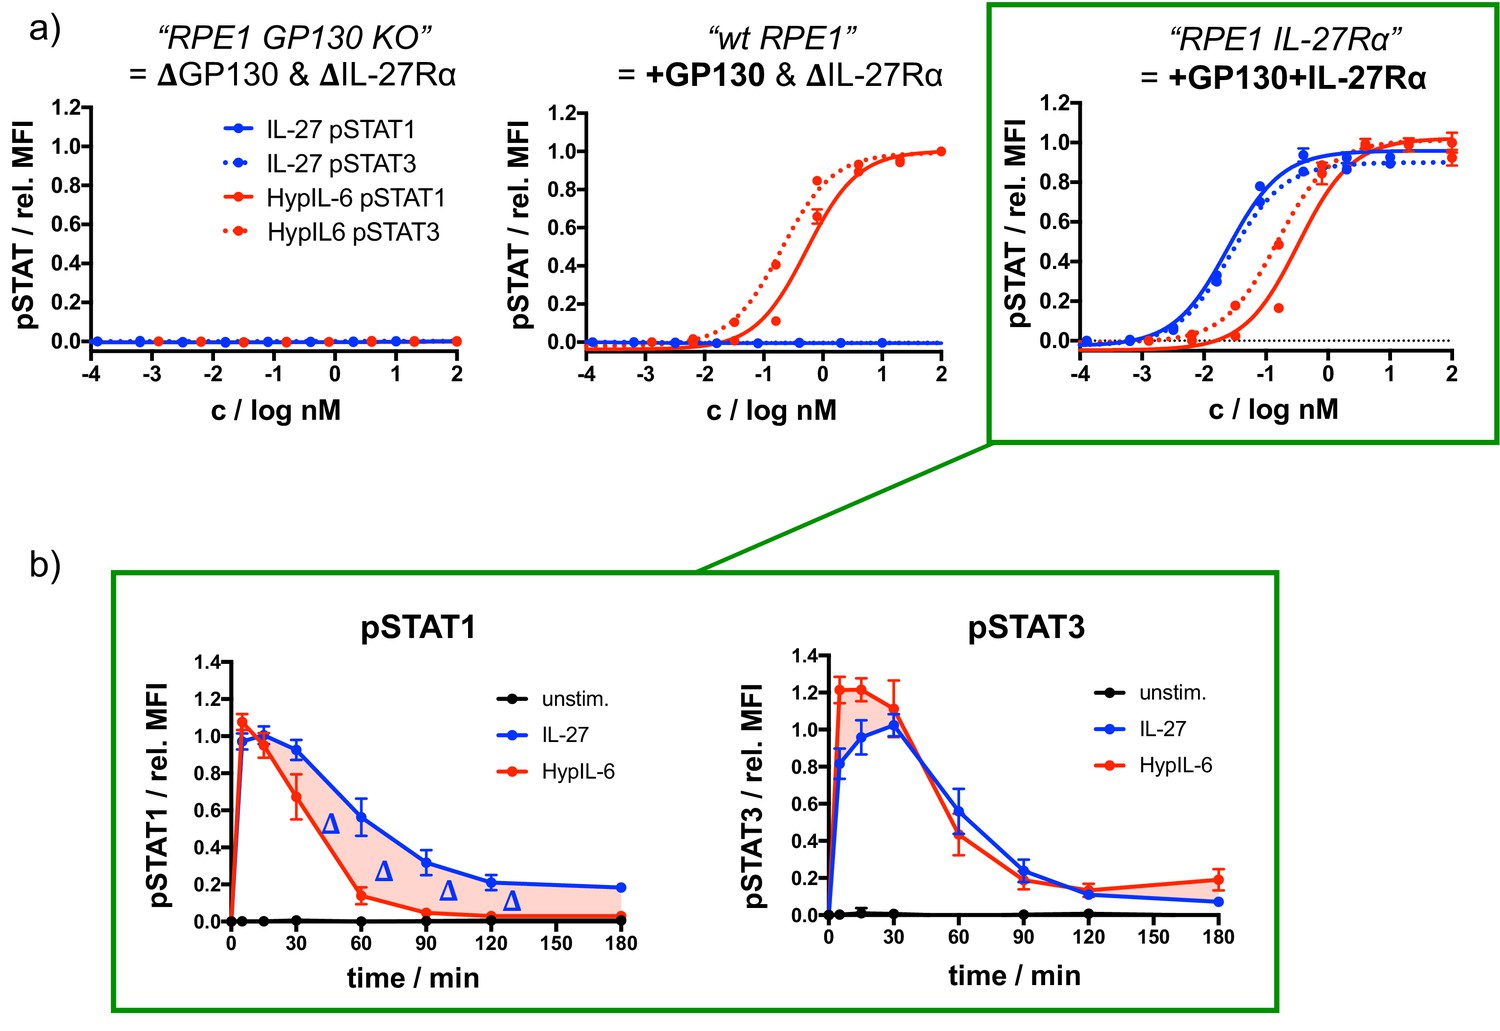
Functional characterization of RPE1 IL-27Rα.
(a) Dose-response experiments for pSTAT1 and pSTAT3 comparing RPE1 GP130 KO cells (left), wt RPE1 (middle) and RPE1 mXFPe-IL27Rα (right) after stimulation with IL-27 or HypIL-6, normalized to maximal HypIL-6 stimulation. Data was obtained from one representative experiment with each two technical replicates, showing mean ± std dev. Green boxes connect dose-response experiments of RPE1 IL-27Rα with corresponding kinetics experiments performed with this cell line (→b). (b) STAT1 (left) and STAT3 (right) phosphorylation kinetics of RPE1 IL-27Rα after stimulation with IL-27 (2 nM) or HypIL-6 (10 nM) normalized to maximal IL-27 stimulation. Data was obtained from three experiments with each two technical replicates, showing mean ± std dev.
Figure 1—figure supplement 3
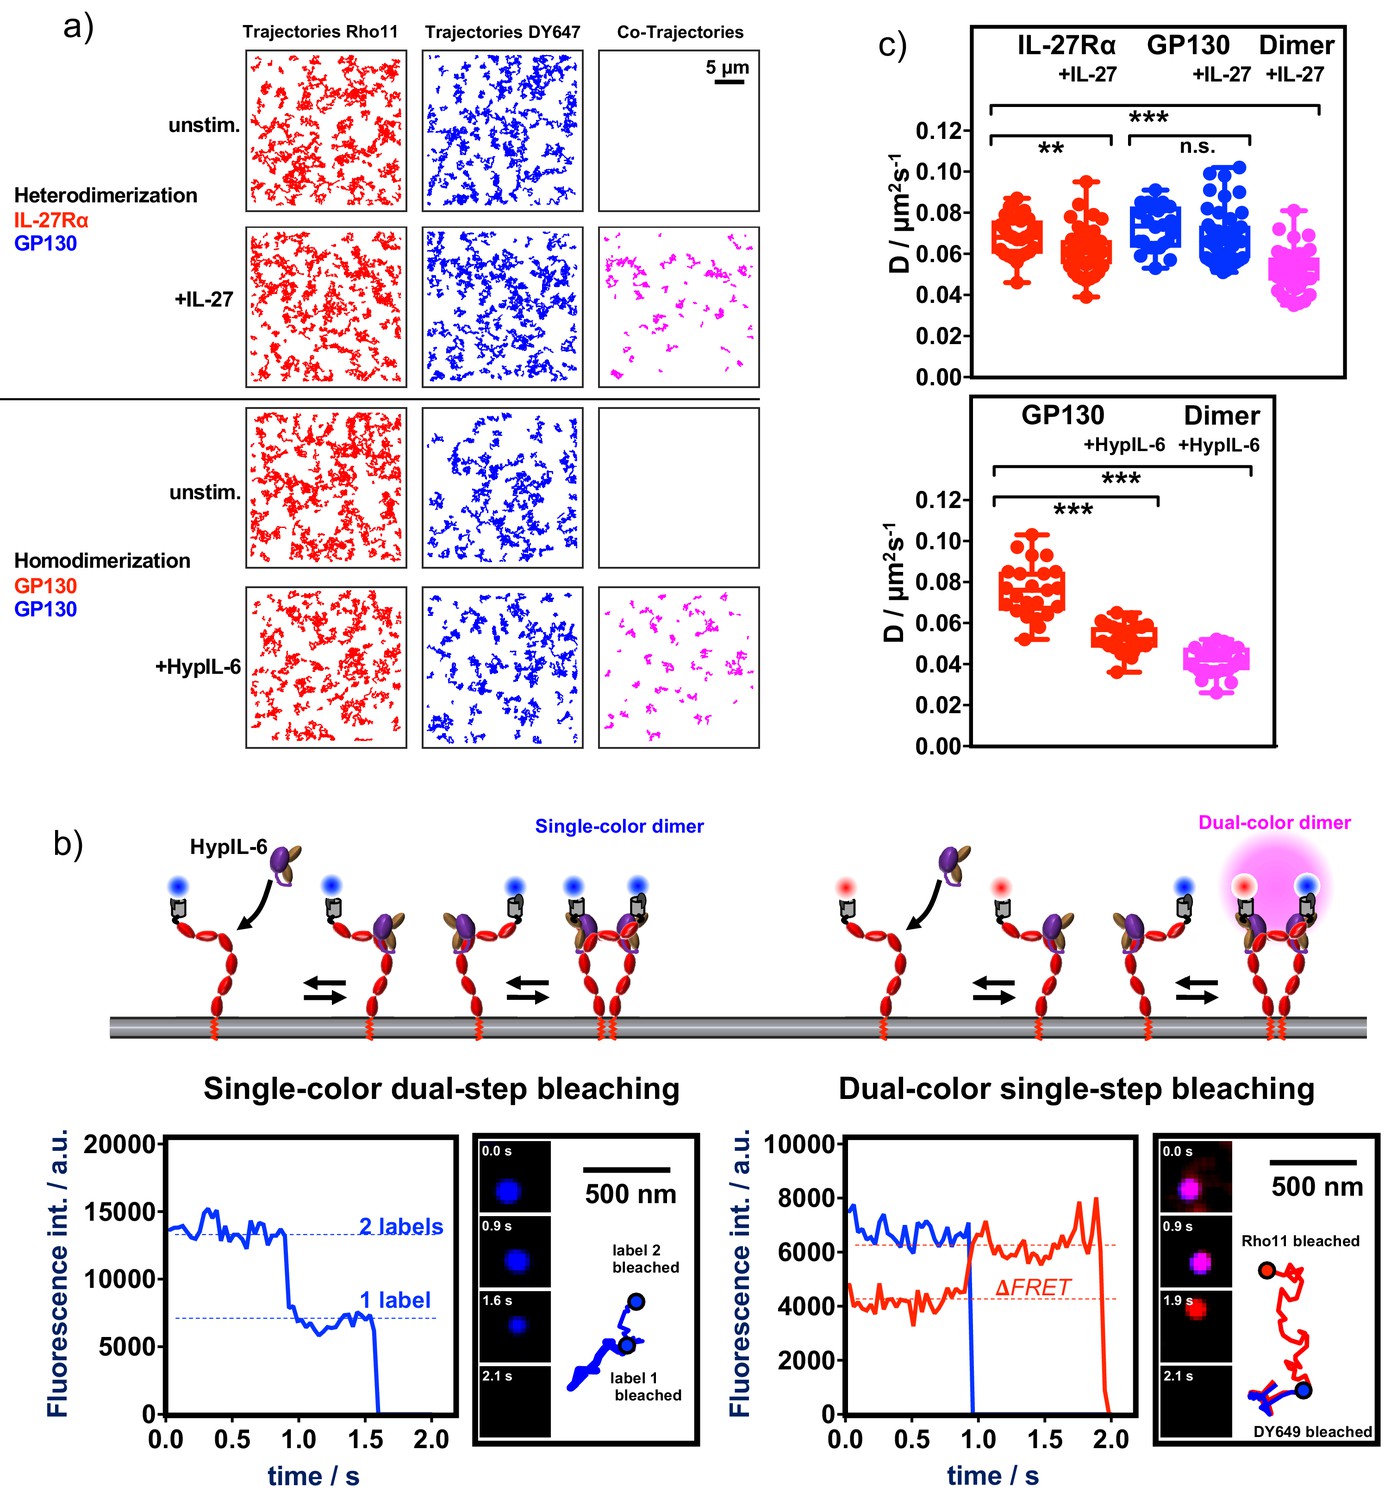
Ligand-induced receptor assembly - stoichiometry and diffusion properties.
(a) Ligand-induced receptor dimerization: Top panel: Dual-color co-tracking of IL-27Rα and GP130 in the absence (top) and presence (bottom) of IL-27 (20 nM). Trajectories (150 frames,~4.8 s) of individual mXFPe-IL-27RαNB-RHO11 (red) and GP130NB-DY649 (blue) and co-trajectories (magenta) are shown for a representative cell. Bottom panel: Dual-color co-tracking of GP130 in the absence (top) and presence (bottom) of HypIL-6 (20 nM). Trajectories (150 frames,~4.8 s) of individual mXFPe-IL-27RαNB-RHO11 (red) and GP130NB-DY649 (blue) and co-trajectories (magenta) are shown for a representative cell. (b) Top: Cartoon model of cell surface labeling of mXFP-tagged GP130 by dye-conjugated anti-GFP nanobodies (NB) and formation of single-color homodimers (left) or dual-color homodimers (right). Below: Examples for intensity traces of single-color dual-step bleaching (left) or dual-color single-step bleaching (right). Insets show raw data for selected timepoints and corresponding trajectories. (c) Top: comparison of diffusion coefficients (D) for mXFPe-IL-27RαNB-RHO11 (red) and mXFPmGP130NB-DY649 (blue) in presence and absence of IL-27 stimulation (20 nM), as well as co-trajectories after IL-27 stimulation (magenta). Bottom: comparison of diffusion coefficients for mXFPm-GP130NB-RHO11 (red) in presence and absence of HypIL-6 stimulation (20 nM), as well as co-trajectories after HypIL-6 stimulation (magenta). Each data point represents the analysis from one cell with a minimum of 23 cells measured for each condition. Two-tailed Student’s T-test: *p<0.05, **p≤0.01,***p≤0.001; n.s., not significant.
Figure 2 with 1 supplement

Mathematical modeling results in RPE1 and Th-1 cells.
(a) Simplified cartoon model of IL-27/HypIL-6 signal propagation layers and coverage of the mathematical modeling approach. (b) Model selection results showing the relative probabilities of each hypothesis, for different values of the distance threshold, , in RPE1 cells. (c) Pointwise median and 95% credible intervals of the predictions from the mathematical model, calibrated with the experimental data, using the posterior distributions for the parameters from the ABC-SMC. For the experimental data, phosphorylation kinetics of pSTAT1 and pSTAT3 were followed in RPE1 IL-27Rα after stimulation with saturating concentrations of IL-27 (2 nM) and HypIL-6 (10 nM). (d) Kernel density estimates of the posterior distributions for the parameters in the mathematical models where and . A '+' in the parameter notation indicates that this is a forward rate constant (binding) and a '–' in the notation indicates that this is a reverse rate constant (dissociation). In the first row, a '6' in the notation indicates that this is a reaction rate in the HypIL-6 system and a '27' indicates that this is a reaction rate in the IL-27 system.
Figure 2—figure supplement 1
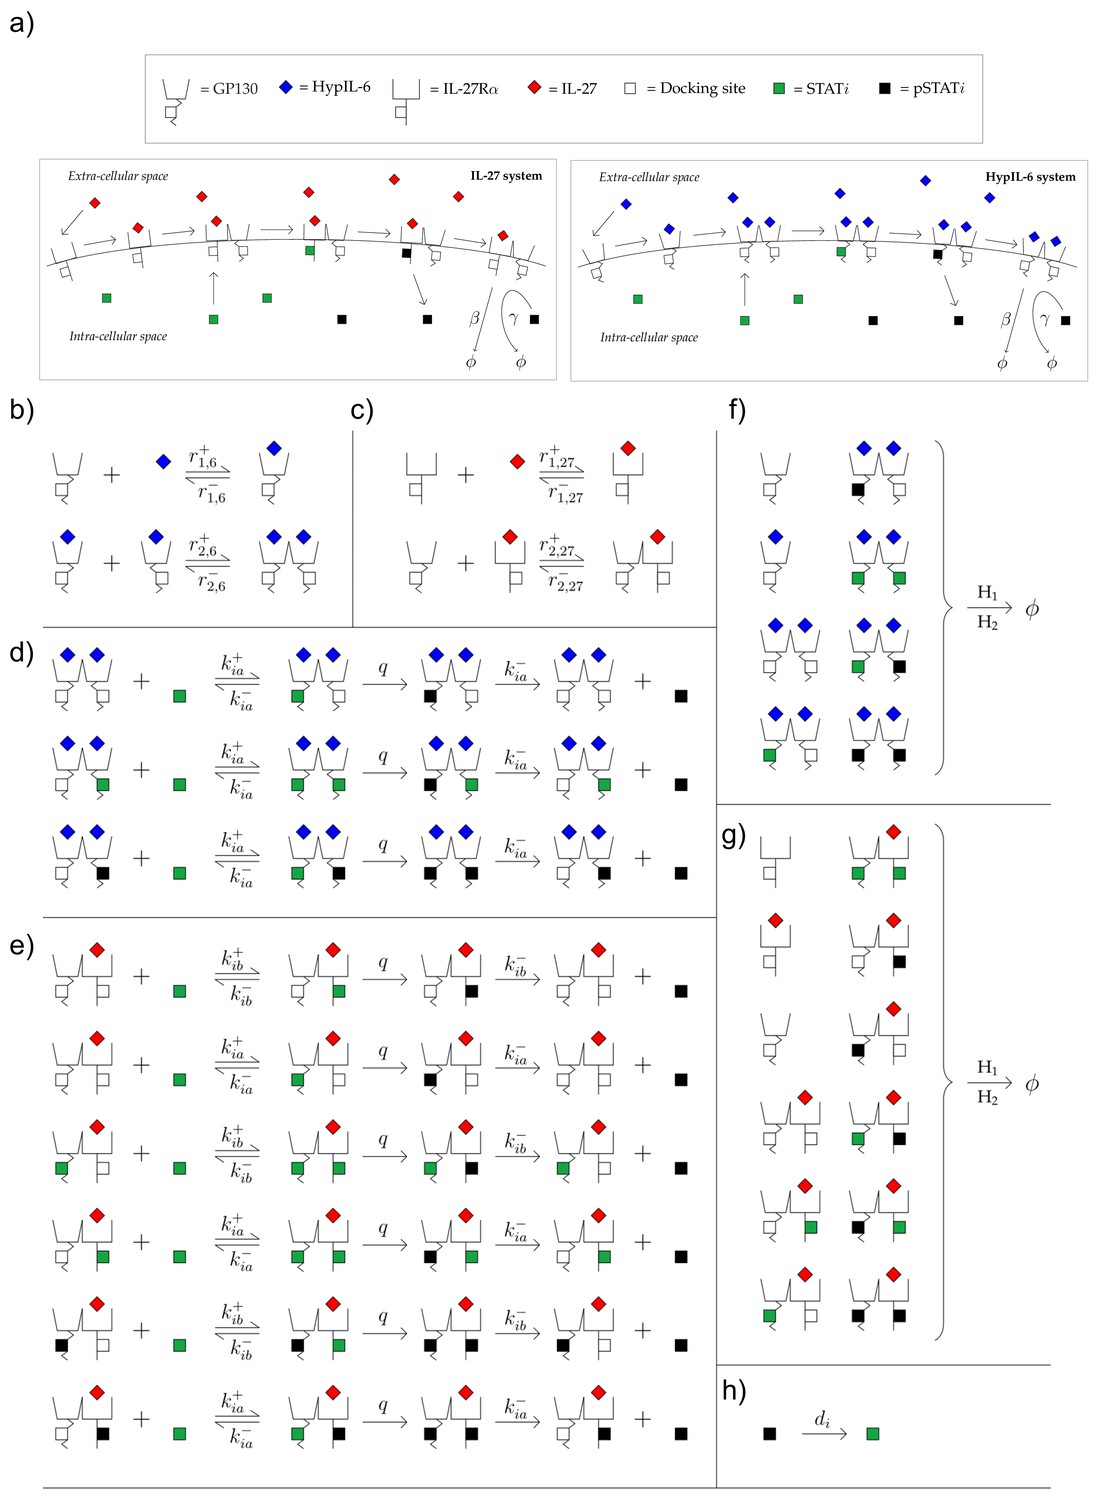
Schematic model of involved reactions and parameters for IL-27 and HypIL-6 receptor activation.
(a) Diagram of the reactions for the HypIL-6 and IL-27 mathematical models. From left to right in a single model panel: cytokines can bind to monomeric receptors, dimerization of receptor monomers can occur and STAT molecules can bind to the dimers, where they can then phosphorylate and dissociate. Each panel is one such example of the model, in general STAT molecules can bind to either receptor in the dimer until two STATs are bound to a given single dimer. The reverse reactions are also included in the models but have not been included in the diagramme to simplify it. Finally, in each model (HypIL-6 or IL-27), any molecular species involving a receptor molecule of either type can be internalized/degraded. (b) Reactions involving ligand binding and dimerization in the HypIL-6 model. (c) Reactions involving ligand binding and dimerization in the IL-27 model. (d) Reactions involving the STAT molecules in the HypIL-6 model. (e) Reactions involving the STAT molecules in the IL-27 model. (f) Reactions involving receptor internalization/degradation in the HypIL-6 model. Here and . (g) Reactions involving receptor internalization/degradation in the IL-27 model. Here and . (h) Dephosphorylation of in the cytoplasm. This reaction occurs in both models.
Figure 3 with 2 supplements
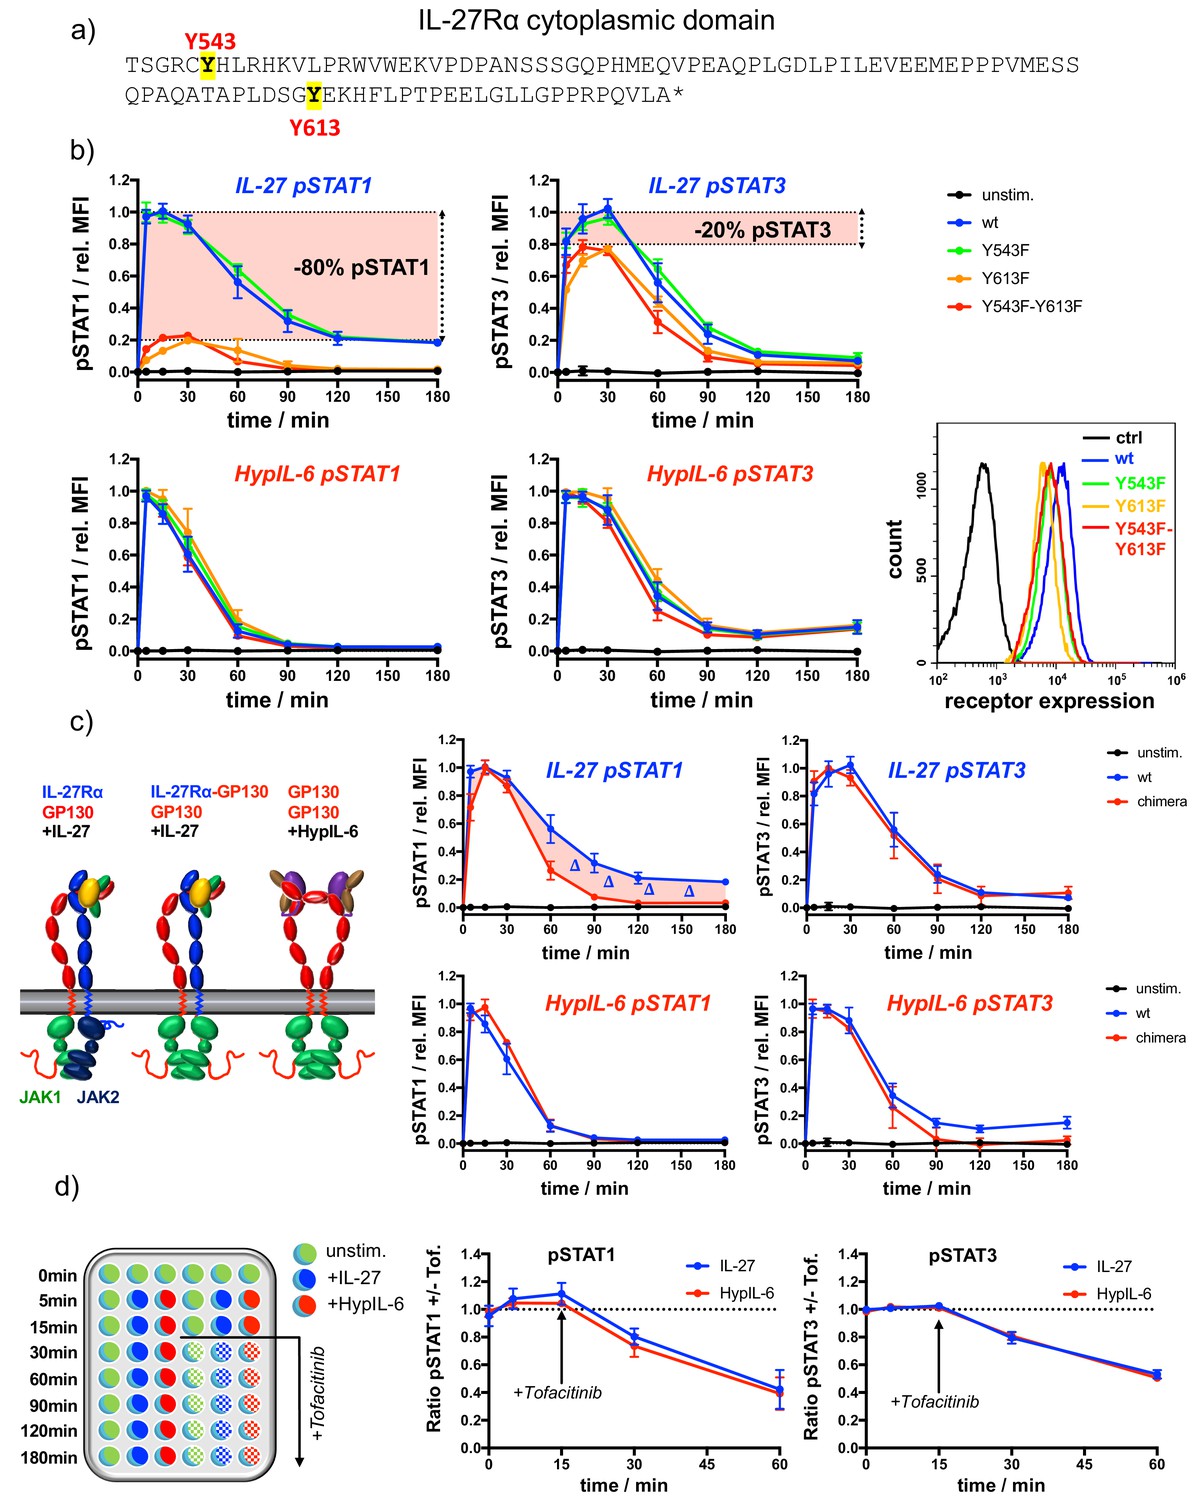
IL-27Rα cytoplasmic domain is required for sustained pSTAT1 kinetics.
(a) Representation of the cytoplasmic domain of IL-27Rα with its highlighted tyrosine residues Y543 and Y613. (b) STAT1 and STAT3 phosphorylation kinetics of RPE1 clones stably expressing wt and mutant IL-27Rα after stimulation with IL-27 (10 nM, top panels) or after stimulation with HypIL-6 (20 nM, bottom panels), normalized to maximal levels of wt IL-27Rα stimulated with IL-27 (top) or HypIL-6 (bottom). Data was obtained from three experiments with each two technical replicates, showing mean ± std dev. Bottom right: cell surface levels variants measured by flow cytometry for indicated IL-27Rα cell lines. (c) Cytoplasmic domain of IL-27Rα is required for sustained pSTAT1 activation. Left: Cartoon representation of receptor complexes. Right: STAT1 and STAT3 phosphorylation kinetics of RPE1 clones stably expressing wt IL-27Rα and IL-27Rα-GP130 chimera after stimulation with IL-27 (10 nM, top panels) or after stimulation with HypIL-6 (20 nM, bottom panels). Data was normalized to maximal levels for each cytokine and cell line. Data was obtained from two experiments with each two technical replicates, showing mean ±std dev. (d) Phosphatases do not account for differential pSTAT1/3 activity induced by IL-27 and HypIL-6. Left: Schematic representation of workflow using JAK inhibitor Tofacitinib. Right: MFI ratio of Tofacitinib-treated and non-treated RPE1 mXFPe-IL-27Rα cells for pSTAT1 and pSTAT3 after stimulation with IL-27 (10 nM) and HypIL-6 (20 nM). Data was obtained from two experiments with each two technical replicates, showing mean ± std dev.
Figure 3—figure supplement 1
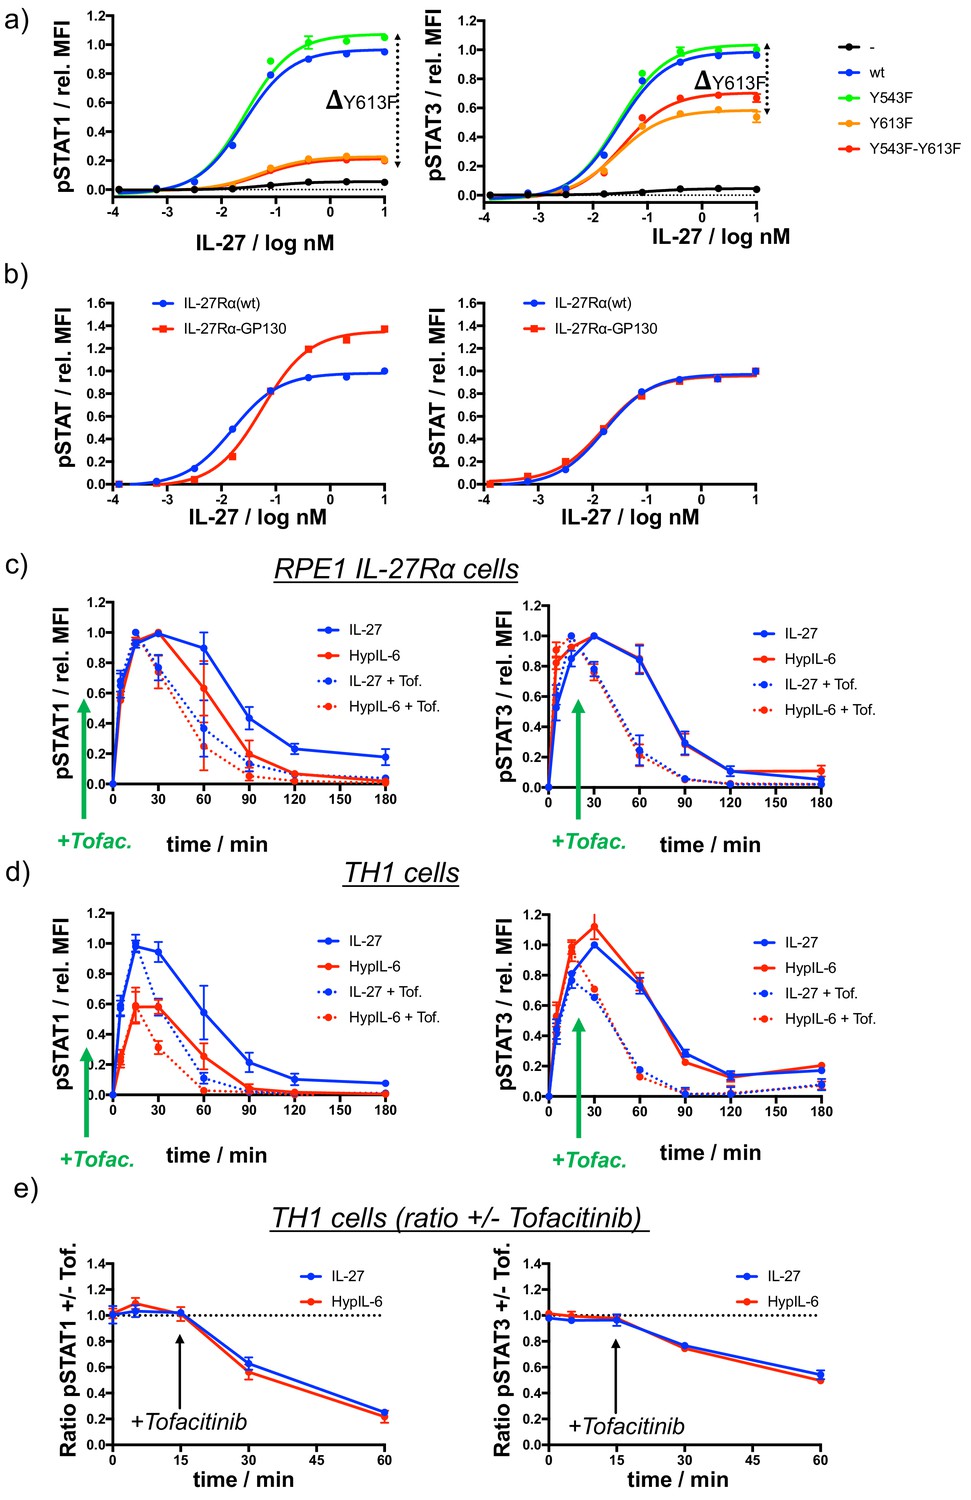
Characterization of IL-27Rα mutants and probing phosphatase activity by Tofacitinib-mediated inhibition of JAK/STAT signaling.
(a) Dose-response experiments for pSTAT1 (left) and pSTAT3 (right) in RPE1 cells stably expressing wt IL-27Rα or tyrosine-mutants after stimulation with IL-27, normalized to maximal stimulation of wt IL-27Rα. Data was obtained from one representative experiment with each two technical replicates, showing mean ± std dev. (b) Dose-response experiments for pSTAT1 (left) and pSTAT3 (right) in RPE1 cells stably expressing wt IL-27Rα or IL-27Ra-GP130 chimera after stimulation with IL-27. Data normalized to maximal stimulation of wt IL-27Rα. Data was obtained from one representative experiment with each two technical replicates, showing mean ± std dev. (c) STAT1 (left) and STAT3 (right) phosphorylation kinetics in RPE1 IL-27Rα cells stimulated with with IL-27 (2 nM) or HypIL-6 (10 nM) with and without JAK inhibition by Tofacitinib. Data was normalized to maximal IL-27 stimulation. Data was obtained from two experiments with each two technical replicates, showing mean ± std dev. (d) STAT1 (left) and STAT3 (right) phosphorylation kinetics in Th-1 cells stimulated with with IL-27 (10 nM) or HypIL-6 (20 nM) with and without JAK inhibition by Tofacitinib. Data was normalized to to maximal IL-27 stimulation. Data was obtained from two biological replicates with each two technical replicates, showing mean ± std dev. (e) MFI ratio of Tofacitinib-treated and non-treated Th-1 cells for pSTAT1 (left) and pSTAT3 (right) after stimulation with IL-27 (10 nM) and HypIL-6 (20 nM). Data was obtained from two biological replicates with each two technical replicates, showing mean ±std dev.
Figure 3—figure supplement 2
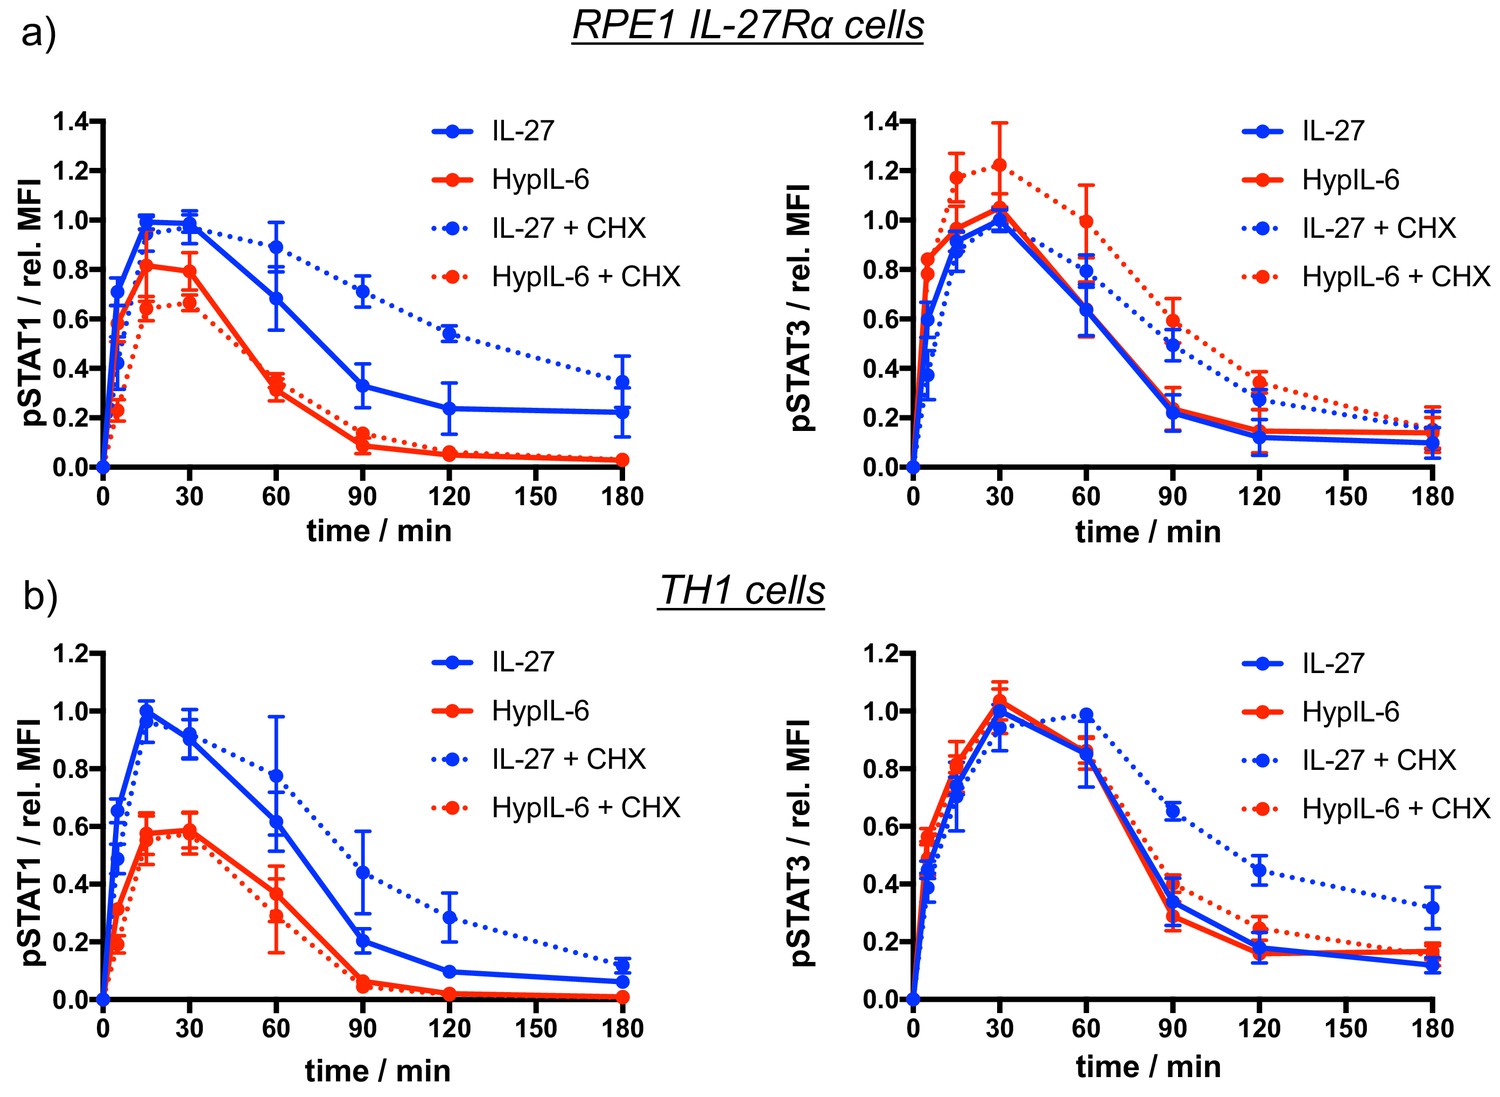
Effects of Cycloheximide-mediated inhibition of protein neosynthesis on IL-27 and HypIL-6 signaling.
(a) STAT1 (left) and STAT3 (right) phosphorylation kinetics in RPE1 IL-27Rα cells stimulated with IL-27 or HypIL-6 with and without pretreatment with cycloheximide (CHX). Data was normalized to maximal IL-27 stimulation. Data was obtained from two experiments with each two technical replicates, showing mean ± std dev. (b) STAT1 (left) and STAT3 (right) phosphorylation kinetics in TH1 cells stimulated with IL-27 or HypIL-6 with and without pre-treatment with cycloheximide (CHX). Data was normalized to to maximal IL-27 stimulation. Data was obtained from two biological replicates with each two technical replicates, showing mean ± std dev.
Figure 4 with 2 supplements

Unique and overlapping effects of IL-27 and HypIL-6 on the phosphoproteome of Th-1 cells.
(a) Volcano plot of the phospho-sites regulated (p value ≤ 0.05, fold change ≥+1.5 or≤−1.5) by IL-27 (left) and HypIL-6 (right). Cells were stimulated for 15 min at saturating concentrations (IL-27: 10 nM, HypIL-6: 20 nM). Data was obtained from three biological replicates. (b) Heatmap representation (examples) of shared and differentially up- (left) and downregulated (right) phospho-sites after IL-27 and HypIL-6 stimulation. Data represents the mean (log2) fold change of three biological replicates. (c) Tyrosine and Serine phosphorylation of selected STAT proteins after stimulation with IL-27 (red) and HypIL-6 (blue). Two-tailed Student’s T-test: *p<0.05, **p≤0.01,***p≤0.001; n.s., not significant. (d) pS727-STAT1 and pS727-STAT3 phosphorylation kinetics in Th-1 cells after stimulation with IL-27 or HypIL-6, normalized to maximal IL-27 stimulation. Data was obtained from three biological replicates with each two technical replicates, showing mean ±std dev. (e) GO analysis ‘biological processes’ of the phospho-sites regulated by IL-27 (red) and HypIL-6 (blue) represented as bubble-plots. (f) Phosphorylation of target proteins associated with STAT3/CDK transcription initiation complex after stimulation with IL-27 (blue) and HypIL-6 (red) and schematic representation of transcription regulation of RNA polymerase II with identified phospho-sites (red flags). Two-tailed Student’s T-test: *p<0.05, **p≤0.01,***p≤0.001; n.s., not significant.
Figure 4—figure supplement 1
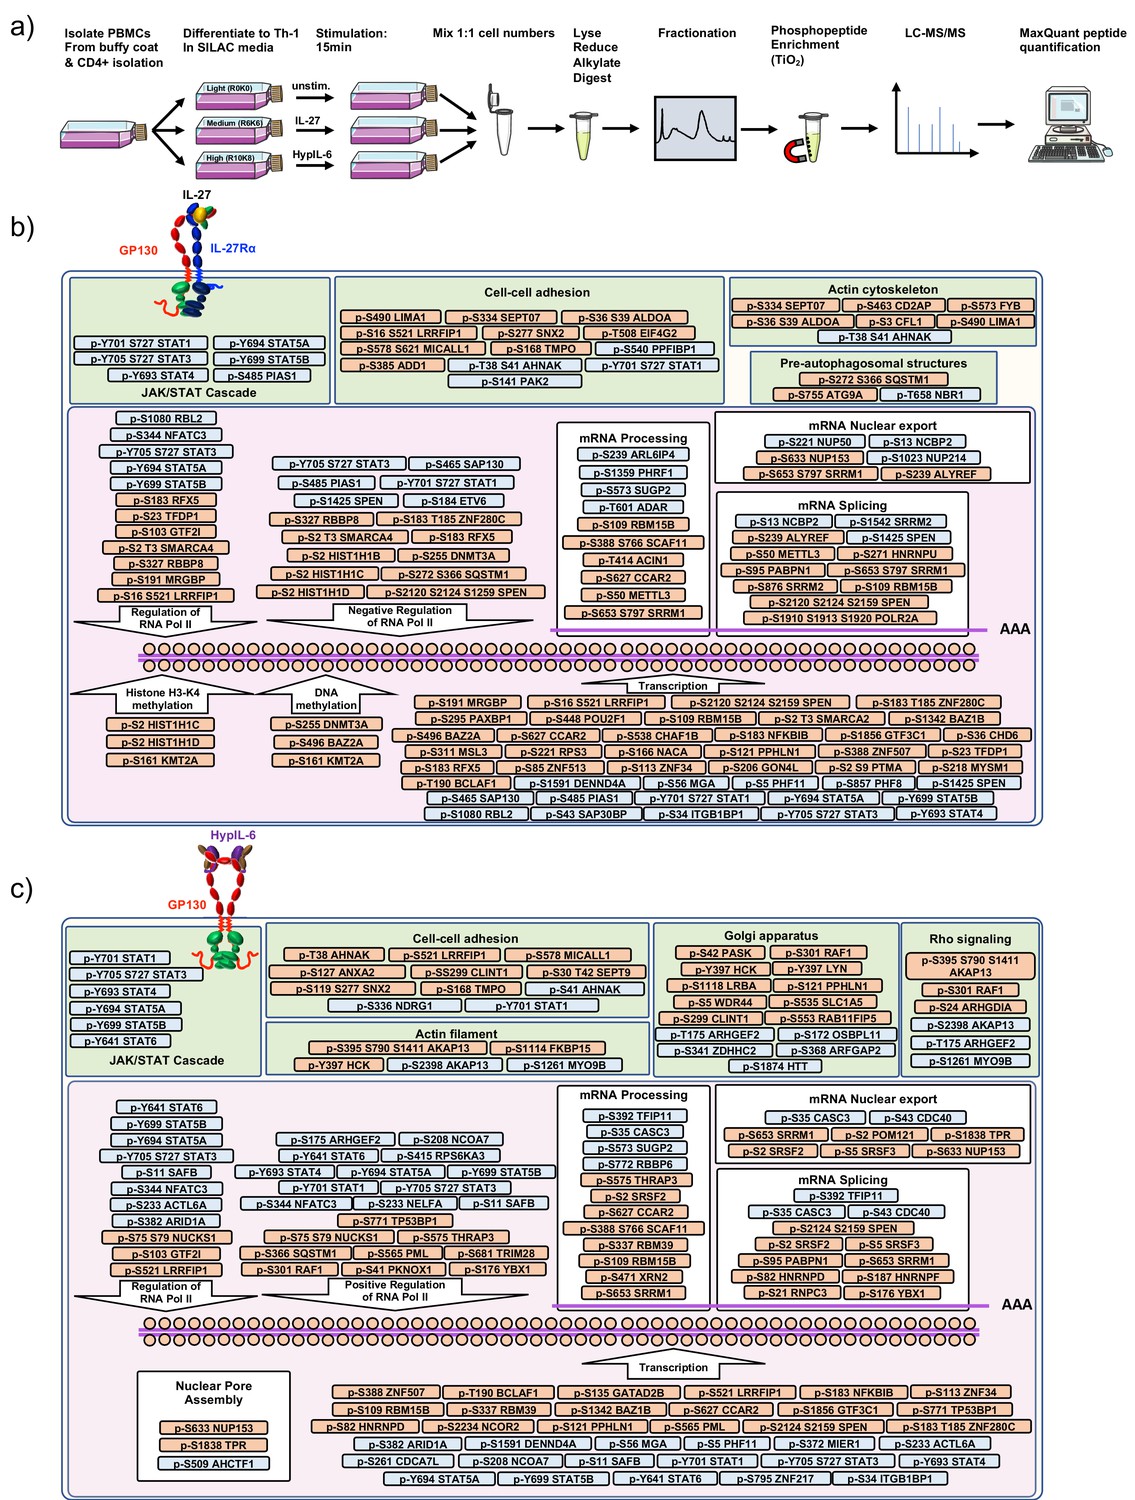
Workflow for phospho-proteomics and cellular localization of identified phosphorylation targets.
(a) Workflow for quantitative SILAC phospho-proteomic analysis of TH-1 cells stimulated (15 min) with IL-27 (10 nM), HypIL-6 (20 nM) or left untreated. (b) Schematic representation of the main GO terms regulated by IL-27 as inferred from our phospho-proteomics studies. Red represents downregulated phospho-sites and blue represents upregulated p-sites upon IL-27 stimulation of human primary Th-1 cells. (c) Schematic representation of the main GO terms regulated by HyIL6 as inferred from our phospho-proteomics studies. Red represents downregulated phospho-sites and blue upregulated p-sites upon HyIL6 stimulation of human primary Th-1 cells.
Figure 4—figure supplement 2
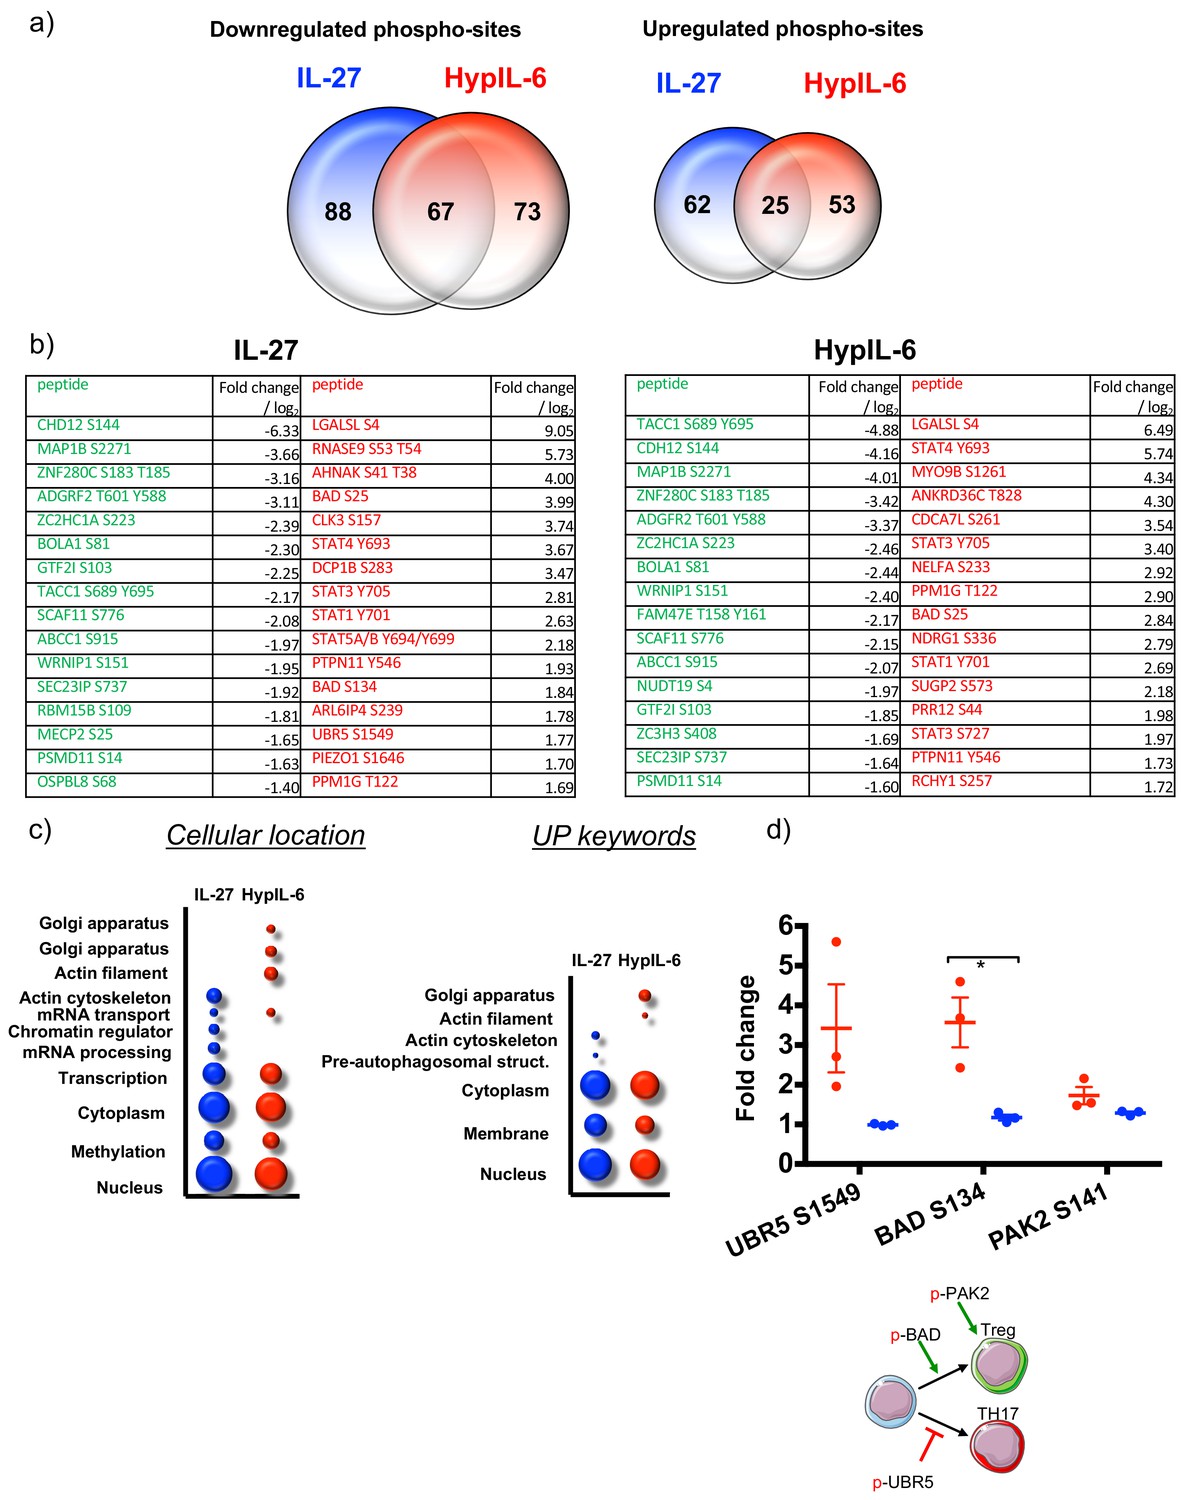
Phospho-proteomics - shared and unique targets and gene ontology analysis.
(a) Venn diagrams comparing the numbers of unique upregulated (left) and downregulated (right) phospho-sites by IL-27 (blue) and HypIL-6 (red) as well as the number of shared phospho-sites. (b) List of most strongly altered phosphosites (downregulated: green; upregulated: red) in response to IL-27 (left) or HypIL-6 (right). (c) GO analysis ‘cellular location’ and ‘UP keywords’ of the phospho-sites regulated by IL-27 (red) and HypIL-6 (blue) represented as bubble-plots. (d) Phosphorylation of target proteins related to Treg functions and schematic representation of their activity on T-cells. Two-tailed Student’s T-test: *p<0.05, **p≤0.01,***p≤0.001; n.s., not significant.
Figure 5 with 3 supplements
Kinetic decoupling of gene induction programs depends on sustained STAT1 activation by IL-27.
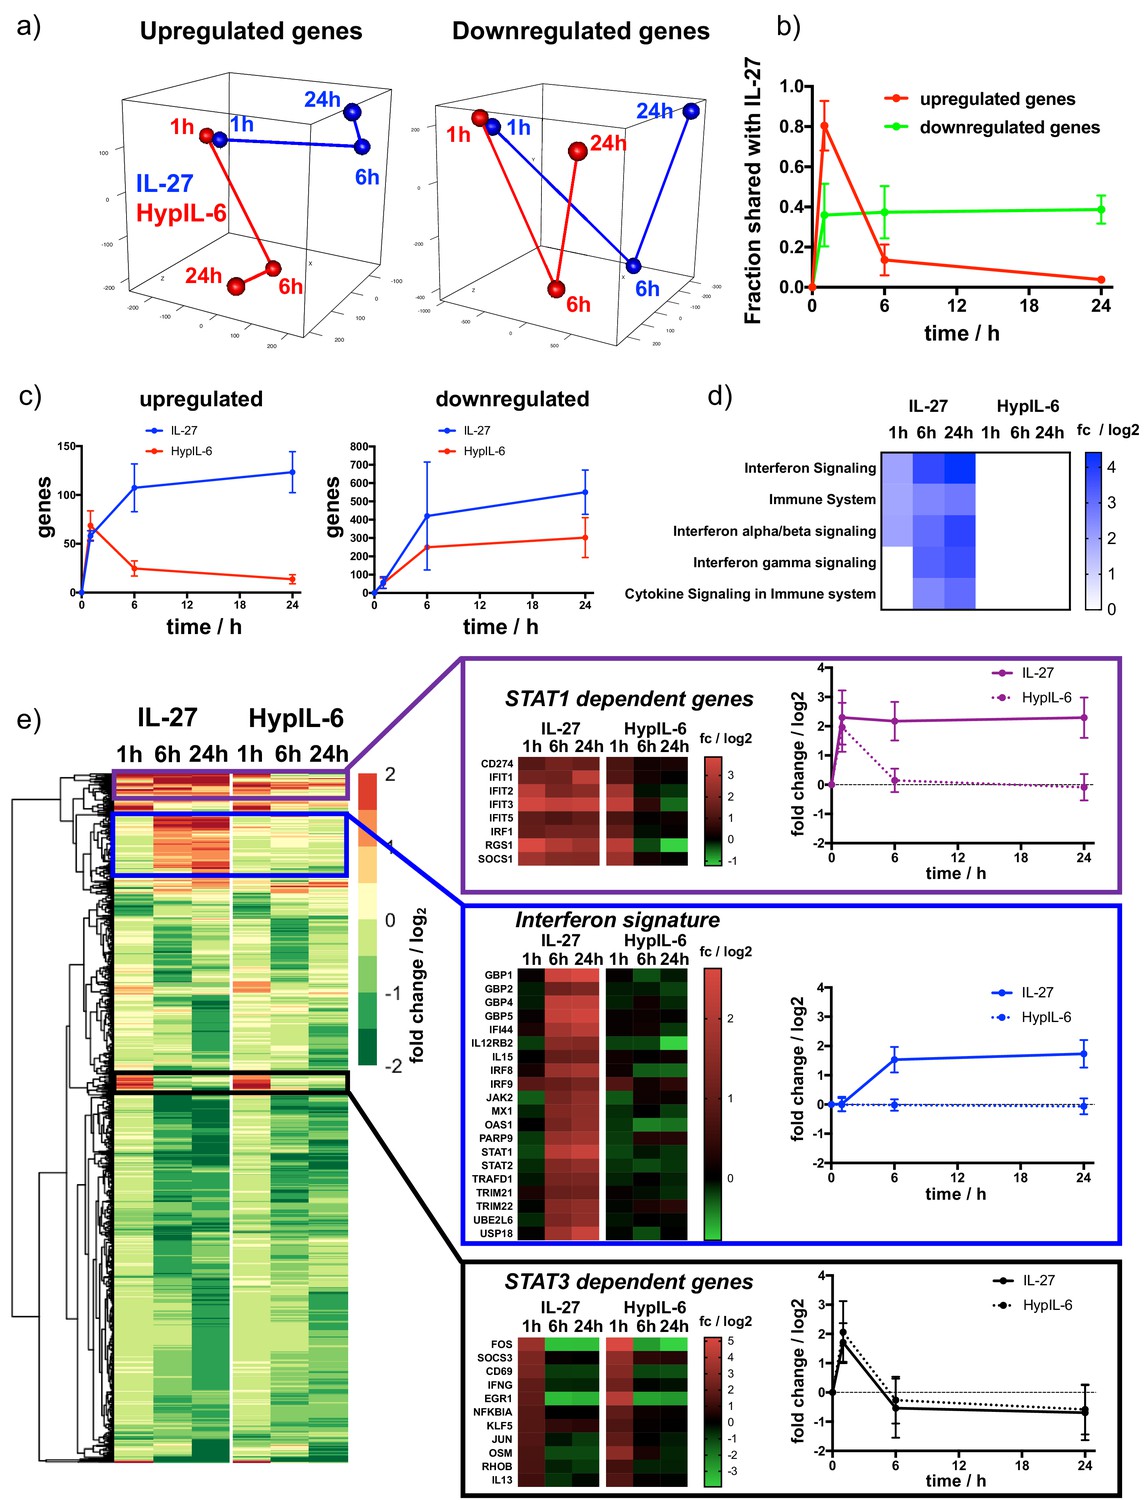
(a) Principal component analysis for genes found to be significantly upregulated (left) or downregulated (right) for at least one of the tested conditions (time and cytokine). Data was obtained from three biological replicates. (b) Kinetics of gene induction shared between IL-27 and HypIL-6 (relative to IL-27) for upregulated genes (red) or downregulated genes (green). (c) Kinetics of gene numbers induced after IL-27 and HypIL-6 stimulation for upregulated genes (left) and downregulated genes (right). (d) GSEA reactome analysis of selected pathways with significantly altered gene induction in response to IL-27 or HypIL-6 stimulation. Data represents the mean (log2) fold change of three biological replicates. (e) Cluster analysis comparing the gene induction kinetics after IL-27 or HypIL-6 stimulation. Gene induction heatmaps for example genes as well as induction kinetics (mean) are shown for highlighted gene clusters. Data represents the mean (log2) fold change of three biological replicates.
Figure 5—figure supplement 1
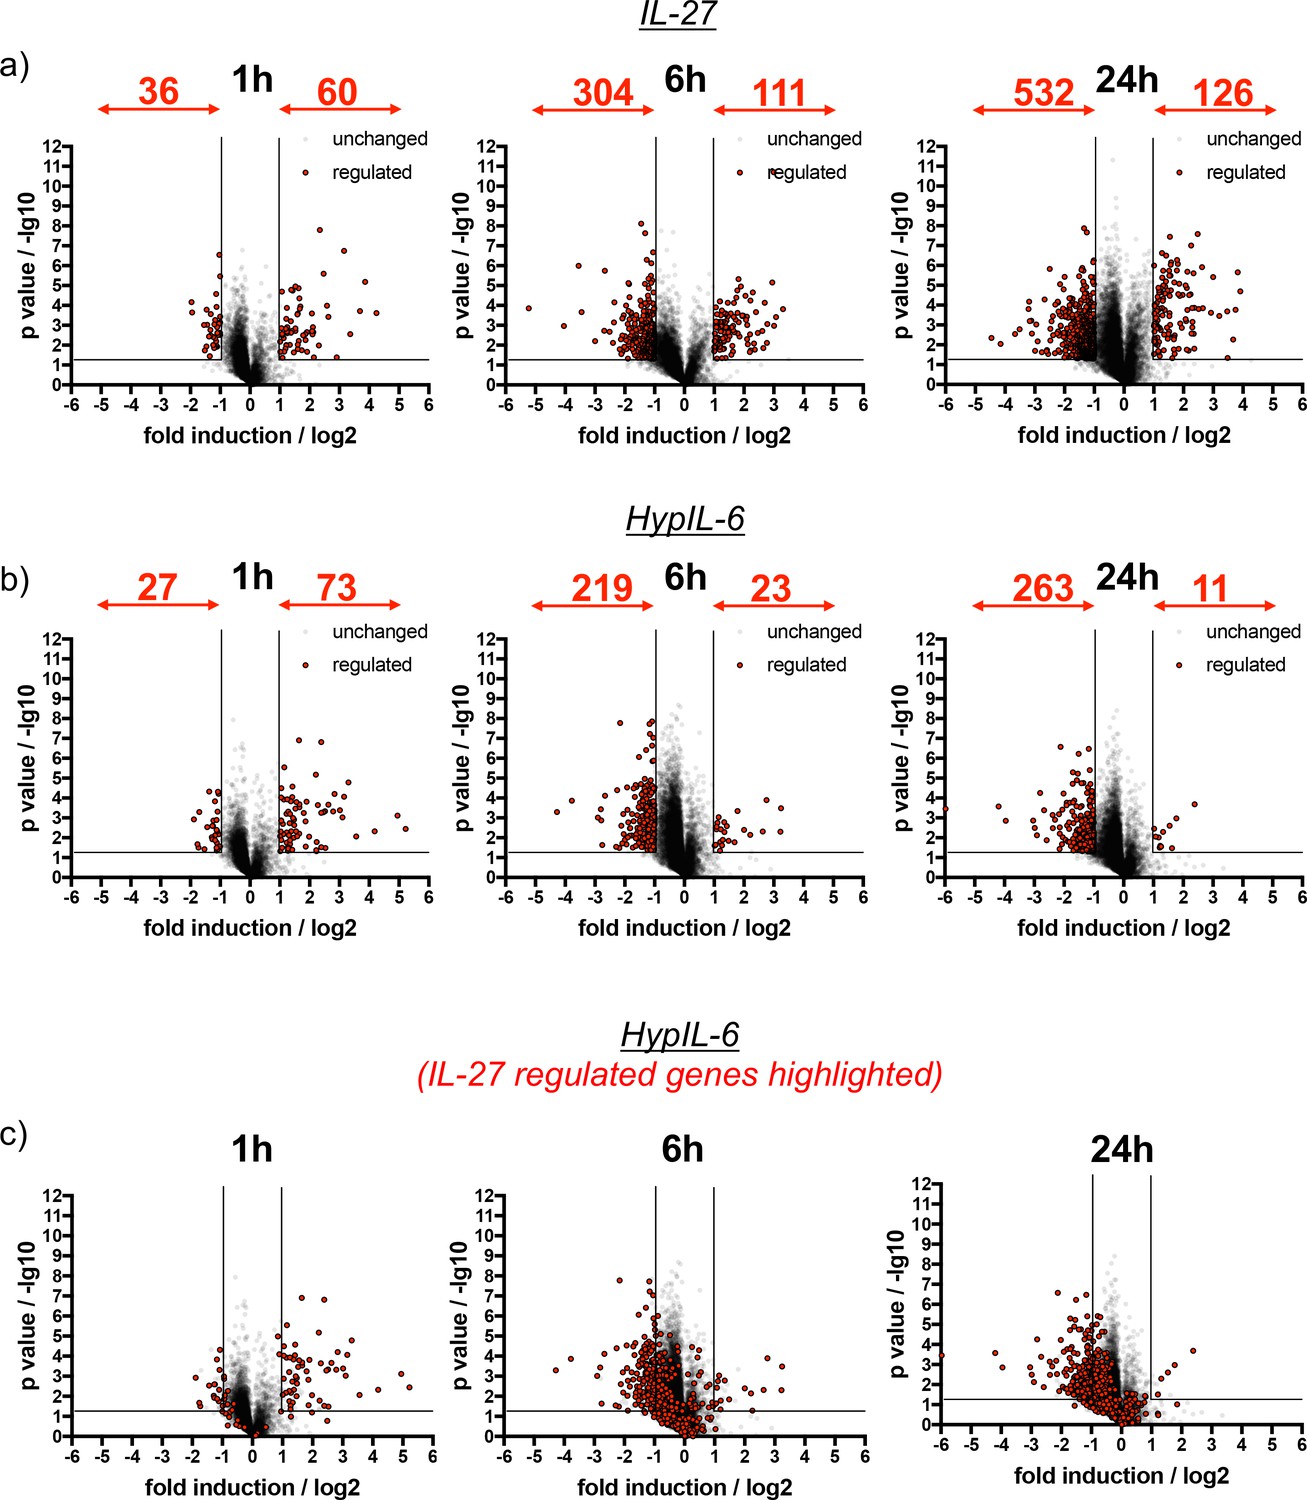
IL-27 and HypIL-6 stimulated gene induction profiles represented as volcano plots.
(a) Kinetics of gene induction in Th-1 cells induced by IL-27 represented as volcano plots. Genes significantly up- or downregulated are highlighted in red (p value ≤ 0.05, fold change ≥+2 or ≤−2). Data was obtained from three biological replicates. (b) Kinetics of gene induction in Th-1 cells induced by HypIL-6 represented as volcano plots. Genes significantly up- or downregulated are highlighted in red (p value ≤ 0.05, fold change ≥+2 or ≤−2). Data was obtained from three biological replicates. (c) Kinetics of gene induction in Th-1 cells induced by HypIL-6 represented as volcano plots. Genes identified to be significantly up- or downregulated by IL-27 are highlighted in red (p value ≤ 0.05, fold change ≥+2 or ≤−2). Data was obtained from three biological replicates.
Figure 5—figure supplement 2
Kinetic decoupling of gene induction programs - shared and unique genes and GSEA pathway analysis.
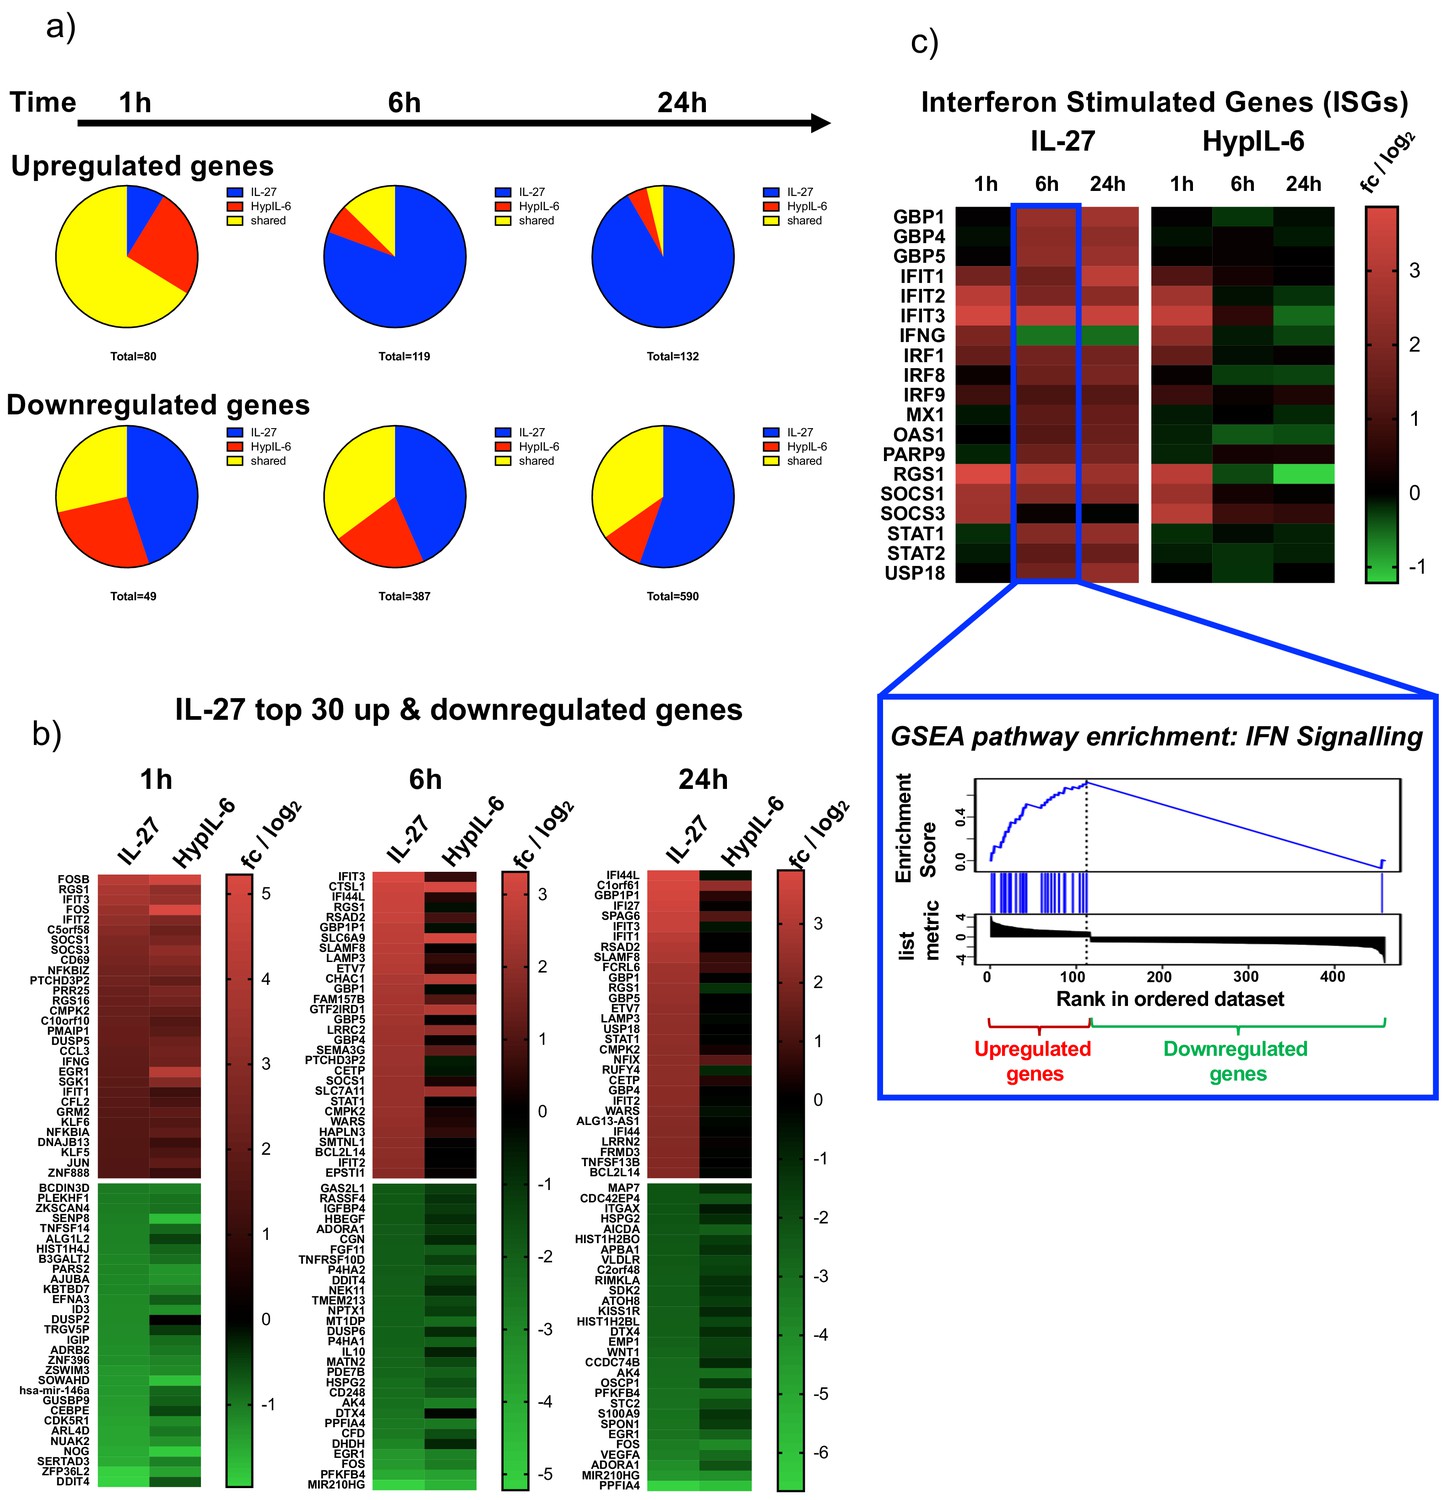
(a) Gene induction kinetics represented as pie-charts, separated for upregulated genes (top panel) and downregulated genes (bottom panel). (b) Kinetics of ISG induction (examples) as heatmap representation comparing IL-27 with HypIL-6 (top) and GSEA reactome pathway enrichment ‘IFN signaling’ for genes induced by IL-27 after 6 hr (bottom). Data represents the mean (log2) fold change of three biological replicates. (c) Heatmaps of the top 30 up- and downregulated genes by IL-27 compared to HypIL-6 for 1 hr, 6 hr, and 24 hr. Data represents the mean (log2) fold change of three biological replicates.
Figure 5—figure supplement 3
IL-27-induced upregulation of IRF1 amplifies induction of STAT1-dependent genes.
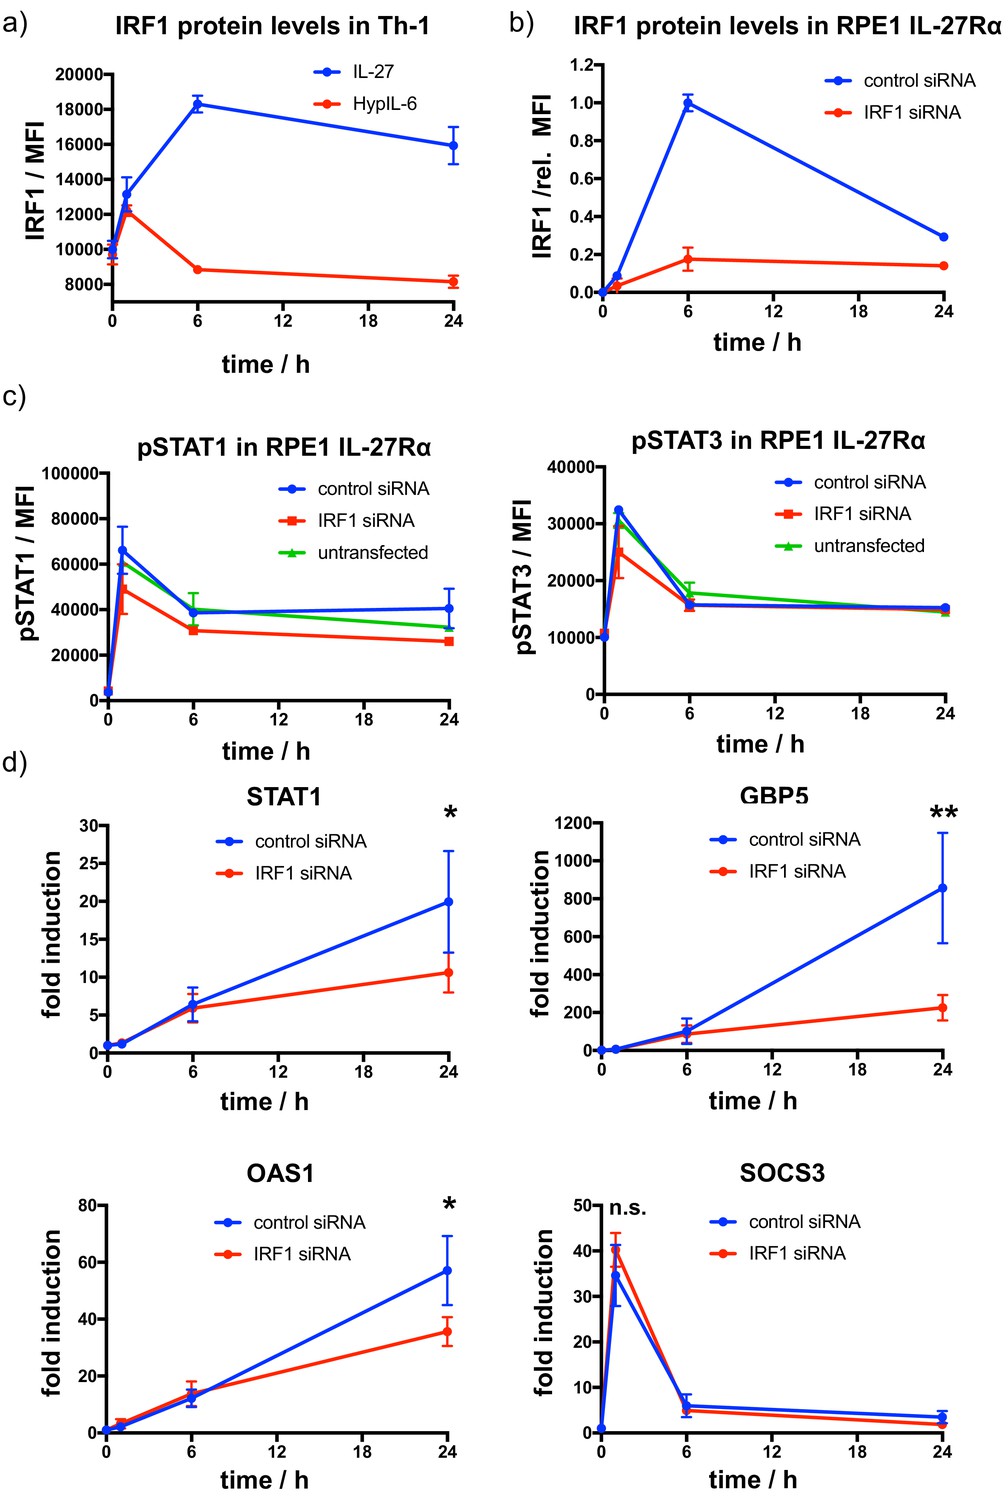
(a) Kinetics of IRF1 protein expression as a response to continuous IL-27 and HypIL-6 stimulation in Th-1 cells. Data was obtained from three biological replicates with each two technical replicates, showing mean ± std dev. Dotted line indicates baseline level. (b) Kinetics of IRF1 protein expression and siRNA-mediated IRF1 knockdown in RPE1 IL-27Rα cells stimulated with IL-27 (2 nM). Data was obtained from one representative experiment with each two technical replicates, normalized to maximal IRF1 induction (6 hr), showing mean ± std dev. (c) Kinetics of STAT1 (left) and STAT3 (right) phosphorylation after siRNA-mediated IRF1 knockdown in RPE1 IL-27Rα cells stimulated with IL-27 (2 nM). Data was obtained from one representative experiment with each two technical replicates, showing mean ± std dev. (d) Kinetics of gene induction (STAT1, GBP5, OAS1, SOCS3) followed by RT qPCR in RPE1 IL-27Rα cells stimulated with IL-27 (2 nM) with and without siRNA-mediated knockdown of IRF1. Data was obtained from four experiments with each two technical replicates, showing mean ± std dev. Two-tailed Student’s T-test: *p<0.05, **p≤0.01,***p≤0.001; n.s., not significant.
Figure 6 with 1 supplement
IL-27-induced STAT1 response drives global proteomic changes in Th-1 cells.
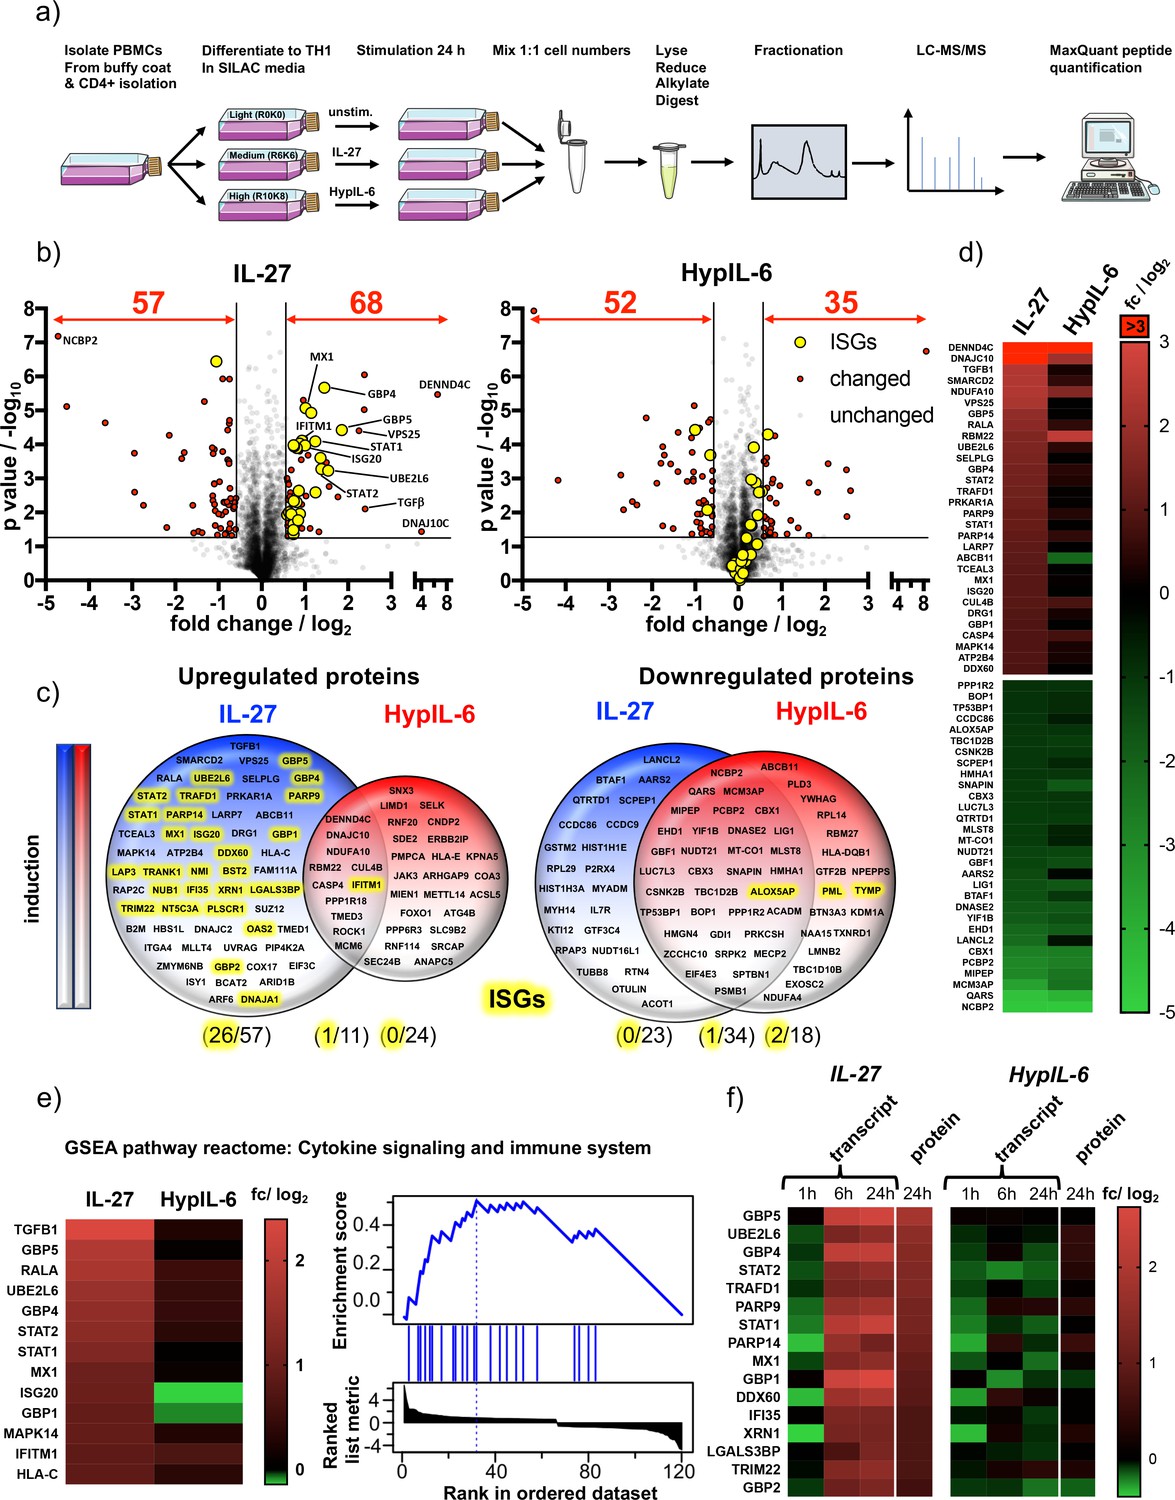
(a) Workflow for quantitative SILAC proteomic analysis of Th-1 cells continuously stimulated (24 hr) with IL-27 (10 nM), HypIL-6 (20 nM) or left untreated. (b) Global proteomic changes in Th-1 cells induced by IL-27 (left) or HypIL-6 (right) represented as volcano plots. Proteins significantly up- or downregulated are highlighted in red (p value ≤ 0.05, fold change ≥+1.5 or≤−1.5). Significantly altered ISG-encoded proteins by IL-27 are highlighted in yellow. Data was obtained from three biological replicates. (c) Venn diagrams comparing unique upregulated (left) and downregulated (right) proteins by IL-27 (blue) and HypIL-6 (red) as well as shared altered proteins. ISG-encoded proteins are highlighted in yellow. (d) Heatmaps of the top 30 up- and downregulated proteins by IL-27 compared to HypIL-6. Data representation of the mean (log2) fold change of three biological replicates. (e) Heatmap representation and enrichment plot of proteins identified by GSEA reactome pathway enrichment analysis ‘Cytokine signaling and immune system’ induced by IL-27. Data representation of the mean (log2) fold change of three biological replicates. (f) Correlation of IL-27 and HypIL-6-induced RNA-seq transcript levels (≥+2 or ≤−2 fold change) with quantitative proteomic data (≥+1.5 or≤−1.5 fold change). Data representation of the mean (log2) fold change of three biological replicates.
Figure 6—figure supplement 1
Shared and unique proteomic changes upon IL-27 and HypIL-6 stimulation and GSEA pathway reactome analysis.
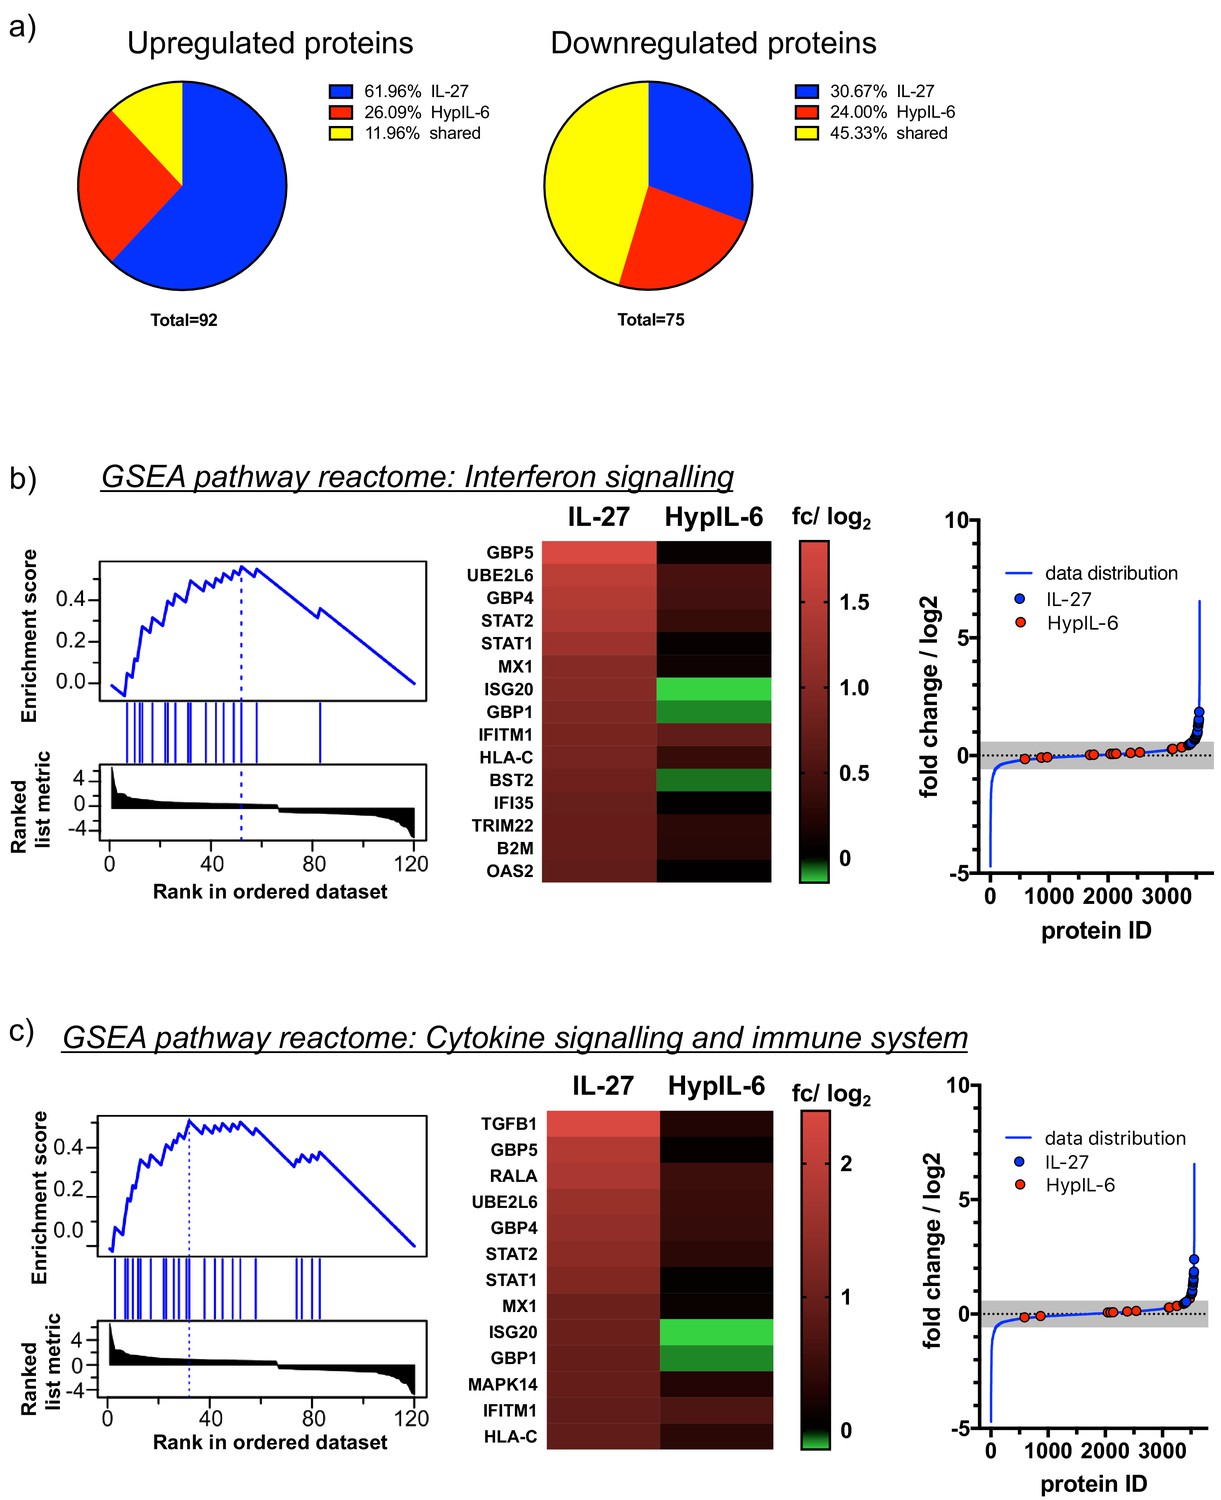
(a) Pie charts of proteomic changes (unique and shared) for upregulated (left) and downregulated (right) proteins in response to IL-27 or HypIL-6 stimulation in Th-1 cells. (b) Left: GSEA reactome pathway enrichment analysis ‘Interferon signaling’ for proteins induced by IL-27. Middle: heatmap representation pathway-associated proteins comparing IL-27 with HypIL-6 stimulation. Data represents the mean (log2) fold change of three biological replicates. Right: Localization of the identified proteins in context to the data distribution of IL-27-induced proteomic changes. Pathway-associated proteins are highlighted for IL-27 (blue) and HypIL-6 (red) as well as non-significant data distribution (gray). (c) Left: GSEA reactome pathway enrichment analysis ‘Cytokine signaling and immune system’ for proteins induced by IL-27. Middle: heatmap representation pathway-associated proteins comparing IL-27 with HypIL-6 stimulation. Data represents the mean (log2) fold change of three biological replicates. Right: Localization of the identified proteins in context to the data distribution of IL-27-induced proteomic changes. Pathway-associated proteins are highlighted for IL-27 (blue) and HypIL-6 (red) as well as non-significant data distribution (gray).
Figure 7 with 2 supplements
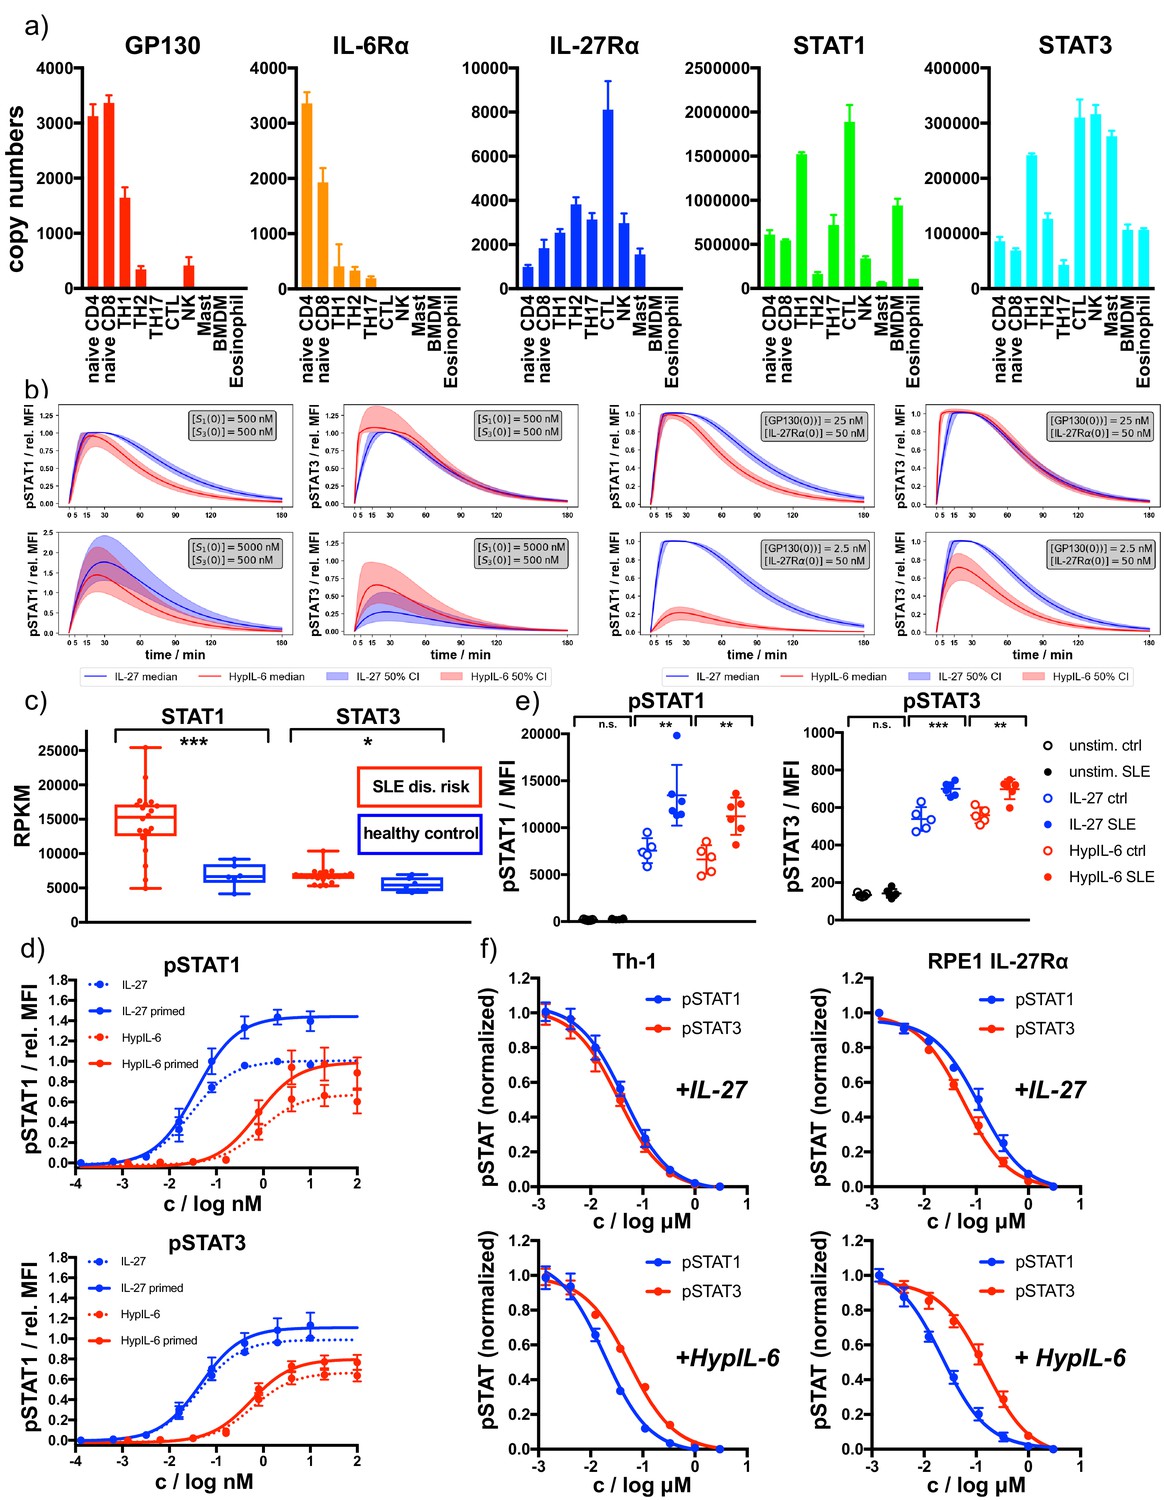
Receptor and STAT concentrations determine the nature of the cytokine response.
(a) Copy numbers of indicated proteins determined for different T-cell subsets using mass-spectrometry-based proteomics (ImmPRes - http://immpres.co.uk). (b) Model predictions for varying levels of STAT1 and STAT3 (left panel) or IL-27Rα and GP130 (right panel) for phosphorylation kinetics of STAT1 and STAT3. (c) Gene expression profiles determined by RNAseq analysis comparing indicated genes of a cohort of SLE risk patients with a cohort of healthy controls. Data obtained from: Proc Natl Acad Sci U S A 115, 12565–12572. Two-tailed Student’s T-test: *p<0.05, **p≤0.01,***p≤0.001; n.s., not significant. (d) Dose-dependent phosphorylation of STAT1 and STAT3 as a response to IL-27 and HypIL-6 stimulation in naive and IFNα2-primed (2 nM, 24 hr) Th-1 cells, normalized to maximal IL-27 stimulation (ctrl). Data was obtained from four biological replicates with each two technical replicates, showing mean ±std dev. (e) Phosphorylation of STAT1 (left) and STAT3 (right) as a response to IL-27 (2 nM, 15 min) and HypIL-6 (10 nM, 15 min) stimulation in healthy control (ctrl) and SLE patient CD4 +T cells. Data was obtained from five healthy control donors (Diveu et al., 2009) and six SLE patients. Two-tailed Student’s T-test: *p<0.05, **p≤0.01,***p≤0.001; n.s., not significant. (f) Tofacitinib titration to inhibit STAT1 and STAT3 phosphorylation by IL-27 (top, 2 nM, 15 min) HypIL-6 (bottom, 10 nM, 15 min) in Th-1 cells (left) and RPE1 IL-27Rα cells (right). Data was obtained from three donors with each two technical replicates (Th-1) and two biological experiments (RPE1 IL-27Rα cells) with each two technical replicates, showing mean ±std dev.
Figure 7—figure supplement 1
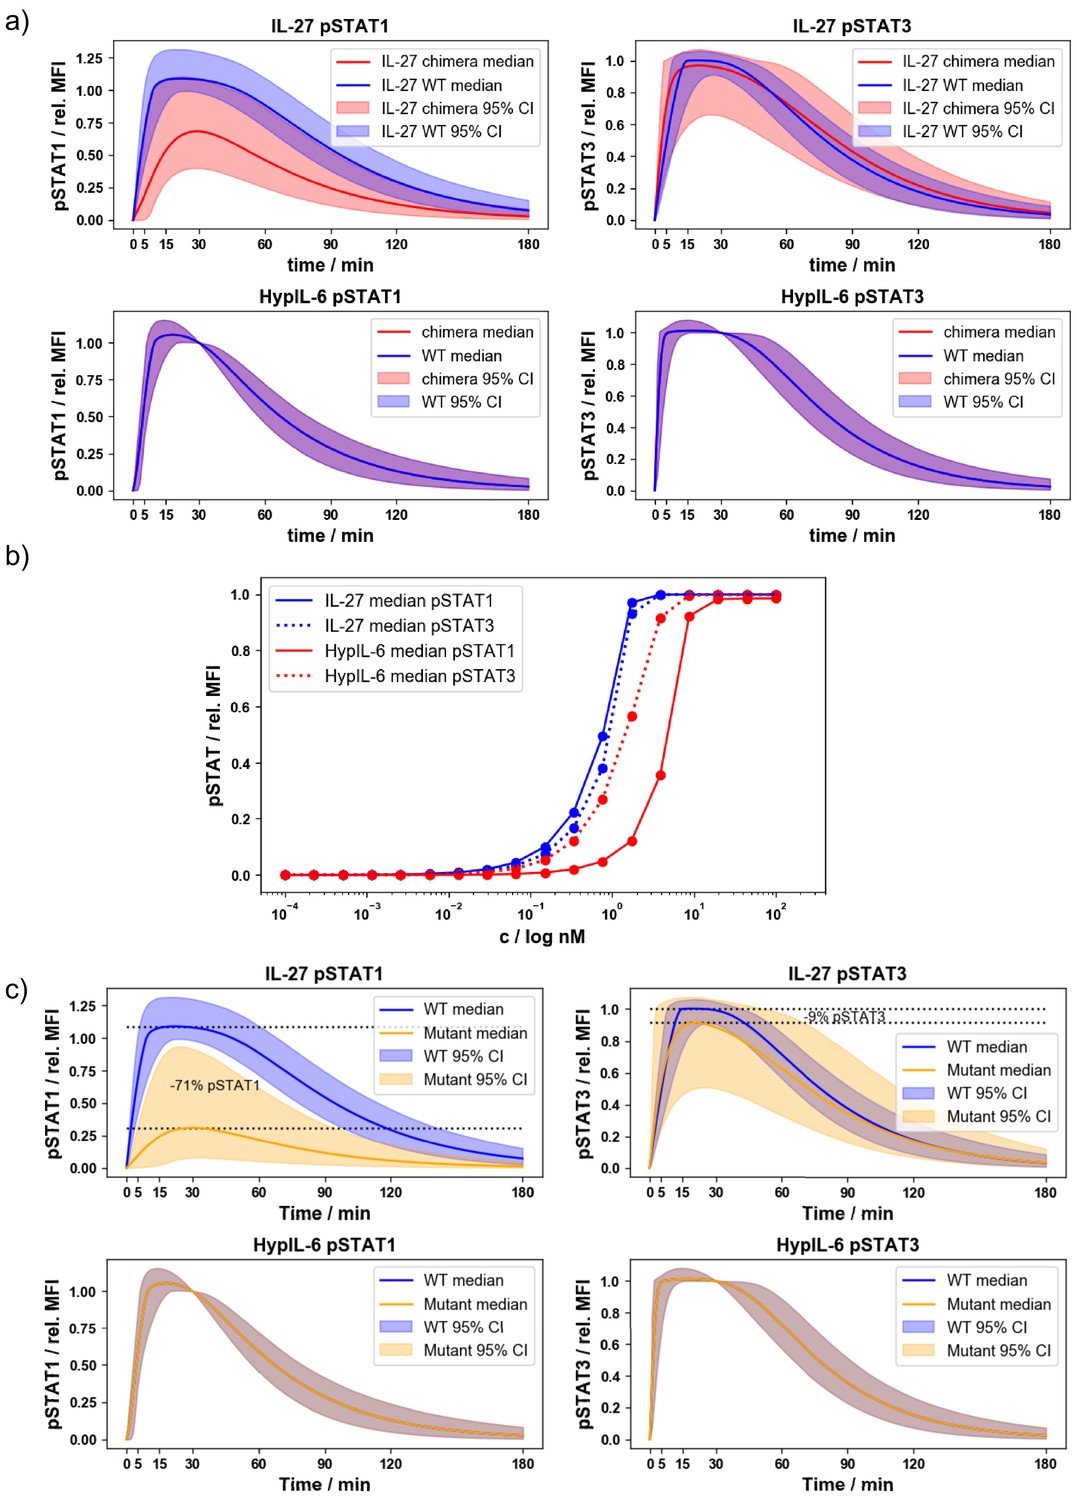
Validation of mathematical models for signaling kinetics of IL-27Rα receptor chimera and Y613F mutant.
(a) Pointwise median and 95% credible intervals of the WT and chimera mathematical models, using the posterior distributions for the parameters from the ABC-SMC. (b) Dose response curve in RPE1 using the posterior distributions from the ABC-SMC and varying the concentrations of HypIL-6 and IL-27 in the model. (c) Pointwise median and 95% credible intervals of the WT mathematical model and simulations of a mutant model (RPE1 IL-27Rα-Y613F)with nM−1 s−1 and s−1, using the posterior distributions for the parameters from the ABC-SMC for the other parameters.
Figure 7—figure supplement 2
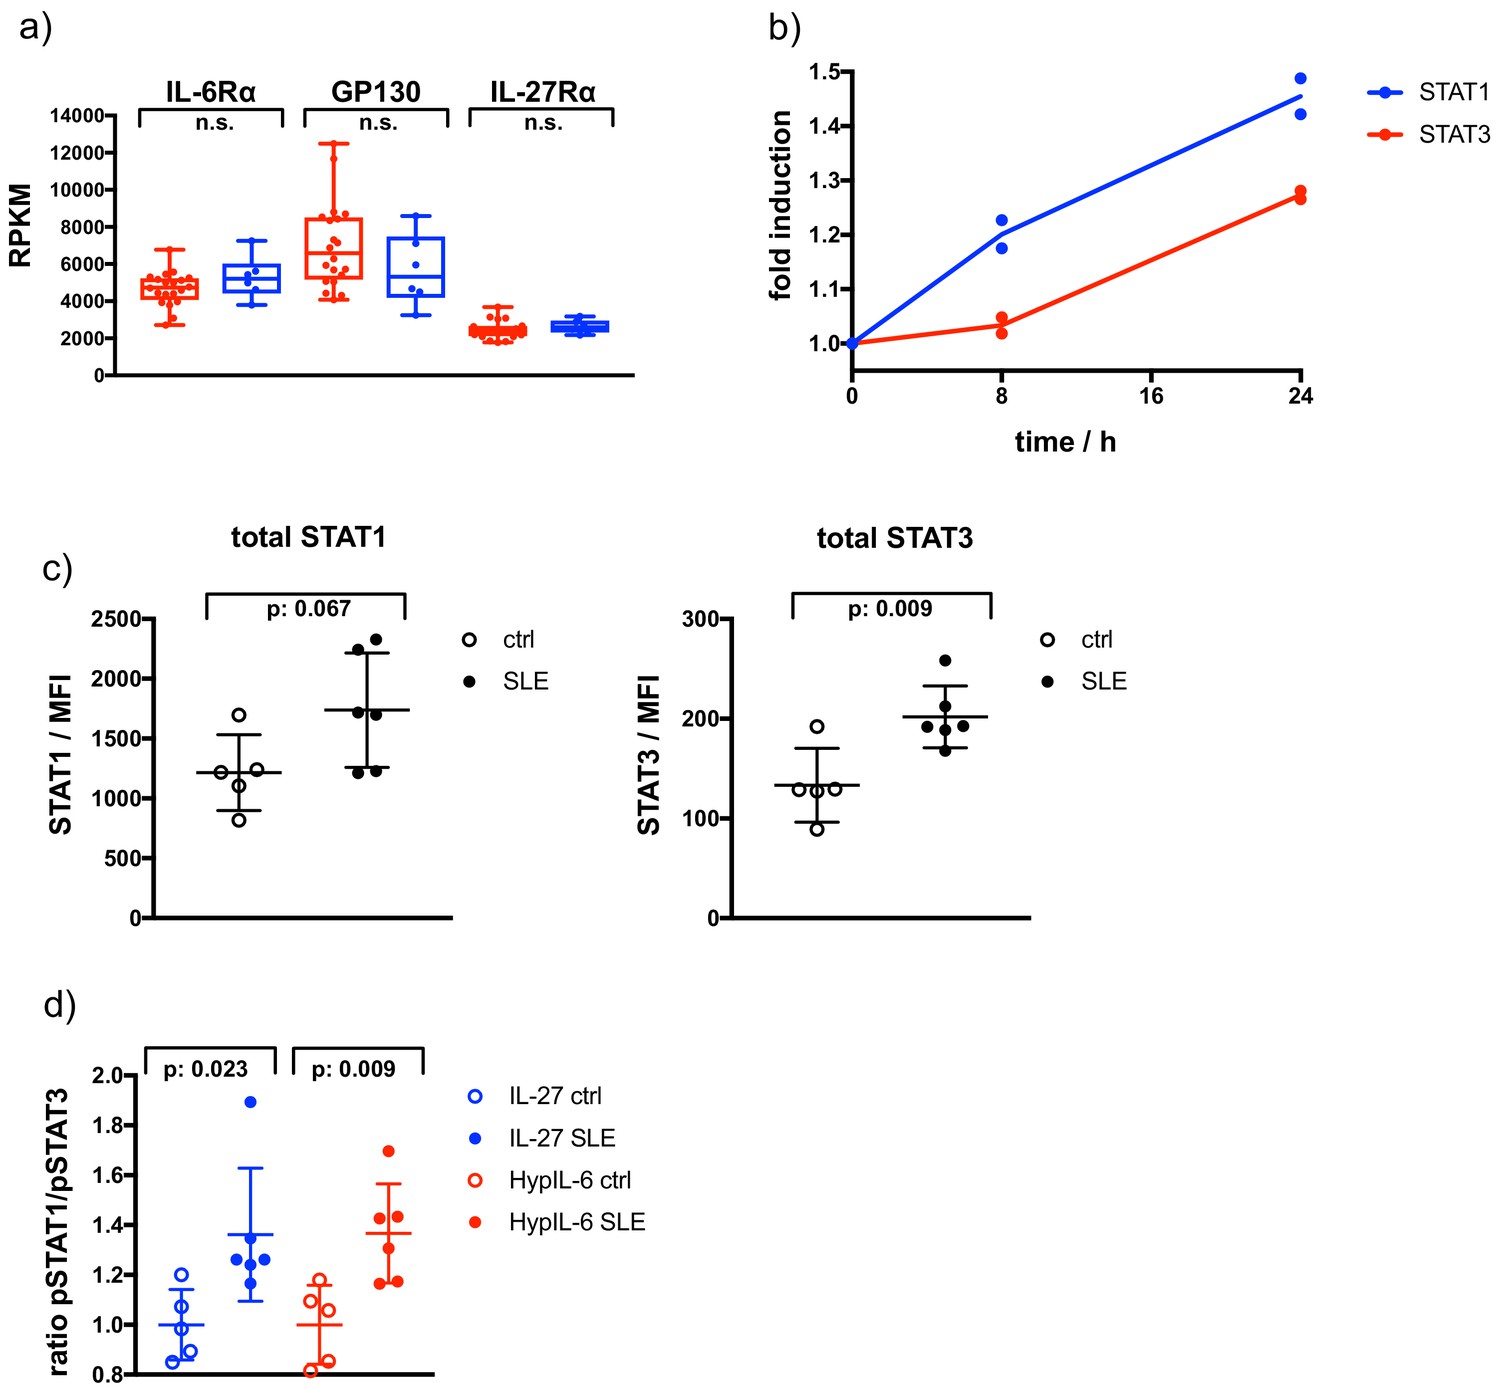
Altered total STAT levels and biased pSTAT1/pSTAT3 response in SLE.
(a) Gene expression profiles determined by RNAseq analysis comparing indicated genes of a cohort of SLE risk patients with a cohort of healthy controls. Data obtained from: Proc Natl Acad Sci U S A 115, 12565–12572. Two-tailed Student’s T-test: *p<0.05, **p≤0.01,***p≤0.001; n.s., not significant. (b) Fold induction of total STAT1 and STAT3 levels in Th-1 measured by flow cytometry. Data was obtained from two biological replicates (shown). (c) Total levels of STAT1 and STAT3 measured in CD4 +by flow cytometry for healthy control (ctrl) and Lupus patients (SLE). Data was obtained from five (ctrl) and six (SLE) biological replicates. Two-tailed Student’s T-test: p-values as indicated. (d) Ratio of pSTAT1 and pSTAT3 after IL-27 (15 min, 2 nM) or HypIL-6 (15 min, 10 nM) stimulation measured in CD4 +by flow cytometry for healthy control (ctrl) and Lupus patients (SLE). Data was obtained from five (ctrl) and six (SLE) biological replicates normalized to mean ratio of healthy control samples. Two-tailed Student’s T-test: p-values as indicated.
Videos
Video 1
Single-molecule co-tracking as a readout for dimerization of cytokine receptors.
Cell surface labeling of mXFPe-IL-27Rα by eNBRHO11 (left, top) and mXFPm-GP130 by mNBDY649 (left, bottom) after stimulation with IL-27 (20 nM). In the overlay of the zoomed section of both spectral channels (mXFPe-IL-27RαRHO11: Red, mXFPm-GP130DY649: Blue), yellow lines indicate co-locomotion of IL-27Rα and GP130 (≥10 steps). Acquisition frame rate: 30 Hz, Playback: real time.
Video 2
Dynamics of IL-27-induced receptor assembly.
Formation of a single-molecule heterodimer of mXFPe-IL-27RαRHO11 (Red) and mXFPm-GP130DY649 (Blue) in presence of IL-27. Yellow lines indicate co-locomotion of IL-27Rα and GP130 (≥10 steps). Acquisition frame rate: 30 Hz, Playback: real time with break at time of receptor dimerization.
Video 3
Ligand-induced heterodimerization of IL-27Rα and GP130.
Overlay of the two spectral channels (mXFPe-IL-27RαRHO11: Red, mXFPm-GP130DY649: Blue) in absence (left) or presence (right) of IL-27 (20 nM). Yellow lines indicate co-locomotion of IL-27Rα and GP130 (≥10 steps). Acquisition frame rate: 30 Hz, Playback: real time.
Video 4
Ligand-induced homodimerization of GP130.
Overlay of the two spectral channels (mXFPm-GP130RHO11: Red, mXFPm-GP130DY649: Blue) in absence (left) or presence (right) of HypIL-6 (20 nM). Yellow lines indicate co-locomotion of IL-27Rα and GP130 (≥10 steps). Acquisition frame rate: 30 Hz, Playback: real time.
Tables
Table 1
Summary statistics of the posterior distributions for the STAT/receptor binding and dissociation rates.
| Parameter | Mean | Median |
|---|---|---|
Table 2
Parameter mathematical notation, description, and units, where so that STAT corresponds to STAT1 or STAT3.
| Parameter | Description | Unit |
|---|---|---|
| Rate of receptor-ligand binding | nM−1s−1 | |
| Rate of receptor-ligand dissociation | s−1 | |
| Rate of monomer-monomer binding (or dimer formation) | nM−1s−1 | |
| Rate of dimer dissociation | s−1 | |
| Rate of STATi binding to GP130 | nM−1s−1 | |
| Rate of STATi binding to IL-27Rα | nM−1s−1 | |
| Rate of STATi dissociating GP130 | s−1 | |
| Rate of STATi dissociating IL-27Rα | s−1 | |
| Rate of STATi phosphorylation on a dimer | s−1 | |
| Rate of pSTATi dephosphorylation | s−1 | |
| Rate of receptor internalization/degradation under hypothesis 1 | s−1 | |
| Rate of receptor internalization/degradation under hypothesis 2 | nM−1s−1 | |
| Initial concentration of GP130 | nM | |
| Initial concentration of IL-27Rα | nM | |
| Initial concentration of STATi | nM |
Table 3
Prior distribution assigned to each parameter and initial molecular concentration.
*These distributions are centered around measurements obtained from cell surface receptor quantification experiments. **These distributions were derived based on values obtained from the literature (Wiederkehr-Adam et al., 2003). ***These distributions are based on values derived from experimental data in which the cells were treated with Tofacitinib. † These distributions were based on values derived from experimental data in which the cells were treated with cycloheximide. ‡These distributions were based on computations involving approximate cell sizes and average numbers of molecules per cell.
| Parameter | Prior distribution | Reference |
|---|---|---|
| * | ||
| * | ||
| * | ||
| * | ||
| for j∈{6,27} | Kozer et al., 2013 | |
| for j∈{6,27} | Kozer et al., 2013 | |
| , for i∈{1,3} | ** | |
| , for i∈{1,3} | ** | |
| Assumed | ||
| for i∈{1,3} | *** | |
| for j∈{6,27} | † | |
| for j∈{6,27} | † | |
| ‡ | ||
| ‡ | ||
| Itzhak et al., 2016 | ||
| Itzhak et al., 2016 |
Additional files
-
Supplementary file 1
Ordinary differential equations for mathematical modeling of IL-27 and HypIL-6 signaling.
- https://cdn.elifesciences.org/articles/66014/elife-66014-supp1-v2.docx
-
Transparent reporting form
- https://cdn.elifesciences.org/articles/66014/elife-66014-transrepform-v2.docx
Download links
A two-part list of links to download the article, or parts of the article, in various formats.
Downloads (link to download the article as PDF)
Open citations (links to open the citations from this article in various online reference manager services)
Cite this article (links to download the citations from this article in formats compatible with various reference manager tools)
Competitive binding of STATs to receptor phospho-Tyr motifs accounts for altered cytokine responses
eLife 10:e66014.
https://doi.org/10.7554/eLife.66014


