Inhibiting USP16 rescues stem cell aging and memory in an Alzheimer’s model
- Institute of Stem Cell Biology and Regenerative Medicine, Stanford University School of Medicine, United States
- Department of Biology, Stanford University, United States
- Department of Bioengineering, Stanford University, United States
- Sue and Bill Gross Stem Cell Research Center, University of California, Irvine, United States
Figures
Figure 1
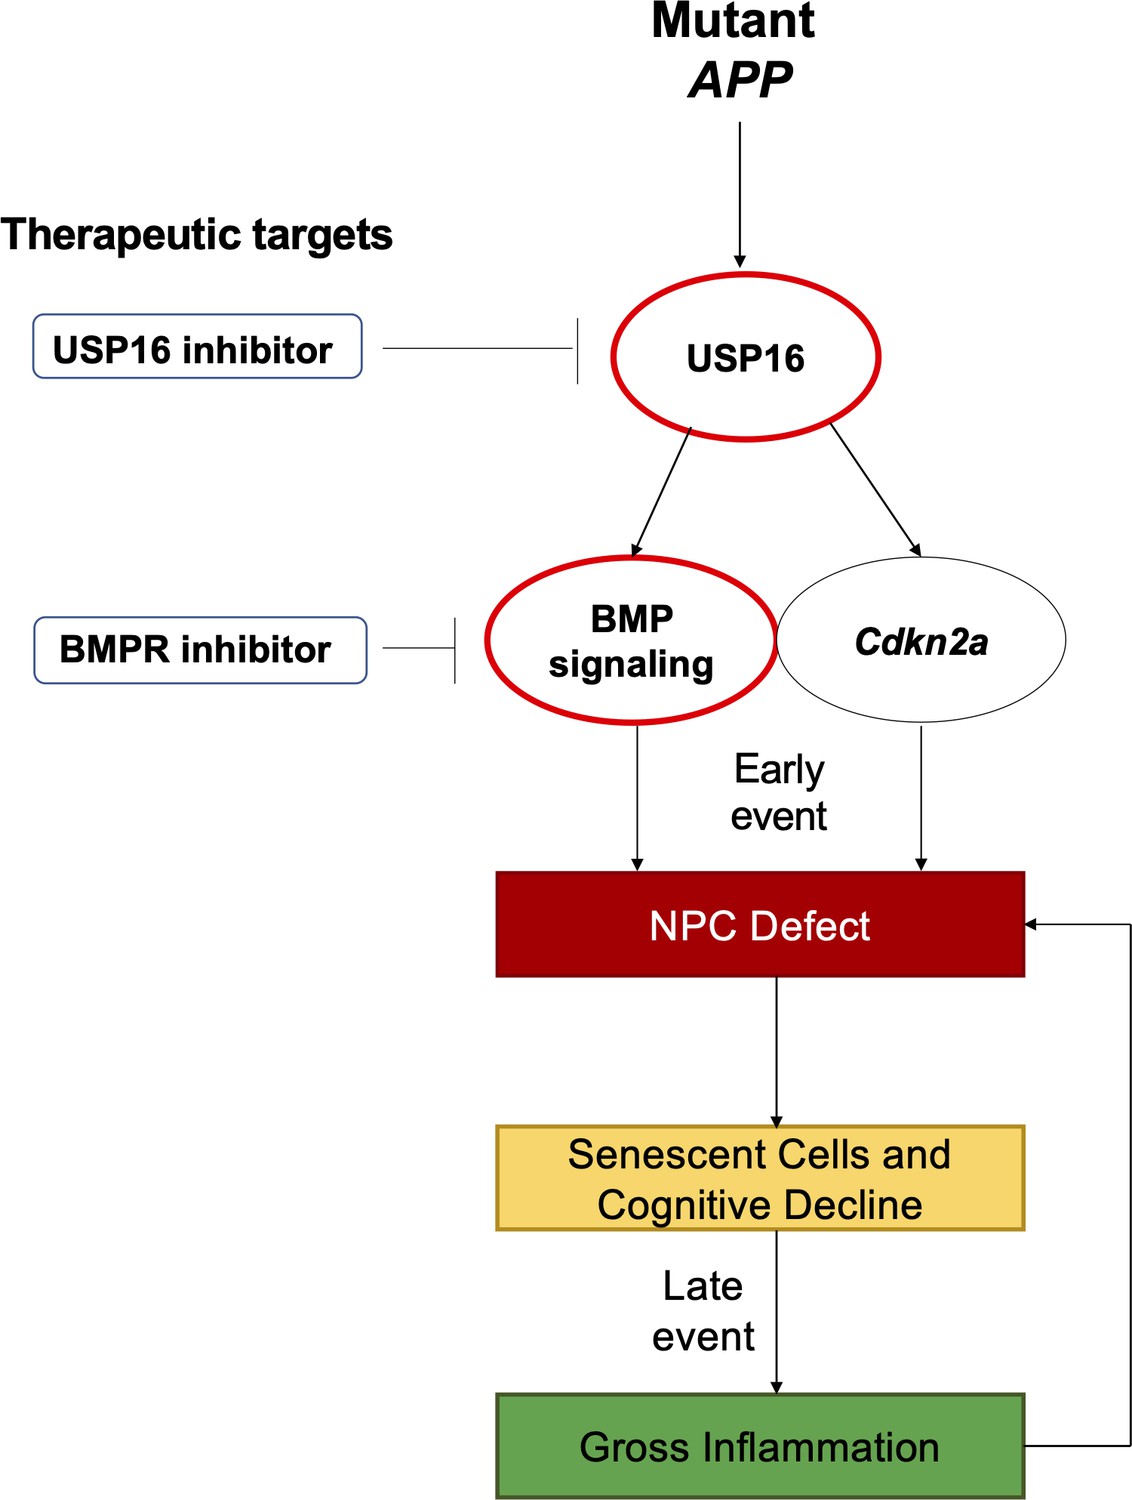
Schematic summarizing therapeutic approaches to mitigate the effects of mutant APP through targeting of Cdkn2a, BMI1, USP16 and BMP.
Aberrant USP16/Cdkn2a/BMP signaling results in an early neural precursor cell (NPC) defect in Alzheimer’s Disease. USP16 inhibitors and/or BMPR inhibitors can be combined with current therapeutics targeting beta amyloid plaques to rescue this earlier defect that predates senescence, cognitive decline, and resulting gross inflammation.
Figure 2 with 1 supplement
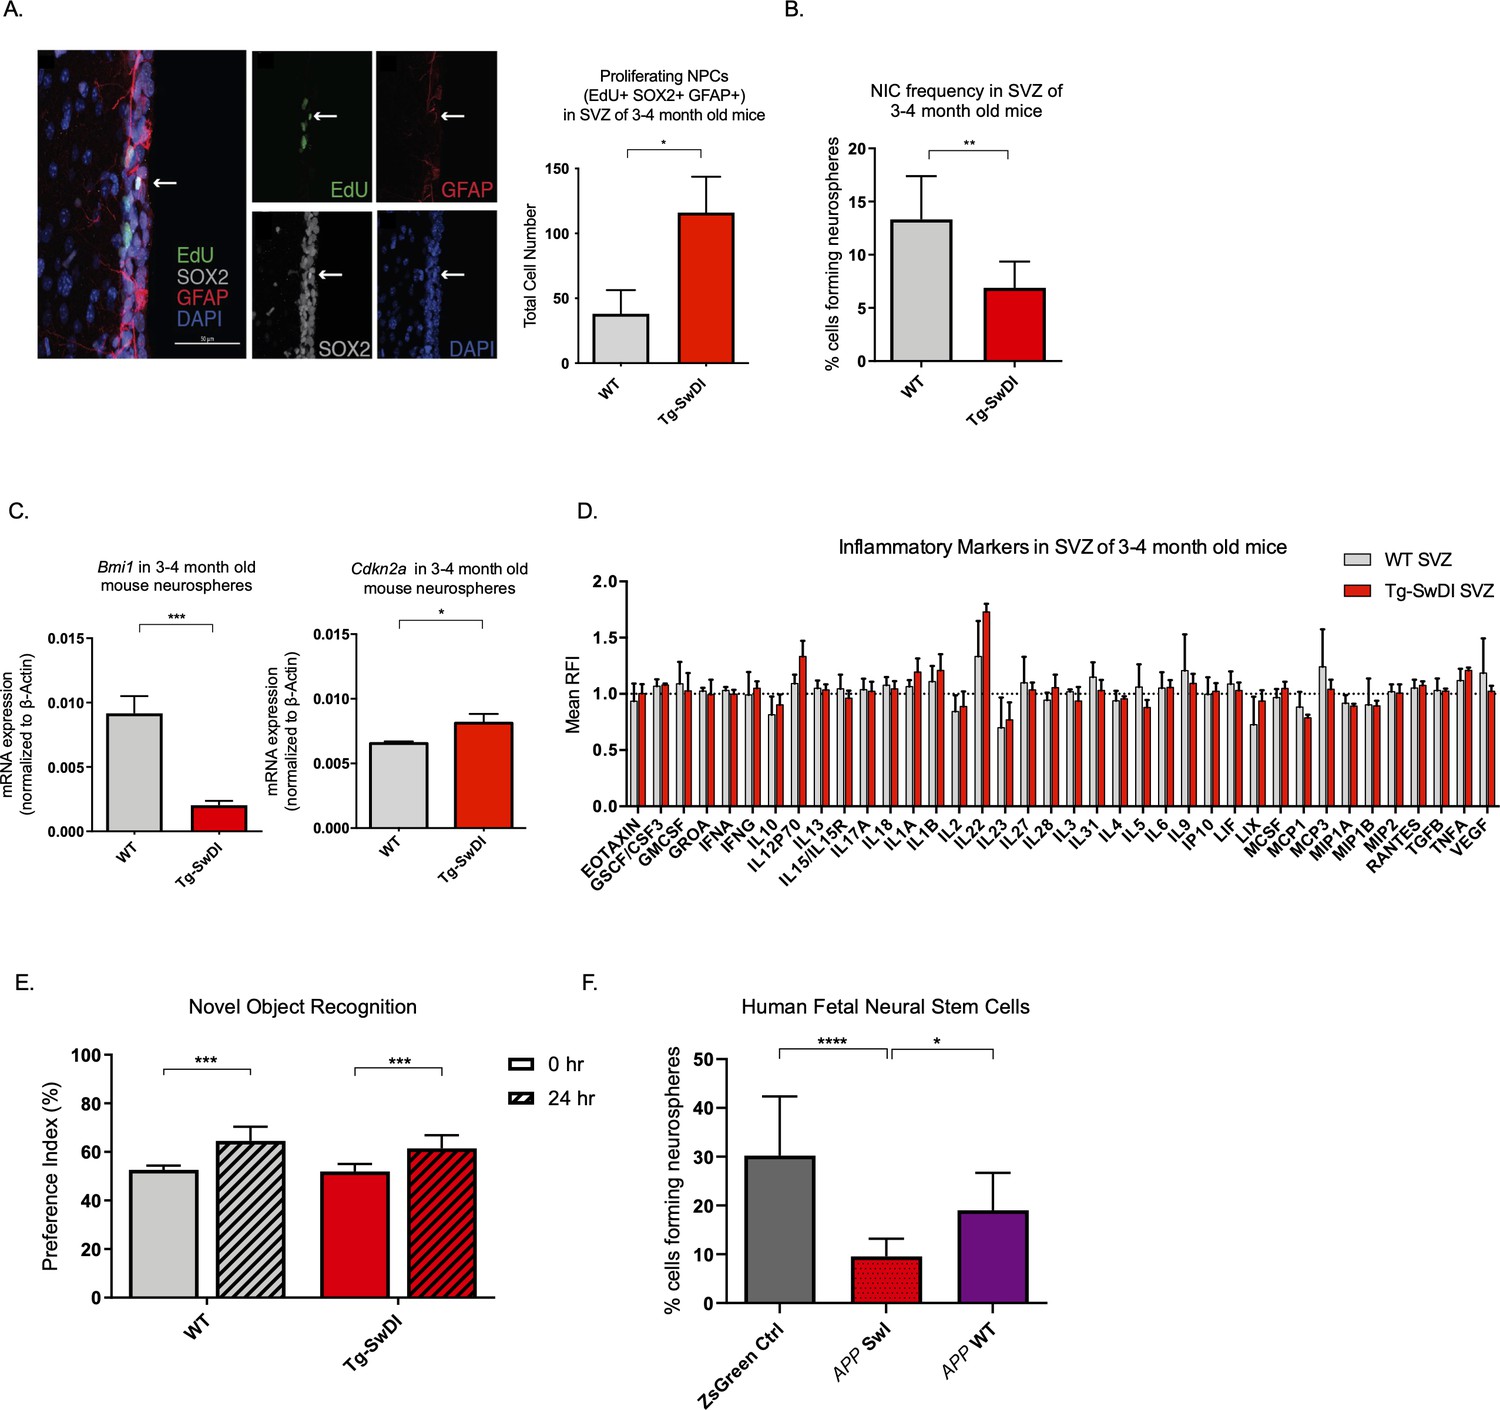
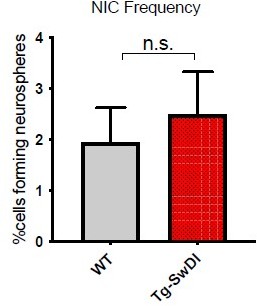
Defects in neurosphere initiating capacity (NIC) and hyperproliferation in Tg-SwDI mice predate cognitive deficits and widespread inflammation.
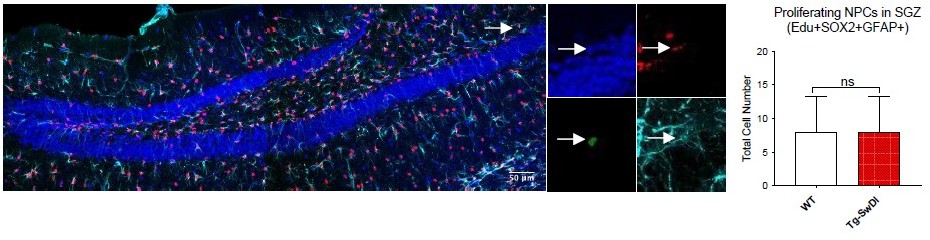
(A) Representative 40× confocal images of the subventricular zone (SVZ) stains for EdU, GFAP, and SOX2 (left). Three to four-month-old mice underwent intraperitoneal injections every day for 6 days with EdU and the analysis was performed four weeks after. Count of proliferating neural precursor cells, as cells positive for EdU, GFAP, SOX2, and DAPI, is shown in the panel on the right (n = 3 mice). Data are presented as mean ± SEM. *p=0.0153 (B) Limiting dilution assays were performed using single cells derived from neurospheres from 3 to 4-month-old mice. The graph shows the percentage of neurosphere-initiating cells (NIC) ± upper and lower estimates converted to percentages from values calculated by extreme limiting dilution analysis (ELDA). **p=0.00166 Figure 2—source data 2 summarizes the lower, upper, and estimates of 1/NIC for the different genotypes calculated by ELDA. (C) Bmi1 and Cdkn2a expression levels measured by RT-qPCR in neurospheres derived from the SVZ of wild type (WT) or Tg-SwDI mice at third passage (mice aged 3 and 4 months). Data are presented as mean ± SD. ***p=0.0009 *p=0.0197 (D) Cytokine levels measured by Luminex array from the SVZ of young 3 and 4-month-old mice. No differences were observed at this age (n = 3 mice for each genotype). See also Figure 2—figure supplement 1A. Data are presented as mean ± standard deviation (SD). (E) Novel object recognition 24 hr testing in mice at 3 months of age showed no signs of cognitive impairment in the Tg-SwDI mice with a preference index comparable to that of WT indicating both genotypes had intact object discrimination (p=0.001 for WT and p=0.0099 for Tg-SwDI, n = 7–10 mice in each group). Data are presented as mean ± standard error of the mean (SEM). (F) ELDA graph of limiting dilution assay comparing human fetal neurospheres infected with pHIV-Zsgreen, APP SwI, or APP WT. Figure 2—source data 2 lists the estimated stem cell frequencies and ranges for each group, calculated using the ELDA software (n = 3 separate transductions and limiting dilution experiments) ****p=3.7e–6, *p=0.00507.
-
Figure 2—source data 1
NIC frequencies in 3-4 month old mice.
- https://cdn.elifesciences.org/articles/66037/elife-66037-fig2-data1-v2.xlsx
-
Figure 2—source data 2
NIC frequencies in fetal cells.
- https://cdn.elifesciences.org/articles/66037/elife-66037-fig2-data2-v2.xlsx
Figure 2—figure supplement 1
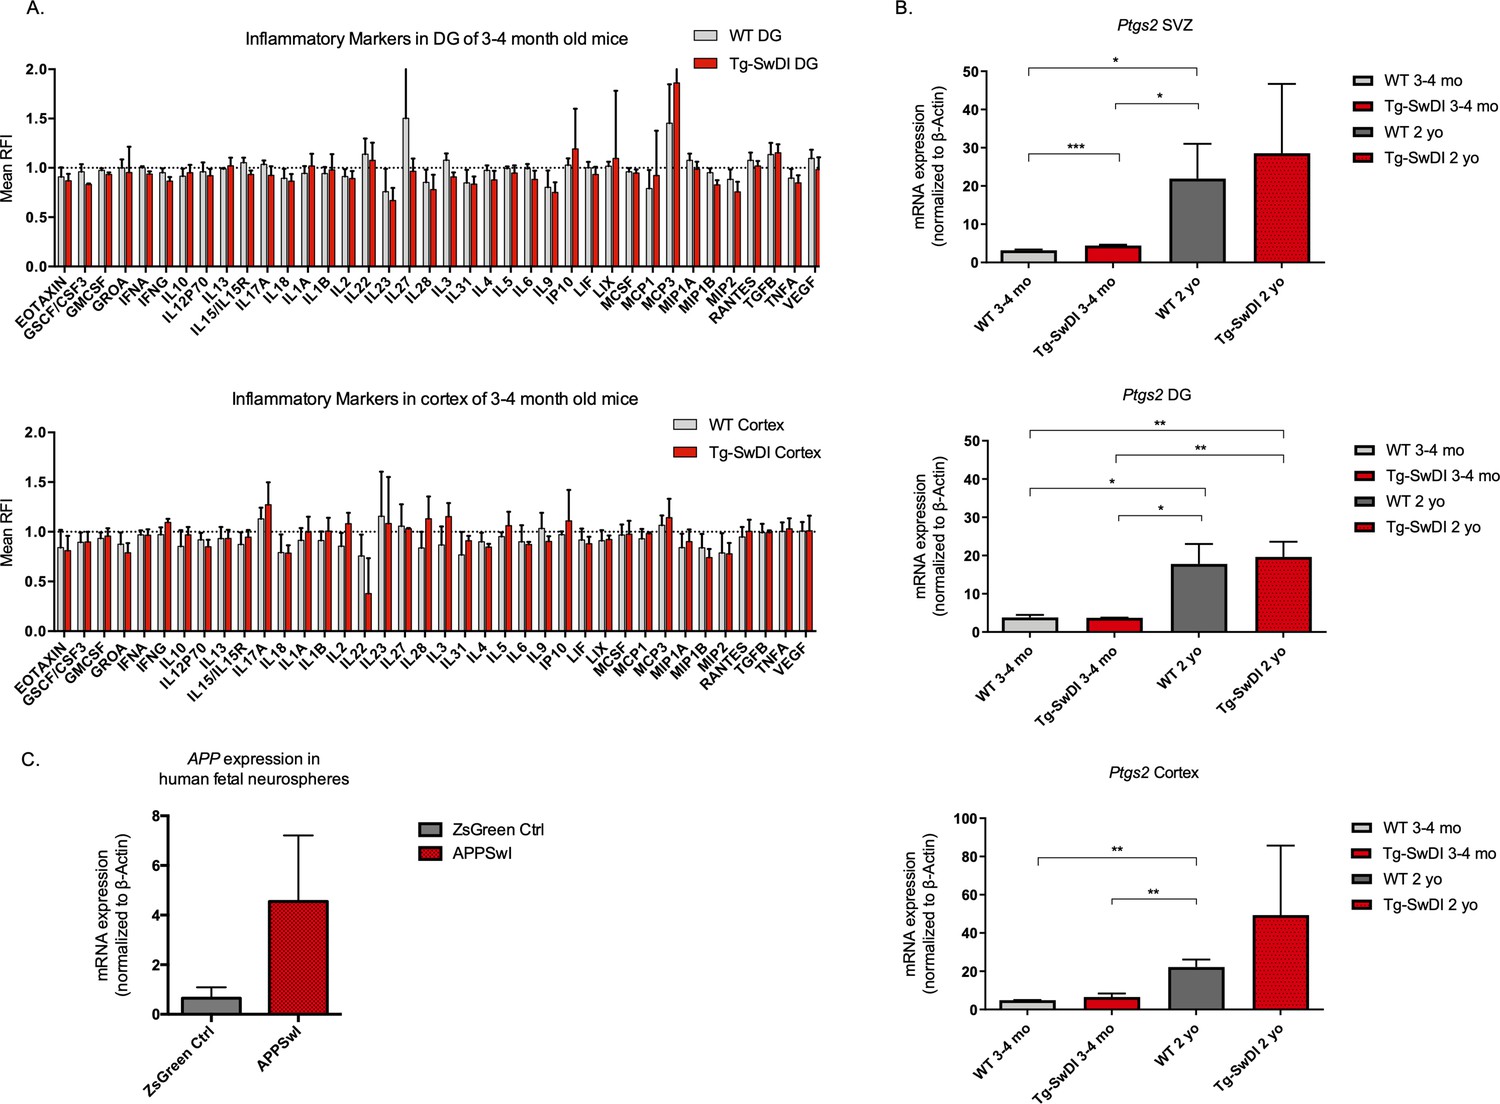
No significantly upregulated inflammatory markers in young Tg-SwDI mice with at least a 2-fold increase in transgenic mutant APP Swedish Dutch Iowa (SDI) expression.
(A) Cytokine levels measured by Luminex array from the dentate gyrus (DG) and the cortex of 3 and 4-month-old mice. No differences were observed at this age. N = 3 mice for each genotype. Data are presented as mean ± SD. (B) Ptgs2 (COX2) qPCR data from 3 and 4-month-old mice and 1-year-old mice subventricular zone, DG, and cortex. Tnf, Il6, and Il1b were also tested but were undetectable at both ages. *p<0.05, **p<0.005, ***p<0.005 (C) Three different transductions of human fetal neural precursor cells have resulted in at least a 2-fold increase in APP expression in mutant APP neurospheres compared to ZsGreen transduced.
Figure 3 with 5 supplements
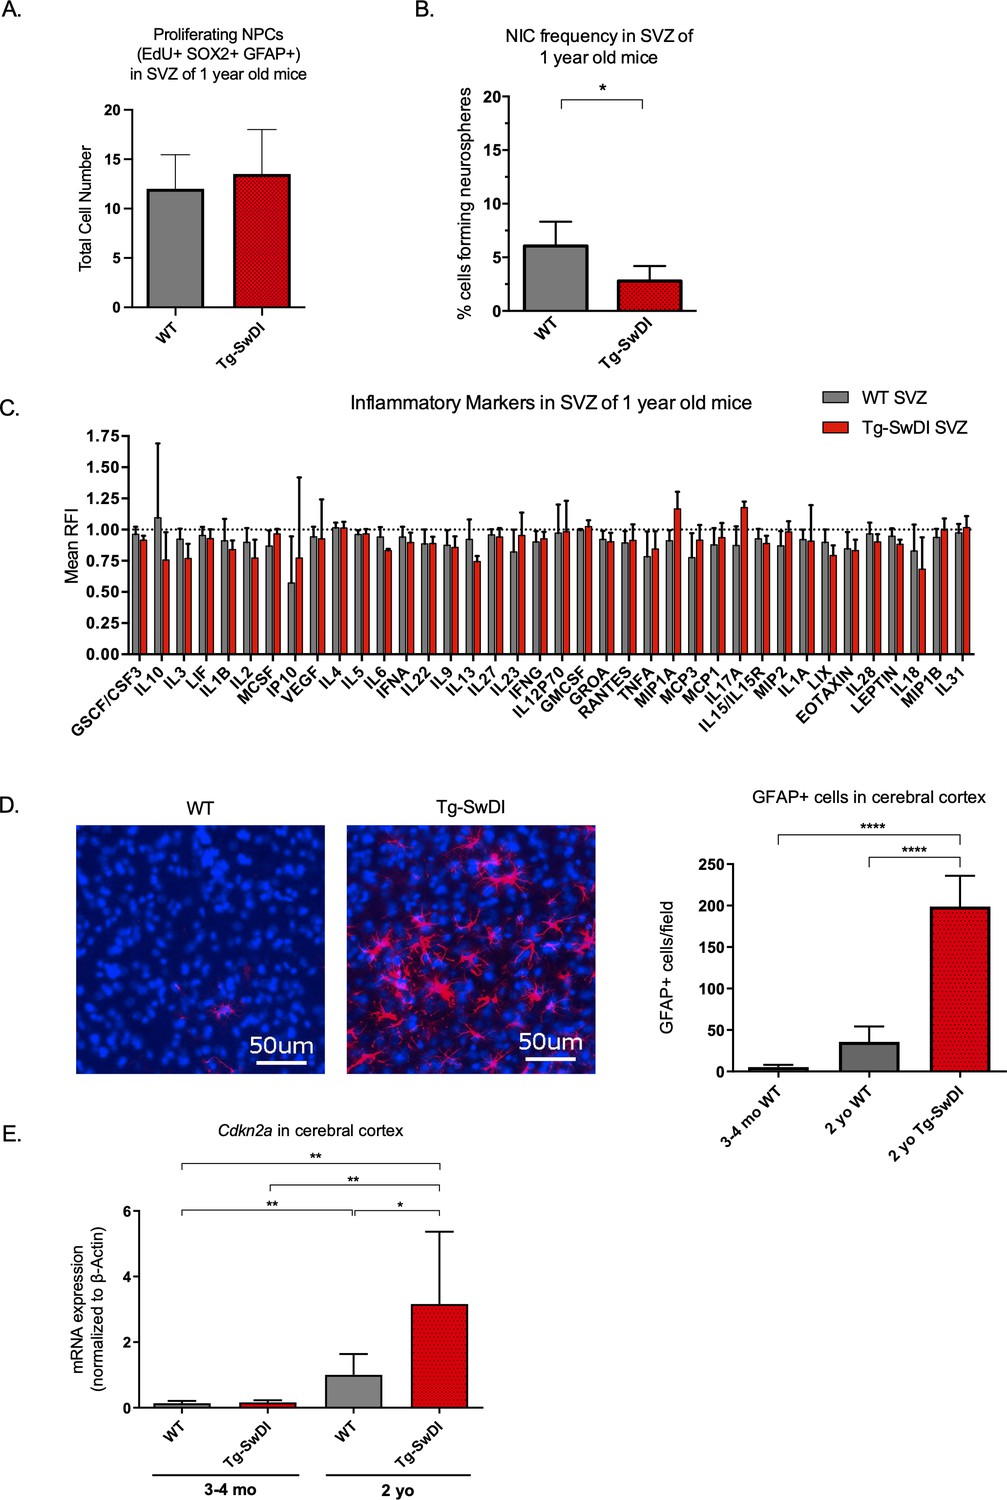
Accelerated aging phenotype seen in Tg-SwDI mice with exacerbated self-renewal and astrogliosis.
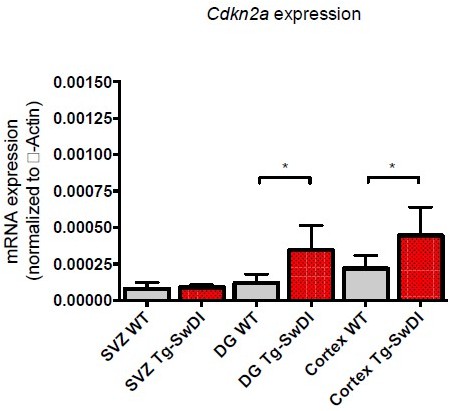
(A) One-year-old mice underwent intraperitoneal injections every day for 6 days with EdU and the analysis was performed four weeks afterward to capture all true activated daughter stem cells that would maintain the niche without further differentiation or migration. Data are presented as counts of proliferating neural precursor cell cells positive for EdU, GFAP, SOX2, and DAPI mean ± SEM (n = 3 mice). (B) Limiting dilution assays were performed using single cells derived from neurospheres from 1-year-old mice. The bar graph shows the percentage of neurosphere-initiating cells calculated by extreme limiting dilution analysis (ELDA). *p=0.00625. Figure 3—source data 1 summarizes the lower, upper, and estimates of 1/NIC for the different genotypes calculated by ELDA. (C) Cytokine levels measured by Luminex array from the subventricular zone of 1-year-old mice. No differences were observed at this age. (n = 3 mice each genotype). See also Figure 3—figure supplement 1. Data are presented as mean ± SD. (D) Anterior sections were obtained from 2-year-old mice, stained and counted for GFAP+ cells in the cortex. Four different images per section and three sections per mouse were counted (n = 4 mice each group). A one-way ANOVA showed significant differences between the groups (****p<0.0001). Data are presented as mean ± SEM. (E) mRNA levels of Cdkn2a in the cerebral cortex of 3 and 4-month-old and 2-year-old mice were measured by RT-qPCR. Ct values were normalized to Actb. (WT = wild type littermate; 3 and 4-month-old: WT = 7, Tg-SwD n = 7, 2-year-old: WT n = 6, Tg-SwDI n = 6). A one-way ANOVA showed significant differences between the groups (p=0.0044 between 3 and 4-month-old and 2-year-old WT, p=0.0040 between 3 and 4-month-old and 2-year-old Tg-SwDI, p = 0.0438 between 2-year-old WT and Tg-SwDI, p=0.00553 between 3 and 4-month-old WT and 2-year-old Tg-SwDI). Data are presented as mean ± SD.
-
Figure 3—source data 1
NIC Frequncies in 1 yo mice.
- https://cdn.elifesciences.org/articles/66037/elife-66037-fig3-data1-v2.xlsx
Figure 3—figure supplement 1
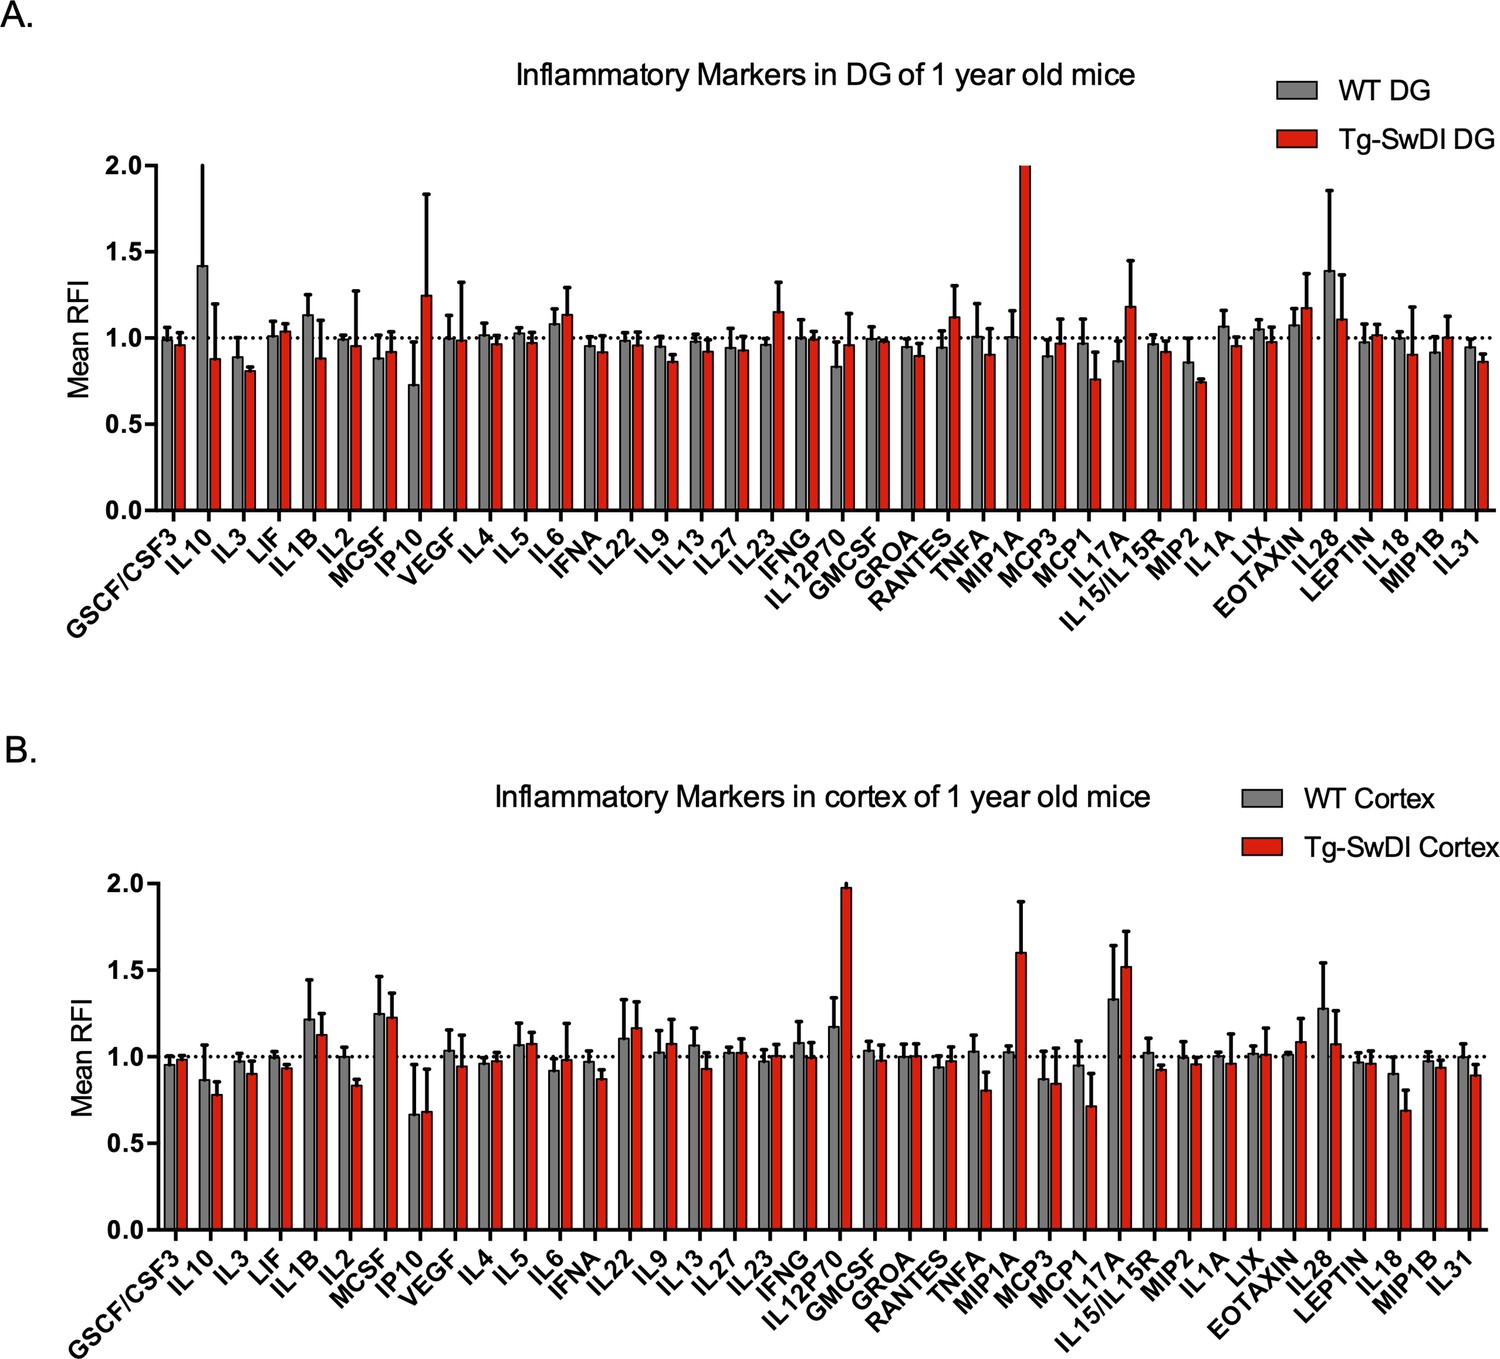
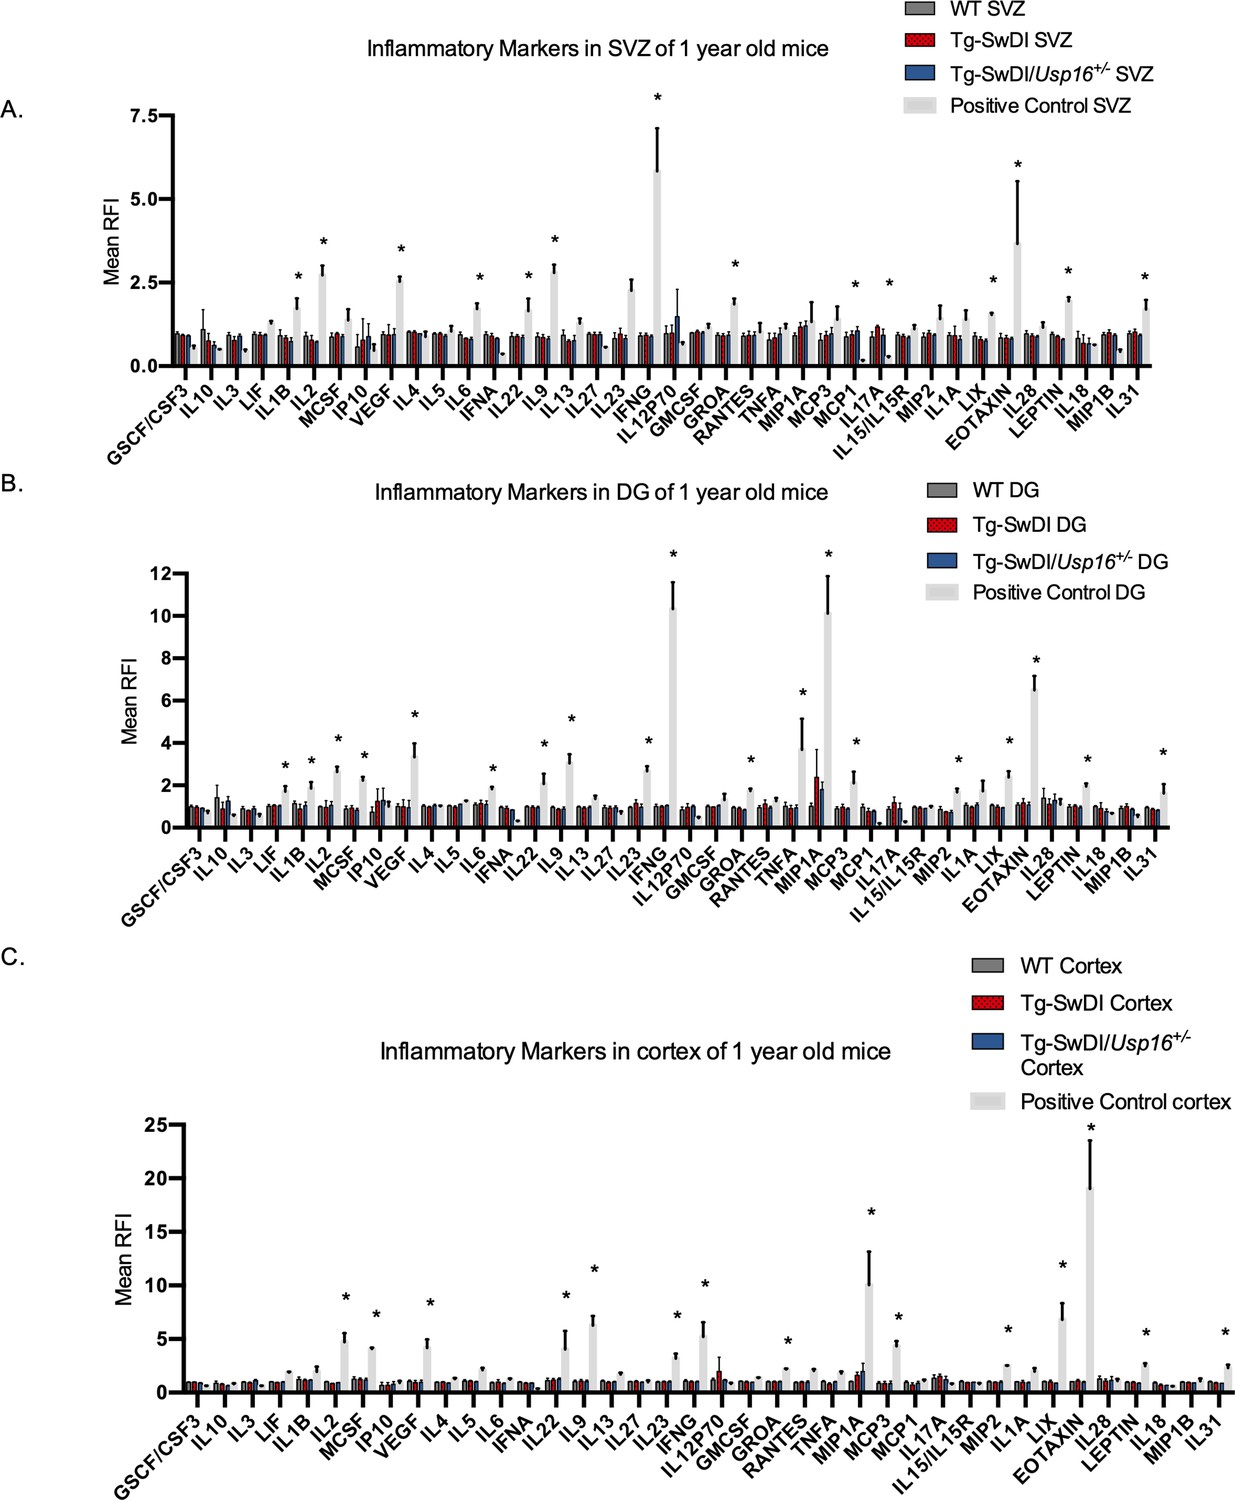
No significantly upregulated inflammatory markers in 1-year-old Tg-SwDI mice.
Cytokine levels measured by Luminex array from the dentate gyrus (A) and the cortex (B) of 1-year-old mice. No differences were observed at this age. N = 3 mice for each genotype. Data are presented as mean ± SD.
Figure 3—figure supplement 2
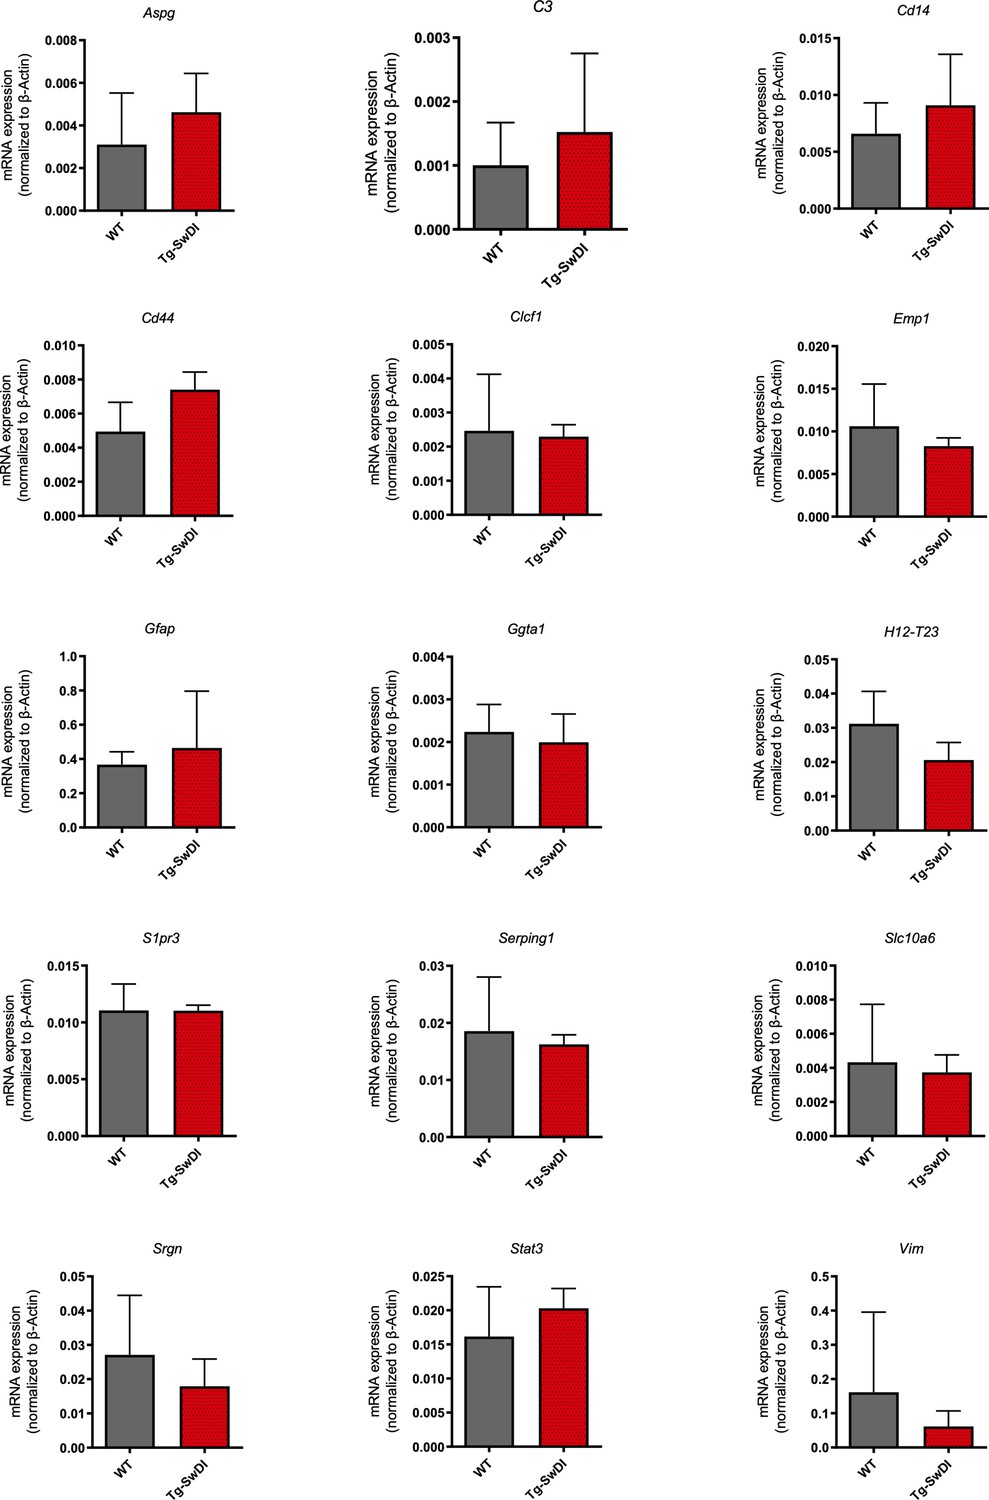
No significant increase in levels of A1 astrocyte markers at 1 year of age in Tg-SwDI mice.
mRNA levels of A1 astrocyte markers were measured in the cortex of 1-year-old mice (n = 3 mice per genotype). There were no significant increases in any of the markers for Tg-SwDI mice compared to wild type.
Figure 3—figure supplement 3

There is a general lineage increase in astrocytes derived from Tg-SwDI neural precursor cells.
Neurospheres derived from the subventricular zone of 1-year-old mice were dissociated into single cells, cultured in differentiation conditions and the percentage of GFAP positive cells were compared between Tg-SwDI mice and wild type controls, analysis on left and representative images on right. (n = 3 mice, *p=0.0194).
Figure 3—figure supplement 4
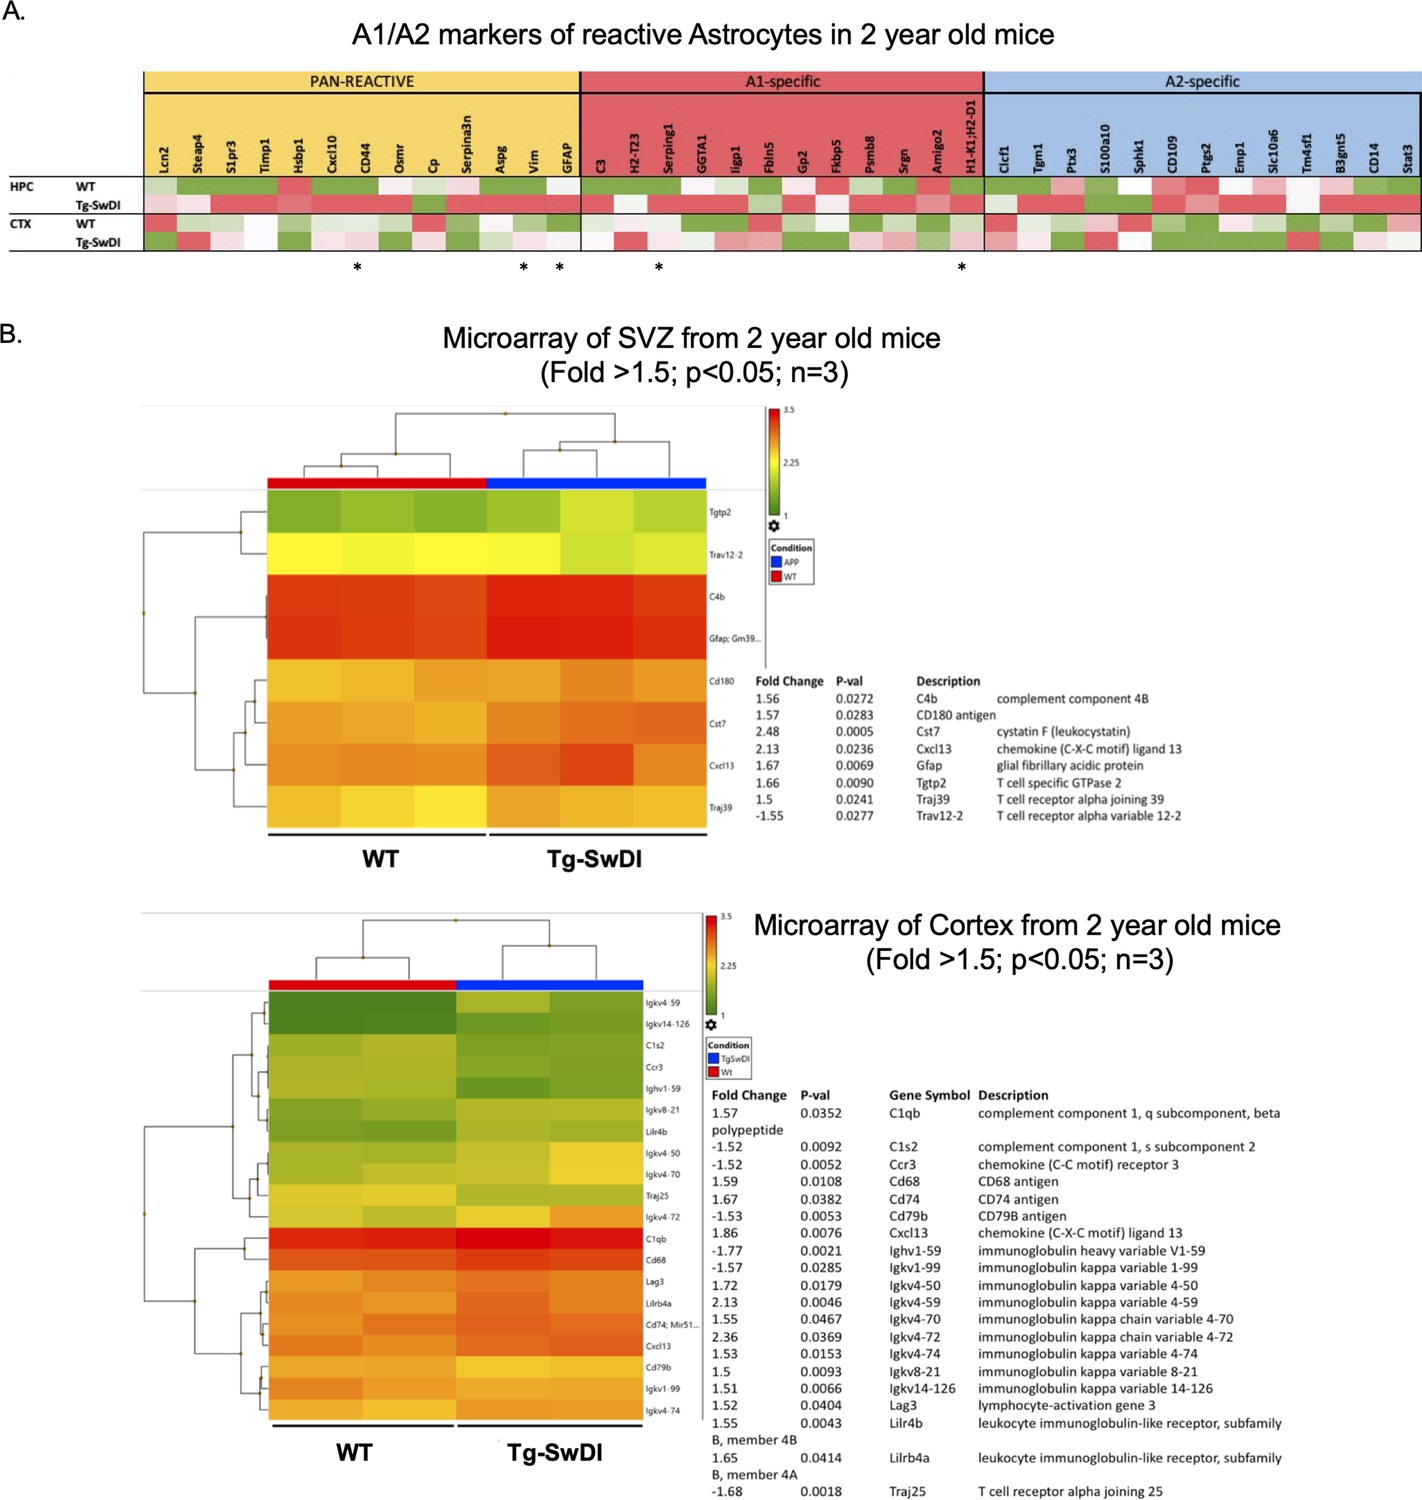
Upregulation of astrogliosis and a concomitant inflammatory signature is present in Tg-SwDI mice compared to wild type (WT) mice.
(A) Microarray data showing astrogliosis markers (Pan reactive versus A1 versus A2 phenotype) comparing WT and Tg-SwDI hippocampus (HPC, n = 3) and cortex (CTX, n = 2) (Reinitz et al., 2022). An increase in PAN- and A1-specific markers is noticeable in Tg-SwDI compared to WT. Stars represent p<0.05 when comparing gene expression in the two genotypes in CTX and HPC. (B) Microarray showing an increase in inflammatory markers of 2-year-old mice, subventricular zone (top) and cortex (bottom) (Reinitz et al., 2022).
Figure 3—figure supplement 5
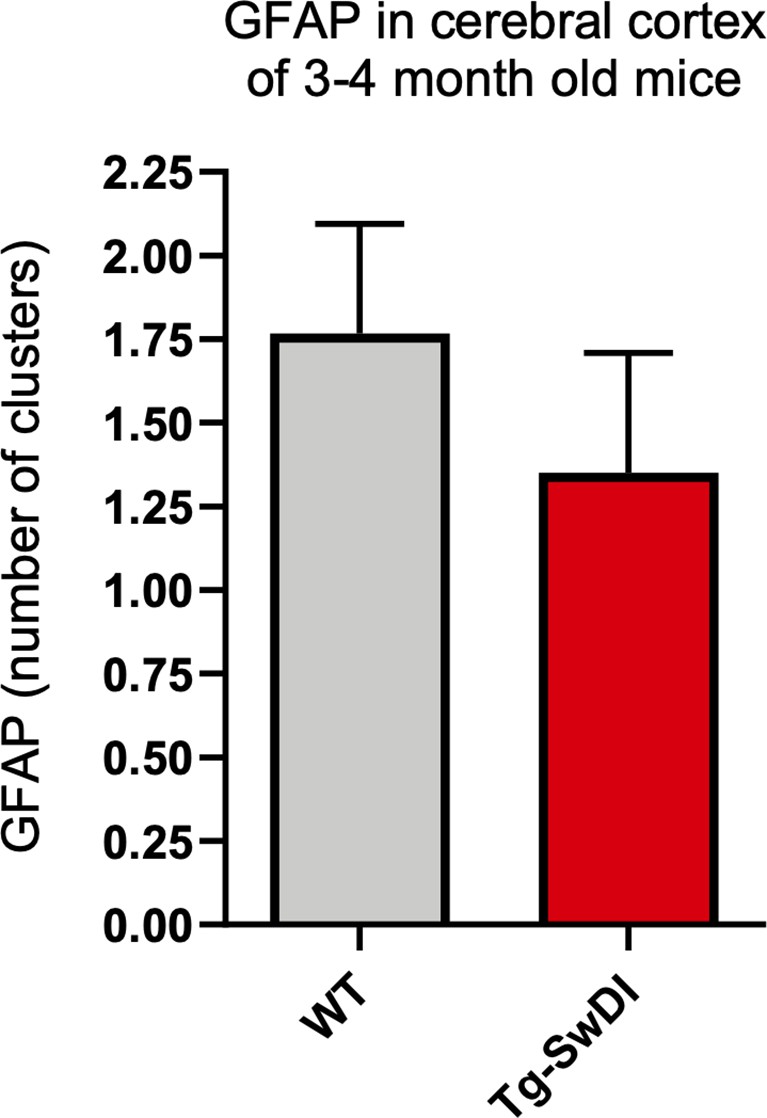
There is no upregulation of astrogliosis in 3 and 4-month-old Tg-SwDI mice over wild type (WT) mice.
Brain sections from 3 and 4-month-old WT and Tg-SwDI mice were stained for GFAP expression. ‘GFAP clusters’ are sparse regions of aggregated GFAP+ cells which comprise up to 25–30 GFAP+ cells. (WT n = 6 mice, Tg-SwDI n = 4 mice, 5 slides/mouse). As a possible indication of early inflammation, the number of clusters were counted, but we observed no differences among the genotypes.
Figure 4 with 1 supplement
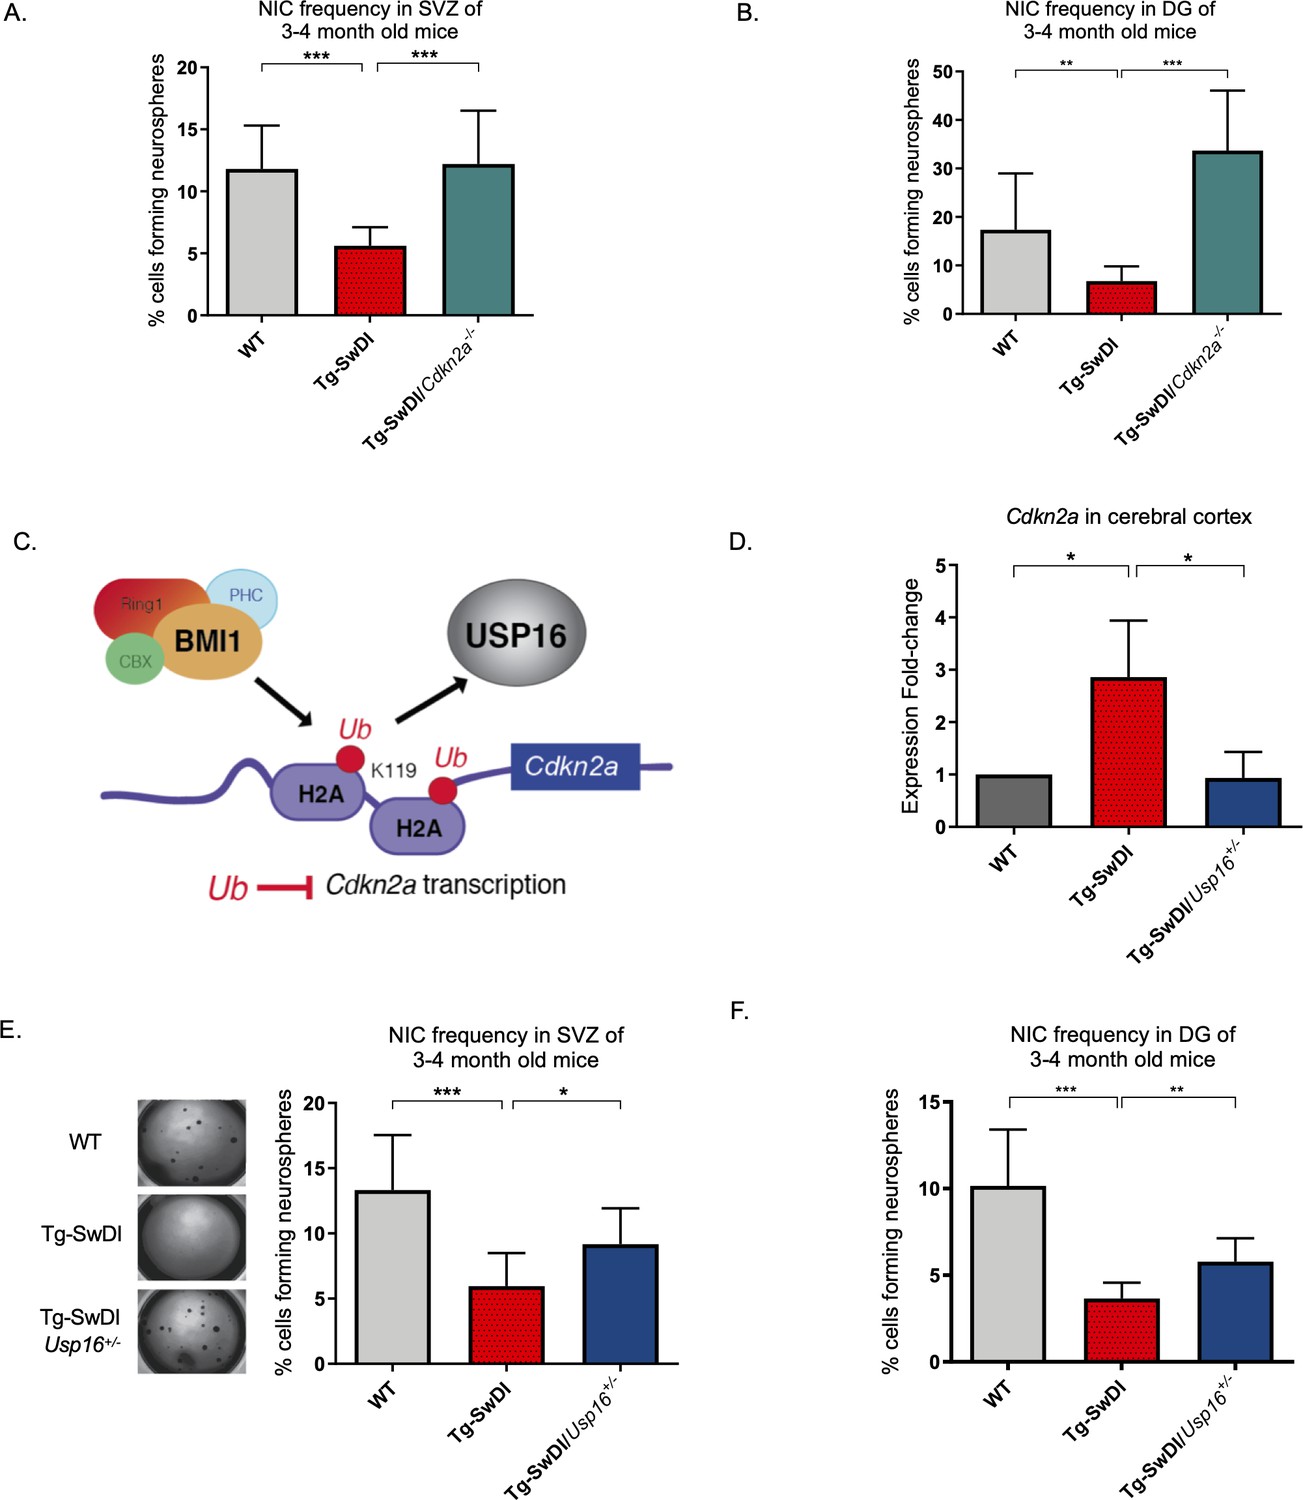
Usp16 haploinsufficiency normalizes Cdkn2a expression and restores self-renewal in Tg-SwDI NPCs.
(A) The bar graph shows the NIC frequencies in subventricular zone (p=5.5e–5 between wild type (WT) and Tg-SwDI and p=7.7e–5 between Tg-SwDI/Cdkn2a-/- and Tg-SwDI) and in the dentate gyrus (B) (p=0.00476 between wild type (WT) and Tg-SwDI and p=2.09e–9 between Tg-SwDI/Cdkn2a-/- and Tg-SwDI) as percentages of total cells with error bars indicating the upper and lower values. Mice were 3 months old when sacrificed; experiment done after third passage of neurospheres. , Figure 3—source data 1, Figure 4—source data 1 summarize the lower, upper, and estimates of 1/NIC for the different genotypes calculated by extreme limiting dilution analysis (ELDA). (C) Schematic summarizing the role of BMI1 in ubiquitinating histone H2A at different sites in the genome, including the Cdkn2a locus and the role of USP16 as its natural antagonist, suggesting that USP16 inhibition could influence neurosphere initiating capacity. (D) RT-qPCR of Cdkn2a in the cerebral cortex of 2-year-old Tg-SwDI mice shows mRNA levels were rescued by Usp16 haploinsufficiency (n = 3). Ct-values were normalized to Actb. A one-way ANOVA showed significant differences between the groups (p=0.0365 between WT and Tg-SwDI and p=0.0318 between Tg-SwDI and Tg-SwDI/Usp16+/-). Data are presented as mean ± SD. (E) Left panel shows 1× representative photographs of neurospheres grown in 96-well dish after two weeks of culture. The bar graph shows the NIC frequencies in subventricular zone as percentages of total cells comparing WT, Tg-SwDI, and Tg-SwDI/Usp16+/- mice. Mice were 3 months old. (n = 3 mice per genotype, p=0.000402 between WT and Tg-SwDI and p=0.0492 between Tg-SwDI/Usp16+/- and Tg-SwDI) (F) The bar graph shows the NIC frequencies in dentate gyrus as percentages of total cells comparing WT, Tg-SwDI, and Tg-SwDI/Usp16+/- mice. (n = 3 mice per genotype, p=9.9e–9 between WT and Tg-SwDI and p=0.00233 between Tg-SwDI/Usp16+/- and Tg-SwDI) Figure 4—source data 3 and Figure 4—source data 4 summarize the lower, upper, and estimates of 1/NIC for the different genotypes calculated by ELDA.
-
Figure 4—source data 1
NIC Frequencies Cdkn2a in SVZ.
- https://cdn.elifesciences.org/articles/66037/elife-66037-fig4-data1-v2.xlsx
-
Figure 4—source data 2
NIC Frequencies Cdkn2a in DG.
- https://cdn.elifesciences.org/articles/66037/elife-66037-fig4-data2-v2.xlsx
-
Figure 4—source data 3
NIC Frequencies Usp16 in SVZ.
- https://cdn.elifesciences.org/articles/66037/elife-66037-fig4-data3-v2.xlsx
-
Figure 4—source data 4
NIC Frequencies Usp16 in DG.
- https://cdn.elifesciences.org/articles/66037/elife-66037-fig4-data4-v2.xlsx
Figure 4—figure supplement 1
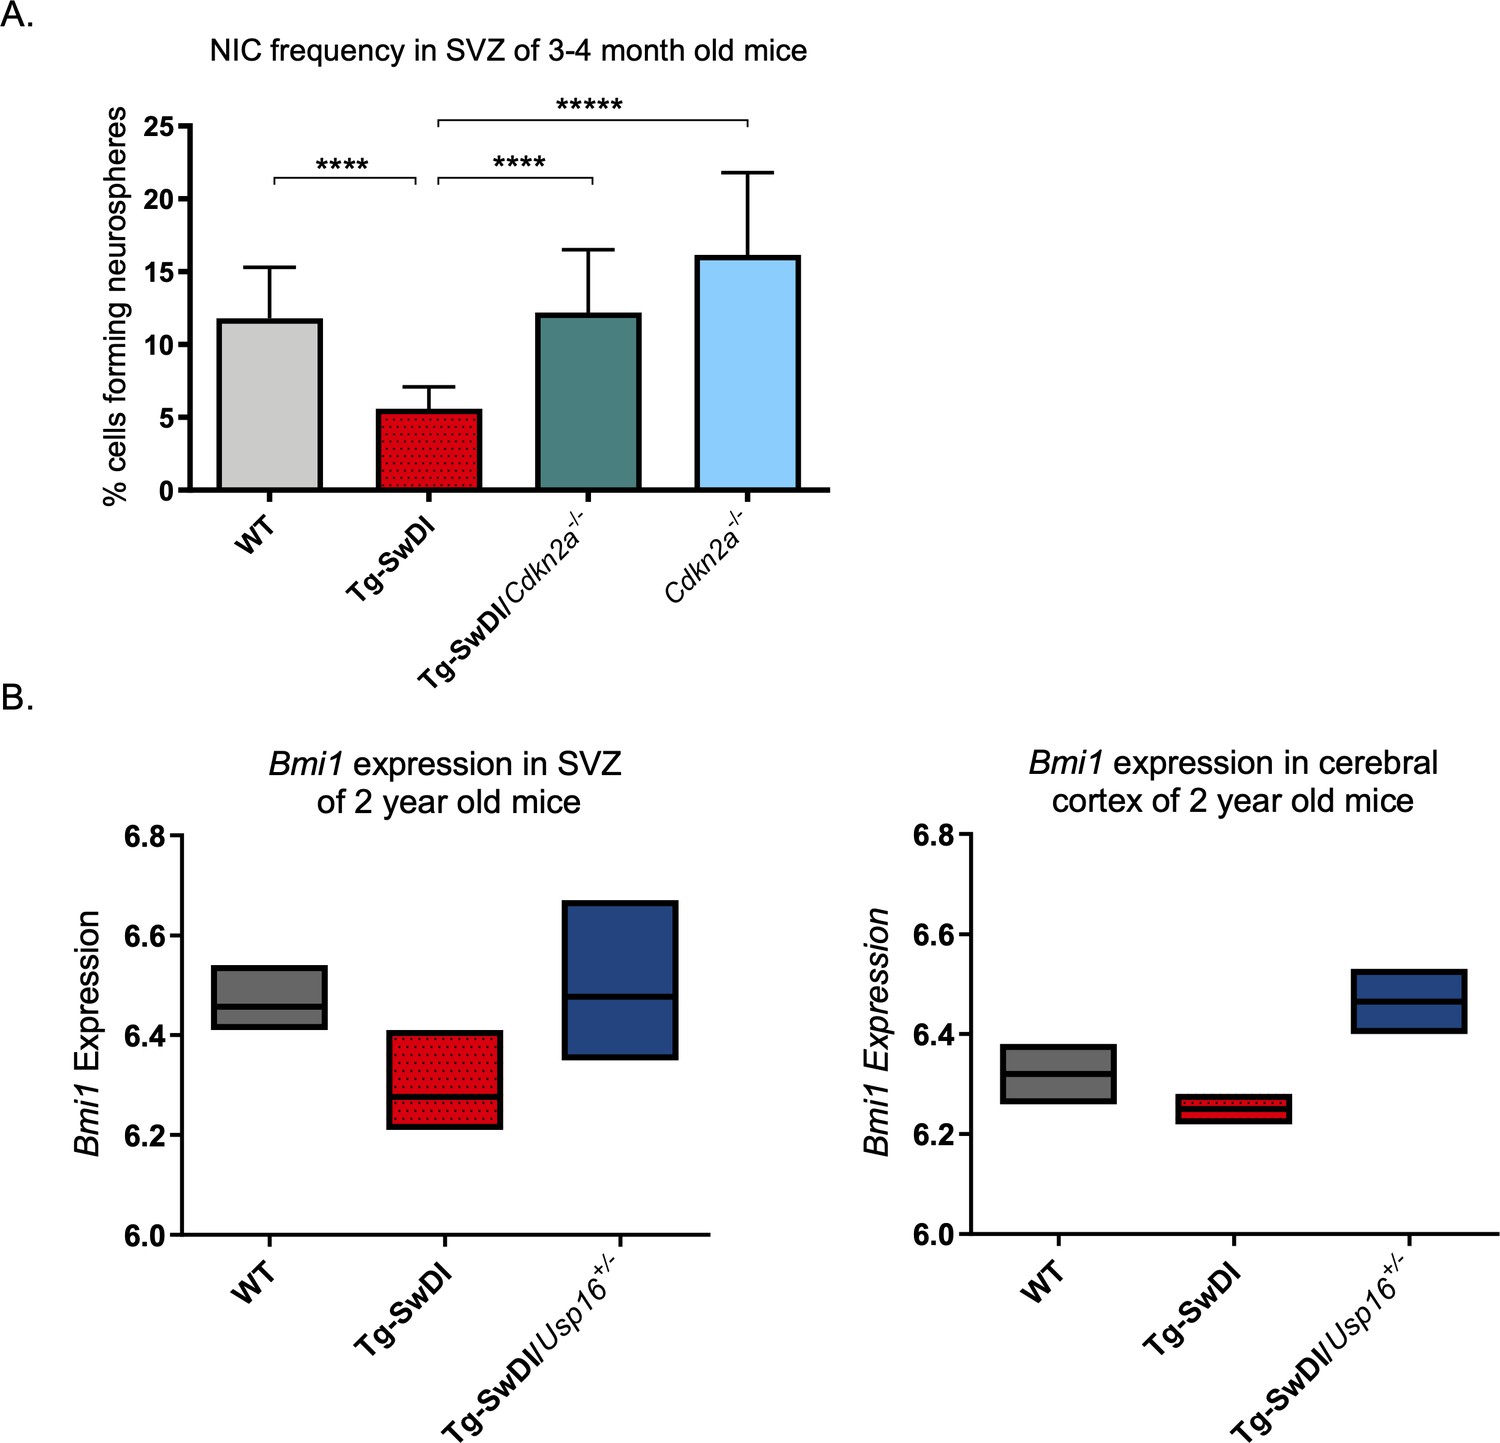
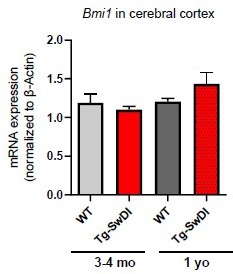
Cdkn2a loss increases NIC capacity while Usp16 haploinsufficiency rescues Bmi1 expression in Tg-SwDI mice.
(A) NIC capacity is increased as a result of Cdkn2a loss. P value between WT and Tg-SwDI is ****p=5.5e–05; p value between Tg-SwDI and Tg-SwDI/Cdkn2a-/- is ****p=7.7e–5; p value between Tg-SwDI and Cdkn2a-/- is *****p=1.06e–7. Figure 4—figure supplement 1—source data 1 summarizes the lower, upper, and estimates of 1/NIC for the different genotypes calculated by extreme limiting dilution analysis. (B) Microarray data of Bmi1 expression in the cortex of 2-year-old mice (Reinitz et al., 2022). Tg-SwDI mice showed reduced levels of Bmi1, which is rescued by Usp16 haploinsufficiency, in both the subventricular zone and the cortex. (n = 3 mice per genotype).
-
Figure 4—figure supplement 1—source data 1
NIC Frequencies Cdkn2a control.
- https://cdn.elifesciences.org/articles/66037/elife-66037-fig4-figsupp1-data1-v2.xlsx
Figure 5 with 6 supplements
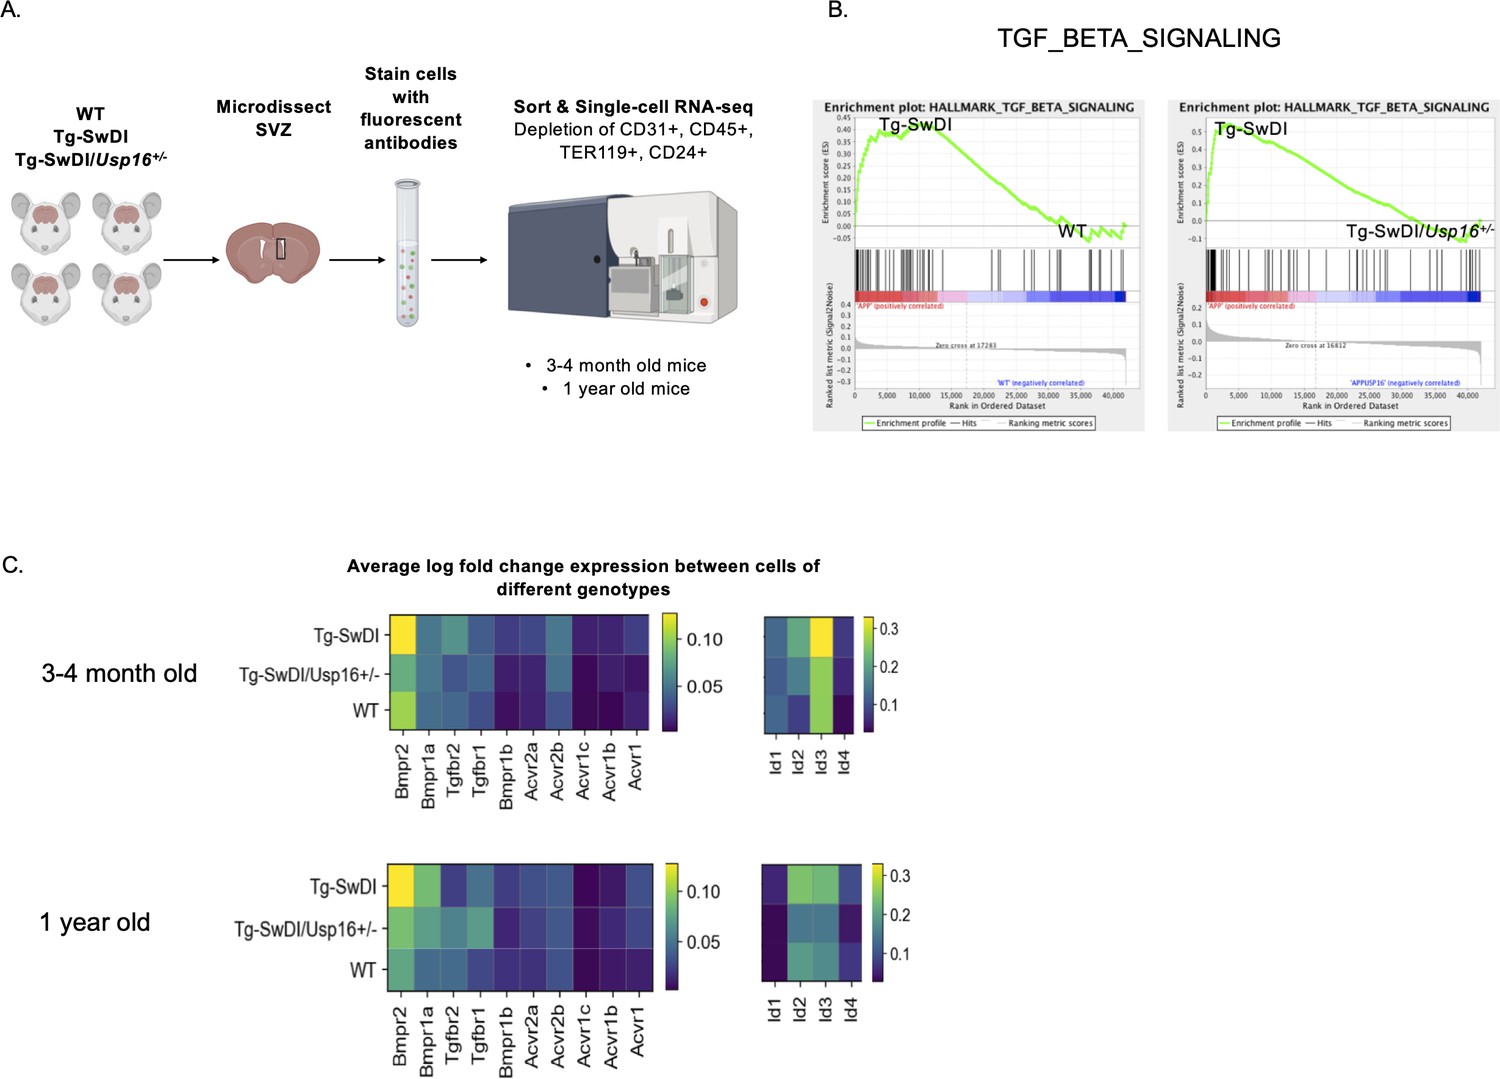
BMP signaling is enriched in Tg-SwDI mice and decreases with Usp16 haploinsufficiency.
(A) Lineage-CD24- NPCs were FACS-sorted from the subventricular zone of 4 mice each of the different genotypes and processed for single-cell RNA-sequencing. Figure 5—source data 1: GSEA analysis from single-cell RNA-seq data shows pathways enriched in Tg-SwDI mice compared to wild type (WT) and rescued in Tg-SwDI/Usp16+/- mice, ordered top to bottom from smallest FDR q-val (most significant) to largest FDR q-val (least significant). (n = 4 for each genotype at each time point; FDR < 25%). Pathways in common to both age groups are bolded. Figure 5—source data 2: Normalized enrichment scores of significantly enriched pathways in Tg-SwDI mice compared to WT or Tg-SwDI/Usp16+/- mice at different time points. TGFß pathway, Oxidative phosphorylation, and MYC Targets V2 were selected as they were rescued in both 3 and 4 months and 1-year-old mice by Usp16 haploinsufficiency. Highest normalized enrichment scores of each comparison are bolded. (B) Enrichment plots show TGF-ß signaling pathway as enriched in Tg-SwDI mice and rescued by Usp16 haploinsufficiency. Normalized enrichment score (NES) for left panel is 1.77 with FDR-q value = 0.008; NES for right panel is 2.30 with FDR q-value <0.001. (C) Heatmaps showing averaged log-normalized single-cell gene expression of elements of the TGF-ß pathway; elements of the BMP pathway, a sub-pathway of the TGF-ß pathway, are specifically enriched in Tg-SwDI mice.
-
Figure 5—source data 1
Pathways enriched in Tg-SwDI and rescued in Tg-SwDI/Usp16+/- mice.
- https://cdn.elifesciences.org/articles/66037/elife-66037-fig5-data1-v2.xlsx
-
Figure 5—source data 2
Normalized Enrichment Scores of Significantly Enriched Pathways.
- https://cdn.elifesciences.org/articles/66037/elife-66037-fig5-data2-v2.xlsx
Figure 5—figure supplement 1
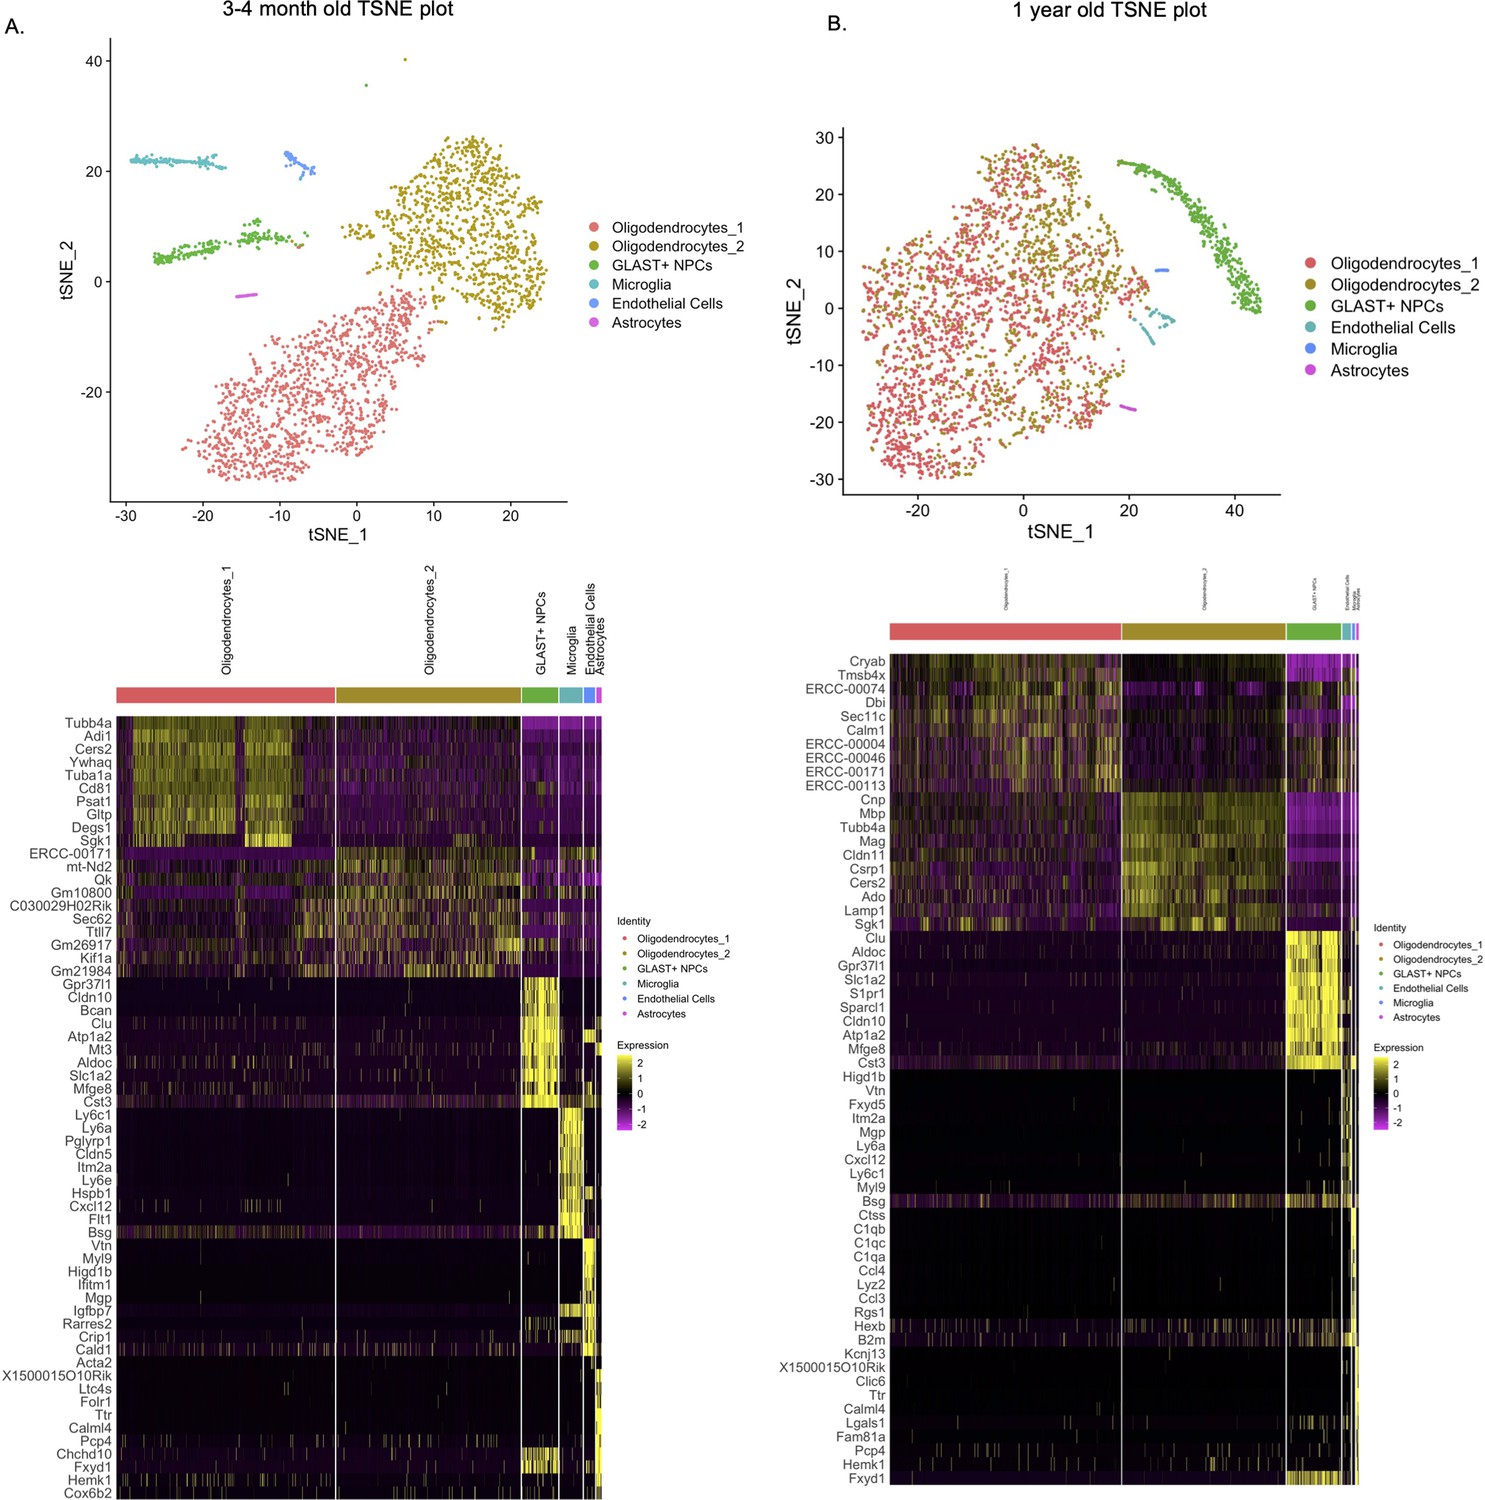
Comprehensive transcriptomic analysis of Lin-CD24- NPCs from subventricular zone (SVZ) of 3 and 4-month-old and 1-year-old mice show no new cellular subpopulations in Tg-SwDI or Tg-SwDI/Usp16+/- mice.
T-distributed stochastic neighbor embedding (TSNE) plot showing the various cellular subtypes in the Lineage depleted CD24- NPCs from the SVZ of 3 and 4-month-old mice (A) and 1-year-old mice (B). Cellular subtypes were identified based on top differentially expressed markers of each cluster and compared to markers from well-known sources including the mouse atlas project from the Biohub and Barres’ brain single-cell RNA-seq data (Tabula Muris Consortium et al., 2018; Zhang et al., 2014).
Figure 5—figure supplement 2
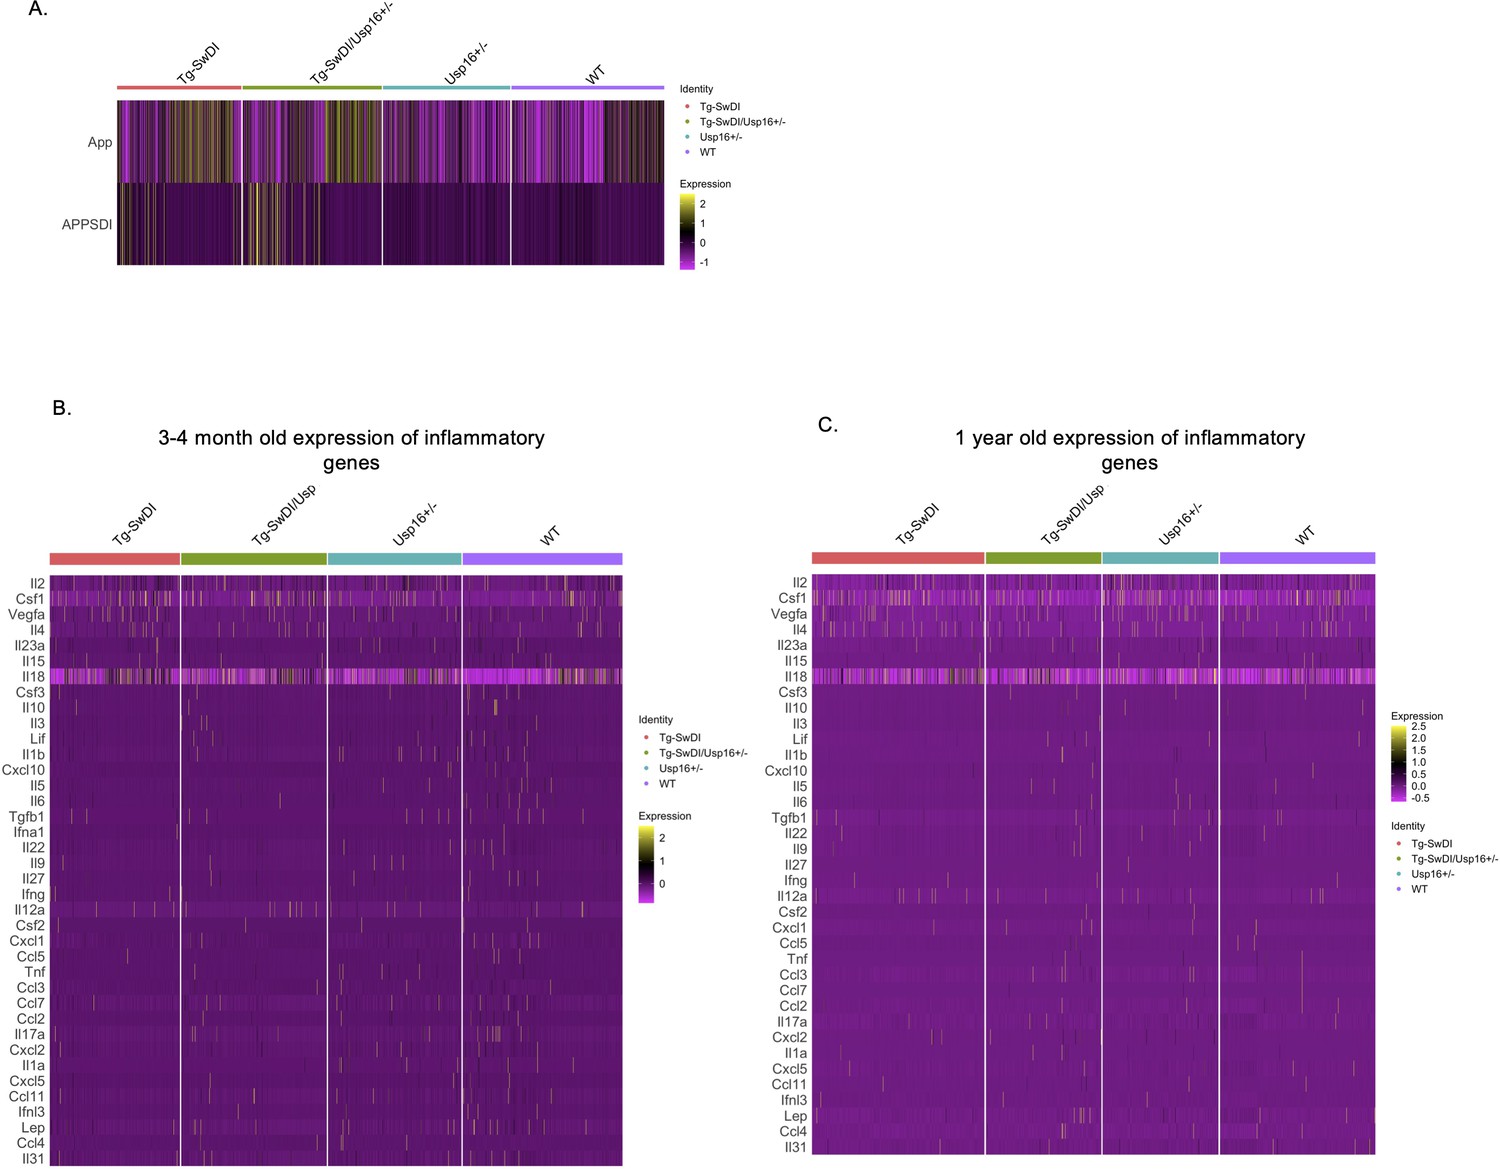
Few changes in inflammatory markers in Tg-SwDI or wild type (WT) mice at 1-year of age with an approximately 1.5-fold increase in normalized mutant APP expression.
(A) Differential expression tests found an ~1.5-fold change between our Tg-SwDI and WT cells in both transgenic (labeled ‘APP SDI’) and endogenous App expression (n = 4 mice per genotype) with log fold changes listed in Figure 5—figure supplement 2—source data 1. The same inflammatory markers used in the Luminex screen were used to screen for differences between genotypes at 3 and 4 months (B) and 1 year of age (C). Differentially expressed genes are listed in Figure 5—figure supplement 2—source data 2 and Figure 5—figure supplement 2—source data 3 with p-value, average log fold change in Tg-SwDI compared to WT, percentage of Tg-SwDI and WT cells where the gene is detected, and adjusted p-value. Similar to the Luminex screen, there was very low expression of all markers. Only Csf1 and Il18 were significantly upregulated in Tg-SwDI cells compared to WT at 3 and 4 months and Lifr and Ifngr1 at 1-year of age.
-
Figure 5—figure supplement 2—source data 1
App gene expression in WT and Tg-SwDI mice.
- https://cdn.elifesciences.org/articles/66037/elife-66037-fig5-figsupp2-data1-v2.xlsx
-
Figure 5—figure supplement 2—source data 2
Inflammatory genes in 3-4 month old mice.
- https://cdn.elifesciences.org/articles/66037/elife-66037-fig5-figsupp2-data2-v2.xlsx
-
Figure 5—figure supplement 2—source data 3
Inflammatory genes in 1 year old mice.
- https://cdn.elifesciences.org/articles/66037/elife-66037-fig5-figsupp2-data3-v2.xlsx
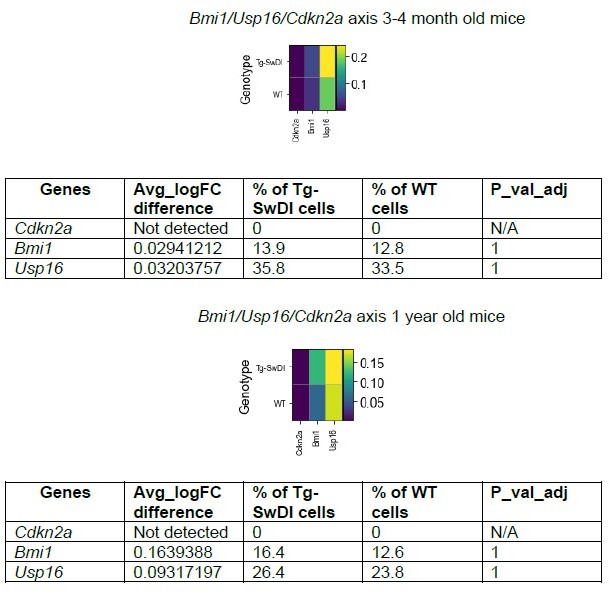
Figure 5—figure supplement 3
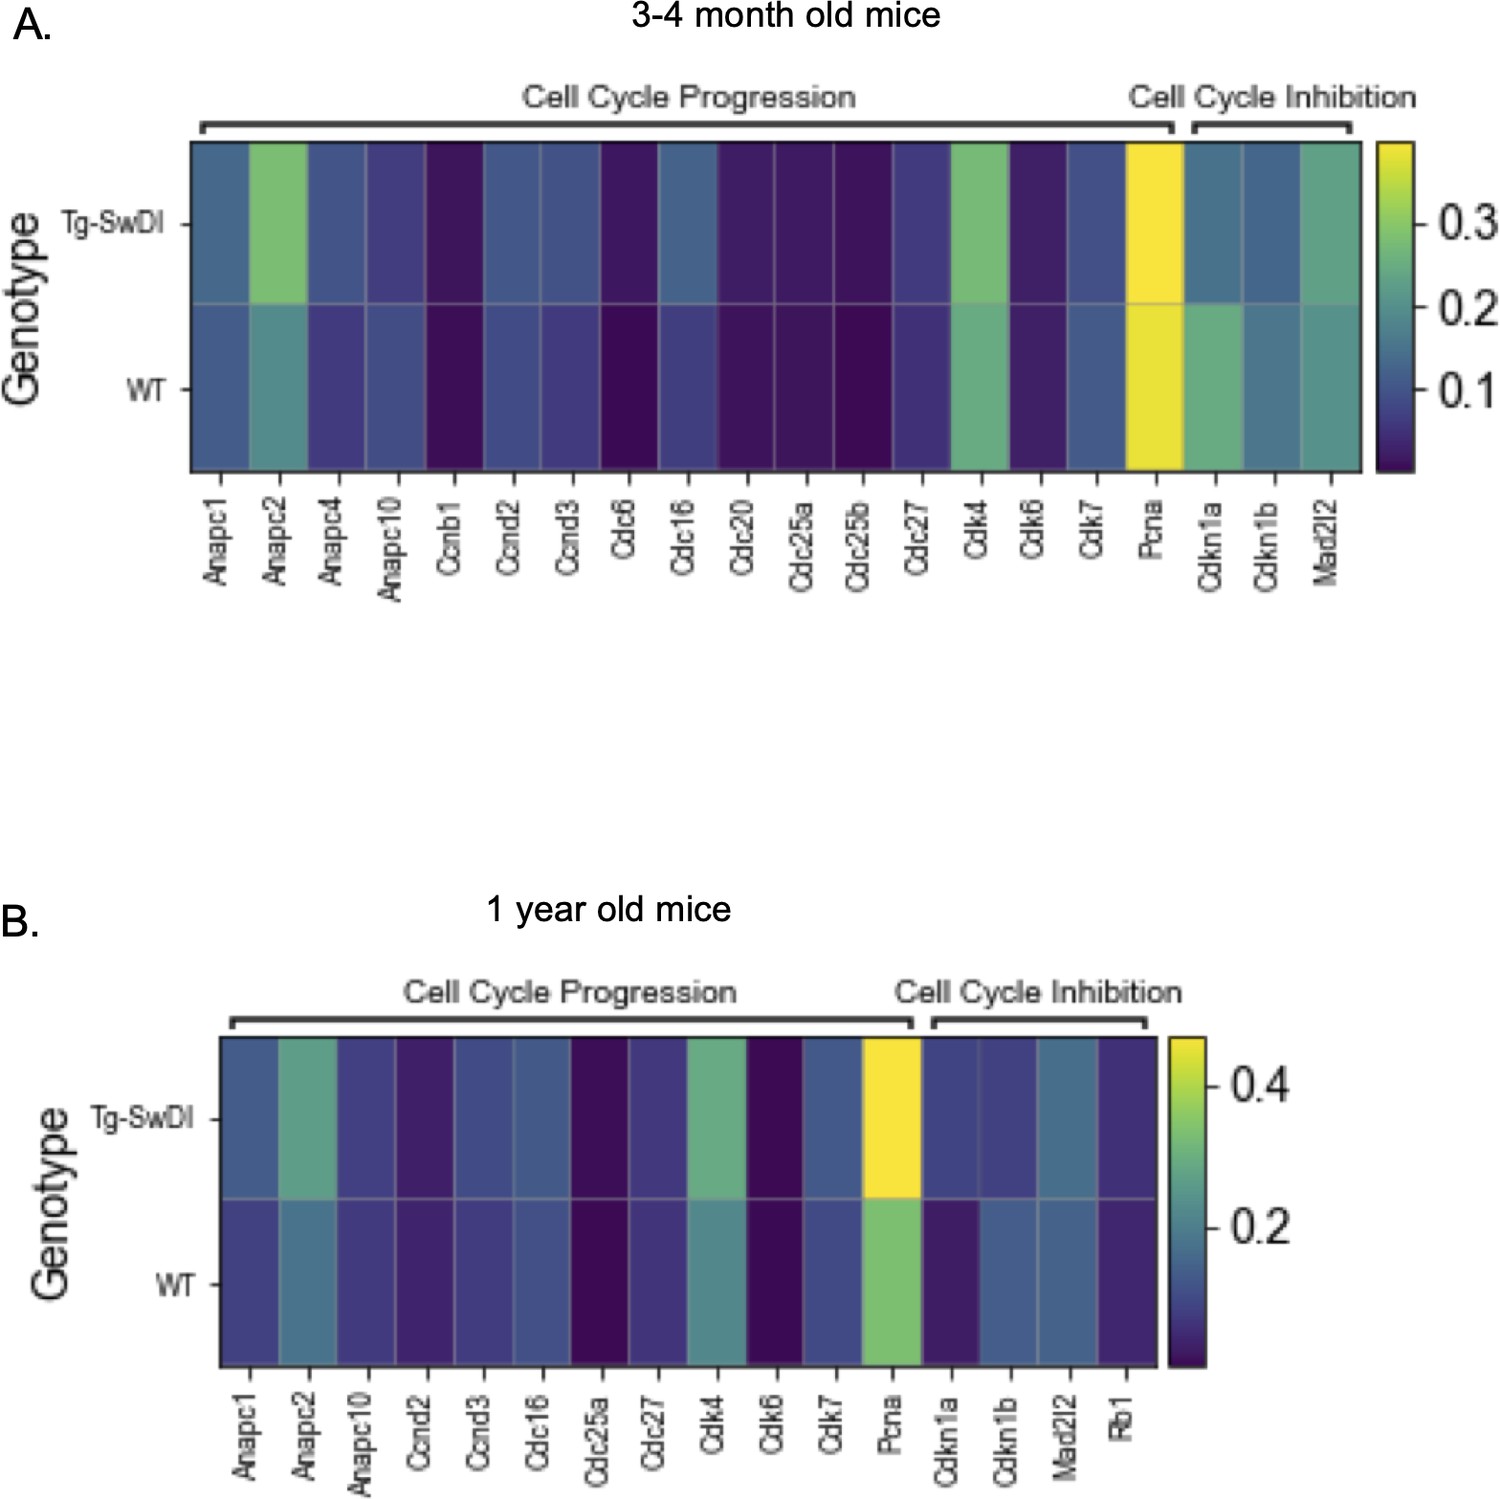
Only a few hyperproliferation genes are significantly different between wild type (WT) and Tg-SwDI cells at 3 and 4 months or 1 year of age.
Heatmaps provide an overview of expression of cell cycle related genes in Tg-SwDI and WT mice at 3 and 4 months (A) and 1 year (B) of age. A differential expression Wilcoxon Rank Sum test was used to test which genes were differentially expressed in Tg-SwDI cells compared to WT cells. Only genes that had a minimum logFC of 0.01 and could be detected in at least 1% of cells were tested. Differentially expressed genes are bolded in Figure 5—figure supplement 3—source data 1 and Figure 5—figure supplement 3—source data 2 with values listed for p-value, average log fold change in Tg-SwDI cells compared to WT cells, percentage of Tg-SwDI and WT cells where the gene is detected, and adjusted p value.
-
Figure 5—figure supplement 3—source data 1
Cell cycle related genes in 3-4 months old mice.
- https://cdn.elifesciences.org/articles/66037/elife-66037-fig5-figsupp3-data1-v2.xlsx
-
Figure 5—figure supplement 3—source data 2
Cell cycle related genes in 1 yo mice.
- https://cdn.elifesciences.org/articles/66037/elife-66037-fig5-figsupp3-data2-v2.xlsx
Figure 5—figure supplement 4
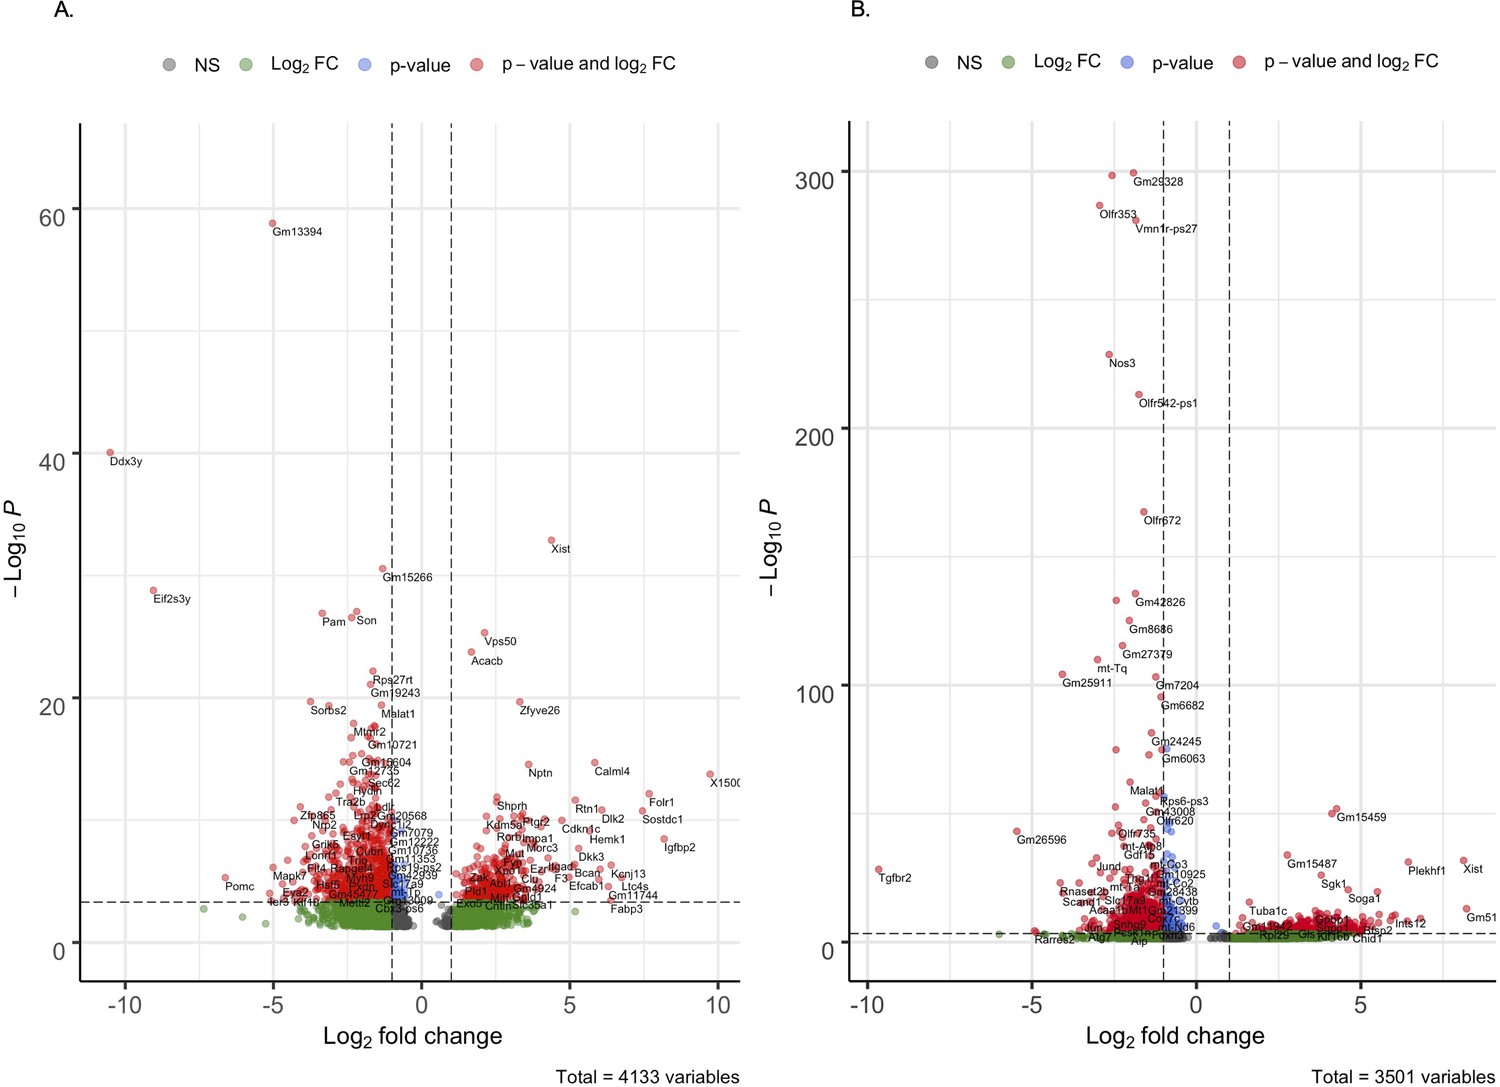
Differentially expressed genes in Tg-SwDI cells compared to wild type (WT) cells.
Volcano plot of differentially expressed genes in Tg-SwDI cells compared to WT at 3 and 4 months (A) and 1 year (B) of age. A positive log fold change denotes that the gene is upregulated while a negative log fold change denotes that the gene is downregulated.
Figure 5—figure supplement 5
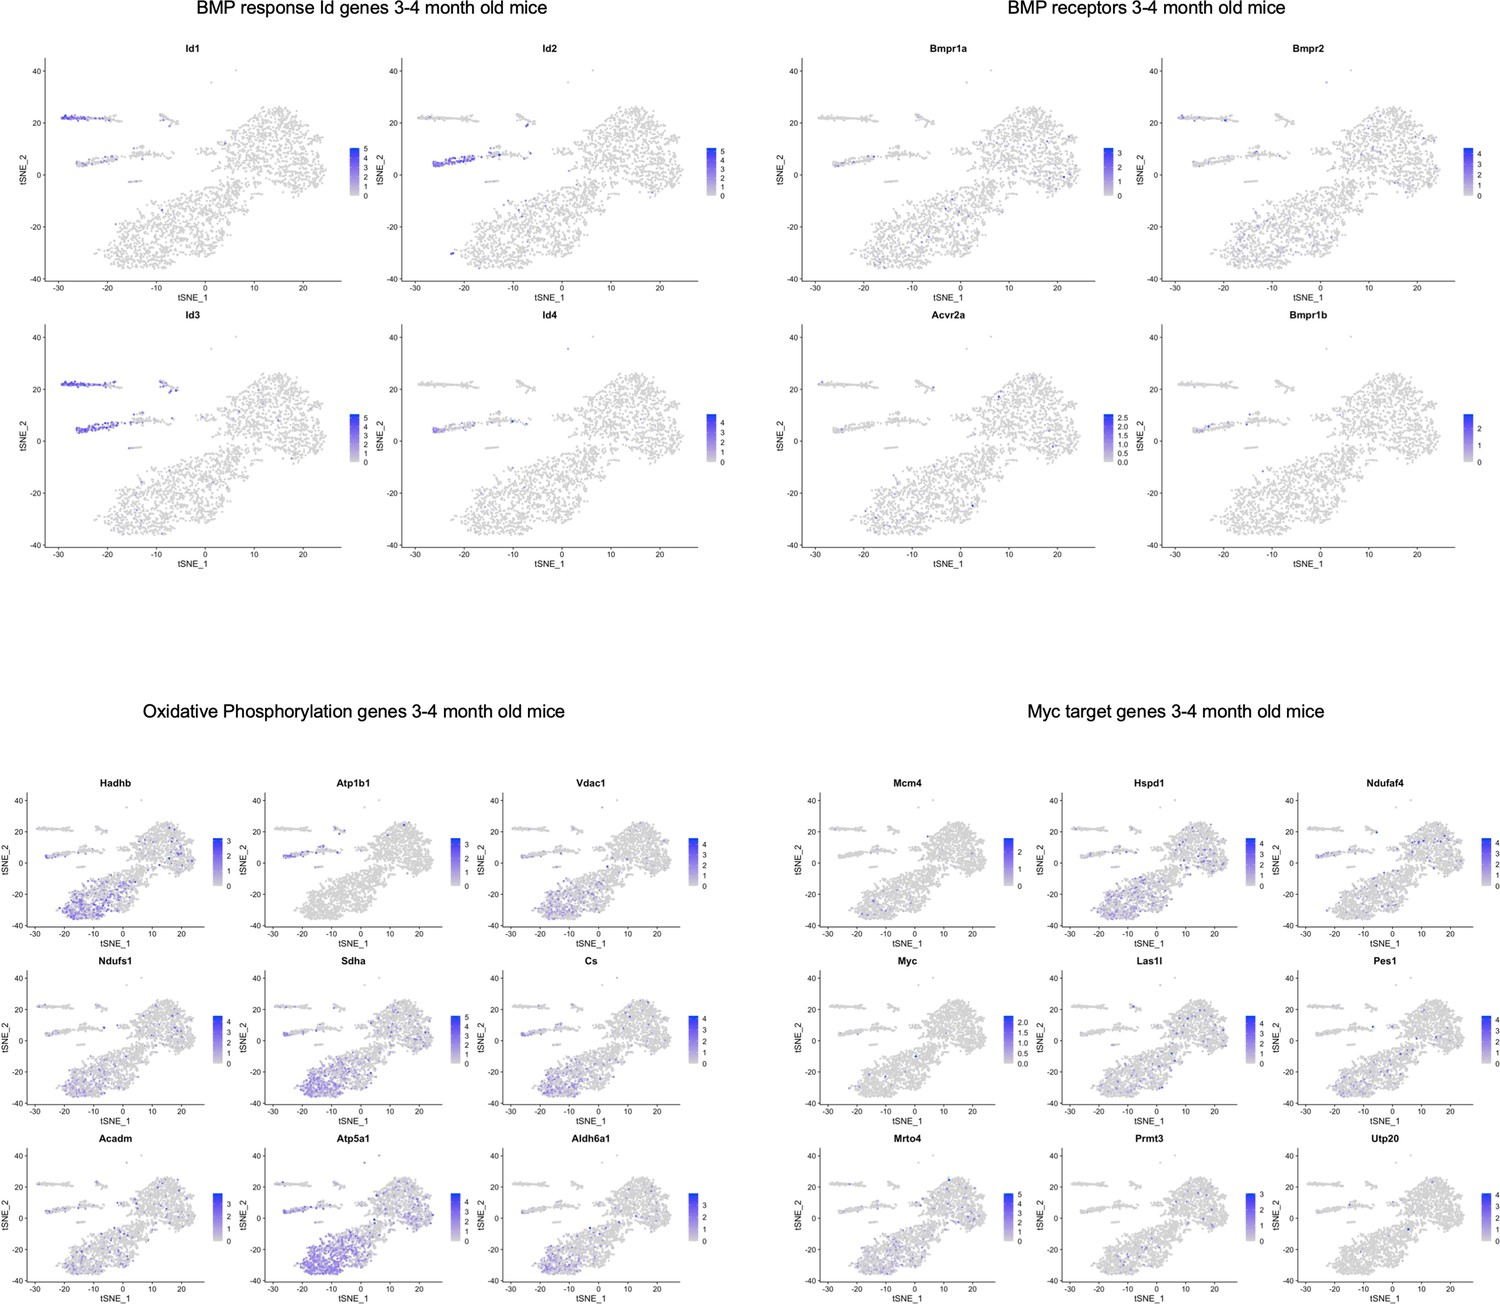
TSNE plots of 3 and 4-month-old mice showing localization of various genes in pathways highlighted in Figure 5—source data 2.
While there did not seem to be cluster-specific expression of BMP receptors, we did observe BMP response Id gene expression localized to SLC1A3+ NPC and microglia clusters. Some of the oxidative phosphorylation and Myc target genes were localized to the oligodendrocyte clusters.
Figure 5—figure supplement 6
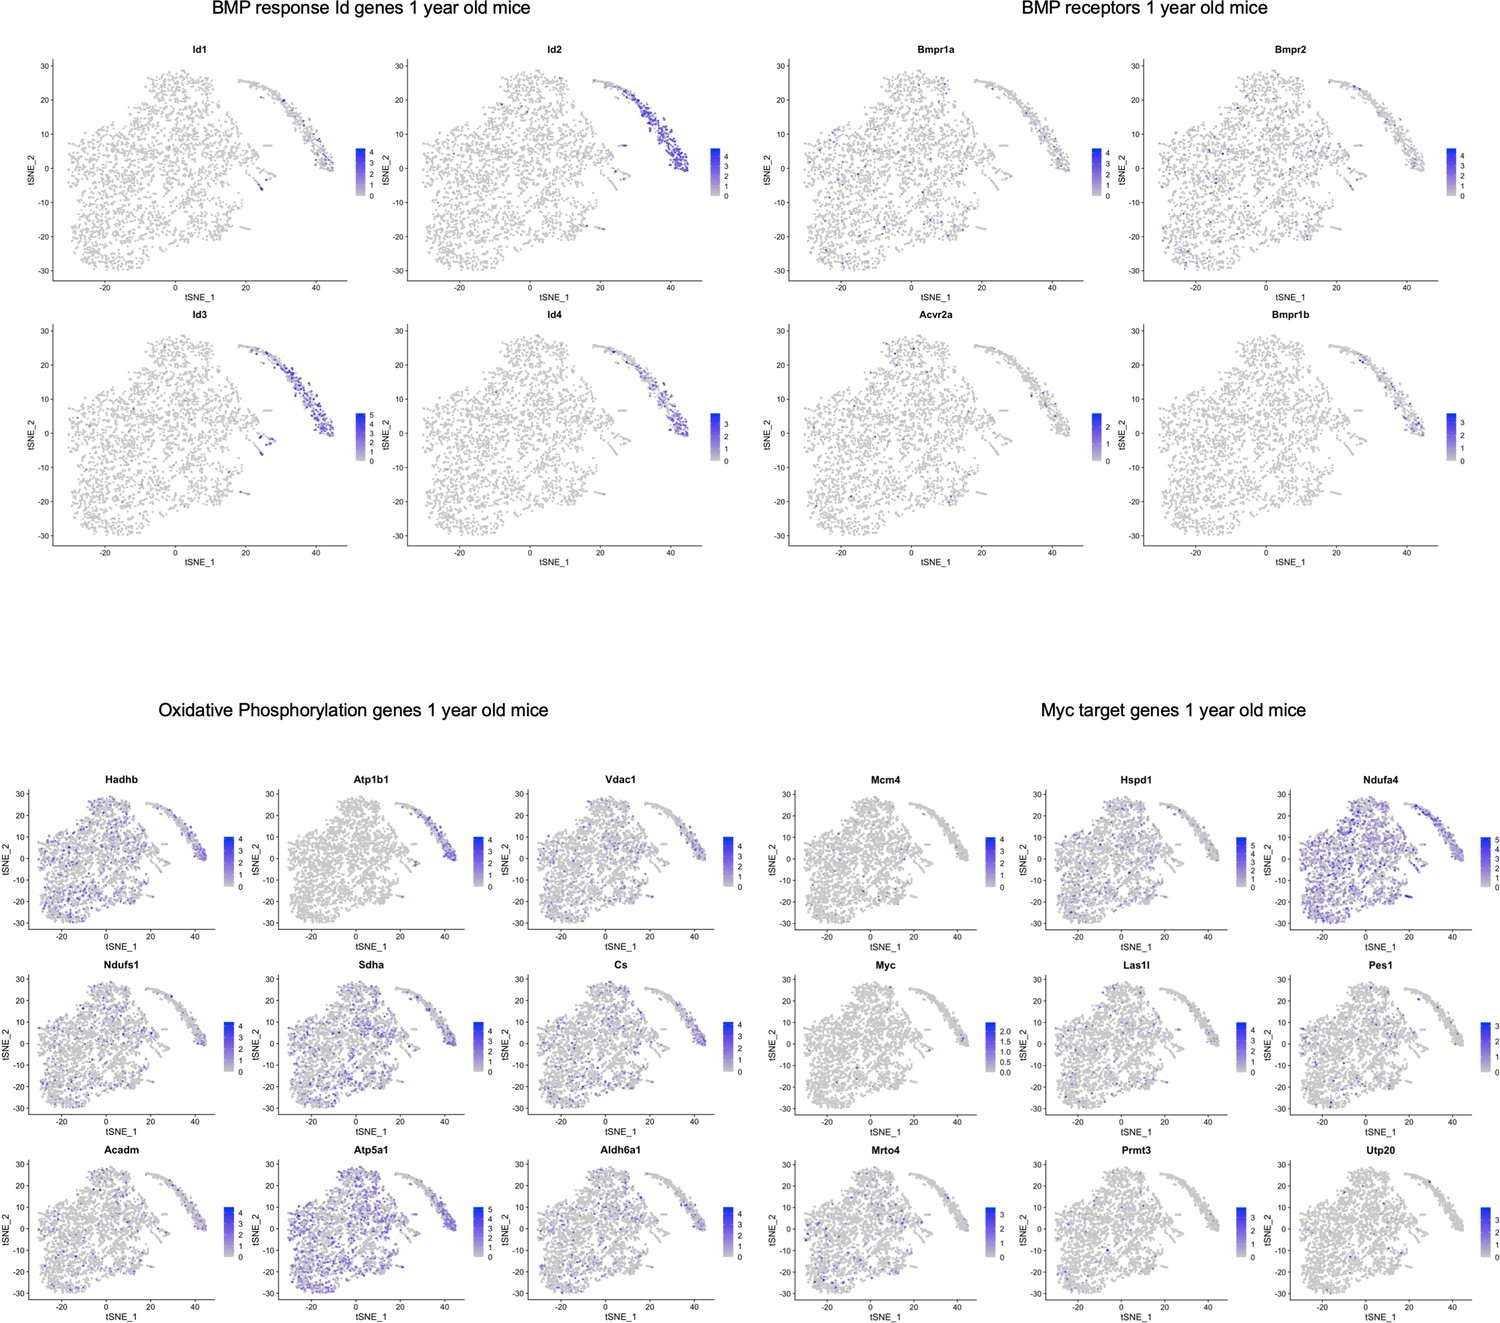
TSNE plots of 1-year-old mice showing localization of various genes in pathways highlighted in Figure 5—source data 2.
Similar to the 3 and 4-month-old mice, while there did not seem to be cluster-specific expression of BMP receptors, we again observed BMP response Id gene expression localized to SLC1A3+ NPC cluster of 1-year-old mice. Some of the oxidative phosphorylation genes and Myc target genes were localized to the oligodendrocyte clusters.
Figure 6
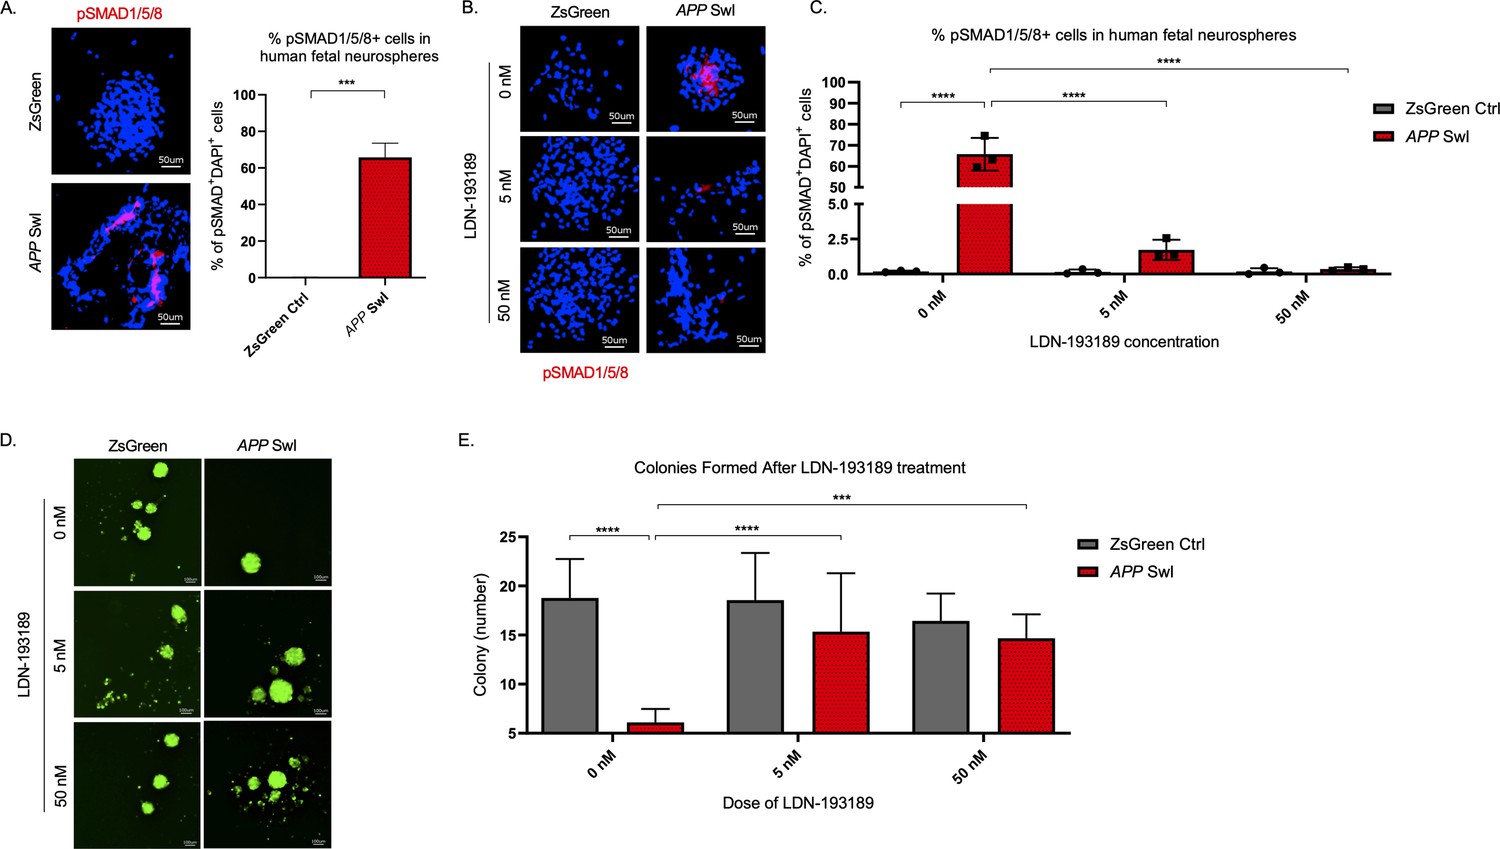
BMPR inhibition rescues mutant APP mediated self-renewal defects in human neurospheres.
(A) Left panel shows representative 100× images of phospho-Smad 1/5/8 staining in mutant APP-infected human fetal neurospheres compared to Zsgreen controls. Right panel shows quantification of DAPI and phospho-Smad1/5/8 co-stained cells in each group. Data are presented as mean ± SD. (B) Representative 100× images of phospho-Smad1/5/8 staining in neurospheres treated with LDN-193189 for one week. (C) Quantification of phospho-SMAD 1/5/8 after treatment with different doses of LDN-193189. A two-way ANOVA revealed significant differences between the groups (**** for p<0.0001). Data are presented as mean ± SD. (D) Representative 6× images of in vitro colonies of mutant APP- and Zsgreen-infected human fetal neurospheres after one week of LDN-193189 treatment. (E) Quantification of the colonies in (D). A two-way ANOVA revealed significant differences between groups (**** for p<0.0001 and *** for p=0.0003). Data are presented as mean ± SD.
Figure 7 with 3 supplements
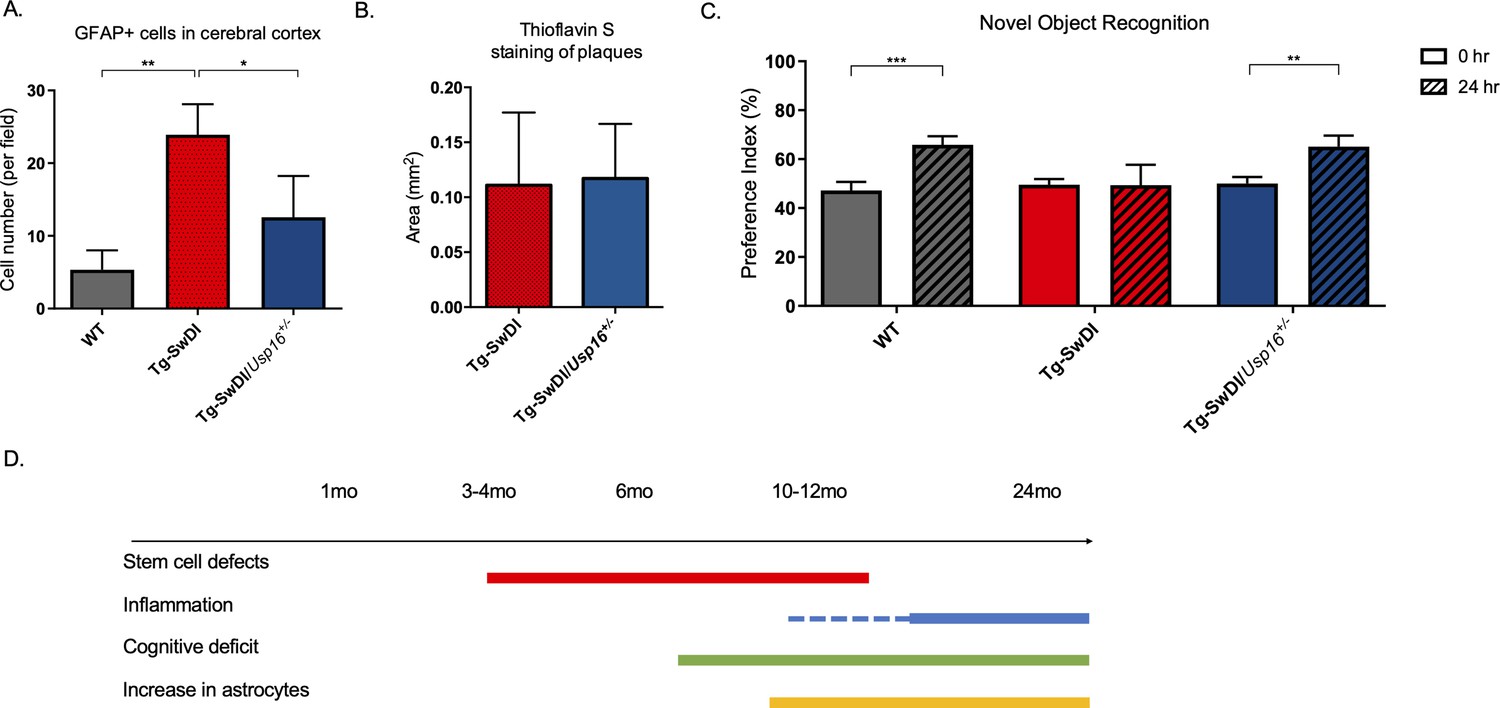
Astrogliosis, cognitive deficits, but not amyloid plaque burden are some of the processes rescued in Tg-SwDI/Usp16+/- mice.
(A) Anterior sections were obtained from 9 to 12 months old mice, stained, and counted for GFAP+ cells in the cortex. Four different images per sections and three sections per mouse were counted (n = 4). Bar graph shows quantification of GFAP+ cells from cortex. A one-way ANOVA showed significant differences between the groups (p=0.0012 between wild type (WT) and Tg-SwDI and p=0.0188 between Tg-SwDI and Tg-SwDI/Usp16+/-). Data are presented as mean ± SD. See also Figure 7—figure supplement 1A. (B) Representative images of thioflavin S on the left. On the right, quantification of area covered by plaques using thioflavin S staining in Tg-SwDI and Tg-SwDI/Usp16+/- mice shows no difference between the two genotypes (10-month-old mice). Data are presented as mean ± SEM. See also Figure 7—figure supplement 1B. (C) Novel object recognition 24 hr testing in mice at 6 months of age showed the earliest signs of cognitive impairment in the Tg-SwDI mice with a preference index (PI) of 49%, while WT and Tg-SwDI/Usp16+/- mice had PIs >65% indicating intact object discrimination (p=0.001 for WT and p=0.0099 for Tg-SwDI/Usp16+/-, n = 7–10 mice). Data are presented as mean ± SEM. See also Figure 7—figure supplement 3. (D) Schematic summarizing the temporal effects of mutant APP demonstrated in this manuscript.
Figure 7—figure supplement 1
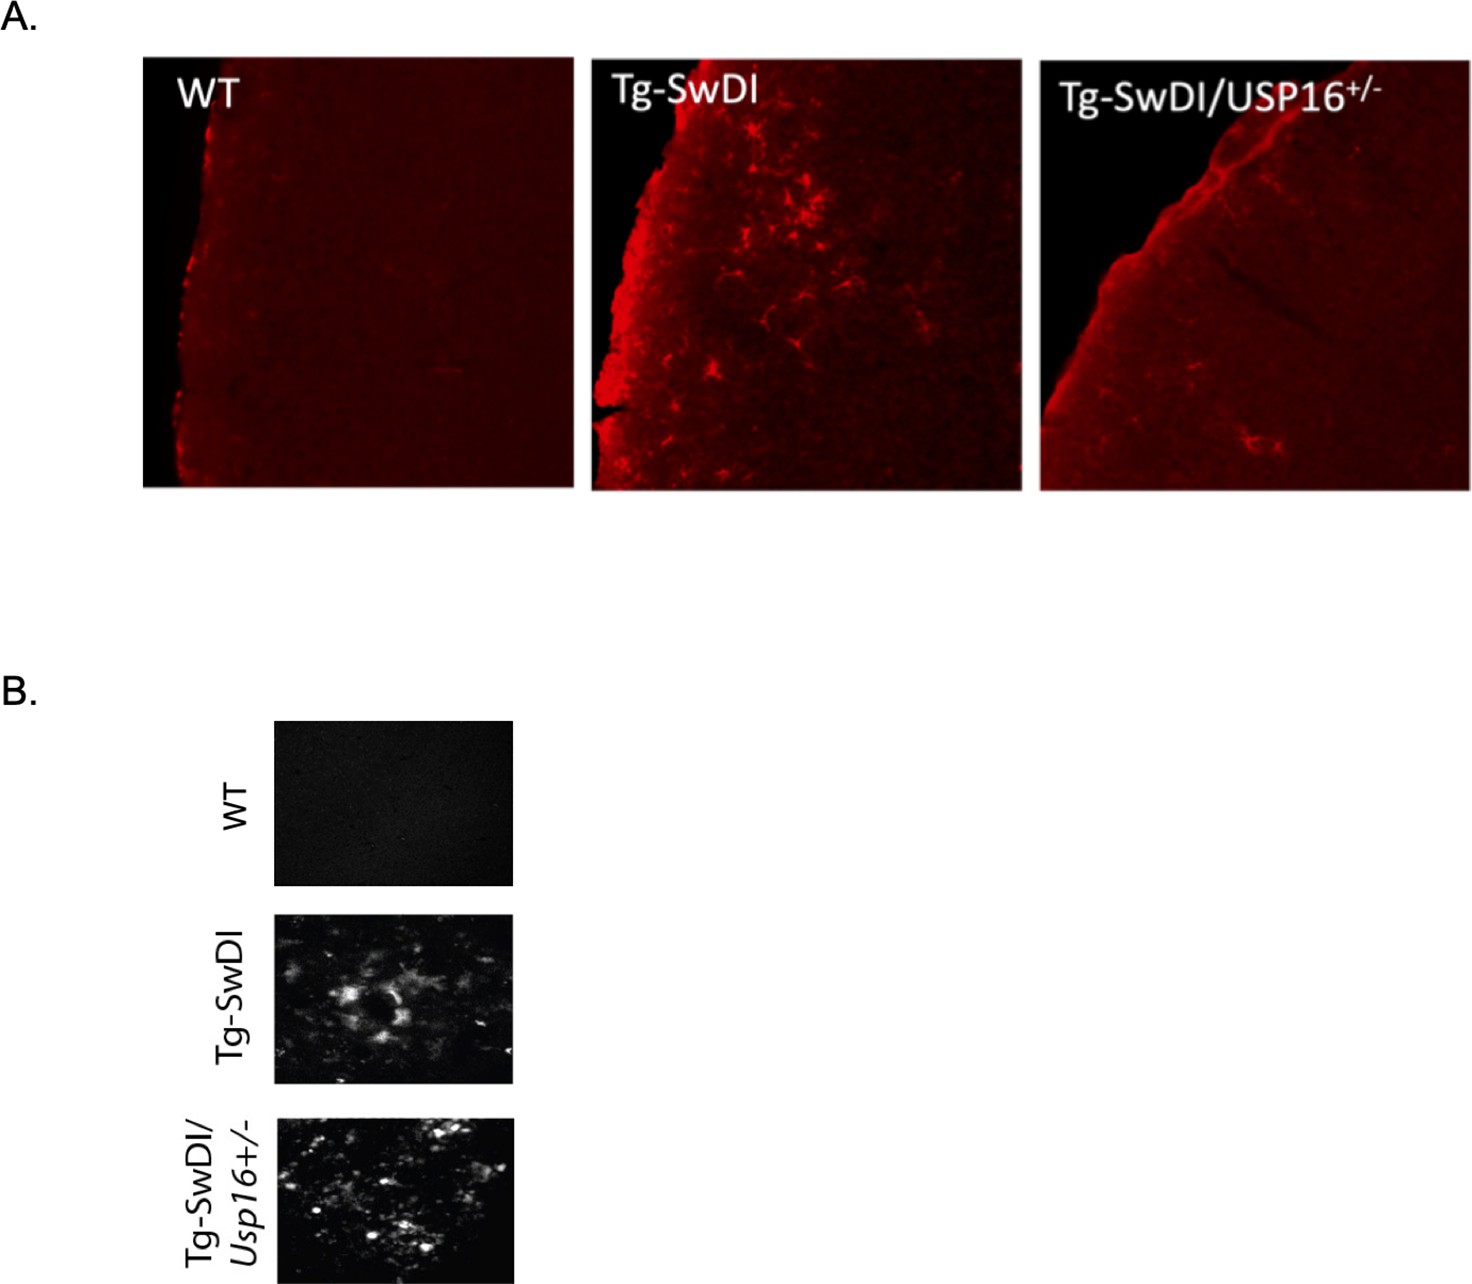
Usp16 haploinsufficiency partially rescues GFAP+ cells in the Tg-SwDI cortex.
(A) Representative images of GFAP staining in the frontal cortex of 9–12-month-old wild type, Tg-SwDI, and Tg-SwDI/Usp16+/- mice. (B) Representative images of Thioflavin S.
Figure 7—figure supplement 2
No change in inflammation is present in Tg-SwDI or Tg-SwDI/Usp16+/- mice at 1-year old.
(A) Cytokine levels measured by Luminex array from the subventricular zone (SVZ), (B) the dentate gyrus (DG), and (C) the cortex of 1-year-old mice. No differences have been observed at this age for any of the genotypes. Data are presented as mean ± SD. 2-year-old Tg-SwDI SVZ, DG, and cortex samples were included as a positive control. *p<0.05.
Figure 7—figure supplement 3
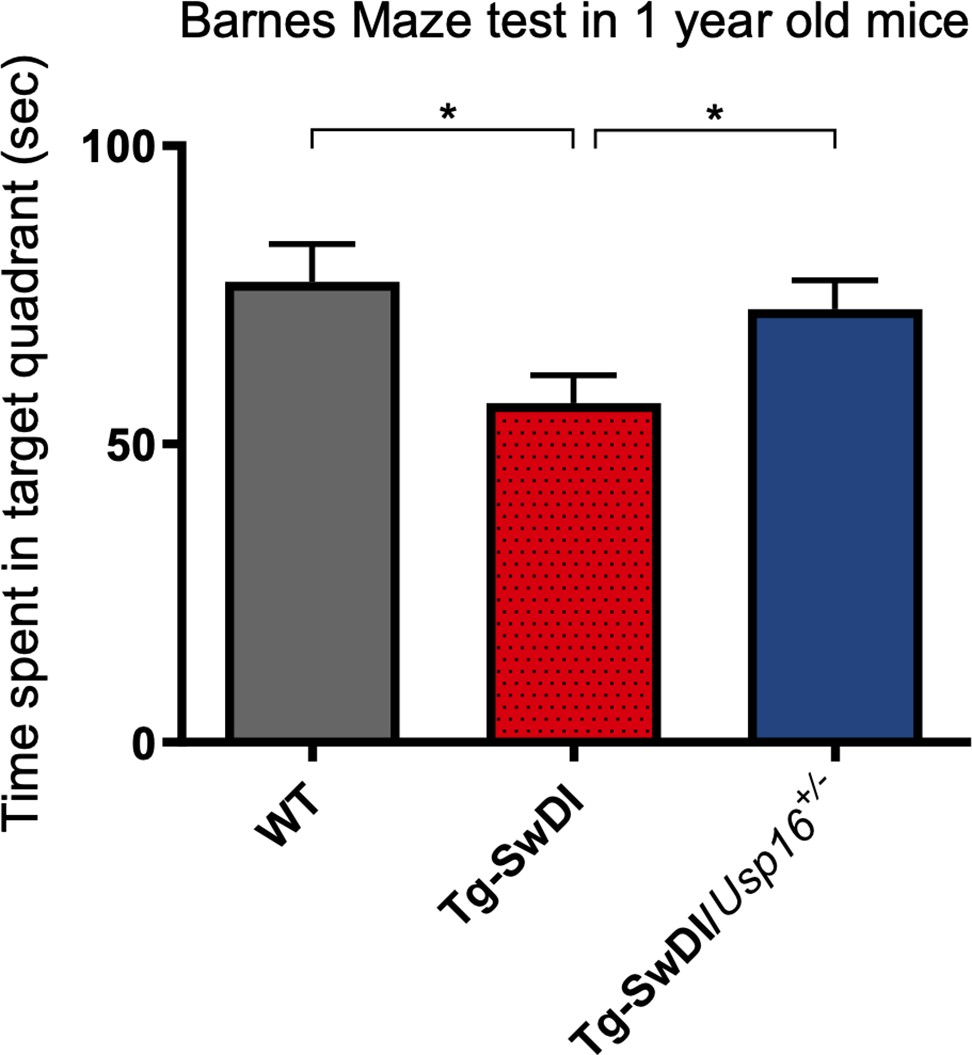
Long-term and spatial memory was improved with Usp16 haploinsufficiency in Tg-SwDI mice.
Barnes maze testing was performed 24 hr after the last training day with each mouse allowed 3 min to explore. The time spent in the target quadrant was reduced in mice with the Tg-SwDI background but rescued in Tg-SwDI mice expressing only a single copy of Usp16. (p=0.0128 between WT and Tg-SwDI and p=0.0251 between Tg-SwDI and Tg-SwDI/Usp16+/-). Mice were 1-year-old; n = 13–17 mice per group. Data are presented as mean ± SEM.
Author response image 1

Author response image 2
Author response image 3
Author response image 4
Author response image 5
Author response image 6
Author response image 7
Author response image 8
Author response image 9

Tables
Key resources table
| Reagent type (species) or resource | Designation | Source or reference | Identifiers | Additional information |
|---|---|---|---|---|
| Gene (Homo sapiens) | Tg-SwDI | Davis et al., 2004 | APP KM670/671NL (Swedish), APP E693Q (Dutch), APP D694N (Iowa) | Transgenic mutant APP in mouse model with Swedish, Dutch, and Iowa mutations |
| Gene (Homo sapiens) | APP SwI | Young-Pearse et al., 2007 | APP K595N (Swedish), APP M596L and V642F (Indiana) | Mutant human APP in human neurosphere model with Swedish and Indiana mutations |
| Strain, strain background (Mus musculus) | C57BL/6-Tg(Thy1-APPSwDutIowa)BWevn/Mmjax, C57Bl/6 | The Jackson Laboratory | Jax Stock#: 007027; RRID:MMRRC_034843-JAX | Tg-SwDI mice |
| strain, strain background (Mus musculus) | FVB/N-Usp16Tg(Tyr)2414FOve/Mmjax, FVB | Mutant Mouse Regional Resource Centers | Jax Stock#: 036225-JAX; RRID:MMRRC_036225-JAX | Usp16+/- mice |
| Strain, strain background (Mus musculus) | B6.129-Cdkn2atm1Rdp/Nci, B6.129 | Mouse Models of Human Cancers Consortium | MMHCC strain:#01XB1; RRID:IMRS_NCIMR:01XB1 | Cdkn2a-/- mice |
| Transfected construct (Homo sapiens) | pHIV-ZsGreen | Addgene | RRID:Addgene_18121 | Empty Lentiviral Backbone as control |
| Transfected construct (Homo sapiens) | APP SwI | This paper (cloned) | pHIV-APPSwI | To model mutant APP neurospheres |
| Transfected construct (Homo sapiens) | APP WT | This paper (cloned) | pHIV-APP695 | To model WT APP neurospheres |
| Biological sample (Mus musculus) | Primary neural stem cells | The Jackson Laboratory | Tg-SwDI, WT, Tg-SwDI/Usp16+/-, Usp16+/-, Tg-SwDI/Cdkn2a-/-, Cdkn2a-/- | Freshly isolated from M. musculus |
| Biological sample (Homo sapiens) | Primary human fetal neural stem cells | University of California Irvine | Isolated from 18 week fetal neural tissue, enriched for CD133+ cells | |
| Antibody | anti-SOX2 (Goat polyclonal) | R&D Systems | Cat# AF2018, RRID:AB_355110 | IHC(1:50) |
| Antibody | Anti-GFAP (Rabbit polyclonal) | Stem Cell Technologies | Cat#:60128, RRID:AB_1118515 | IHC(1:500) |
| Antibody | Anti-pSMAD1/5/8 (Rabbit monoclonal) | CST | Cat#:9516, RRID:AB_491015 | IF(1:100) |
| Antibody | Anti-beta-amyloid (Mouse monoclonal) | Invitrogen | Cat#:13–0200, RRID:AB_2532993 | IF(1:100) |
| antibody | Pacific Blue anti-mouse CD31 Antibody (Rat monoclonal) | Biolegend | Cat#:102421, RRID:AB_10613457 | FACS(5 µl per test) |
| Antibody | Pacific Blue anti-mouse CD45 Antibody (Rat monoclonal) | Biolegend | Cat#:103125, RRID:AB_493536 | FACS(5 µl per test) |
| Antibody | Pacific Blue anti-mouse TER-119 Antibody (Rat monoclonal) | Biolegend | Cat#116231, RRID:AB_2149212 | FACS(5 µl per test) |
| Antibody | FITC anti-mouse CD24 Antibody (Rat monoclonal) | Biolegend | Cat#101805, RRID:AB_312838 | FACS(5 µl per test) |
| Recombinant DNA reagent | pCAX APP Swe/Ind (plasmid) | Addgene | RRID:Addgene_30145 | Mutant APP with Swedish, Indiana mutations |
| Recombinant DNA reagent | pCAX APP 695 | Addgene | RRID:Addgene_30137 | Wild type APP |
| Recombinant DNA reagent | pHIV-Zsgreen (plasmid) | Addgene | RRID:Addgene_18121 | Lentiviral backbone |
| Commercial assay or kit | RNeasy Lipid Tissue Kit | Qiagen | Cat#: 74,804 | |
| Commercial assay or kit | Click-iT EdU cell proliferation kit | Invitrogen | Cat#: C10337 | |
| Commercial assay or kit | Nextera XT Library Sample Preparation Kit | Illumina | Cat#: FC-131–1096 | |
| Chemical compound, drug | LDN-193189 | Sigma Aldrich | S2618 | 5 nM and 50 nM |
| Software, algorithm | R | R | RRID:SCR_001905 | Single cell RNA-seq |
| Software, algorithm | GSEA | http://www.broadinstitute.org/gsea/ | RRID:SCR_003199 | Gene set enrichment analysis |
| Software, algorithm | ELDA | http://bioinf.wehi.edu.au/software/elda/ | RRID:SCR_018933 | Limiting dilution experiments |
| Software, algorithm | ImageJ | https://imagej.net/ | RRID:SCR_003070 | IF analysis |
| Software, algorithm | Transcriptome Analysis Console | Thermo Fisher | RRID:SCR_016519 | Microarray analysis |
| Other | DAPI stain | Sigma | 32,670 | IHC (1:10000) |
| Other | Thioflavin S | Sigma | 1326-12-1 | IHC (1%) |
| Other | Sytox Blue | Thermo Fisher | S11348 | FACS |
Author response table 1
| Gene | Avg_logFC difference | % of Tg-SwDI cells | % of WT cells | P_val_adj |
|---|---|---|---|---|
| Trp53 | 0.7315253 | 0.155 | 0.107 | 0 |
| Cdkn1a (p21) | -0.2627055 | 0.057 | 0.170 | 0 |
| Mtor | 0.8106869 | 0.169 | 0.161 | 0 |
| E2f4 | 0.3536161 | 0.125 | 0.085 | 3.987E-132 |
Author response table 2
| Gene | Avg_logFC difference | % of Tg-SwDI cells | % of WT cells | P_val_adj |
|---|---|---|---|---|
| Crebbp | -0.3303011 | 0.394 | 0.409 | 0 |
Additional files
Download links
A two-part list of links to download the article, or parts of the article, in various formats.
Downloads (link to download the article as PDF)
Open citations (links to open the citations from this article in various online reference manager services)
Cite this article (links to download the citations from this article in formats compatible with various reference manager tools)
Inhibiting USP16 rescues stem cell aging and memory in an Alzheimer’s model
eLife 11:e66037.
https://doi.org/10.7554/eLife.66037


