Modeling the ACVR1R206H mutation in human skeletal muscle stem cells
- Division of Plastic and Reconstructive Surgery, Departments of Surgery and Orofacial Sciences, the Program in Craniofacial Biology, and the Eli and Edythe Broad Center of Regeneration Medicine, University of California - San Francisco, United States
- Division of Endocrinology and Metabolism, Department of Medicine, the Institute for Human Genetics, the Program in Craniofacial Biology, and the Eli and Edythe Broad Center of Regeneration Medicine, University of California - San Francisco, United States
- Division of Plastic and Reconstructive Surgery, Department of Surgery, University of California - San Francisco, United States
Figures
Figure 1 with 1 supplement

Regenerative properties of primary Hu-MuSCs isolated from FOP patients.
(A) Hematoxylin and eosin staining (top) and alcian blue staining (bottom) of muscle cross sections from FOP subjects, with no heterotopic ossification (left) and with heterotopic ossification, depicted by the white dashed line (right, 100 µm scale bar). (B) Immunofluorescence staining for PAX7 and COL1 of muscle cross sections from control and FOP subjects. White arrowheads mark Hu-MuSCs, 50 µm scale bar. (C) Heat map of normalized gene expression of sorted human satellite cells from two control subjects and two different muscles of 1 FOP subject. (D) Schematic and experimental time course. Hu-MuSCs from biceps and diaphragm muscles of a deceased FOP patient were sorted and transplanted into NSG mice. (E) Immunofluorescence staining 5 weeks after xenotransplantation. White arrowheads mark Hu-MuSCs, 50 µm scale bar. (F) Quantification of human DYSTROPHIN fibers and human PAX7+ cells 5 weeks after transplant. (G) Mice were re-injured 5 weeks after transplantation with bupivacaine. Immunofluorescence staining was performed at week 10. White arrows mark Hu-MuSCs, 50 µm scale bar. (H) Quantification of human DYSTROPHIN fibers and human PAX7+ cells after re-injury at week 10. n = 1, biological replicates, n ≥ 3 technical replicates. Error bars represent mean and SD. *, p < 0.05, **, p < 0.01. Muscle specimen and transplantation details are listed in Figure 1—source data 1 and Figure 1—source data 2 .
-
Figure 1—source data 1
Muscle specimen information.
- https://cdn.elifesciences.org/articles/66107/elife-66107-fig1-data1-v2.docx
-
Figure 1—source data 2
Hu-MuSCs transplantation details.
- https://cdn.elifesciences.org/articles/66107/elife-66107-fig1-data2-v2.docx
Figure 1—figure supplement 1
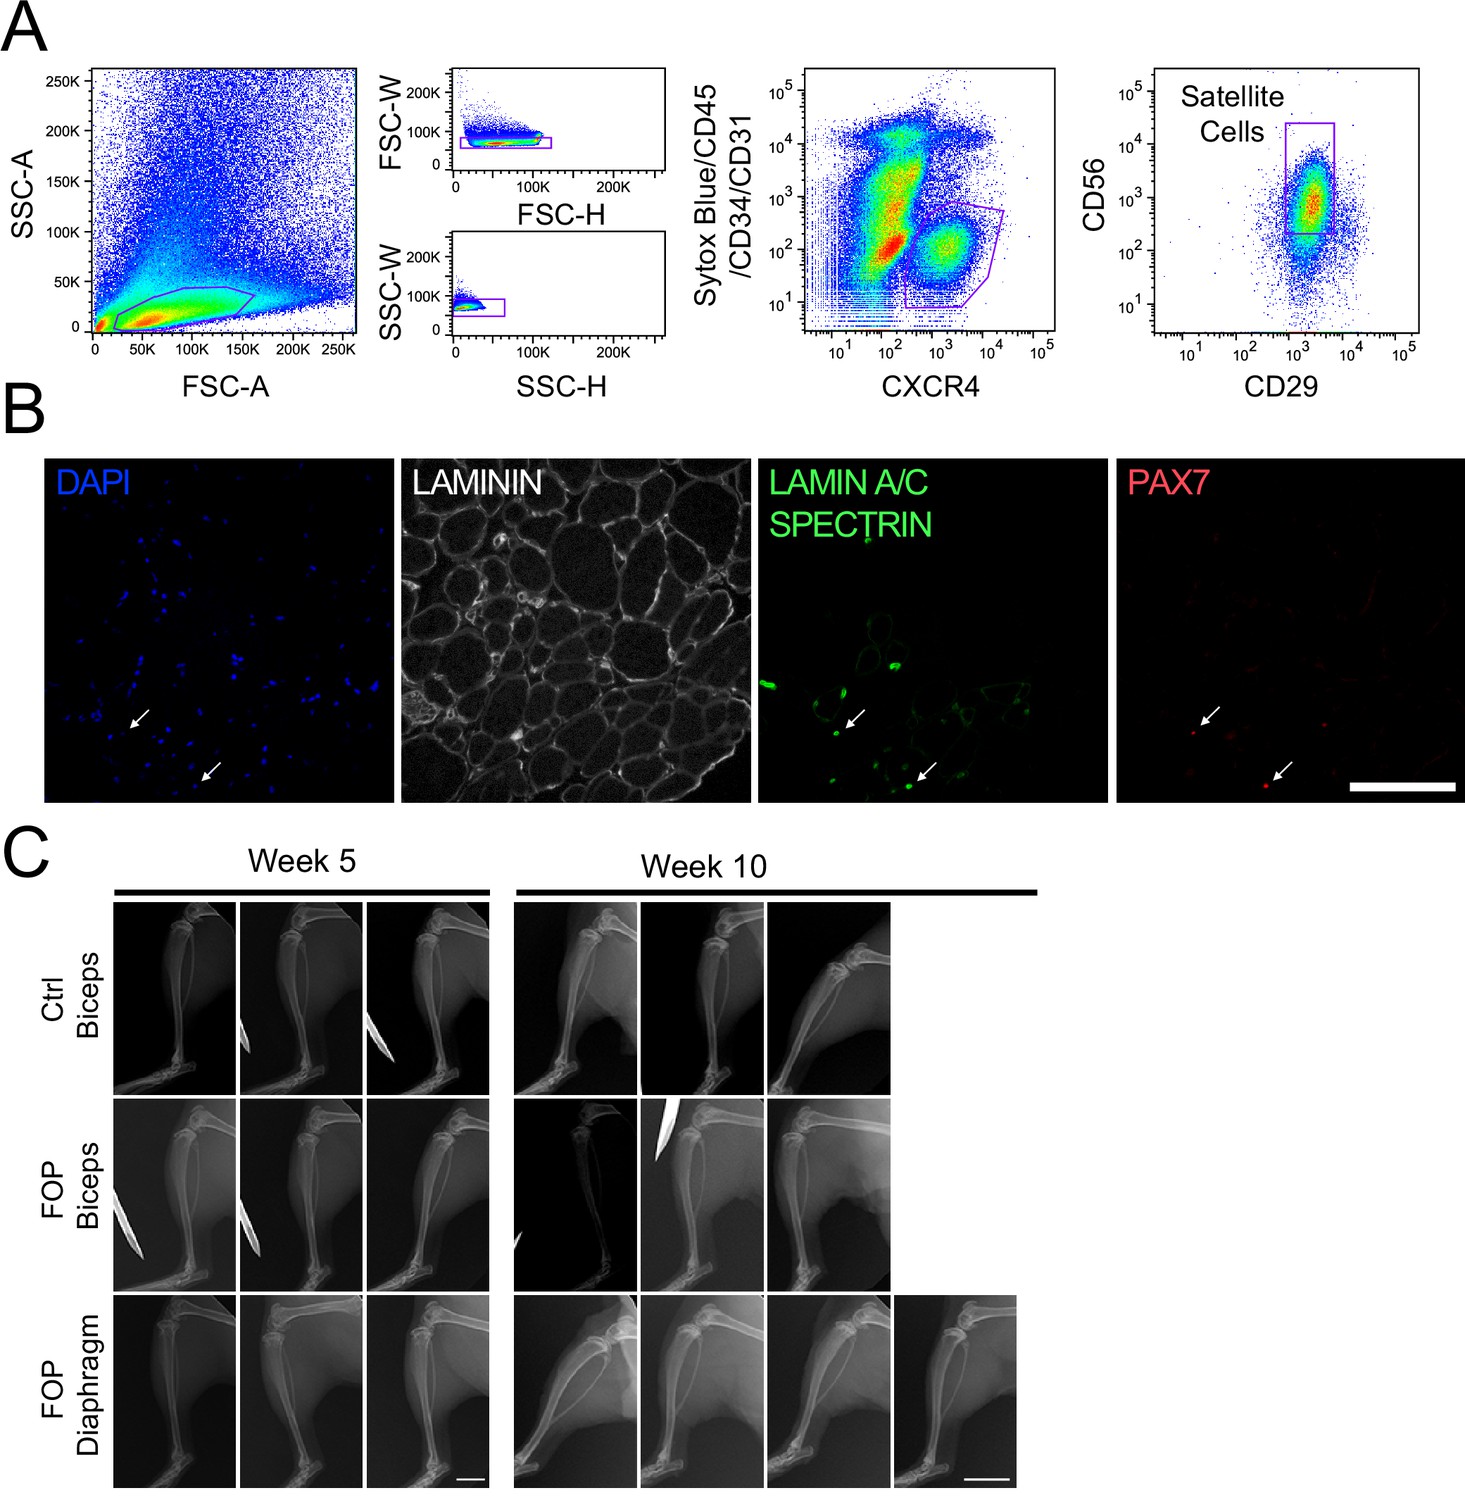
Transplanted Hu-MuSCs from biceps and diaphragm of FOP patient do not form bone.
(A) Flow cytometry analysis sorting strategy to isolate human satellite cells. (B) Representative immunostaining of Hu-MuSCs. White arrows indicate PAX7+ satellite cells (scale bar, 50 µm). (C) X-ray of transplanted mice at 5 and 10 weeks after initial transplantation (scale bars, 4 mm (week 5), 7 mm (week 10)) showing no heterotopic ossification. Details about muscle specimens used in this figure are in Figure 1—source data 1.
Figure 2 with 1 supplement
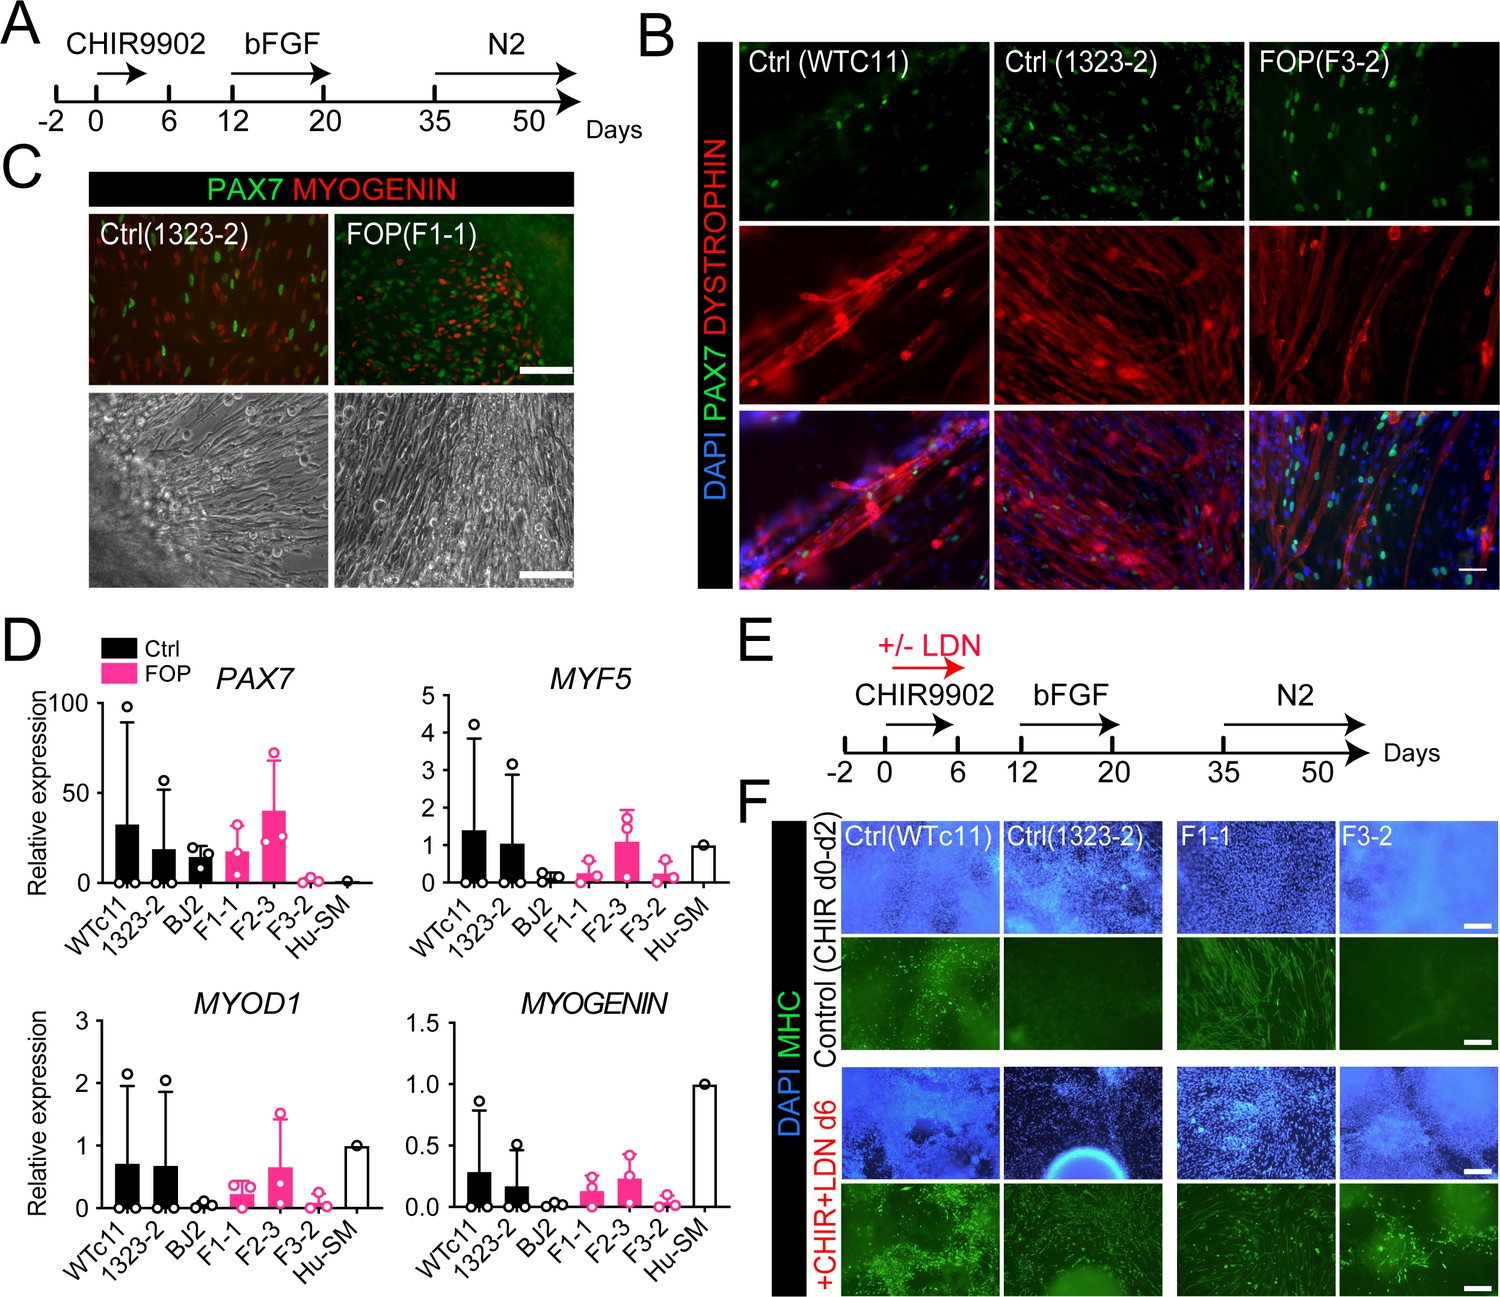
Skeletal muscle differentiation of human control and FOP hiPSC lines.
(A) Differentiation schematic of hiPSCs into skeletal muscle stem cell-like cells (iMPCs). (B) Immunofluorescence staining for PAX7, DYSTROPHIN and nuclear stain DAPI of iMPCs at day 50, 50 µm scale bar. (C) Immunofluorescence staining of PAX7 and MYOGENIN expressing cells. Control and FOP hiPSCs can form contractile myotubes, 100 µm scale bar. (D) PAX7, MYF5, MYOD1, and MYOGENIN gene expression at day 50 of differentiation (n = 3 biological replicates and n ≥ 3 technical replicates). Error bars represent mean ± SD. No statistically significant differences were detected. (E) Schematic describing the addition of the BMP pathway inhibitor LDN193189 (LDN). (F) Representative immunofluorescence staining of 2 control and 2 FOP hiPSC lines differentiated and stained for MHC (Myosin Heavy Chain) and nuclear stain DAPI at day 50±LDN addition, 200 µm scale bar.
Figure 2—figure supplement 1
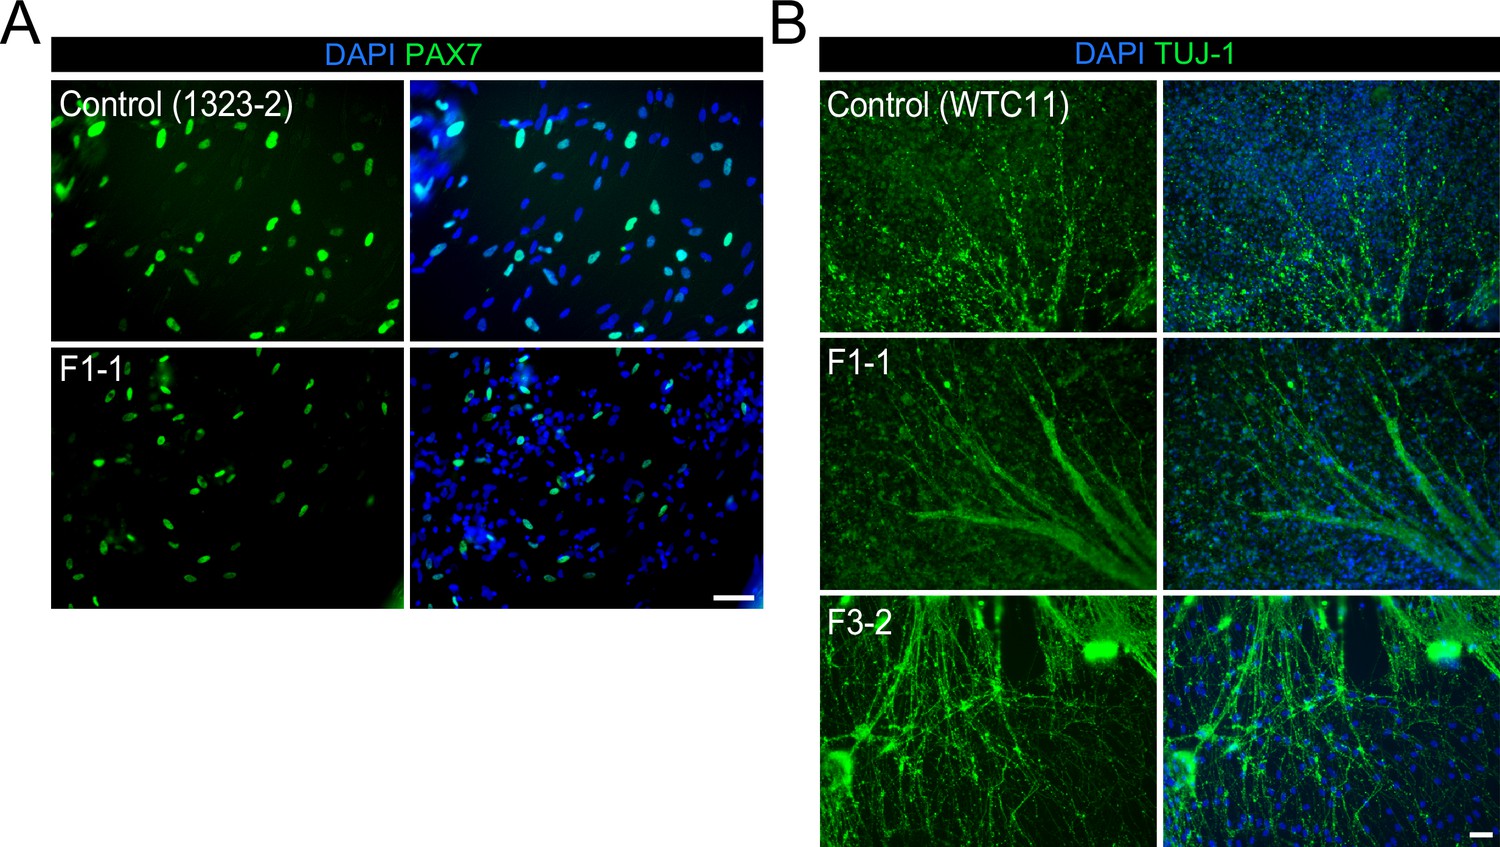
Expression of muscle and neuronal markers during the myogenic differentiation.
(A) PAX7 immunofluorescence staining at day 50 of the myogenic differentiation in control and BMP impaired hiPSCs (scale bar, 50 µm). (B) TUJ-1immunostaining at day 50 of differentiation (scale bar, 50 µm).
Figure 3 with 1 supplement
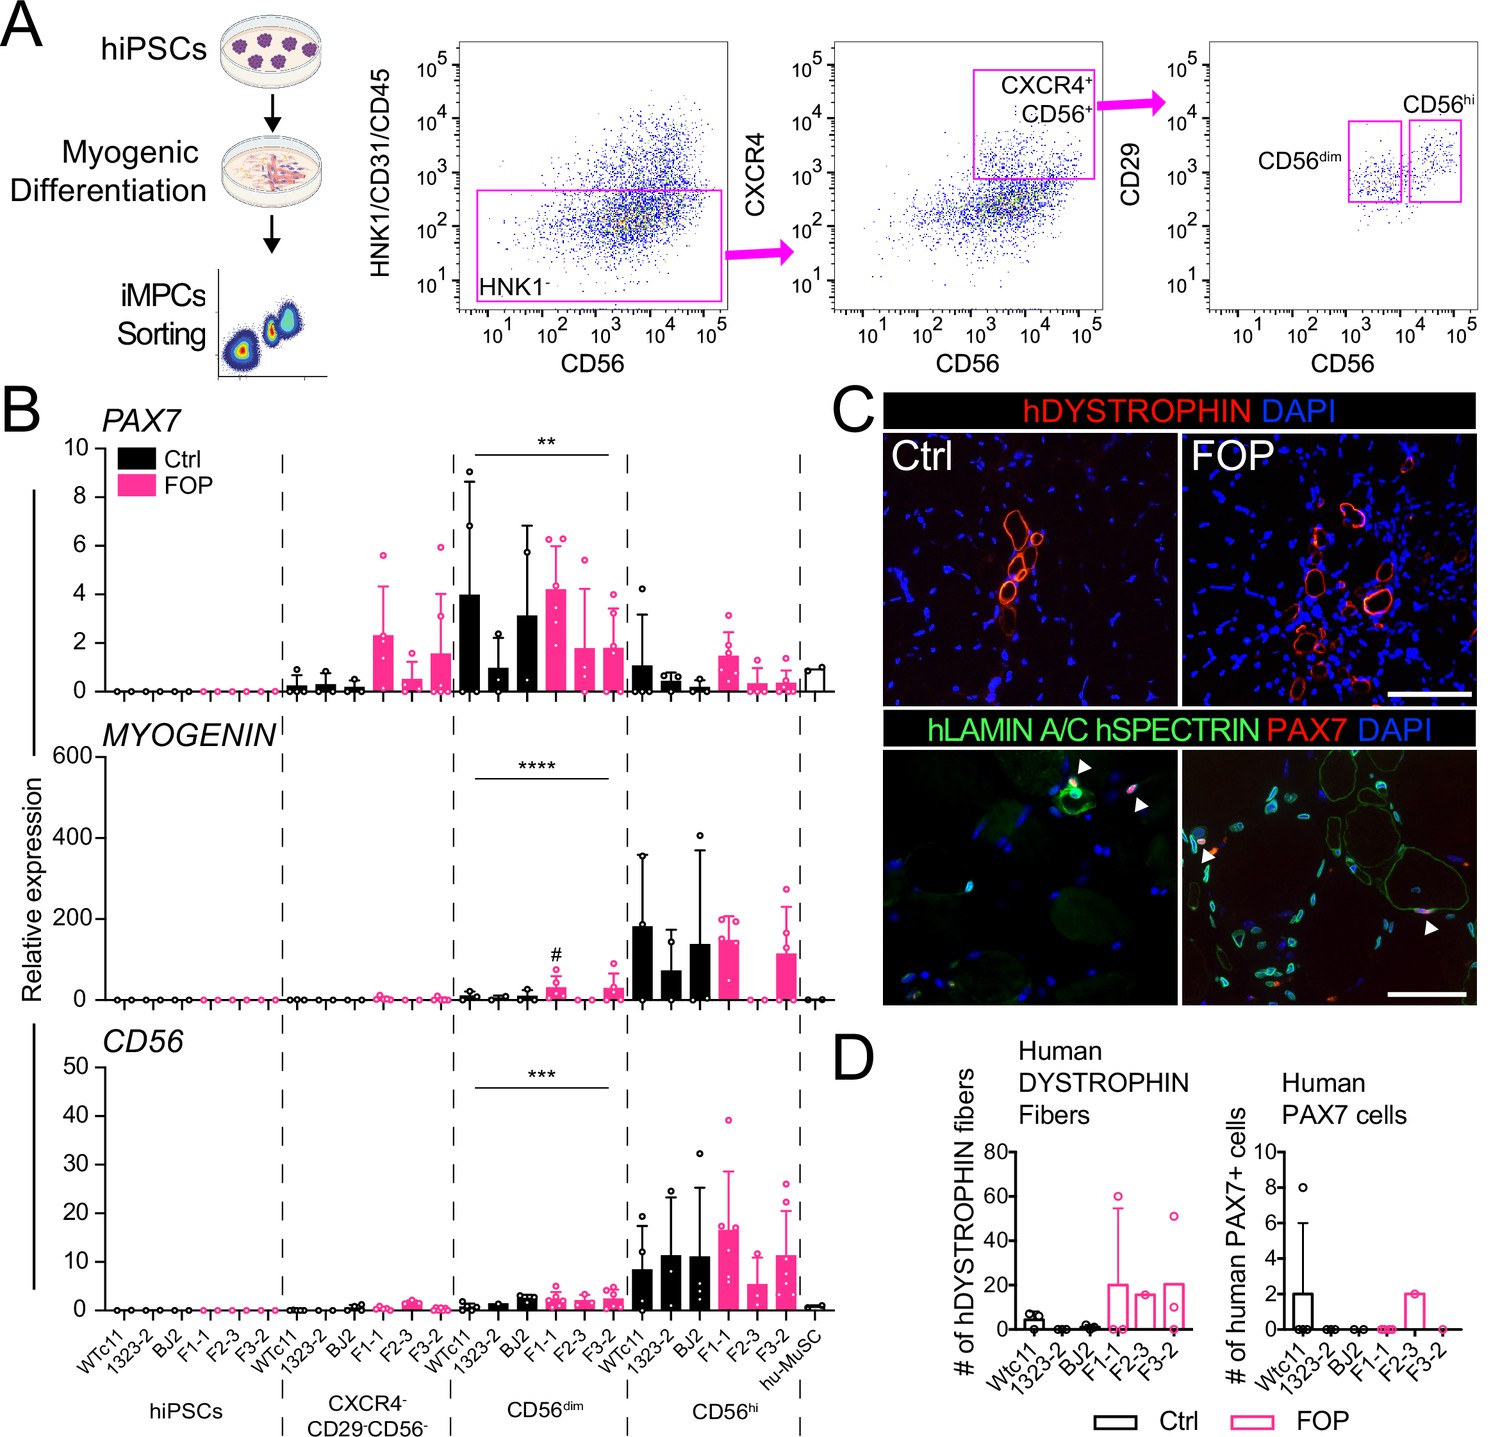
Isolation and transplantation of PAX7-expressing cells from hiPSC muscle differentiation culture.
hiPSCs were differentiated into iMPCs until day 50 and sorted via flow cytometry. (A) Gating strategy. (B) Myogenic gene expression of CD56dim and CD56hi cells. CD56dim vs CD56hi, n = 6 (3 Ctrl and 3 FOP lines) biological replicates, ** p < 0.01, *** p < 0.001, **** p < 0.0001. No significant differences were found between control and FOP lines. (C) Representative human DYSTROPHIN (top, 200 µm scale bar), and human LAMIN A/C, human SPECTRIN, and PAX7 (bottom, 100 µm scale bar) immunohistochemistry of NSG mice anterior tibialis, where sorted iMPCs were transplanted. White arrows show engrafted hiPSC-derived muscle stem cells. (D) Quantification of human DYSTROPHIN fibers and human PAX7 cells at week 5 after transplant (n = 3 biological replicates). Transplantation details are in Figure 3—source data 1.
-
Figure 3—source data 1
hiPSC-derived HNK1-CD45-CD31- CXCR4+CD29+CD56dim cell transplants.
- https://cdn.elifesciences.org/articles/66107/elife-66107-fig3-data1-v2.docx
Figure 3—figure supplement 1
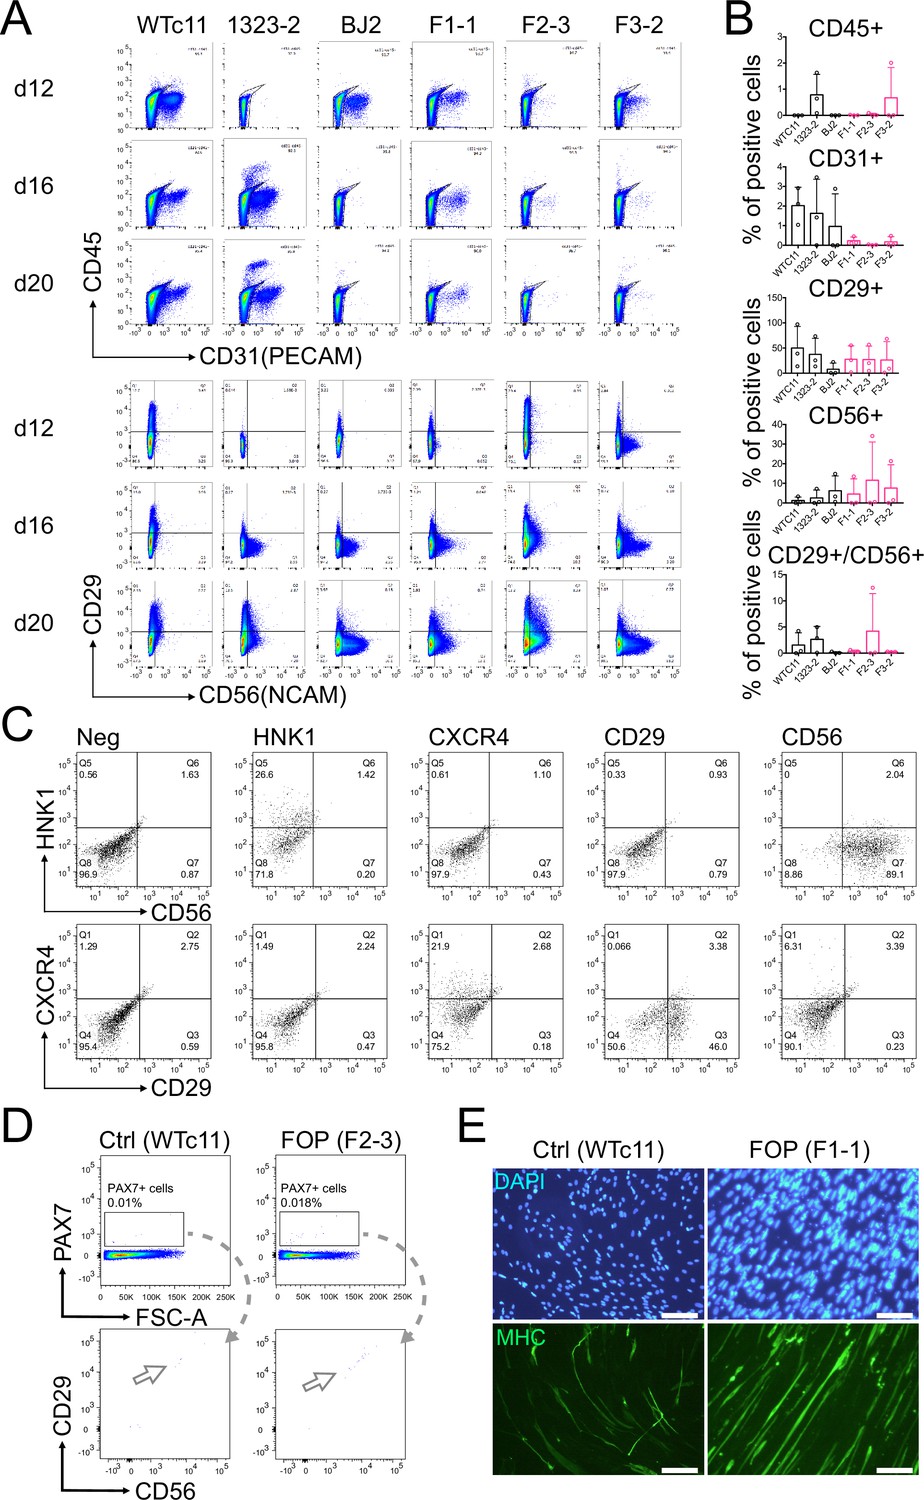
Differentiated cell types in the myogenic differentiation varies between cell lines, sorted cells express PAX7 and can differentiate into myotubes.
(A) Representative flow cytometry profiles of negative (CD45 and CD31) and positive (CD29 and CD56) markers used to purify muscle stem cells. (B) Quantification of the percentage of cells positive for CD45, CD31, CD29, and CD56 at day 20. (n = 3 biological replicates and n = 3 technical replicates). Error bars represent mean and SD. (C) FACS plots for the single staining controls. (D) FACS analysis of the myogenic differentiation at day 50. Cells were stained for PAX7, CD29, and CD56. (E) Representative immunofluorescence staining for MHC showing of sorted iMPCs after being cultured in differentiation media for 7 days (200 µm scale bar).
Figure 4 with 1 supplement
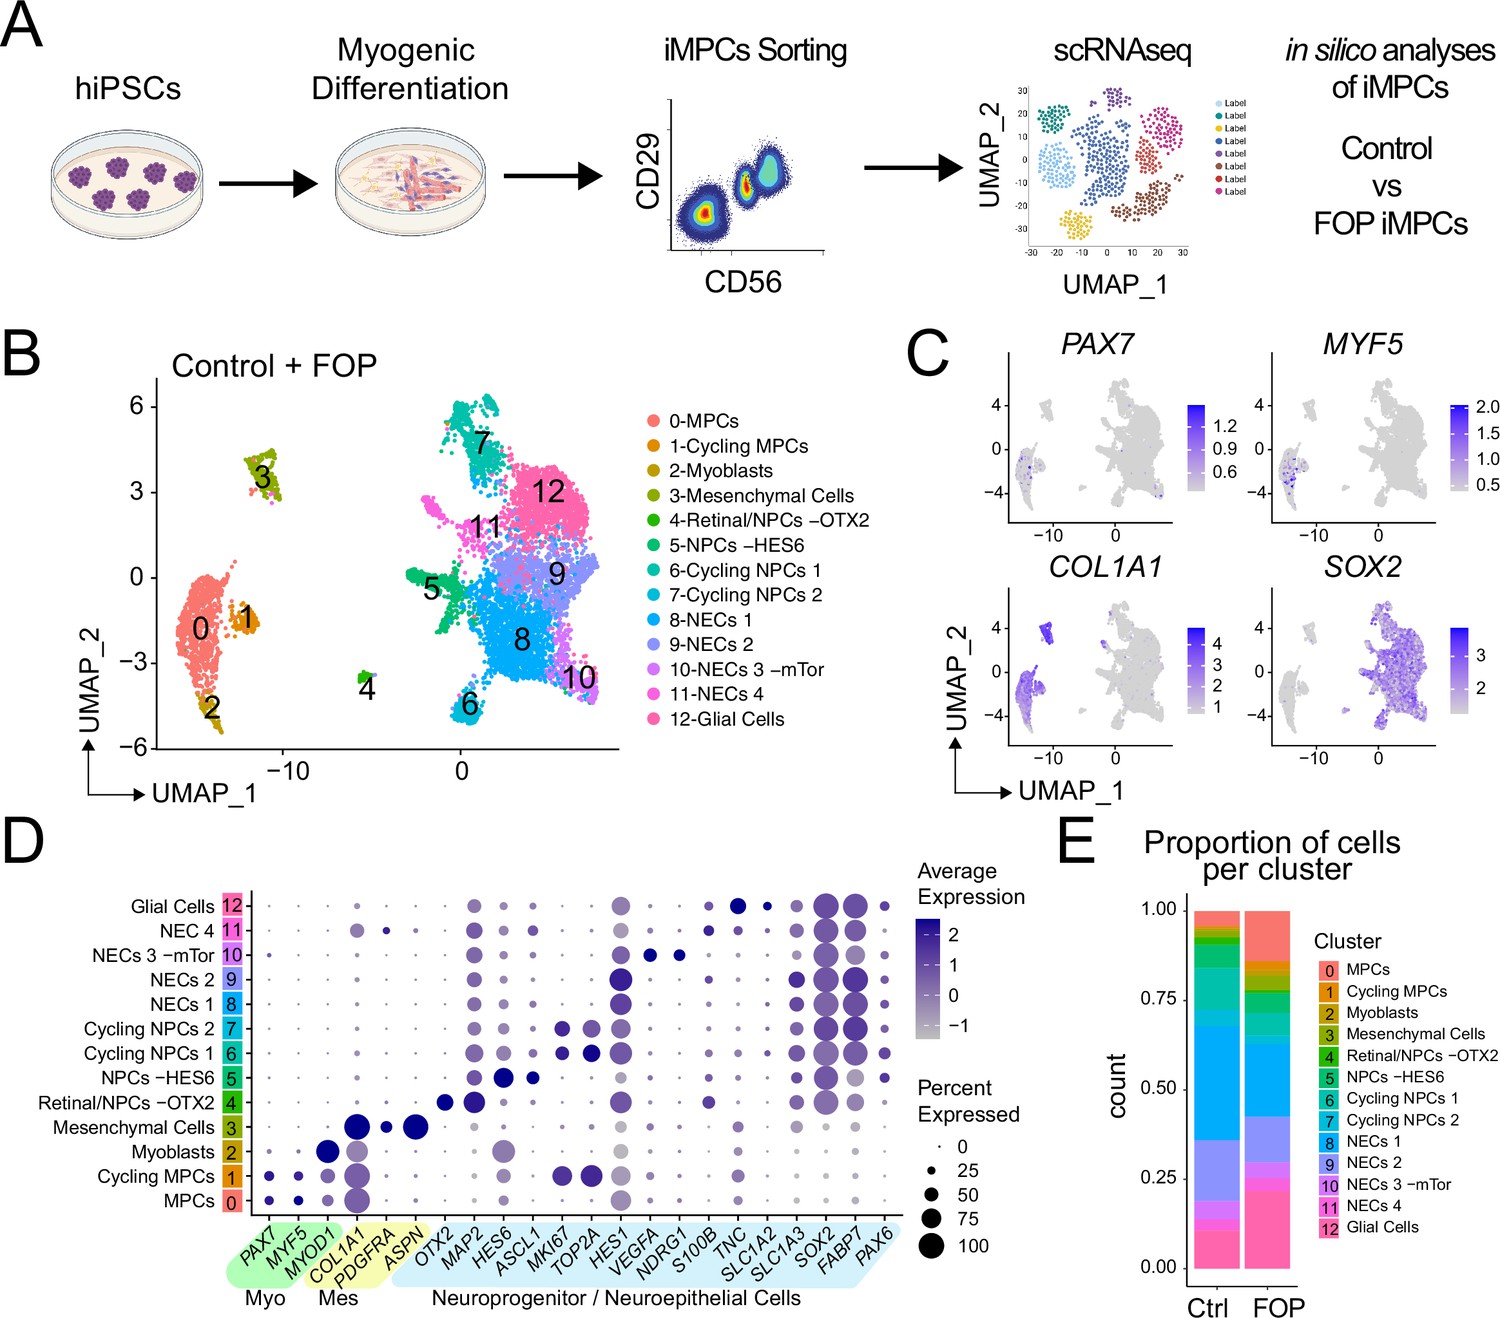
Single-cell RNA sequencing of HNK1-CD45-CD31-CXCR4+CD29+CD56dim cells.
(A) Schematic of differentiating hiPSCs, sorting of iMPCs, and scRNAseq. (B) UMAP visualization plots of cells combined from both control and FOP samples. Cell types were assigned based on the expression of marker genes (Figure 4—figure supplement 1), MPC (muscle progenitor cells), NPCs (neuroprogenitor cells) and NECs (neuroepithelial cells). (C) Feature expression plots showing the localization of cells expressing myogenic markers (PAX7, MYF5), mesenchymal (COL1A1), and neural cell marker (SOX2). (D) Dot plot displaying expression genes associated with myogenesis, mesenchymal and neurogenesis markers. (E) Proportion of cells per cluster for each sample.
-
Figure 4—source data 1
Quality control information for each sample.
- https://cdn.elifesciences.org/articles/66107/elife-66107-fig4-data1-v2.docx
Figure 4—figure supplement 1
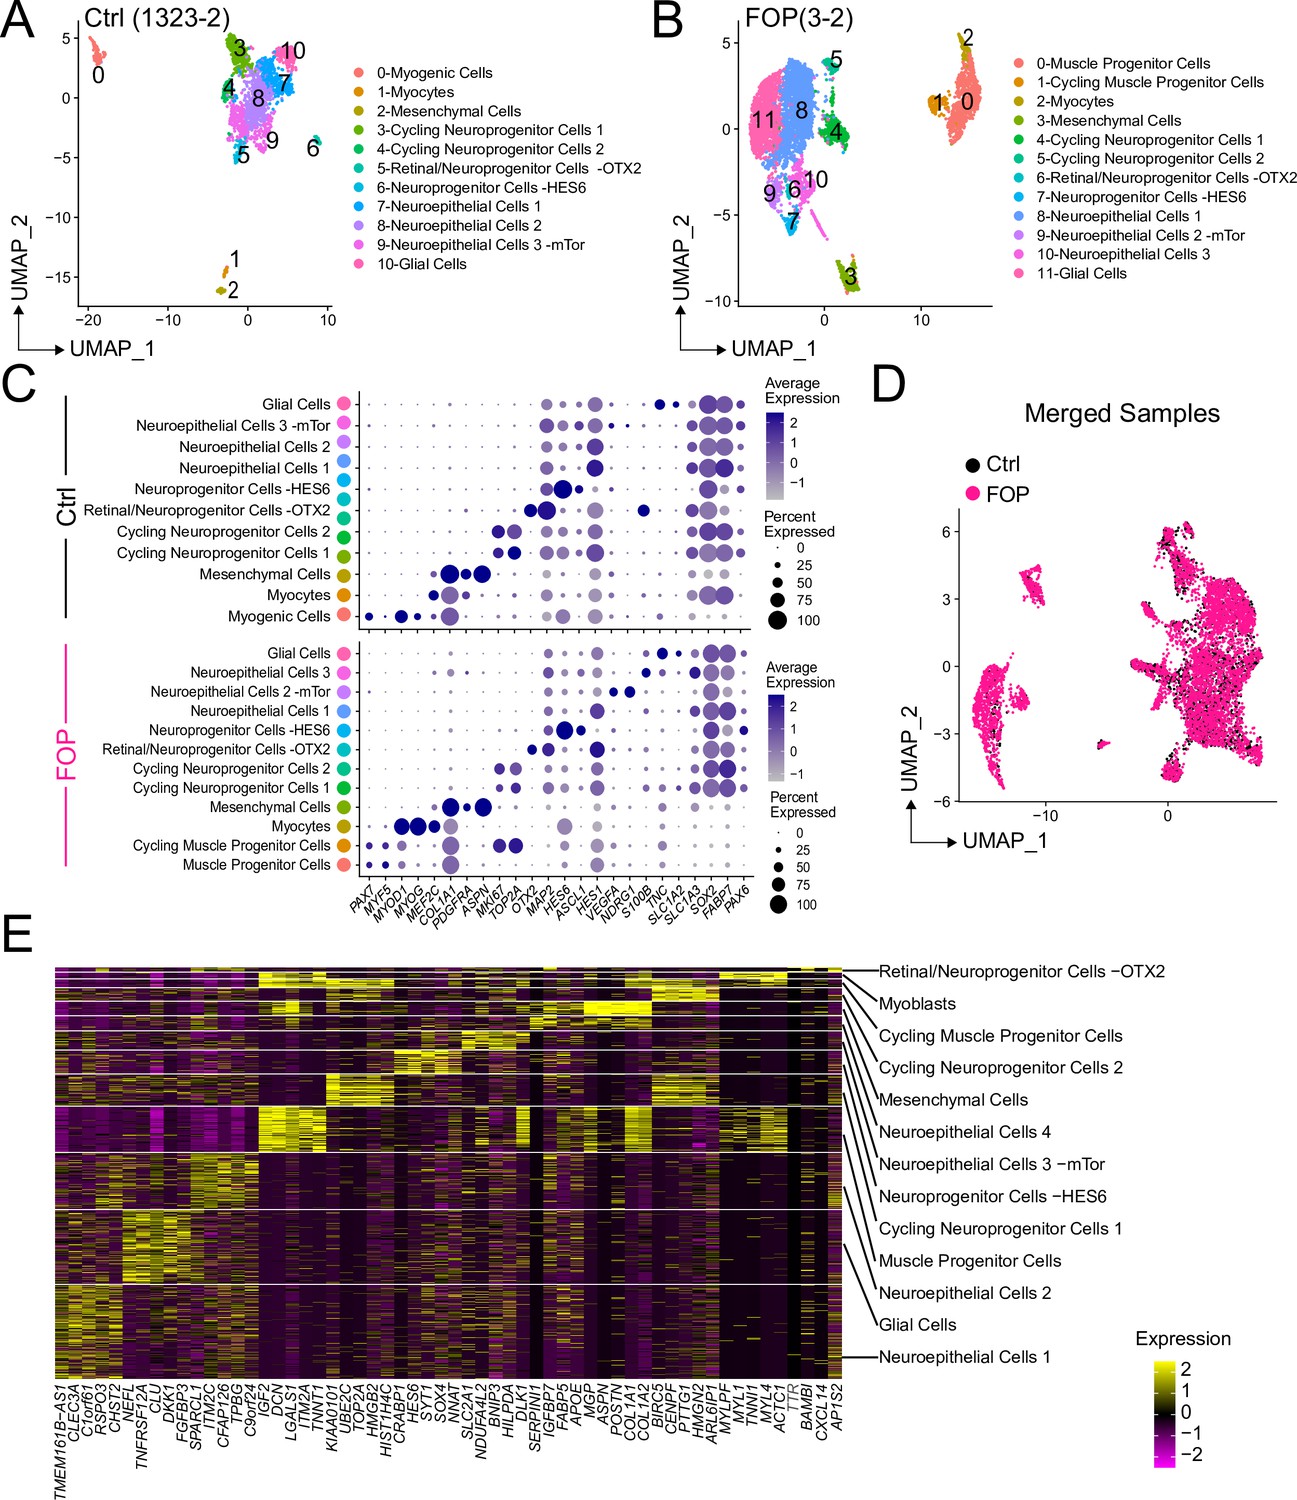
Markers expressed in sorted control and FOP HNK1-CD45-CD31- CXCR4+CD29+CD56dim cells.
(A–B) UMAP visualization plots of cells from control (A) and FOP (B). (C) Dot plot displaying expression genes associated with each cluster for the control (top) and FOP (bottom) sample. (D) UMAP visualization plots of merged samples with cells colored by samples. (E) Heat map of the top five differentially expressed genes in each cluster of the merged sample analysis.
Figure 5 with 1 supplement
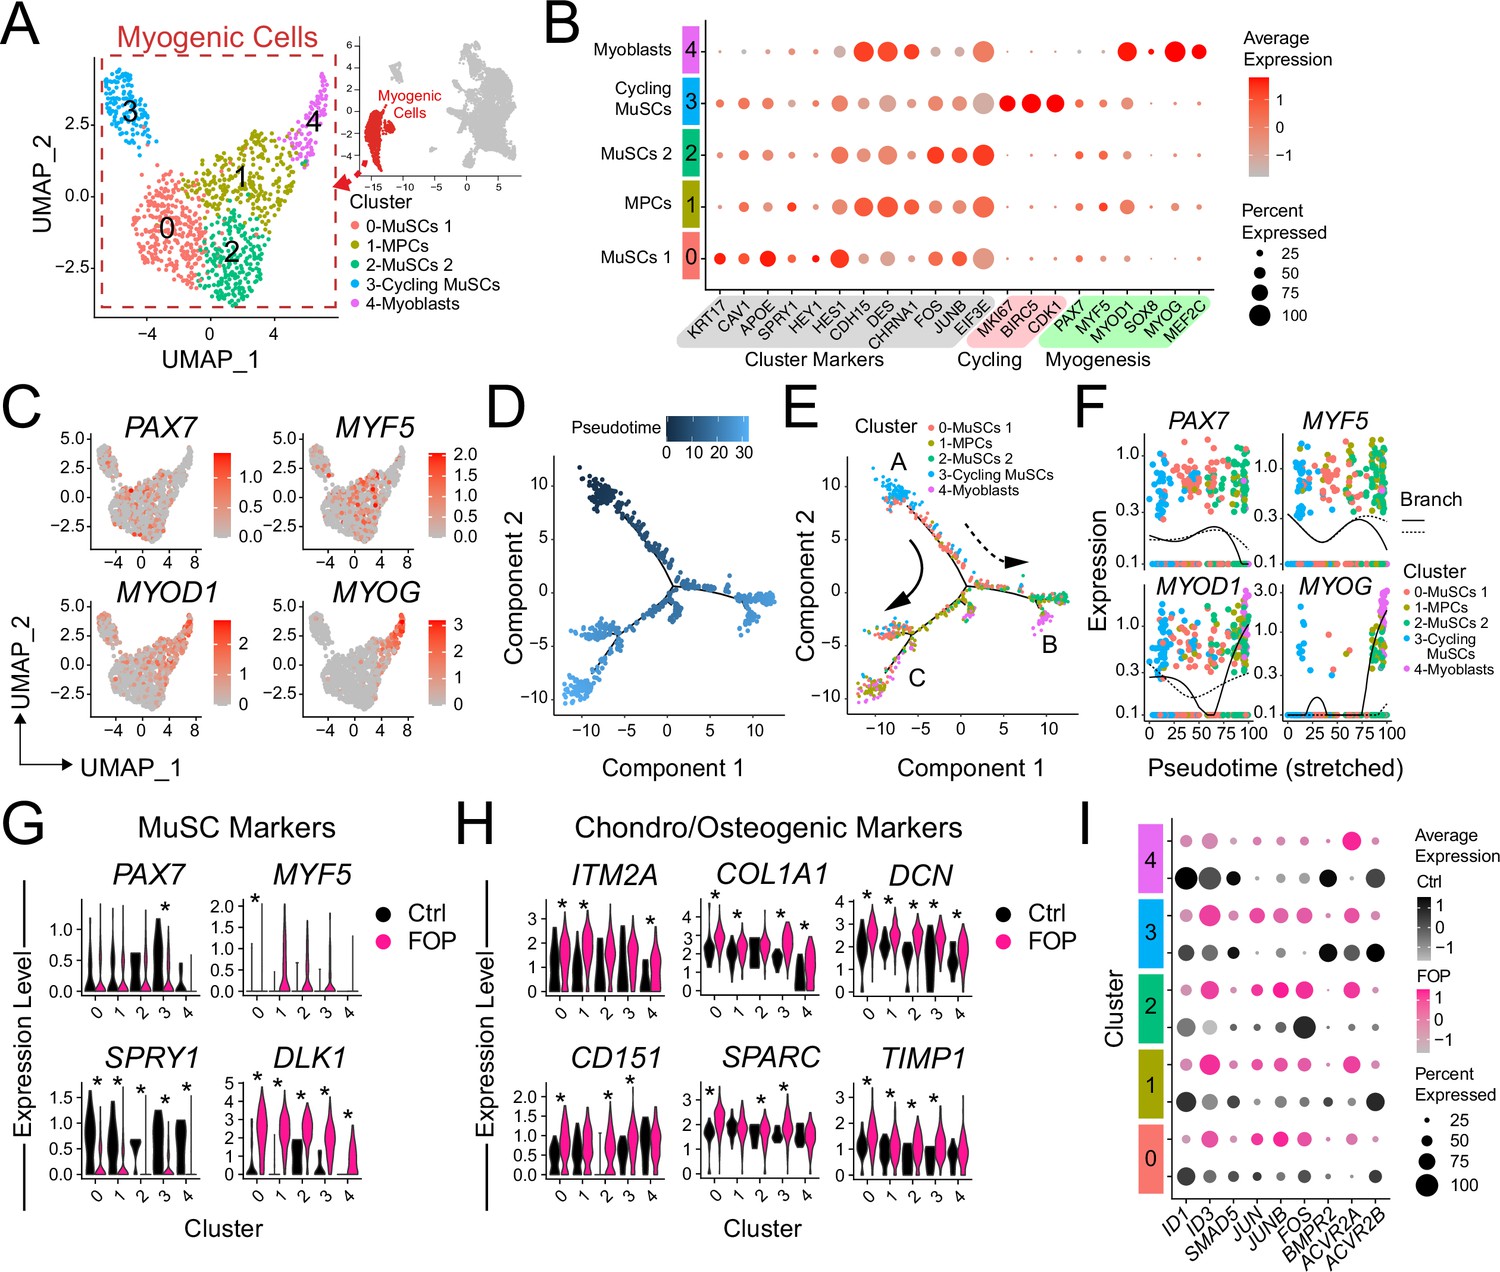
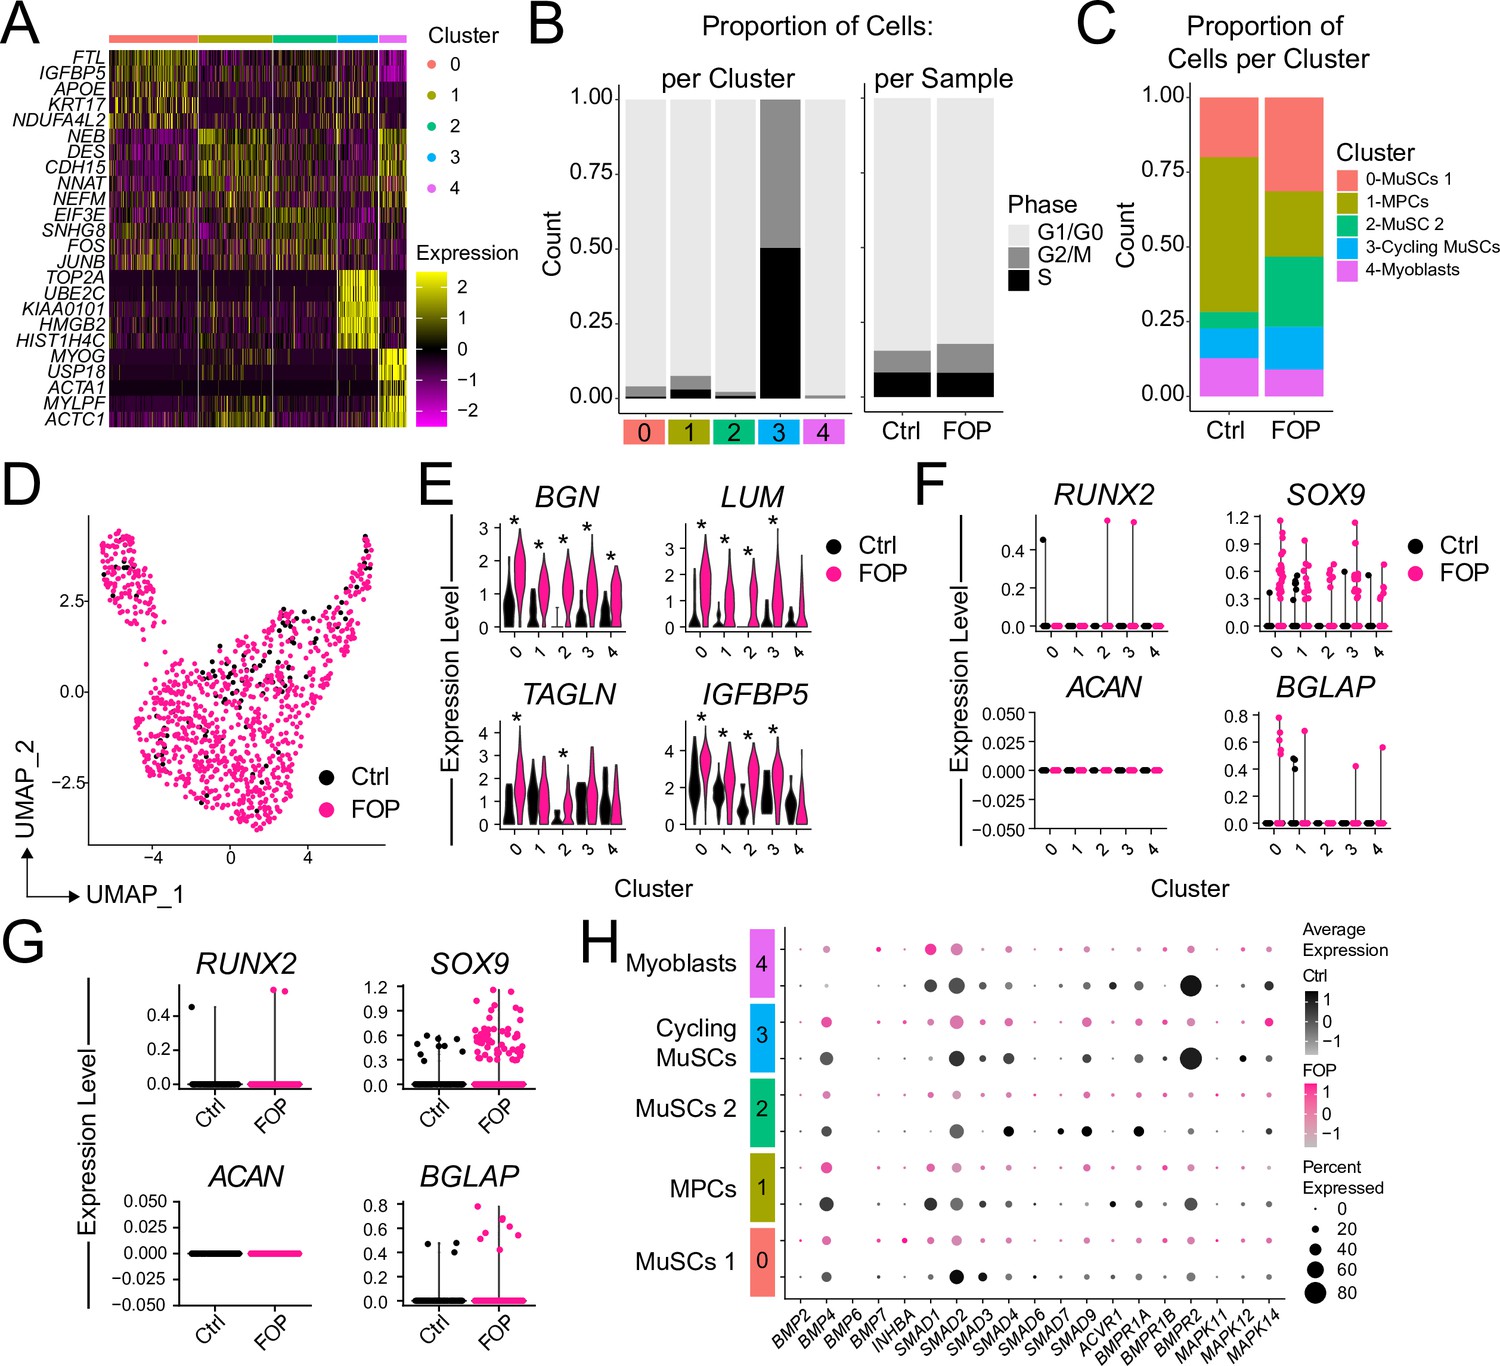
Transcriptional profile of iMPCs.
(A) Identified myogenic clusters (in red) were sub-clustered from the other clusters (neurogenic and mesenchymal) and re-analyzed. UMAP of the new myogenic subclusters was generated. (B) Dot plot displaying expression of cluster defining genes. (C) Feature expression plots of myogenic markers. (D) Myogenic cells were ordered as a function of pseudotime using the Monocle package. (E) Pseudotime trajectory plot of myogenic clusters.Arrows represents the direction and major branches of the pseudotime. Branches A-C are marked with letters along the trajectories. (F) Gene plots displaying the expression of specific myogenic genes as a function of pseudotime. (G–H) Violin plots of myogenic (G) and chondro/osteogenic genes (H) that were significantly differentially expressed. Violin plot width depicts the larger probability density of cells expressing each particular gene at the indicated expression level. *, significantly different following differential expression testing using the Wilcoxon rank sum test per cluster. (I) SMAD and P38MAPK pathway markers significantly differentially expressed between control and FOP myogenic cells. p values for (G–H) are in Figure 5—source data 1.
-
Figure 5—source data 1
Differential expression analysis of control and FOP myogenic cells.
- https://cdn.elifesciences.org/articles/66107/elife-66107-fig5-data1-v2.xlsx
Figure 5—figure supplement 1
Analysis of the myogenic sub-clusters.
(A) Heat map of the top five differentially expressed genes in each cluster. (B) Cycle genes were scored for each cluster. Bar plot depicting the proportion of cells in G1/G0, G/2 M and S phase for each cluster (left) and for each sample (right). (C) Proportion bar graph of cells per cluster for the control and FOP samples. (D) UMAP showing the distribution of the two merged samples. (E) Violin plots of additional genes significantly differentially expressed by more than onefold and (F) Chondro/osteogenic genes per cluster and per sample (G). (H) Dot plot displaying the expression of genes associated with BMP and P38MAPK pathways for each cluster.
Figure 6 with 1 supplement
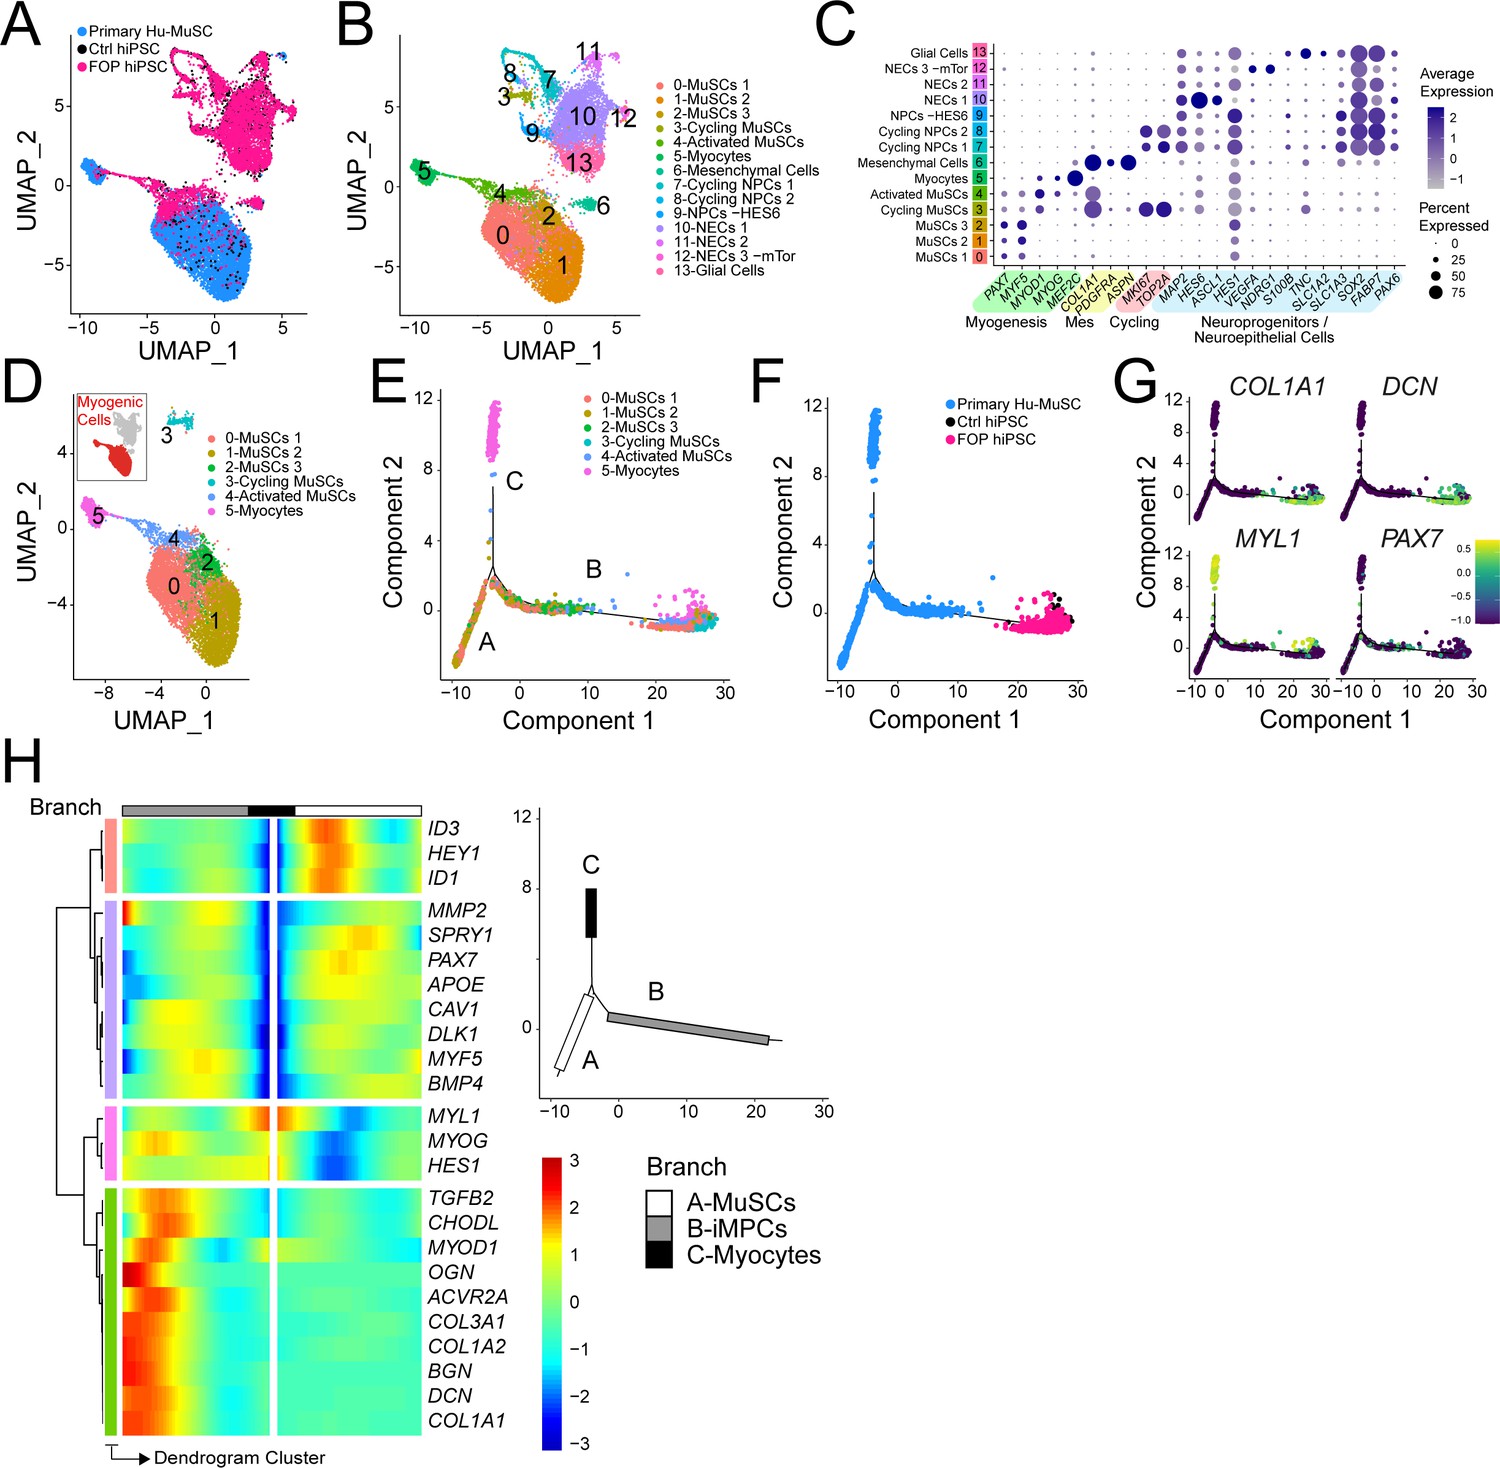
iMPC transcriptional signature compared to human primary muscle stem cells.
(A–B) UMAP of cells combined from human primary muscle stem cells (vastus muscle) and the control and FOP samples. (A) UMAP showing the distribution of cells per sample, and (B) with clusters labeled. (C) Dot plot displaying expression of cluster defining genes. (D) Myogenic cells (in red) are comprised in cluster 0–5. UMAP of the myogenic clusters. (E–G) Pseudotime trajectory plot generated via Monocle analysis depicting all myogenic clusters (E) and samples (F). (G) Level of expression of ECM/osteogenic genes along the cell trajectories. (H) Heatmap representing genes that are significantly branch dependent using the BEAM analysis (Figure 6—source data 1) and also genes that have similar lineage-dependent expression patterns. Branches are shown in the upper right panel.
-
Figure 6—source data 1
BEAM analysis.
- https://cdn.elifesciences.org/articles/66107/elife-66107-fig6-data1-v2.xlsx
Figure 6—figure supplement 1
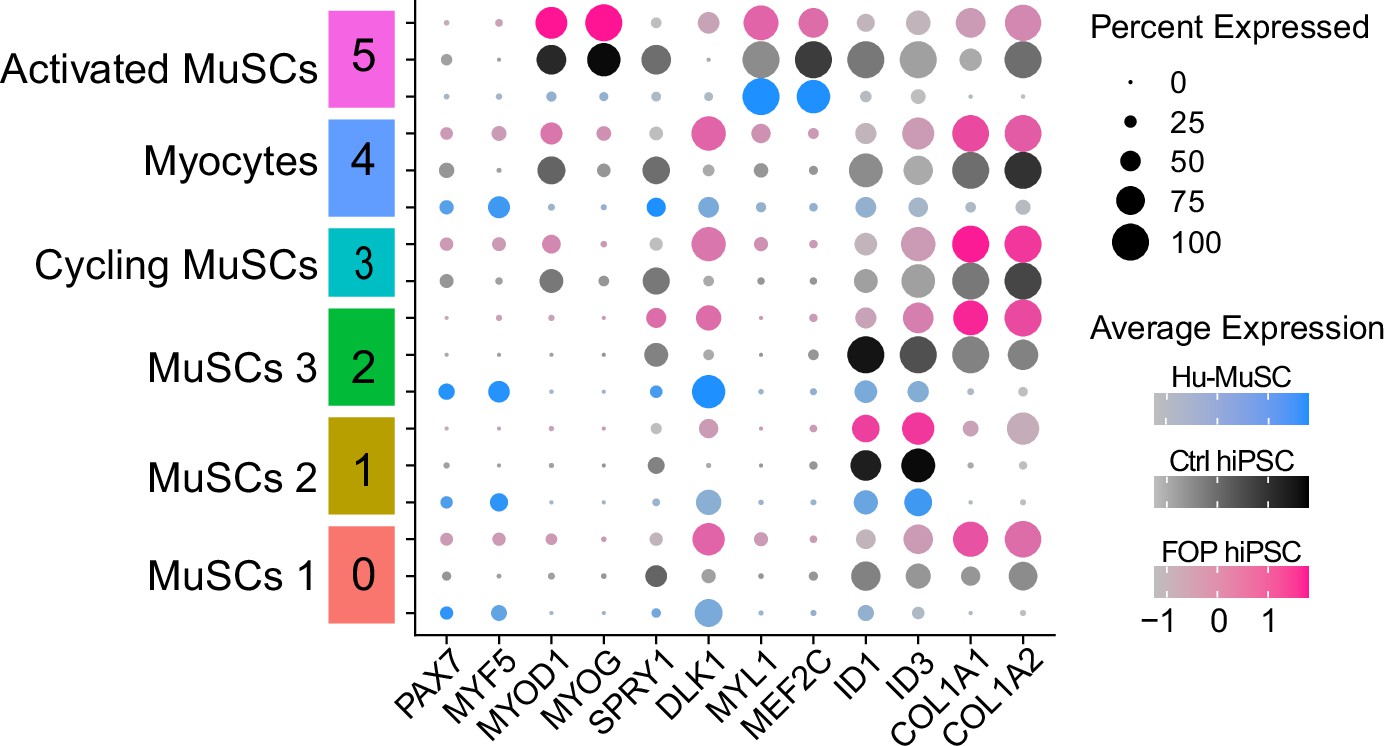
Expression of myogenic markers across primary and hiPS-derived myogenic cells.
Dot plot displaying the average expression and the percent of cells expressing myogenic genes across clusters for the three merged samples.
Figure 7
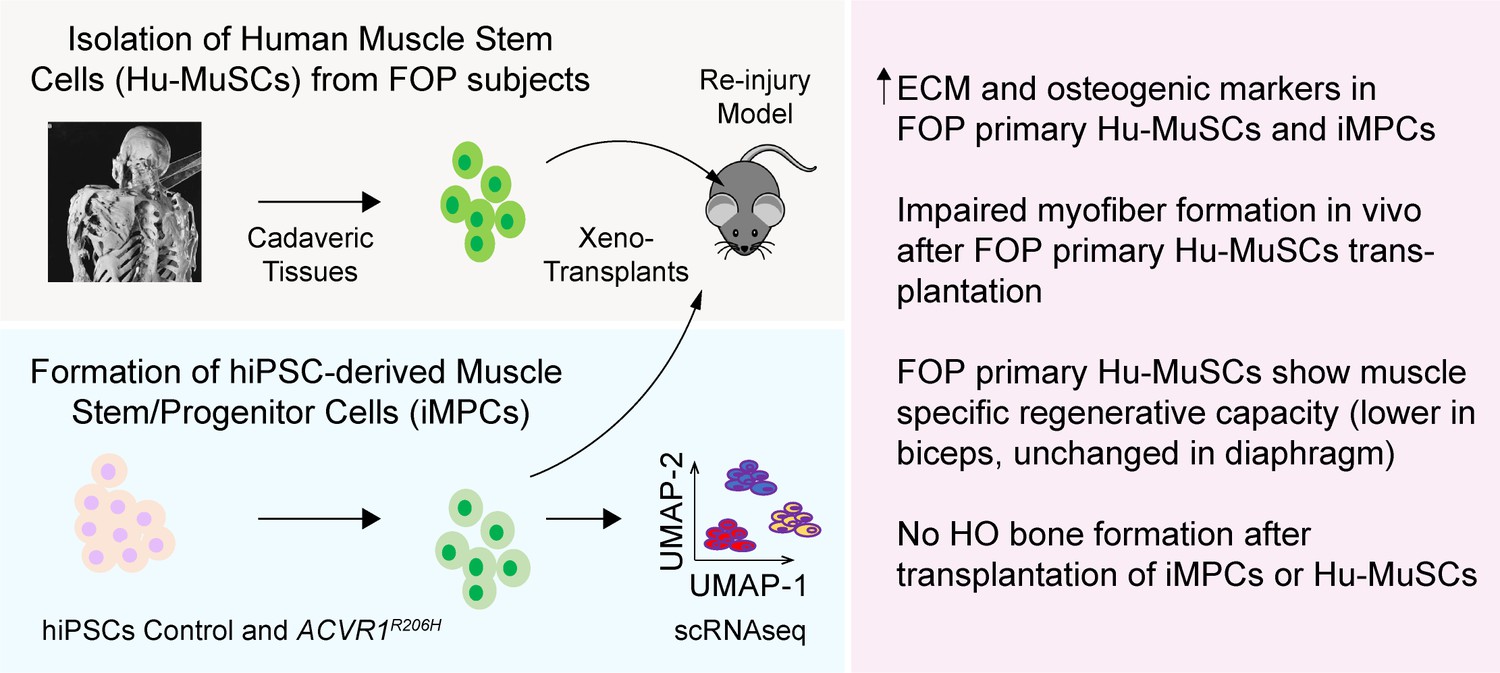
Testing the role of activated ACVR1 signaling in muscle repair.
FOP iMPCs and FOP primary human muscle stem cells are used for modeling muscle stem cell engraftment and regeneration properties.
Videos
Video 1
Myotube contraction of differentiated Control (1323-2) hiPSCs.
Video 2
Myotube contraction of differentiated FOP (F1-1) hiPSCs.
Tables
Key resources table
| Reagent type (species) or resource | Designation | Source or reference | Identifiers | Additional information |
|---|---|---|---|---|
| Strain, strain background (Mus musculus) | NOD.Cg-Prkdcscid Il2rgtm1Wjl/SzJ | https://www.jax.org/strain/005557 | MGI:3577020 | 8–12 weeks old |
| Sequence-based reagent | Human RT-PCR Primers | Applied Biosystems Taqman Assays | ACTBHs01060665_g1 | |
| Sequence-based reagent | Human RT-PCR Primers | Applied Biosystems Taqman Assays | DYSTROPHINHs007758098_m1 | |
| Sequence-based reagent | Human RT-PCR Primers | Applied Biosystems Taqman Assays | PAX7Hs00242962_m1 | |
| Sequence-based reagent | Human RT-PCR Primers | Applied Biosystems Taqman Assays | CD56Hs00941830_m1 | |
| Sequence-based reagent | Human RT-PCR Primers | Applied Biosystems Taqman Assays | MYOD1Hs00159528_m1 | |
| Sequence-based reagent | Human RT-PCR Primers | Applied Biosystems Taqman Assays | MYF5Hs00929416_g1 | |
| Sequence-based reagent | Human RT-PCR Primers | Applied Biosystems Taqman Assays | MYOGENIN Hs01072232_m1 | |
| Sequence-based reagent | Human RT-PCR Primers | Applied Biosystems Taqman Assays | COL1A1Hs01076780_g1 | |
| Sequence-based reagent | Human RT-PCR Primers | Applied Biosystems Taqman Assays | ID1Hs03676575_s1 | |
| Sequence-based reagent | Human RT-PCR Primers | Applied Biosystems Taqman Assays | ID3Hs00954037_g1 | |
| Antibody | Anti-Human DYSTROPHIN (mouse monoclonal) | DSHB | AB_2618157 | IF(1:10) |
| Antibody | Anti-Human/Mouse DYSTROPHIN (mouse monoclonal) | Thermofisher | AB_10978300 | IF(1:500) |
| Antibody | Anti-Human/Mouse PAX7 (mouse monoclonal) | DSHB | AB_528428 | IF(1:10) |
| Antibody | Anti-Human/Mouse MHC (mouse monoclonal) | DSHB | AB_2147781 | IF(1:100) |
| Antibody | Anti-LAMININ (rabbit polyclonal) | Sigma-Aldrich | AB_477163 | IF(1:250) |
| Antibody | Anti-Human SPECTRIN (mouse monoclonal) | Leica Microsystems | AB_442135 | IF(1:100) |
| Antibody | Anti-Human LAMIN A/C (mouse monoclonal) | Vector Laboratories | AB_2336546 | IF(1:100) |
| Antibody | Anti-Human CD31 (Beads) (Mouse monoclonal) | Miltenyi Biotec | 130-091-935 | 2 μl |
| Antibody | Anti-Human CD45 (Beads, mouse monoclonal) | Miltenyi Biotec | AB_2783001 | 5 μl |
| Antibody | Anti-Human CD31 AF450(WM-59, mouse monoclonal) | Ebioscience | AB_10854276 | 5 μl |
| Antibody | Anti-Human CD34 eFluor450(4H11, mouse monoclonal) | Ebioscience | AB_10733282 | 5 μl |
| Antibody | Anti-Human CD45 AF450(30-F11, mouse monoclonal) | Ebioscience | AB_1518806 | 5 μl |
| Antibody | Anti-Human CD29 FITC(TS2/16, mouse monoclonal) | Ebioscience | AB_2043830 | 8 μl |
| Antibody | Recombinant human anti-CD56 APC-vio-770 (REA196) | Miltenyi Biotec | AB_2733136 | 8 μl |
| Antibody | Anti-Human CXCR4 PE(12G5, mouse monoclonal) | Ebioscience | AB_10669164 | 8 μl |
| Antibody | Anti-Human HNK1 PE (TB01, mouse monoclonal) | Ebioscience | AB_10804531 | 5 μl |
| Antibody | Anti-Human CD45 PE(30-F11, mouse monoclonal) | Ebioscience | AB_465668 | 5 μl |
| Antibody | Anti-Human CD31 PE(390, mouse monoclonal) | Ebioscience | AB_465632 | 5 μl |
| Antibody | Anti-Human CD56 APC (CMSSB, mouse monoclonal) | Ebioscience | AB_10854573 | 5 μl |
| Antibody | Anti-Human CXCR4 PE-Cy7 (12G5, mouse monoclonal) | Ebioscience | AB_1659706 | 5 μl |
| Antibody | FcR block | Miltenyi Biotec | AB_2892112 | 5 μl |
| Software, algorithm | GraphPad Prism | GraphPad Prism (https://graphpad.com) | SCr_002798 | |
| Software, algorithm | Seurat (3.1.5) | https://satijalab.org/seurat/ | SCR_007322 | SCR_021002 |
| Software, algorithm | Monocle (2.12.0) | http://cole-trapnell-lab.github.io/monocle-release/ | SCR_016339 | |
| Software, algorithm | cellranger | https://support.10xgenomics.com/single-cell-gene-expression/software/pipelines/latest/feature-bc | SCR_021002 | |
| Software, algorithm | FlowJo | https://www.flowjo.com | SCR_008520 |
Additional files
-
Transparent reporting form
- https://cdn.elifesciences.org/articles/66107/elife-66107-transrepform1-v2.docx
-
Source code 1
hiPSCs samples integration.
- https://cdn.elifesciences.org/articles/66107/elife-66107-supp1-v2.zip
-
Source code 2
Myogenic sub-clustering.
- https://cdn.elifesciences.org/articles/66107/elife-66107-supp2-v2.zip
-
Source code 3
Pseudotime analyses.
- https://cdn.elifesciences.org/articles/66107/elife-66107-supp3-v2.zip
-
Source code 4
Primary Hu-MuSCs/hiPSCs integration.
- https://cdn.elifesciences.org/articles/66107/elife-66107-supp4-v2.zip
Download links
A two-part list of links to download the article, or parts of the article, in various formats.
Downloads (link to download the article as PDF)
Open citations (links to open the citations from this article in various online reference manager services)
Cite this article (links to download the citations from this article in formats compatible with various reference manager tools)
Modeling the ACVR1R206H mutation in human skeletal muscle stem cells
eLife 10:e66107.
https://doi.org/10.7554/eLife.66107


