An epigenetic switch regulates the ontogeny of AXL-positive/EGFR-TKi-resistant cells by modulating miR-335 expression
- Cold Spring Harbor Laboratory, United States
- Faculty of Pharmacy University of Ljubljana, Slovenia
- Graduate Program in Molecular and Cellular Biology, Stony Brook University, United States
- Icahn School of Medicine at Mount Sinai, Hess Center for Science and Medicine, United States
- Graduate Program in Biomedical Engineering, Stony Brook University, United States
- Northwell Health Long Island, Jewish Medical Center, United States
- Cancer Research UK – Cambridge Institute, University of Cambridge, United Kingdom
- Watson School of Biological Sciences, Cold Spring Harbor Laboratory, United States
Figures
Figure 1 with 1 supplement
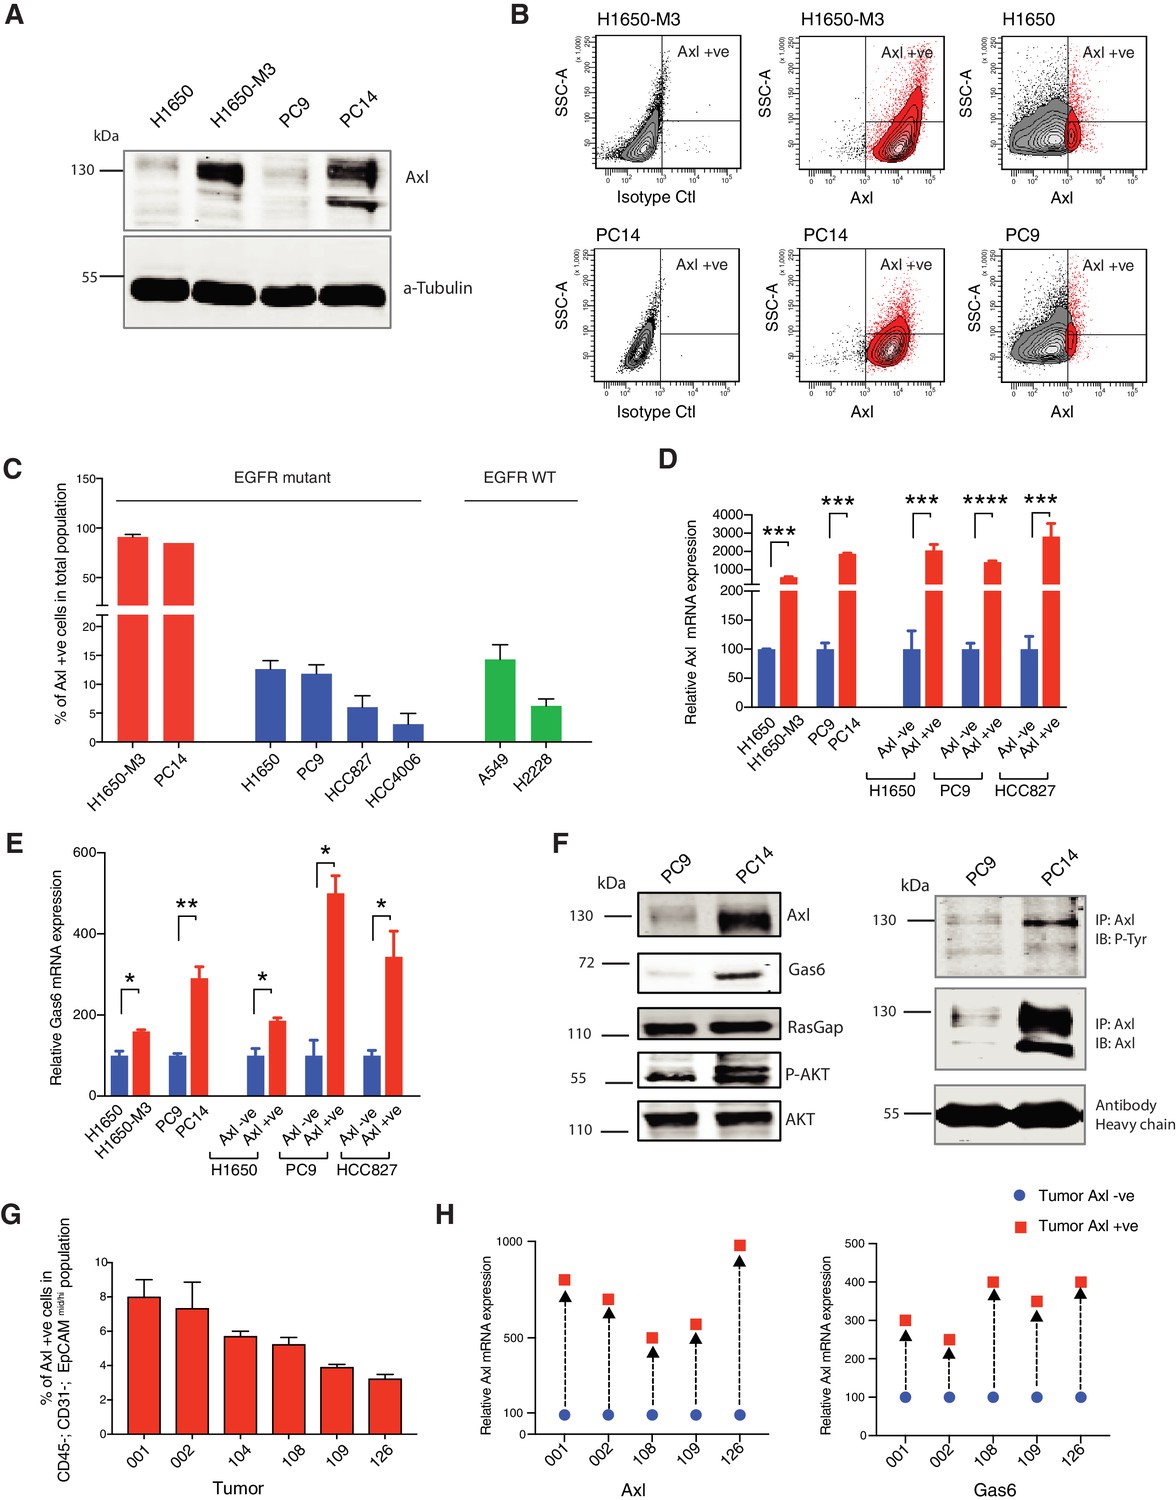
AXL-positive cells are pre-existing in cell lines and tumors.
(A) Immunoblot analysis of AXL in AXL-positive cells (H1650-M3 and PC14) and AXL-negative cells (H1650 and PC9). α-Tubulin is used as a loading control. (B) Flow cytometry-based analysis of surface expression of AXL in the AXL-positive cell lines (H1650-M3 and PC14) and AXL-negative cells (H1650 and PC9). Monoclonal antibody against the N-terminal of AXL was used for the FACS analysis. Isotype control was used for identifying the AXL-negative population. (C) The chart represents the percentage of AXL-positive cells present in Erlotinib-resistant and Erlotinib-naïve cell lines. Erlotinib-resistant cell lines are indicated in red, Erlotinib naïve EGFR mutant cell lines are indicated in blue, and Erlotinib-naïve EGFR WT cell lines are indicated in green. Each bar represents mean ± SD of three replicates from two independent experiments. (D) The chart represents relative AXL mRNA expression in the indicated cell lines or cells sorted based on surface expression of AXL. Expression in AXL-positive cells was calculated relative to its expression in AXL-negative control cells. mRNA expression was quantified by SYBR-green-based RT-qPCR. Each bar represents mean ± SD of three replicates from two independent experiments (***p<0.0005, ****<0.00005, unpaired t-test). (E) The chart represents relative Gas6 mRNA expression in the indicated cell lines or cells sorted based on surface expression of AXL. Expression in AXL-positive cells was calculated relative to its expression in AXL-negative control cells. mRNA expression was quantified by SYBR-green-based RT-qPCR. Each bar represents mean ± SD of three replicates from two independent experiments (*p<0.05, **<0.005, unpaired t-test). (F) On the left panel, immunoblot analysis of AXL, GAS6, p120 RASGAP (loading control), p-AKT and AKT in AXL-negative (PC9) and AXL-positive (PC14) cells. On the right, cell extracts were immunoprecipitated with anti-AXL antibody and immunoblotted with phospho-tyrosine and AXL antibodies. Antibody heavy chain is shown as a loading control for immunoprecipitation. (G) The chart represents the percentage of AXL-positive cells in six NSCLC patient tumors. Tumor-derived single-cell suspension was stained with antibodies against CD45, CD31, EpCAM, and AXL. CD45-; CD31-; EpCAM+ cells were then FACS sorted for the AXL-positive populations. Each bar represents mean ± SD of three technical replicates. 20,000 cells were analyzed by FACS for each replicate of each sample. Schematic of the FACS sorting is presented in Figure 1—figure supplement 1A. Expression of AXL and GAS6 genes in FACS-sorted AXL-negative (blue) and AXL-positive (red) cells from five human primary NSCLC tumors. mRNA expression was quantified by Cells to CT one-step SYBR-green-based RT-qPCR. The expression of an indicated mRNA in the AXL-positive cells was calculated relative to its expression in AXL-negative cells from the respective tumor. Each dot represents mean ± SD of three replicates.
Figure 1—figure supplement 1
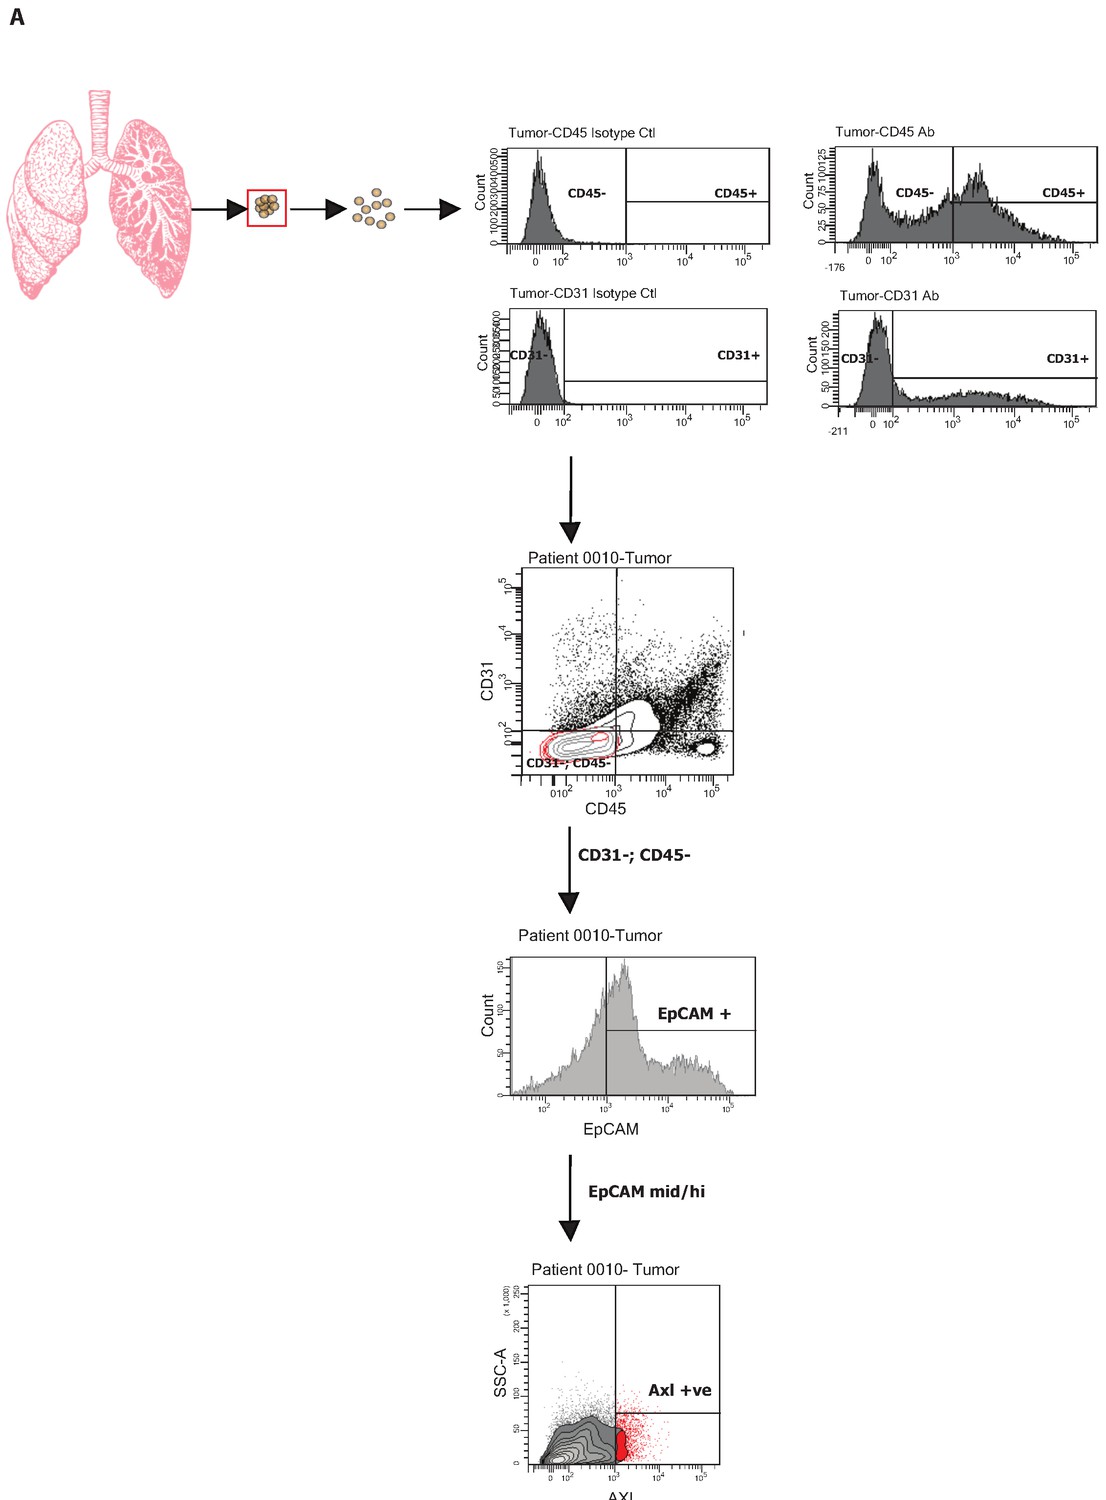
FACS-sorting algorithm utilized to sort human tumors.
Single-cell suspensions generated from resected primary NSCLC were stained with antibodies against CD45, CD31, EpCAM, and AXL. CD45−, CD31−, EpCAM+ cells were then FACS sorted according to the immune types AXL-negative and AXL-positive (shown in red). Isotype controls were used to determine negative populations for each antibody staining.
Figure 2 with 3 supplements
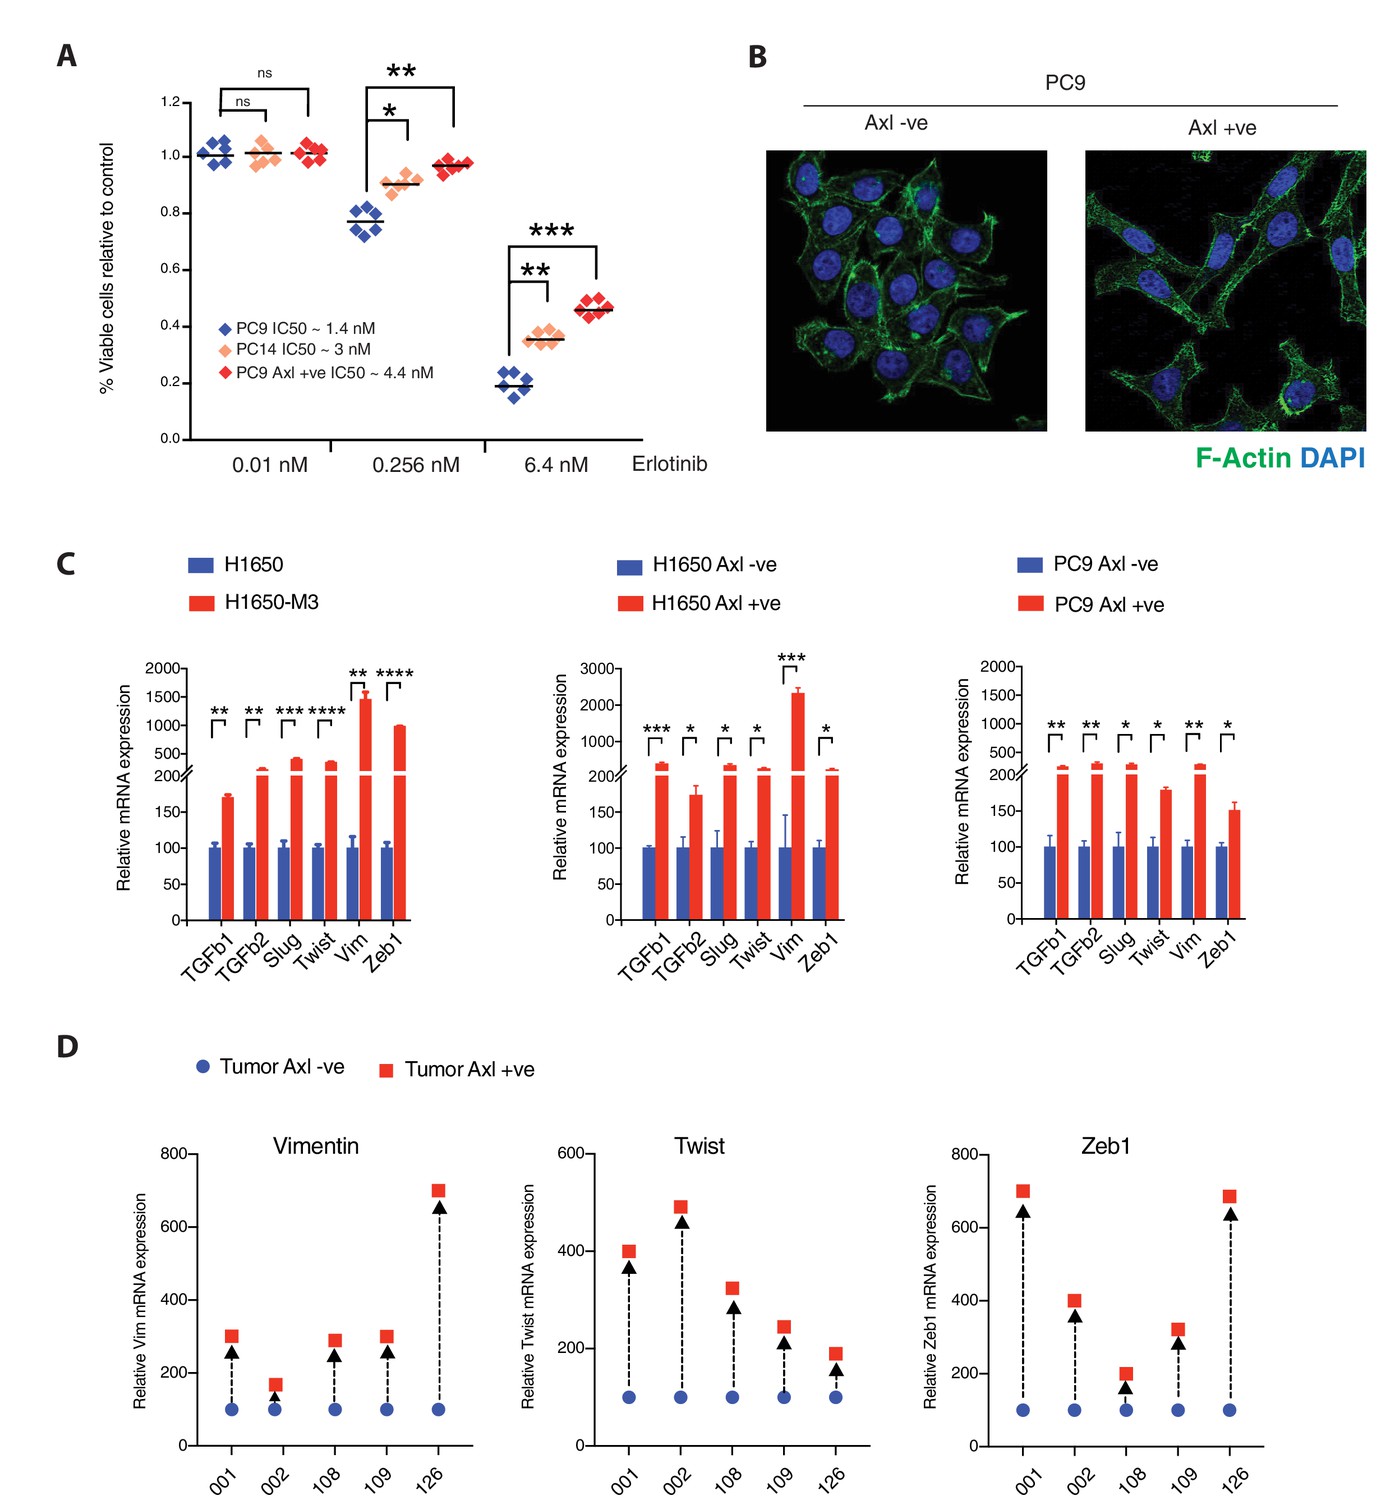
Pre-existing AXL-positive cells have characteristics of Erlotinib-resistant cells.
(A) The chart represents the number of viable cells in PC9, PC14, and AXL-positive cells sorted from PC9 upon treatment with indicated doses of Erlotinib. Values are normalized relative to vehicle-treated cell (control). Cells were grown for 120 hr in the presence of the drug; the number of cells was estimated upon staining with the crystal violet, de-staining in 100 µl of 10% acetic acid and reading absorbance at 590 nm. Diamonds and black bars represent single-point measurements and the mean, respectively (n = 6); (*p< 0.05, **<0.005, ***<0.0005, unpaired t-test). (B) AXL-positive cells are characterized by mesenchymal features such as an increase in stress fibers. AXL-negative and AXL-positive cells sorted from PC9 were stained F-actin with Phalloidin (green). DAPI (blue) was used as a counter-stain. (C) The charts represent the relative expression of the indicated mesenchymal signature genes in H1650, H1650-M3, and cells sorted based on surface expression of AXL from H1650 and PC9. Expression of an indicated mRNA in the AXL-positive cells was calculated relative to its expression in AXL-negative control cells mRNA expression was quantified by SYBR-green-based RT-qPCR. Each bar represents mean ± SD of three replicates from two independent experiments (*p< 0.05, **<0.005, ***<0.0005, ****<0.00005, unpaired t-test). (D) Expression of mesenchymal signature genes VIM, TWIST, and ZEB1 in FACS-sorted AXL-negative (blue) and AXL-positive (red) cells from five human primary NSCLC tumors. mRNA expression was quantified by Cells to CT one-step SYBR-green-based RT-qPCR. The expression of an indicated mRNA in the AXL-positive cells was calculated relative to its expression in AXL-negative cells from the respective tumor. Each dot represents mean ± SD of three replicates.
Figure 2—figure supplement 1

The charts represent changes in the distribution of AXL+ and AXL− cell populations at different Erlotinib concentrations.
(A, B) Variation in the ratio of AXL+ and AXL– cells expressed as a percentage of the total number of cells. The charts in (C and D) indicate changes in the total number of GFP+ and GFP– cells in untreated cells and in cells treated with # of Erlotinib. FACS-sorted AXL+/GFP+ H1650 (A) and AXL+/GFP+ PC9 cells were plated in 96-well plates mixed with approximately equal percentage with AXL-/GFP- H1650 (A) or PC9 (B) as shown. Cells were then grown in the presence of different concentrations of Erlotinib as indicated. The number of GFP+ and GFP– cells was determined by FACS GUAVA 72 hr after treatment. A maximum of 6000 cells was analyzed per each well. Each dot represents mean ± SD of eight replicates. The experiment was repeated twice with similar results. The lower panels represent changes in the number of GFP+ cells (red) and GFP– cells (blue) (*p< 0.05 and ****<0.00005, unpaired t-test).
Figure 2—figure supplement 2

Pre-existing AXL-positive cells have characteristics of Erlotinib-resistant cells.
(A, B) Pre-existent AXL-positive cells preferentially persist during drug treatment. The charts represent the percentage of viable cells in the indicated populations upon treatment with Erlotinib (0.5 μM) (A) and Gefitinib (1 μM) (B). AXL-positive cells were sorted from PC9 and stably infected with lentivirus expressing Td-Tomato. Then AXL-negative and Td-Tom AXL-positive cells were mixed in the mentioned ratio and treated with the EGFR TKIs. Please see the Materials and methods section for further details. (C) AXL-negative and AXL-positive FACS-sorted cells from H1650; parental H1650 and erlotinib selected AXL-positive H1650-M3 cells; PC9 and erlotinib selected AXL-positive PC14 cells were stained with Phalloidin (green) to highlight stress fibers. DAPI (blue) was used as a counter-stain. (D) The chart represents the relative expression of the indicated mesenchymal signature genes in cells sorted based on surface expression of AXL from HCC827. Expression of an indicated mRNA in the AXL-positive cells was calculated relative to its expression in AXL-negative control cells mRNA expression was quantified by SYBR-green-based RT-qPCR. Each bar represents mean ± SD of 3 replicates from two independent experiments (*p<0.05, **<0.005, ***<0.0005, ****<0.00005, unpaired t-test). (E) Pharmacological inhibition of AXL leads to significant mesenchymal to epithelial transition specifically in AXL-positive cells. The charts represent the expression of E-cadherin and Vimentin in AXL-positive (H1650-M3) cells and AXL-negative (H1650) cells upon treatment with the AXL inhibitor BMS-777607 at the indicated concentration. mRNA expression was quantified by SYBR-green-based RT-qPCR. Each bar represents mean ± SD of 3 replicates from two independent experiments (*p<0.05, unpaired t-test). ns = non-significant.
Figure 2—figure supplement 3
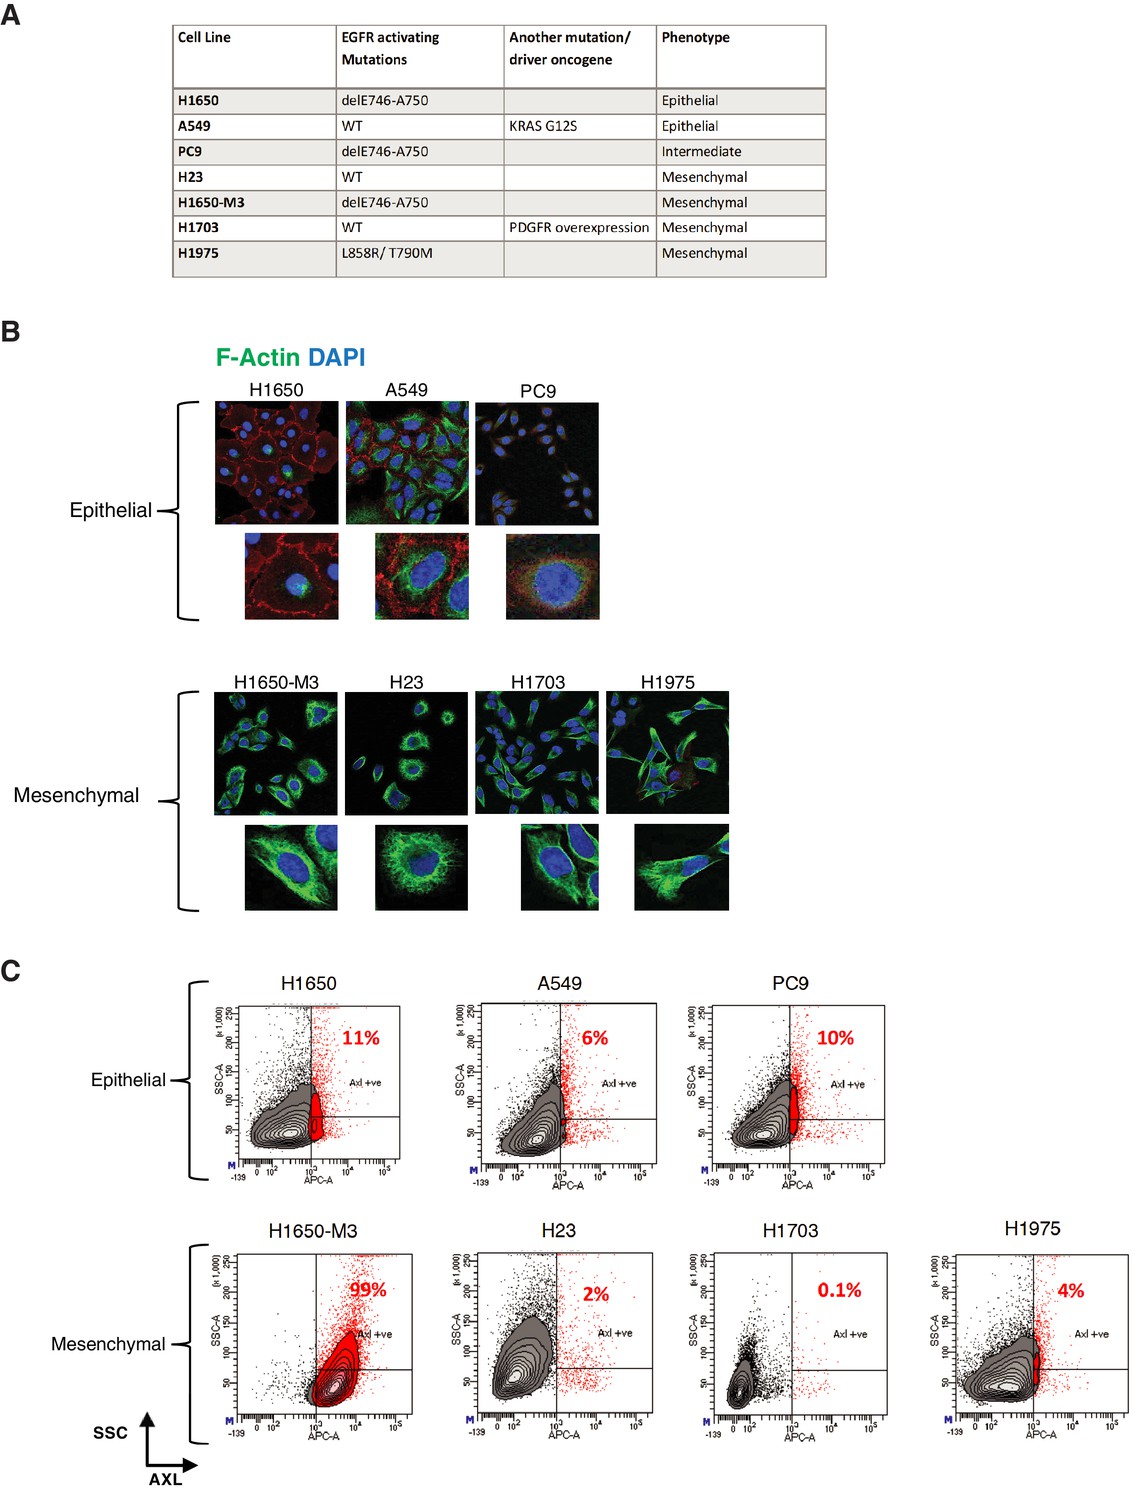
AXL-positive cells are a unique cell population.
(A) The table summarizes the molecular characteristics of the indicated panel of NSCLC cell lines. (B) The cells were stained with antibodies against E-cadherin (RED) and Vimentin (Green) to verify their epithelial or mesenchymal cell state. DAPI (blue) was used as a counter-stain. (C) Flow cytometry-based analysis of surface expression of AXL in the panel of NSCLC cell lines to determine the percentage of pre-existing AXL-positive cells. Monoclonal antibody against N-terminal of AXL was used for the FACS analysis. Isotype control was used for identifying AXL-negative population. Isotype control was used for identifying AXL-negative population (not shown).
Figure 3 with 1 supplement

AXL-positive cells are generated stochastically.
(A) If AXL-positive cells (red) were generated as a consequence of genetic mutations, single-cell-derived clones will have different percentages of AXL-positive cells. (B) On the other hand, if AXL-positive cells were generated stochastically, then an equal percentage of AXL-positive cells will be present in both parental and single cell-derived isogenic clones. (C, D) The charts represent the percentage of AXL-positive cells in the parental and single cell-derived clonal populations in H1650 and HCC827 respectively. Cells were stained for surface expression of AXL, followed by flow cytometry analysis. Each bar represents mean ± SD of three technical replicates from two independent experiments. 20,000 cells were analyzed by FACS for each replicate of each sample. (E) AXL-negative (blue) and AXL-positive (red) cells were sorted from the H1650 cell line and were grown for 18 weeks. The percentage of AXL-positive cells emerging in each population was measured weekly and represented as dots in the chart. The red dotted line represents the percentage of AXL-positive cells that were present in the total H1650 parent cell line. (F) AXL-negative (blue) and AXL-positive (red) cells were sorted from a single-cell-derived clonal cell line from H1650 (H1650 Clone 2) and were grown for 18 weeks. The percentage of AXL-positive cells emerging in each population was measured weekly and represented as dots in the chart. The red dotted line represents the percentage of AXL-positive cells that were present in the total H1650 clone 2 cell line.
Figure 3—figure supplement 1
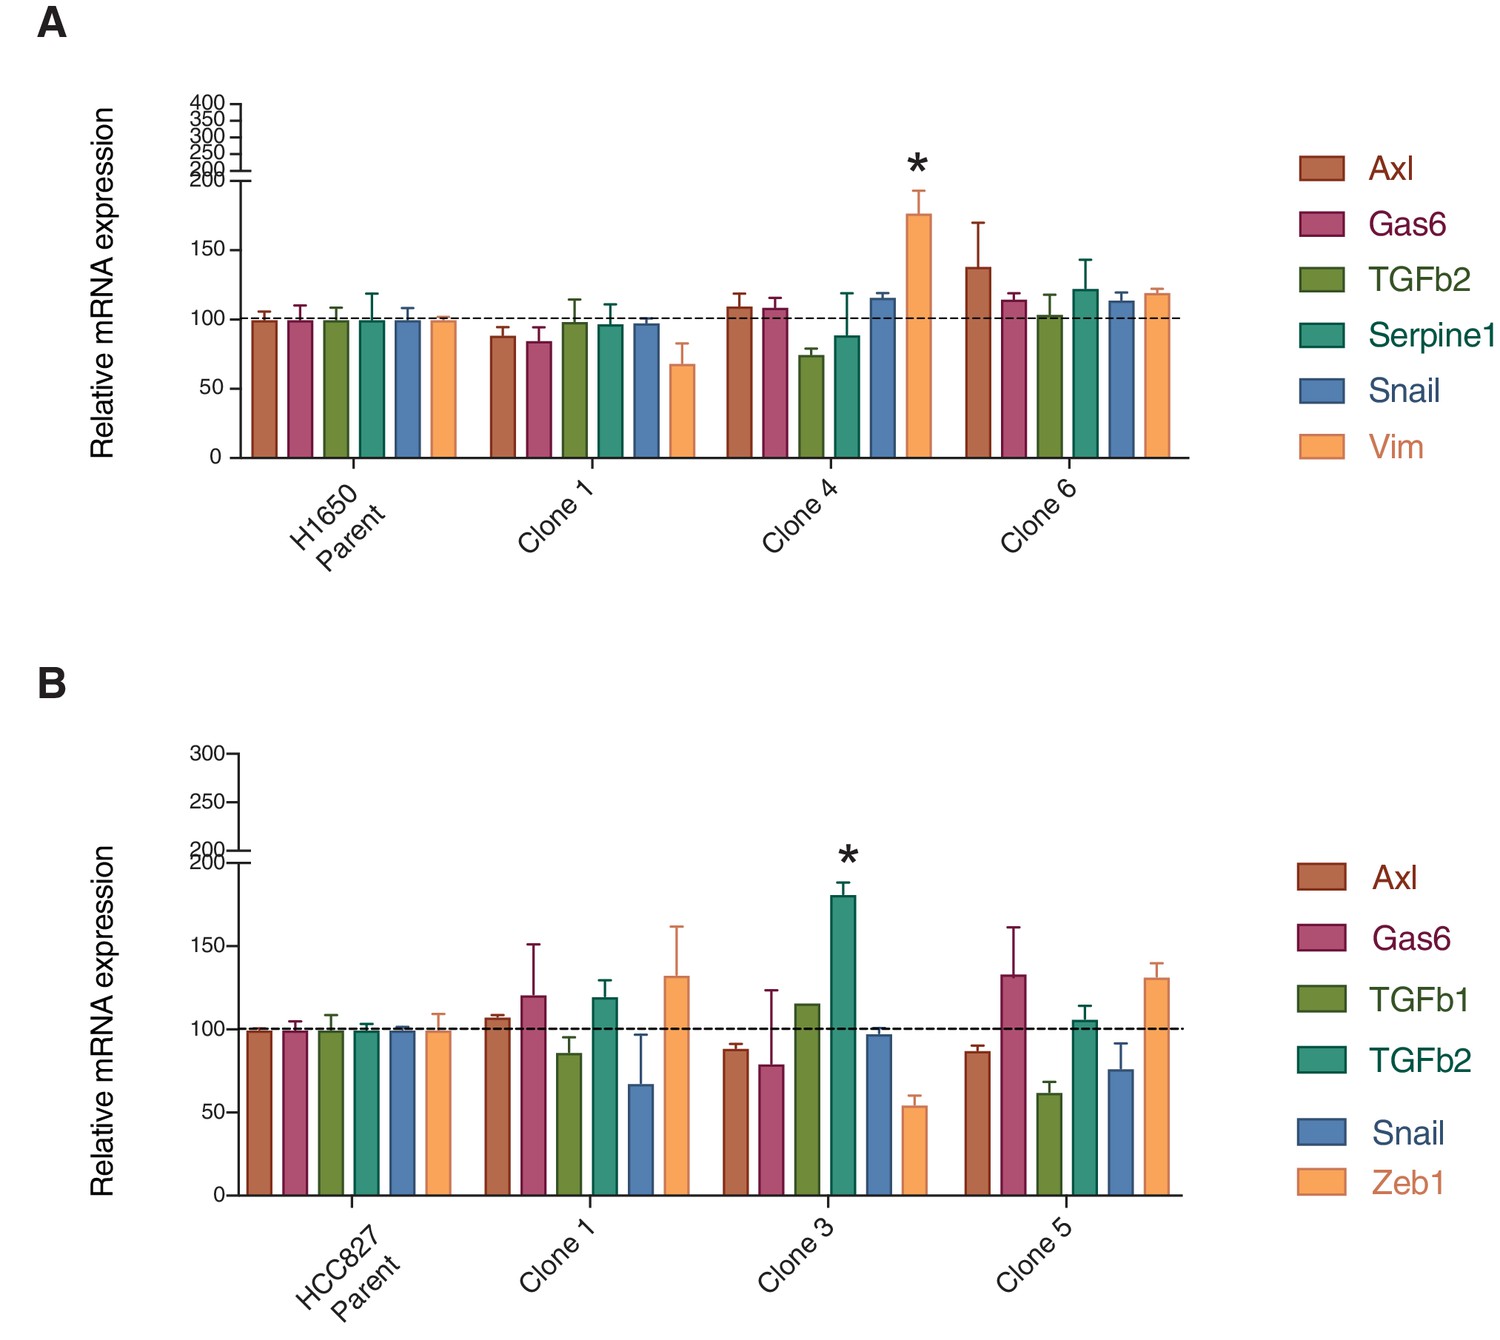
Parental cell lines and single cell-derived clonal cell lines (H1650 and HCC827) are highly similar from a molecular standpoint.
The charts represent the mRNA expression of AXL and key mesenchymal genes in the parental and single cell-derived clonal cell lines (H1650 and HCC827).
Figure 4 with 1 supplement
miRNA profiling reveals a distinct signature that characterizes the AXL-positive cell state.
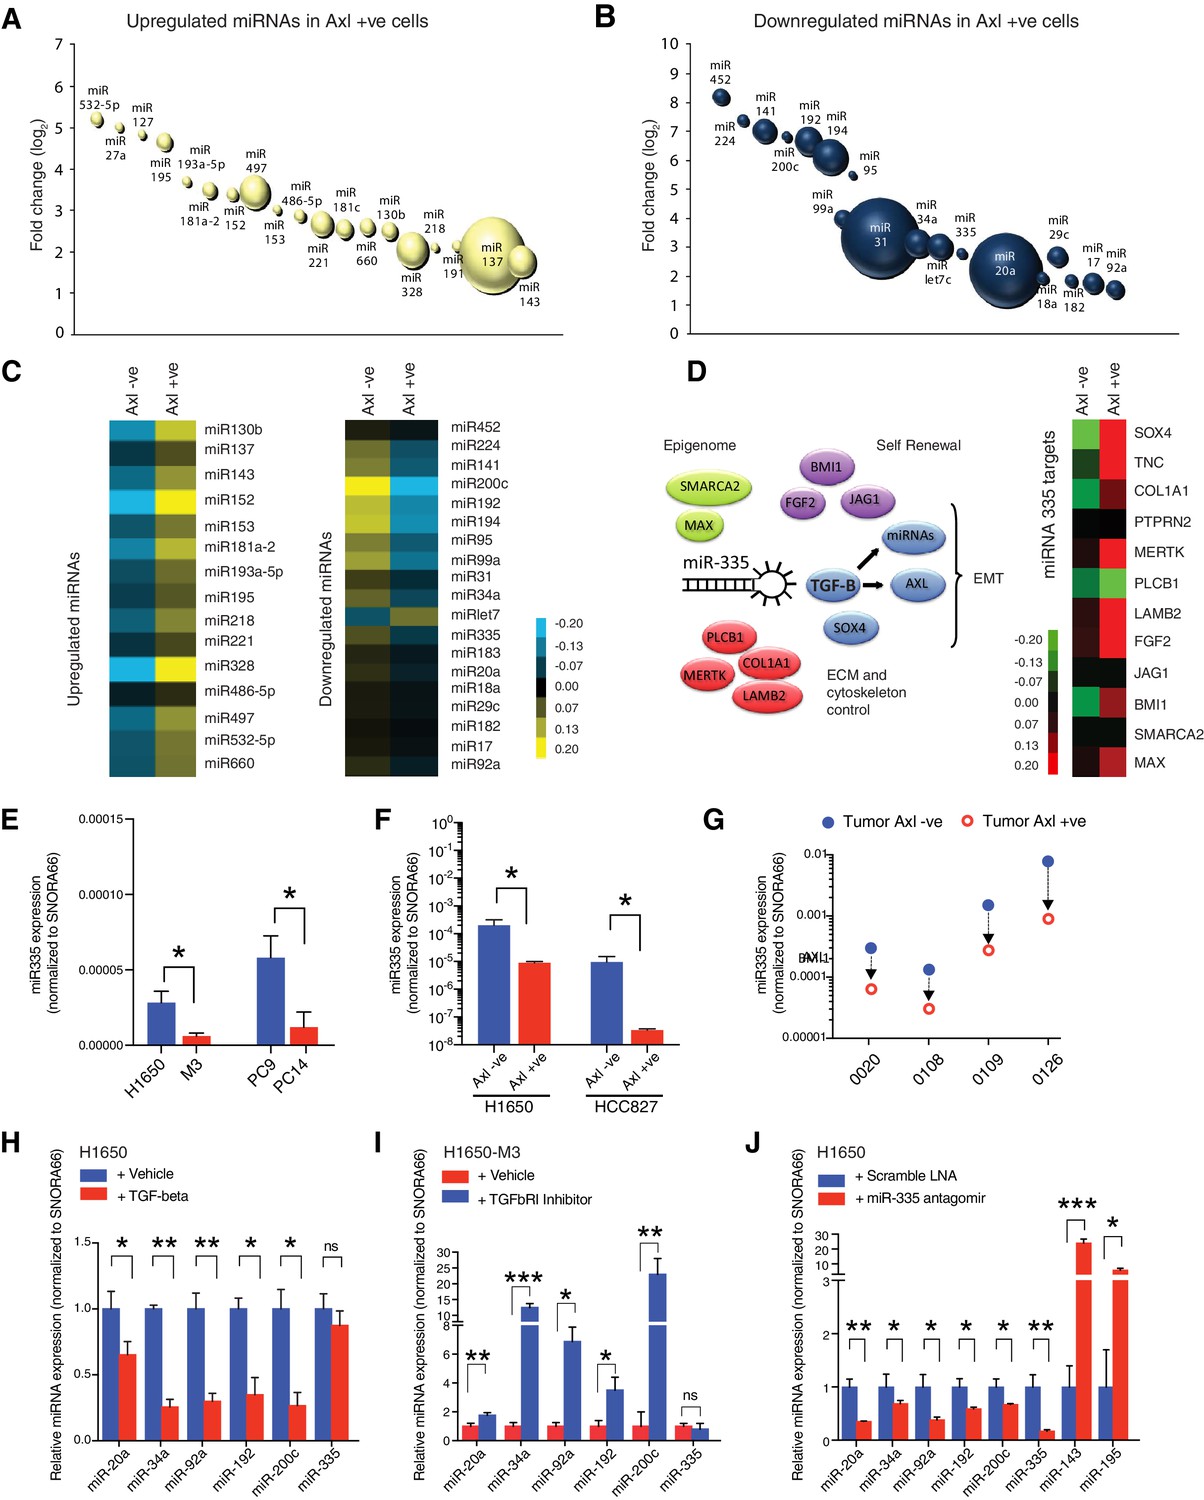
(A, B) The bubble charts show miRNAs that were >2-fold upregulated or >2-fold downregulated in AXL-positive (H1650-M3) cells relative to the parental AXL-negative (H1650) cells. Small RNA libraries were generated from each cell line and sequenced using an Illumina platform. The size of the bubble represents the abundance of the miRNA. (C) Heat map depicts patterns of miRNA expression in AXL-negative (H1650) and AXL-positive (H1650-M3) cells, validated by quantitative stem-loop RT-PCR. Columns indicate relative expression changes compared to U6 snRNA. Each square represents the average of three independent measurements. p≤0.0001, unpaired t-test. (D) miR-335 targets are increasingly expressed in AXL-positive cells. The heat map on the left shows changes in mRNA expression of miR-335 targets in AXL-negative (H1650) and AXL-positive (H1650-M3) cells. Each column represents changes in mRNAs expression relative to Actin. Each square represents the average of three independent measurements. p≤0.0001, unpaired t-test. (E) The chart represents the expression of miR-335 normalized to SNORA66 in the indicated cell lines. miRNA expression was quantified by ExiLENT SYBR-green-based RT-qPCR. Each bar represents mean ± SD of three replicates from two independent experiments (*p<0.05, unpaired t-test). (F) The chart represents expression of miR-335 normalized to SNORA66 in AXL-negative (blue) and AXL-positive (red) cells sorted from H1650 and HCC827 cell lines. miRNA expression was quantified by ExiLENT SYBR-green-based RT-qPCR. Each bar represents mean ± SD of three replicates from two independent experiments (*p<0.05, unpaired t-test). (G) The chart represents expression of miR-335 normalized to SNORA66 in AXL-negative (blue) and AXL-positive (red) cells sorted from four human primary NSCLC tumors. miRNA expression was quantified by ExiLENT SYBR-green-based RT-qPCR. Each dot represents mean ± SD of three replicates. (H) The chart represents expression of the indicated miRNAs normalized to SNORA66 in AXL-negative H1650 cells treated with Vehicle (blue) or TGF-beta (red). The data are presented as relative to vehicle-treated control. miRNA expression was quantified by ExiLENT SYBR-green-based RT-qPCR. Each bar represents mean ± SD of three replicates from two independent experiments (*p< 0.05, **<0.005, paired t-test). ns = non-significant. (I) The chart represents expression of the indicated miRNAs normalized to SNORA66 in AXL-positive H1650-M3 cells treated with vehicle (red) or TGFbRI inhibitor LY2157299, Selleckchem (red). The data are presented as relative to vehicle-treated control. miRNA expression was quantified by ExiLENT SYBR-green-based RT-qPCR. Each bar represents mean ± SD of three replicates from two independent experiments (*p<0.05, **<0.005, ***<0.005 paired t-test). ns = non-significant. (H) The chart represents expression of the indicated miRNAs normalized to SNORA66 in AXL-negative H1650 cells treated with Scramble LNA (blue) or miR-335 antagomir (red). The data are presented as relative to scramble-treated control. miRNA expression was quantified by ExiLENT SYBR-green-based RT-qPCR. Each bar represents mean ± SD of three replicates from two independent experiments (*p<0.05, **<0.005, paired t-test).
-
Figure 4—source data 1
miRNA sequence read-counts and log fold change.
- https://cdn.elifesciences.org/articles/66109/elife-66109-fig4-data1-v2.xlsx
Figure 4—figure supplement 1

Inhibiting miR-335 expression results in re-expression of miR-335 targets.
(A) The Histogram shows miR-335 levels in H1650 cells upon 5 days of treatment with three independent miR-335 antagomirs (see Materials and methods for information) in H1650 cells. Levels of miR-335 expression are relative to SNORA66. Each bar represents mean ± SD of three replicates from two independent experiments (**p<0.005, ***<0.0005, unpaired t-test). (B) Expression of miR-335 targets in H1650 cells upon treatment with miR-335 antagomirs relative to control. Each bar represents mean ± SD of three replicates from two independent experiments (*p<0.05, **<0.005, **<0.0005, ***<0.00005, #<0.000005, unpaired t-test). (C) The chart represents the relative expression of TGF-β1 and 2 in AXL-negative H1650 cells treated with scramble LNA (blue) or miR-335 antagomir (red). The data are presented as relative to scramble-treated control. mRNA expression was quantified by SYBR-green-based RT-qPCR. Each bar represents mean ± SD of three replicates from two independent experiments (*p<0.05, paired t-test).
Figure 5 with 3 supplements
miR-335 regulates AXL-positive cell-state transition.
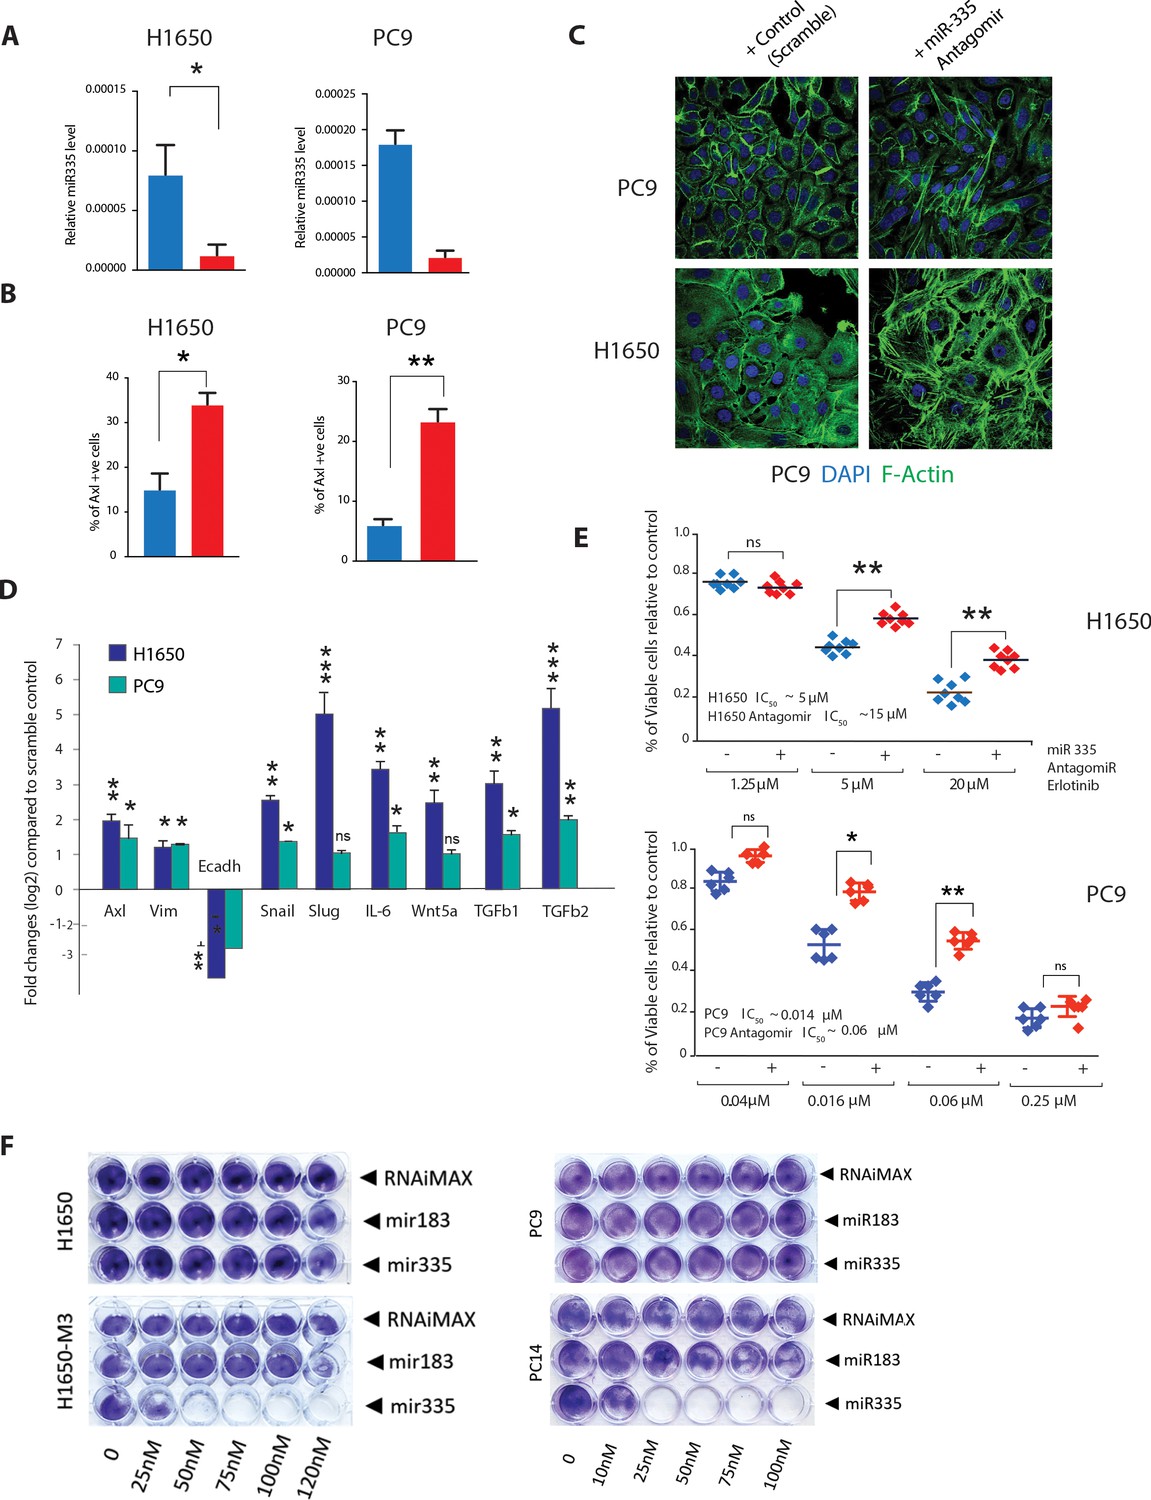
(A) The chart on left represents the knockdown efficiency of miR-335 antagomir in H1650 and PC9 cells. mRNA expression was quantified by SYBR-green-based RT-qPCR and normalized to GAPDH. Each bar represents mean ± SD of three replicates from two independent experiments (*p<0.05, unpaired t-test). (B) The chart represents the percentage of AXL-positive cells present in H1650 and PC9 cells upon treatment with miR-335 antagomir relative to scramble-treated control. Cells stained with antibody against N-terminal of AXL were used for FACS analysis. Each bar represents mean ± SD of three technical replicates. 20,000 cells were analyzed by FACS for each replicate of each sample (*p<0.05, unpaired t-test). See Figure 5—figure supplement 1A for representative FACS profiles. (C) Representative images of H1650 and PC9 cells stained with Phalloidin (green) and DAPI (blue) as counter-stain. Cells were treated for 5 days with control antagomir or miR-335 antagomir. (D) Fold change in genes that characterize the AXL-positive cell state upon inhibition of miR-335 in AXL-negative cell lines H1650 and PC9. mRNA expression was quantified by SYBR-green-based RT-qPCR and normalized to actin. Each bar represents mean ± SD of three replicates from two independent experiments (*p<0.05, **<0.005, ***<0.0005 unpaired t-test). (E) The charts represent the number of viable cells in H1650 and (F) PC9 cells upon transfection with miR-335 antagomir and treatment with indicated doses of Erlotinib. Values are normalized relative to vehicle-treated cell (control). Cells were grown for 120 hr in the presence of the drug; the number of cells was estimated upon staining with the crystal violet, de-staining in 100 µl of 10% acetic acid, and reading absorbance at 590 nm. Diamonds and black bars represent single-point measurements and the mean, respectively (n = 8) (**p<0.005, unpaired t-test). ns = non-significant. (F) Representative pictures of a cell viability assay by crystal violet staining. Cells (H1650, H1650-M3, PC9, and PC14) were plated in 24-well plates and transfected with miR-183 and miR-335 mimic oligonucleotides or with the transfecting agent RNAiMAX alone as indicated. The cells were then stained with crystal violets 96 hr after transfection. Quantification of the experiment is provided in Figure 5—figure supplement 3.
Figure 5—figure supplement 1

Inhibiting miR-335 expression results in molecular and phenotypic changes characteristic of the AXL-positive cell state.
(A) Flow cytometry-based analysis of surface expression of AXL in PC9 and H1650 cells upon inhibition of miR-335 with miR-335 antagomir, to determine the change in percentage of AXL-positive cells. Monoclonal antibody against the N-terminal of AXL was used for the FACS analysis. Isotype control was used for identifying the AXL-negative population. Isotype control was used for identifying the AXL-negative population (not shown).
Figure 5—figure supplement 2
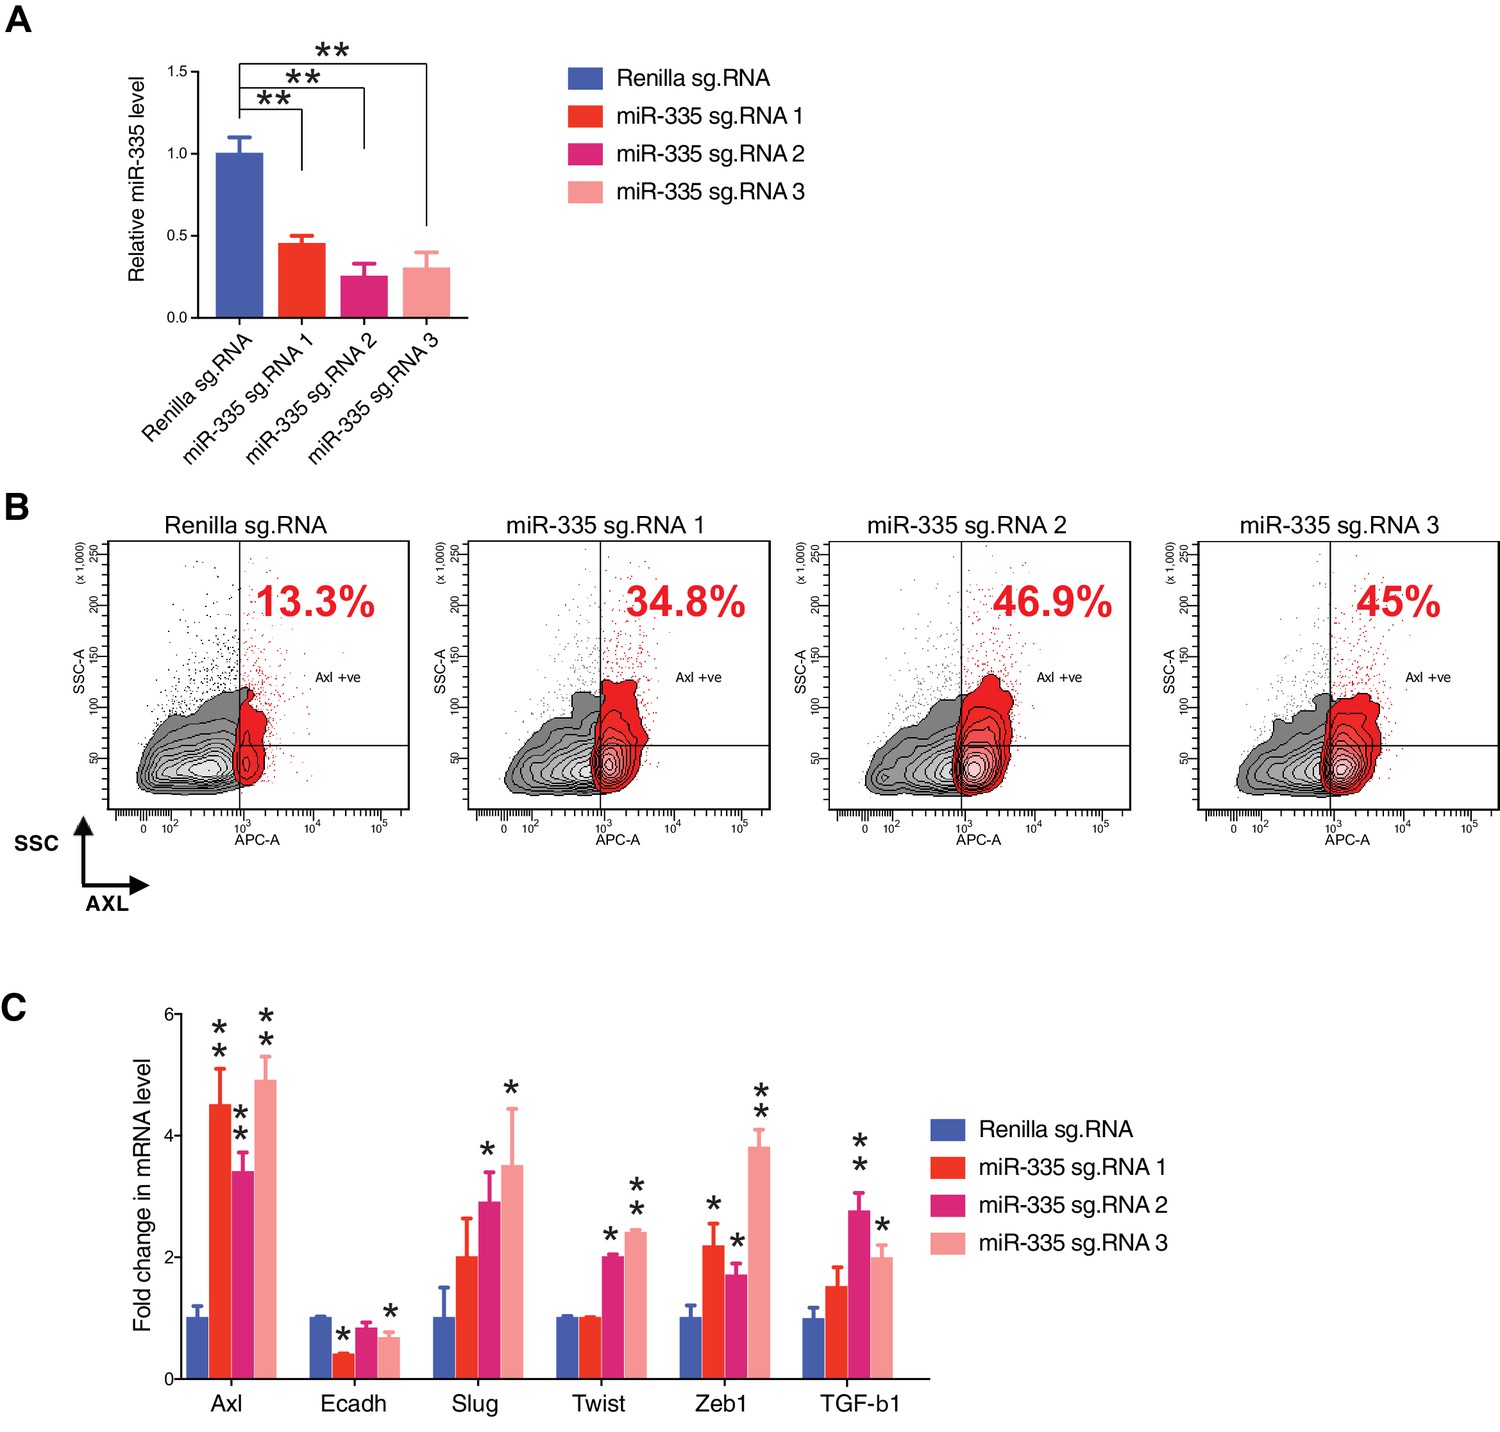
CRISPR-CAS9 mediated gene editing to reduce miR-335 expression results in molecular and phenotypic changes characteristic of the AXL-positive cell state.
(A) The chart represents the knockdown efficiency of the indicated small guide RNAs (sg.RNA) targeting the miR-335 sequence, compared to cells receiving sg.Renilla (control). mRNA expression was quantified by SYBR-green-based RT-qPCR. Each bar represents mean ± SD of three replicates from two independent experiments (**p<0.005, paired t-test). (B) Flow cytometry-based analysis of surface expression of AXL in H1650 cells upon editing the miR-335 sequence with three different guide RNAs, to determine the change in percentage of AXL-positive cells. sg.RNA against Renilla is used as a control. Monoclonal antibody against N-terminal of AXL was used for the FACS analysis. Isotype control was used for identifying AXL-negative population. Isotype control was used for identifying AXL-negative population (not shown). (C) The chart represents the fold change in the mRNA expression of the indicated genes in H1650 cells containing sg.RNAs targeting the miR-335 sequence or Renilla (control), and presented relative to Renilla control. mRNA expression was quantified by SYBR-green-based RT-qPCR. Each bar represents mean ± SD of three replicates from two independent experiments (*p<0.05, **<0.005, paired t-test).
Figure 5—figure supplement 3
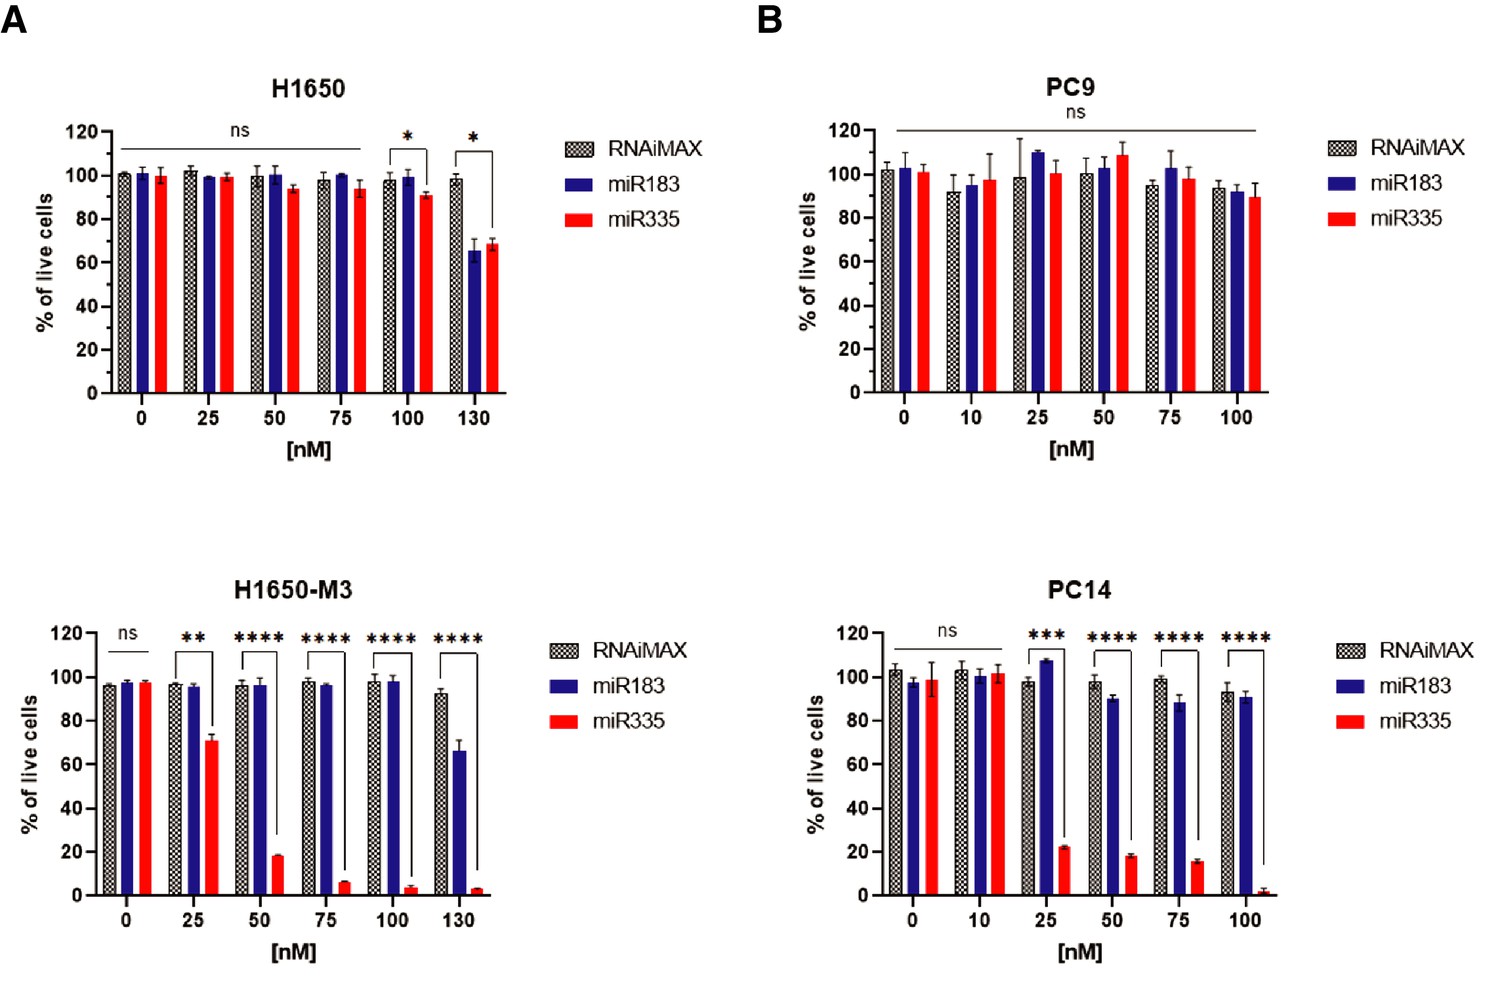
The charts represent the quantification of a cell viability assay by crystal violet illustrated in Figure 5F.
Indicated cells (H1650, H1650-M3, PC9, and PC14) were plated in 24-well plates transfected with the indicated miRNAs and as control with the transfecting agent RNAiMAX at different concentrations. Cells were stained with crystal violets 96 hr after transfection. Each bar represents the mean of ± SD of three replicates from two independent experiments (*p<0.05, **<0.005, ***<0.0005, ****<0.00005, two-way ANOVA, Dunnett’s multiple comparison test).
Figure 6 with 1 supplement
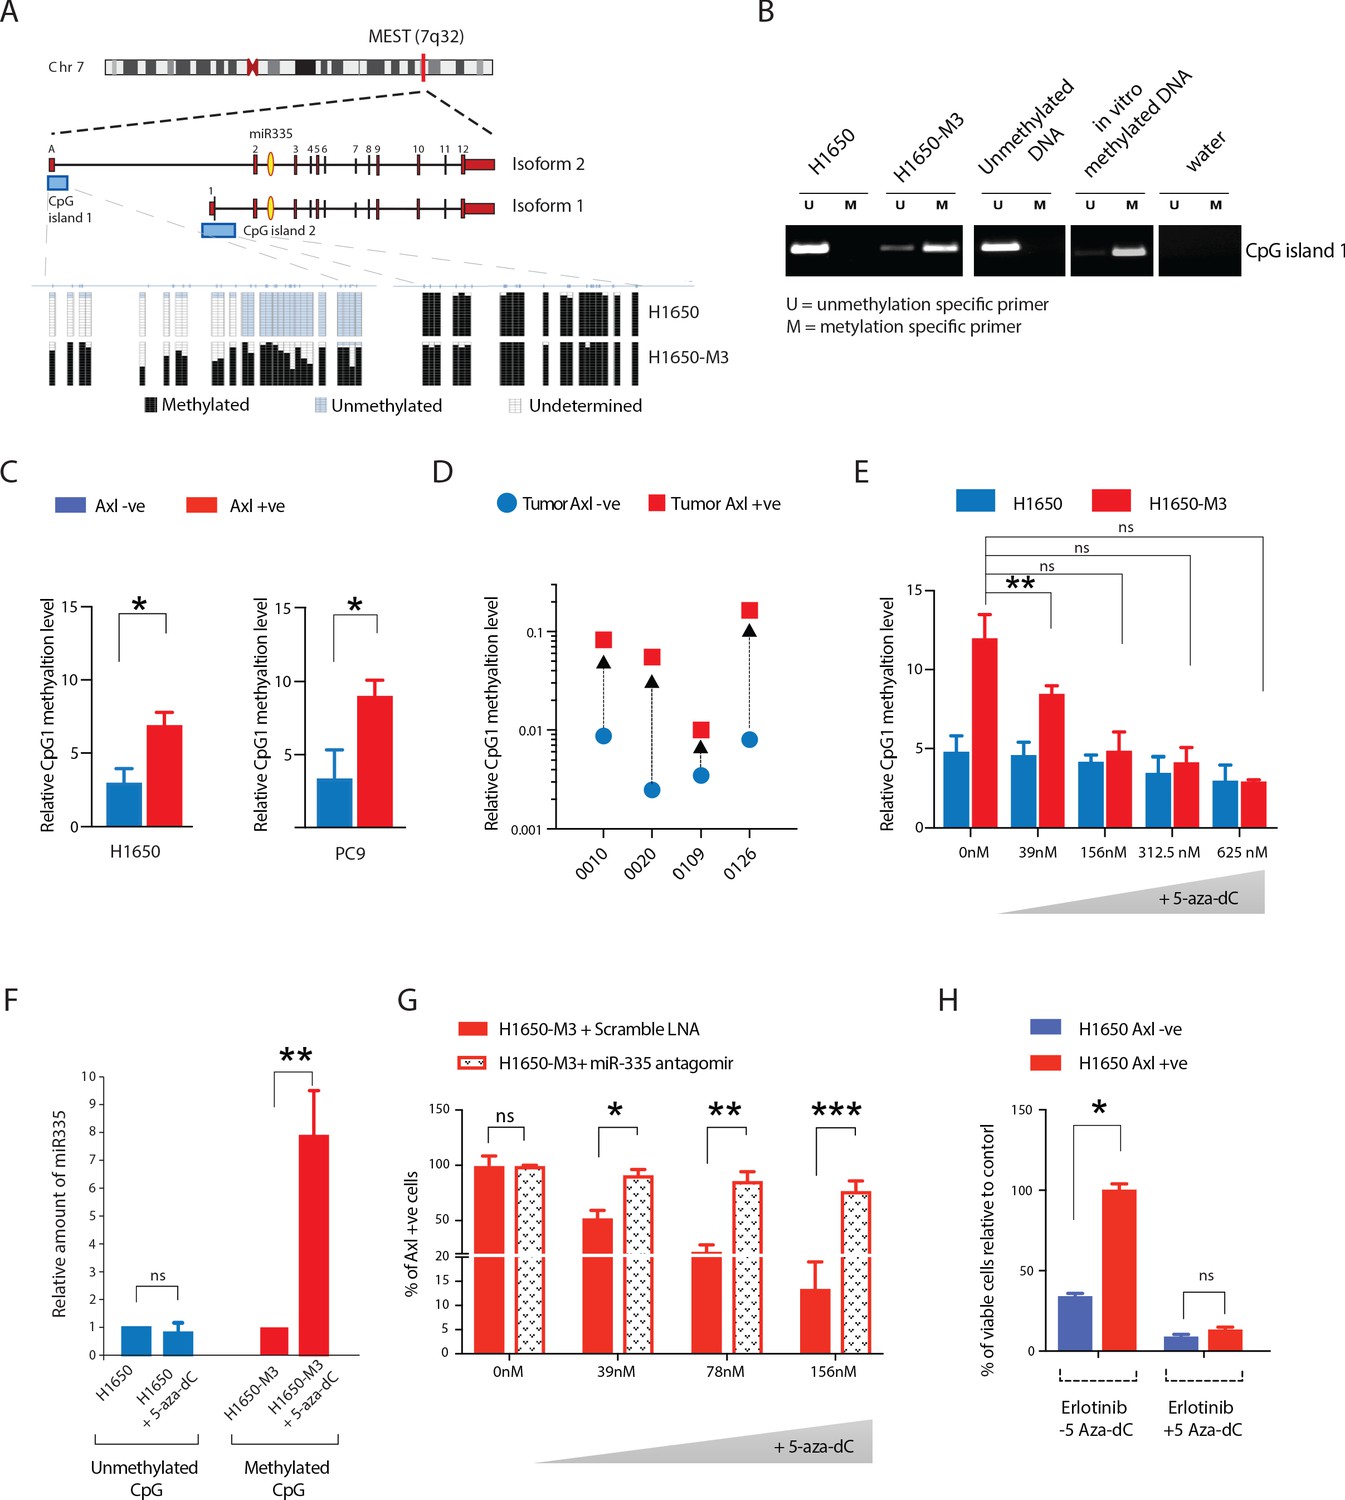
Methylation of MEST isoform 2 promoter modulates miR-335 expression in AXL-positive cells.
(A) Schematic of MEST locus organization and the methylation analysis by bisulfite sequencing of MEST CpG island 1 and 2 in AXL-negative (H1650) and AXL-positive (H1650-M3) cells lines (lower panel). Each box indicates a CpG dinucleotide, and each line of boxes represents the analysis of a single cell. The color of each box indicates the methylation of each CpG island. (B) Semi-quantitative RT-PCR analysis of methylation status of CpG island 1 in H1650 and H1650-M3. U: Unmethylation-specific primer; M: Methylation-specific primer. See Figure 6—figure supplement 1A for the relative amount of methylation of MEST CpG island 1 in the Erlotinib-naïve and -resistant cell lines quantified via methylation-specific SYBR-green-based RT-qPCR (MSP). (C) The chart represents the relative amount of methylation of MEST CpG island 1 in AXL-negative (blue) and AXL-positive (red) cells sorted from H1650 and PC9 cell lines. The amount of methylation of DNA was quantified via methylation-specific SYBR-green-based RT-qPCR (MSP). Each bar represents mean ± SD of three replicates from two independent experiments (*p<0.05, unpaired t-test). (D) The chart represents the relative amount of methylation of MEST CpG island 1 in AXL-negative (blue) and AXL-positive (red) cells sorted from four human primary NSCLC tumors. The amount of methylation of DNA was quantified via methylation-specific SYBR-green-based RT-qPCR (MSP). Each dot represents mean ± SD of three replicates. (E–H) Treatment of cells with 5-Aza-dC for is sufficient to reduce the levels of CpG island 1 methylation, increase the expression of miR-335, decrease AXL-positive cells, and reduce Erlotinib resistance, respectively. (E) The chart represents the relative amount of methylation of MEST CpG island 1 in H1650 and H1650-M3 cells treated with the indicated amount of 5-Aza-dC for 36 hr. The amount of methylation of DNA was quantified via methylation-specific SYBR-green-based RT-qPCR (MSP). Each bar represents mean ± SD of 3 replicates from two independent experiments (*p<0.05, unpaired t-test). ns = non-significant. (F) The chart represents the amount of miR-335 (relative to SNORA66) in H1650 and H1650-M3 cells upon treatment with 5-Aza-dC for 36 hr and normalized to vehicle-treated control. miRNA expression was quantified by ExiLENT SYBR-green-based RT-qPCR. Each bar represents mean ± SD of three replicates from two independent experiments (*p<0.05, unpaired t-test). ns = non-significant. (G) The chart represents the percentage of AXL-positive cells in H1650-M3 upon treatment with 5-Aza-dC for 96 hr, in the presence of scramble LNA (red solid bar) or miR-335 antagomir (dotted bar). The data is presented relative to H1650-M3 cells treated with scramble LNA at 0 nM 5-Aza-dC. Cells stained with the antibody against N-terminal of AXL were used for FACS analysis. Each bar represents mean ± SD of three technical replicates. 20,000 cells were analyzed by FACS for each replicate of each sample (*p<0.05, **p<0.005, ***p<0.05 unpaired t-test). ns = non-significant. See Figure 6—figure supplement 1C for the representative mRNA expression. (H) The chart represents the relative number of Erlotinib surviving cells in theabsence or in the presence of 5-Aza-dC. Each bar represents mean ± SD of three replicates from two independent experiments (*p<0.05, unpaired t-test). ns = non-significant.
Figure 6—figure supplement 1

Methylation of MEST isoform 2 promoter moduates miR-335 expression in AXL-positive cells.
(A) The chart represents the relative amount of methylation of MEST CpG island 1 in the H1650, H1650-M3, PC9, and PC14 cell lines. The amount of methylation of DNA was quantified via methylation-specific SYBR-green-based RT-qPCR (MSP). Each bar represents mean ± SD of three replicates from two independent experiments (*p<0.05, unpaired t-test). (B) The chart represents the relative amount of methylation of MEST CpG island 1 in AXL-negative (blue) and AXL-positive (red) cells sorted from HCC827 and A549 cell lines. The amount of methylation of DNA was quantified via methylation-specific SYBR-green-based RT-qPCR (MSP). Each bar represents mean ± SD of three replicates from two independent experiments (*p<0.05, unpaired t-test). (C) Crystal violet colorimetric assay showing the viability of H1650 and H1650-M3 cell lines (left panel) and PC9, PC14 (right panel) upon treatment with different concentrations of 5-Aza-dC for 96 hr. (D) Quantification of crystal violet staining with a microplate endpoint absorbance reader at a wavelength of 590 nm. The untreated cells in the first well (0 nM) were used as a control to normalize the absorbance of viable cells (100% viability), while all results were normalized to the negative control (media only) for each individual experiment. The figure is the representation of one out of three individual experiments. Error bars indicate SEM. (E) The chart represents the relative expression of AXL mRNA in H1650-M3 upon treatment with 5-Aza-dC for 36 hr, in presence of scramble LNA (RED solid bar) or miR-335 antagomir (dotted bar). The data is presented relative to H1650-M3 cells treated with scramble LNA at 0 nM 5-Aza-dC. mRNA expression was quantified by SYBR-green-based RT-qPCR. Each bar represents mean ± SD of three replicates from two independent experiments (*p<0.05, **p<0.005, ***p<0.0005, unpaired t-test). ns = non-significant. (F) The chart represents the percentage of AXL-positive cells in AXL-negative cells (blue) and AXL-positive cells (red) sorted from H1650 upon treatment with 5-Aza-dC for 96 hr (**p<0.005, unpaired t-test). ns = non-significant.
Figure 7
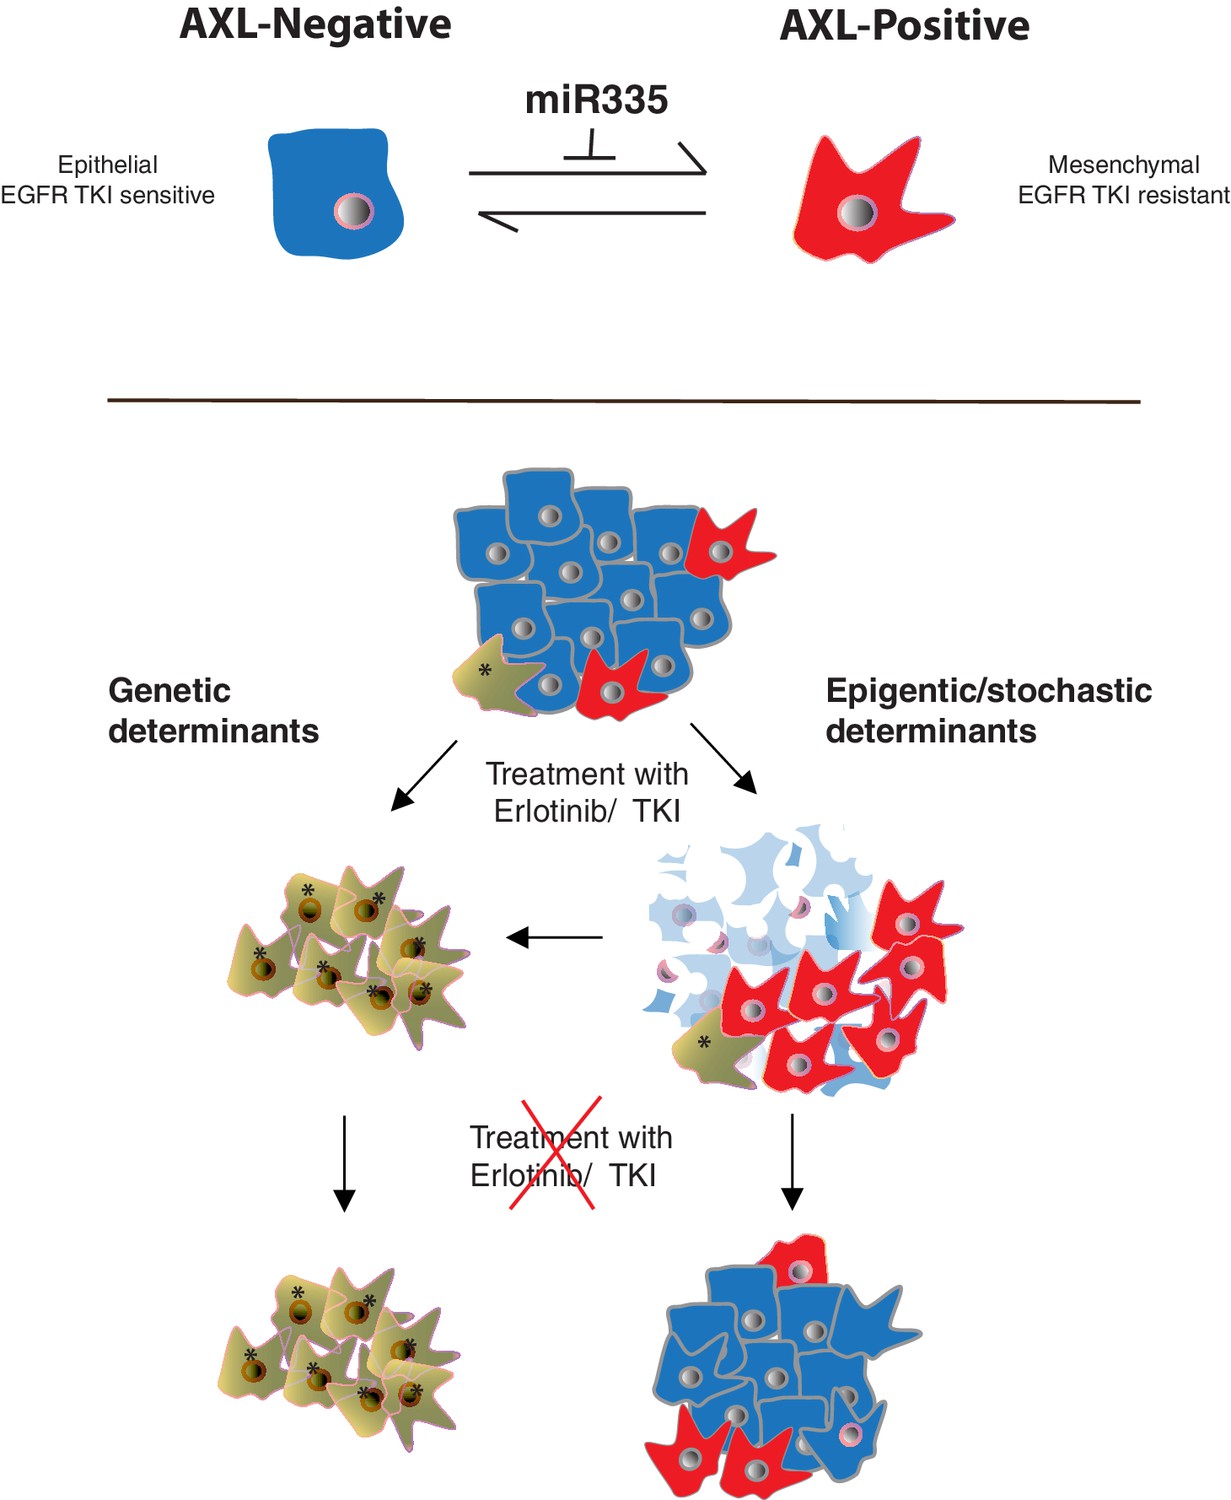
Cancer cells can transit between an epithelial state characterized by low expression of AXL and a mesenchymal-like state with high AXL expression.
AXL-positive cells have increased resistance to EGFR TKi compared to AXL-negative cells. The transition between these two states is restricted by miR-335 whose expression is regulated epigenetically through promoter methylation. The existence of this innate stochastic/epigenetic mechanism has important therapeutic implications. Upon treatment with EGFR TKi, AXL-positive cells can survive but differently from cells that have acquired resistance through genetic mutations with time they can revert to an epithelial EGFR TKi-sensitive state.
Author response image 1

Pre-existent Axl +ve cells preferentially persist during drug treatment.
The charts depict the percentage of surviving colonies with more than 100 cells after 15 days of Erlotinib treatment, normalized to R10. Each bar represents mean ± SD of 3 replicates from two independent experiments. n.s. = non-significant. (p-value * < 0.05, * *< 0.005, unpaired t-test). W10: 100% PC9-Axl –ve cells; R1W9: 10% PC9-Td-Tom Axl +ve cells + 90% PC9-Axl –ve cells; R5W5: 50% PC9-Td-Tom Axl +ve cells + 50% PC9-Axl –ve cells; R9W1: 90% PC9-Td-Tom Axl +ve cells + 10% PC9-Axl –ve cells;R10: 100% PC9-Td-Tom Axl +ve cells.
Additional files
-
Supplementary file 1
A complete list of primers for quantitative real-time PCR analysis of miRNAs .
- https://cdn.elifesciences.org/articles/66109/elife-66109-supp1-v2.docx
-
Transparent reporting form
- https://cdn.elifesciences.org/articles/66109/elife-66109-transrepform-v2.docx
Download links
A two-part list of links to download the article, or parts of the article, in various formats.
Downloads (link to download the article as PDF)
Open citations (links to open the citations from this article in various online reference manager services)
Cite this article (links to download the citations from this article in formats compatible with various reference manager tools)
An epigenetic switch regulates the ontogeny of AXL-positive/EGFR-TKi-resistant cells by modulating miR-335 expression
eLife 10:e66109.
https://doi.org/10.7554/eLife.66109


