Characterization of cephalic and non-cephalic sensory cell types provides insight into joint photo- and mechanoreceptor evolution
- Max Perutz Labs, University of Vienna, Vienna BioCenter, Austria
- Research Platform “Rhythms of Life”, University of Vienna, Vienna BioCenter, Austria
- Research Platform "Single-Cell Regulation of Stem Cells", University of Vienna, Vienna BioCenter, Austria
- Division of Neuroscience & Experimental Psychology, University of Manchester, United Kingdom
- Center for Integrative Bioinformatics Vienna, Max Perutz Labs, University of Vienna and Medical University of Vienna, Austria
- CeMM Research Center for Molecular Medicine of the Austrian Academy of Sciences, Austria
- Department of Dermatology, Medical University of Vienna, Austria
Figures
Figure 1 with 1 supplement

Establishment of molecular signatures of eye photoreceptors (EPs) and trunk r-opsin1-expressing (TRE) cells.
(A) Dissection of pMos{rops::egfp}vbci2 individuals, separating the head containing EP cells (left panel) from trunk containing TRE cells (right panel). (B) Overview of cDNA library generations, resulting in fluorescence-activated cell sorting (FACS)-enriched (EP, TRE) and unsorted (head, trunk) samples. (C, D) Representative FACS plots showing gated populations (green boxes) of EP and TRE cells, respectively. For non-transgenic controls, see Figure 1—figure supplement 1A, B. (E–G) Comparison of transcripts per million reads (TPM) for the genes r-opsin1 (E), enhanced green fluorescent protein/egfp (F), and gαq/gq (G) in individual replicates of EP, head, TRE, and trunk libraries. For comparison of TPMs for non-enriched control genes, see Figure 1—figure supplement 1C, D. Arrows and arrowheads in (A) designate EGFP-positive cell bodies and projections, respectively.
Figure 1—figure supplement 1
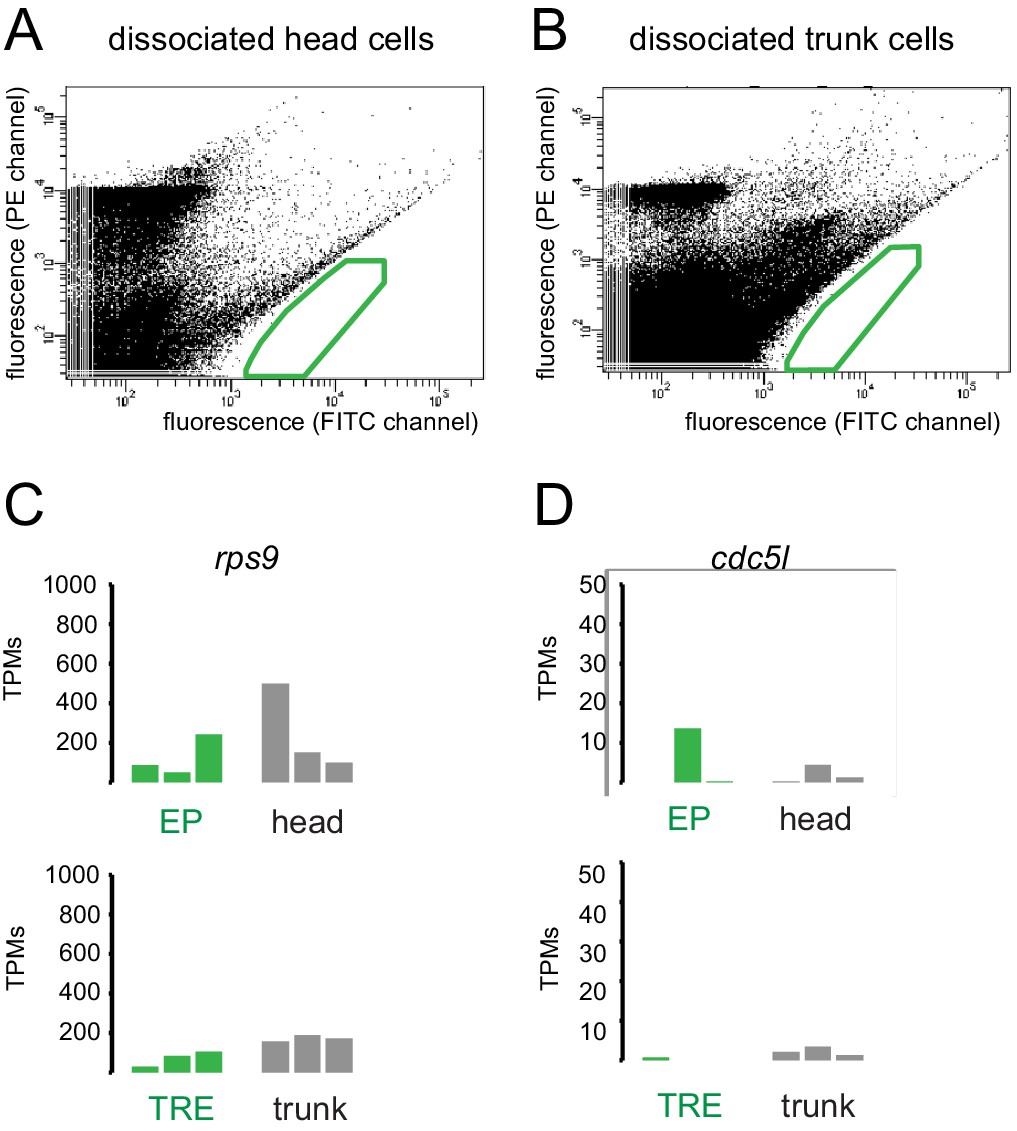
Fluorescence-activated cell sorting (FACS) profiles of dissociated cells from wild-type heads and trunks.
(A) Profile for wild-type head cells; (B) profile for wild-type trunk cells. The areas boxed in green indicate gates chosen for the isolation of EGFP cells from transgenic pMos{rops::egfp}vbci2 individuals. (C, D) Lack of enrichment of reference genes rps9 and cdc5-like in head- and trunk-derived libraries. Comparison of transcripts per million reads (TPMs) for the genes rps9 (A) and cdc5-like/cdc5l (B) in individual replicates of EP, head, trunk r-opsin1 expressing (TRE), and trunk libraries (cf. Figure 1).
Figure 2 with 3 supplements
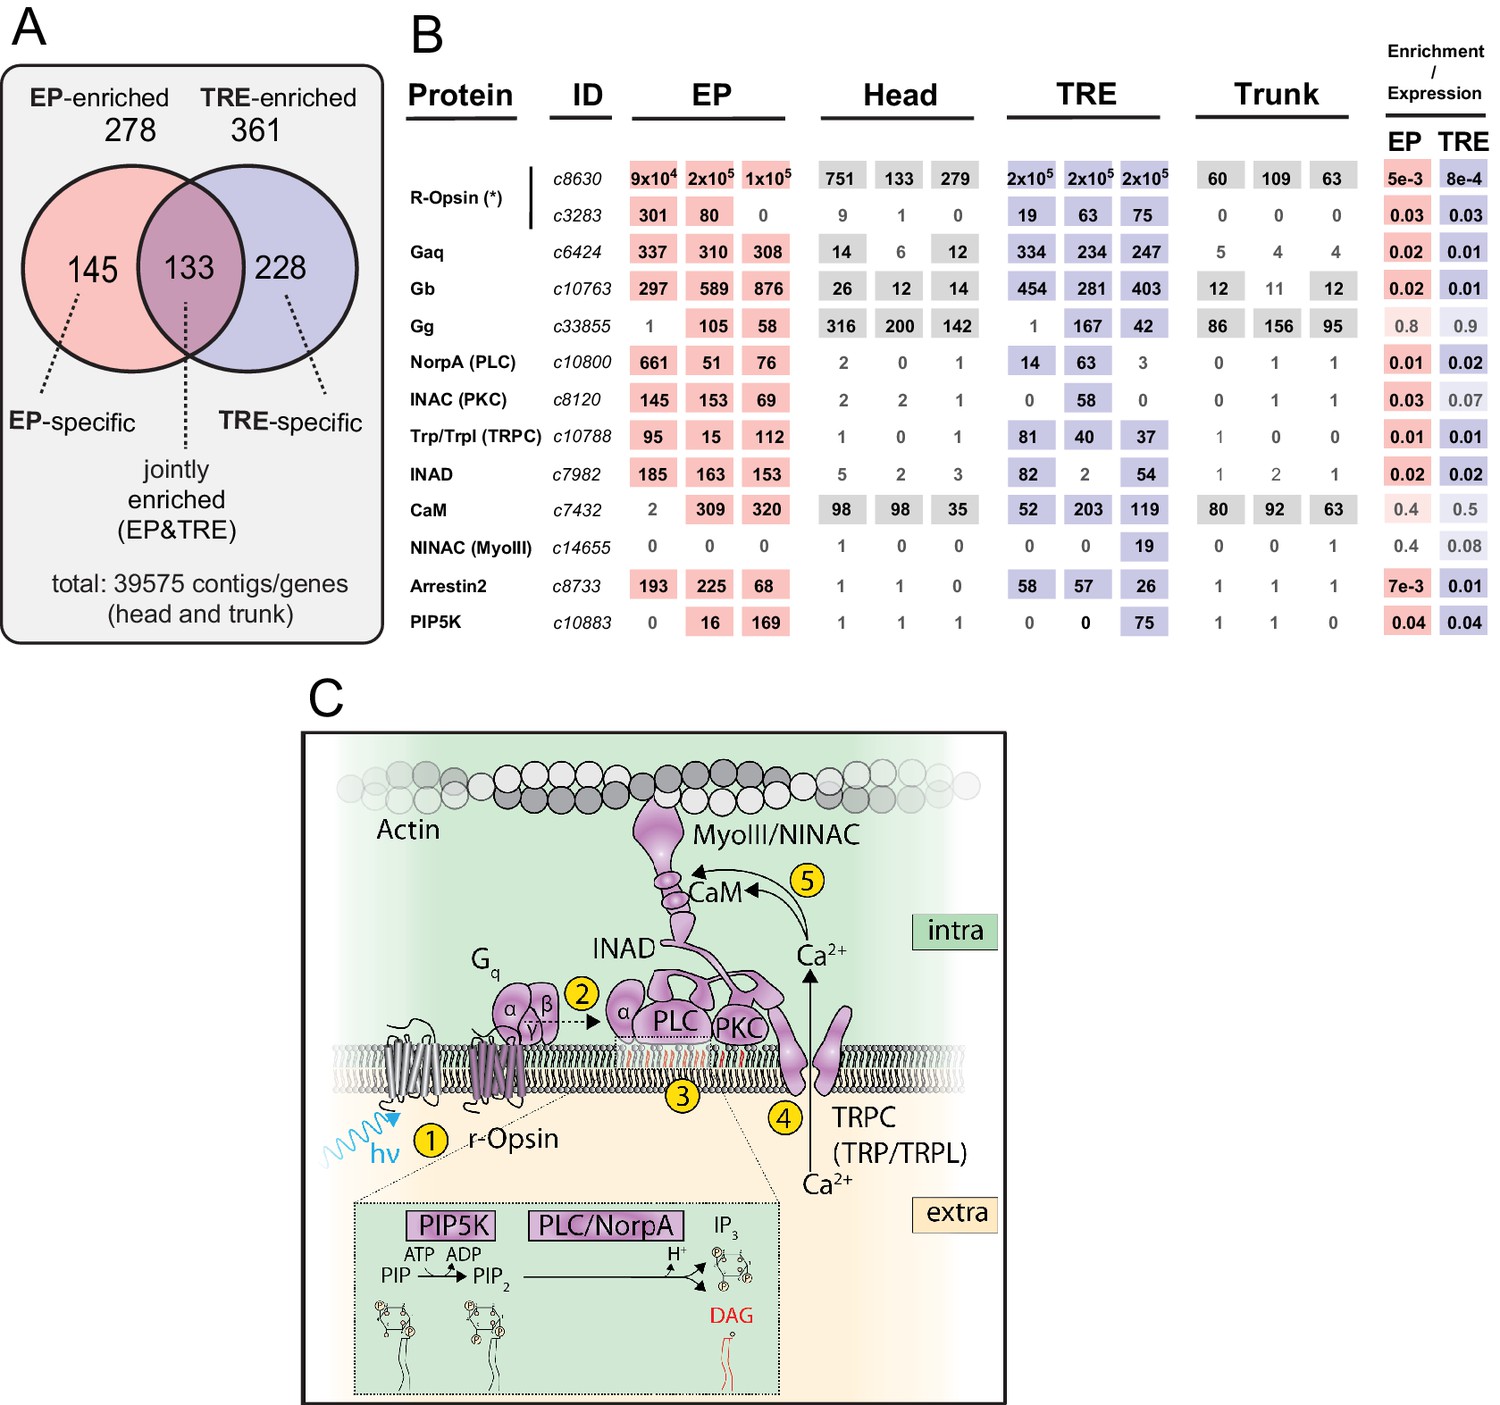
Trunk r-opsin1-expressing (TRE) cells share critical elements of the phototransduction cascade with eye photoreceptors (EPs).
(A) Summary of gene/contig counts enriched in EP and TRE cells compared to the combined background (head and trunk; 39,575 contigs) and their respective overlap. For expression levels of genes selected for validation, see Figure 2—figure supplement 1. For validation experiments, see ‘Analysis and validation of differentially expressed genes,’ Figure 2—figure supplements 2 and 3, Supplementary file 1. (B) Expression and enrichment of phototransduction components in EP and TRE cells. Protein: key components of the D. melanogaster phototransduction pathway (cf. panel C). ID: corresponding gene ID(s) of the P. dumerilii transcriptome. EP, head, TRE, trunk: expression levels (in transcripts per million reads [TPMs]) of the respective gene in individual replicates of P. dumerilii EP, head, TRE, or trunk libraries, respectively. Light shades indicate expression above the established threshold. Enrichment/expression: FDR values obtained from the differential expression analysis for EP or TRE cells. Dark shades indicate significant enrichment, light shades expression without significant enrichment in the respective cell type. IDs c8630 and c3283 (demarcated with asterisk) relate to two distinct r-opsin genes expressed by EP and TRE cells: r-opsin1 (AJ316544.1) and r-opsin3 (KC810971.1), respectively. Note that although the P. dumerilii best BLAST hit to NINAC/MyoIII (c14655, E value: 3e-166) is not expressed in EP cells, the second best BLAST hit (c8565, E value: 1e-64) is expressed in these cells. For sequence identifiers of the relevant P. dumerilii genes, see Supplementary file 2. (C) Scheme highlighting factors present or enriched in the joint EP/TRE signature (cf. panel B), and their function in critical steps (yellow circles 1–5) of the canonical r-opsin phototransduction cascade. Enlarged inset shows relevant enzymatic steps in the intracellular leaflet. (C) Modeled after Hardie and Juusola, 2015.
Figure 2—figure supplement 1
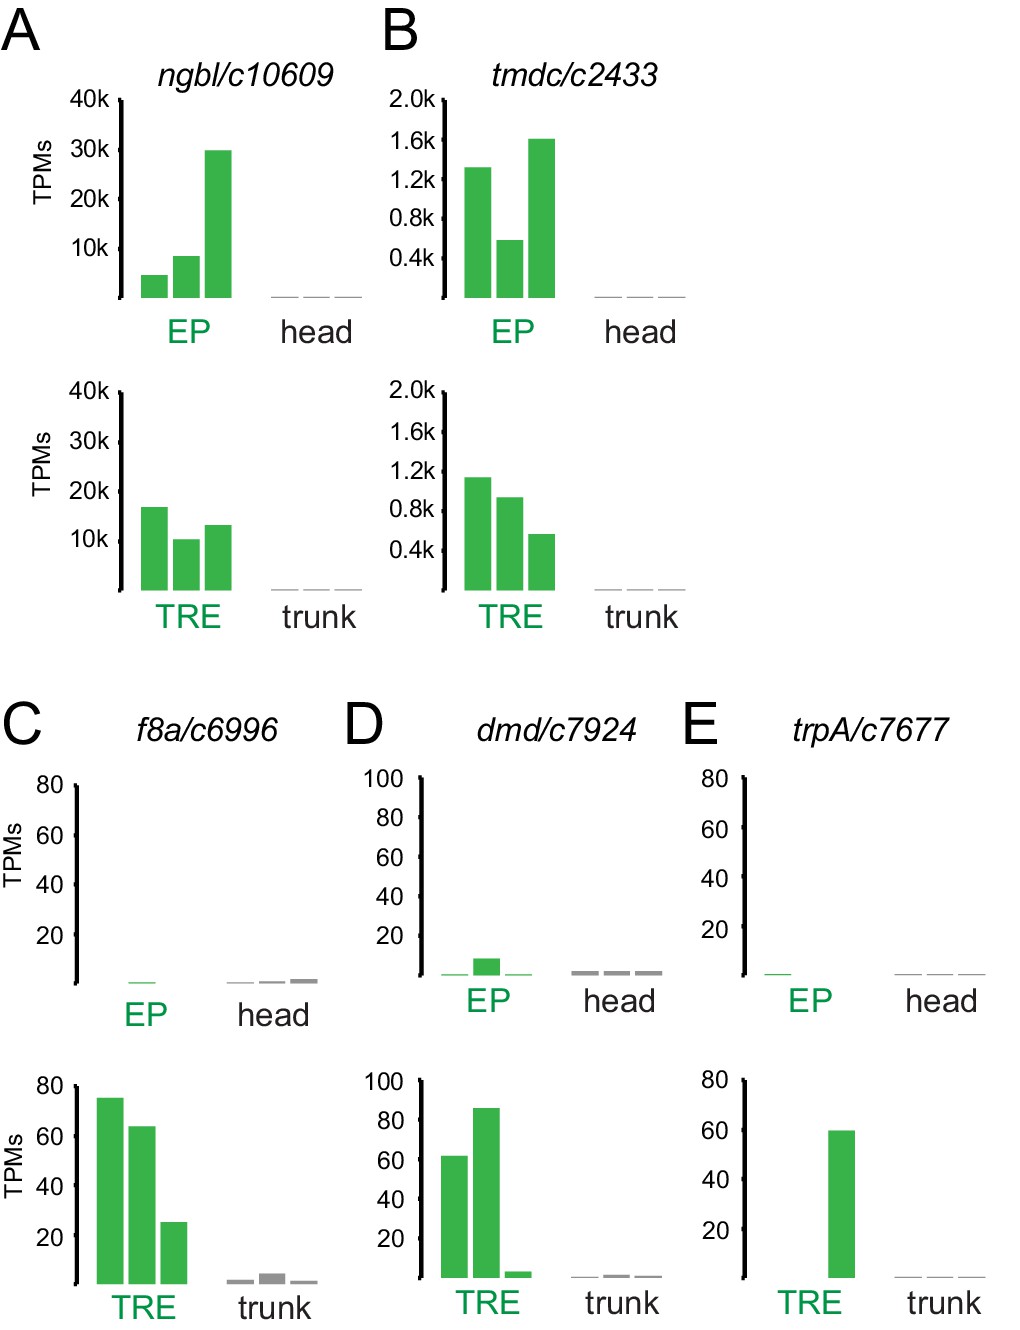
Expression levels (in transcripts per million reads [TPMs], in individual replicates) of enriched genes chosen for validation.
(A, B) Chosen genes enriched in both eye photoreceptor (EP) and trunk r-opsin1-expressing (TRE) cells: ngb/c10609 (A) and tmdc/c2433 (B). (C–E) Chosen genes specifically enriched in the TRE cells: f8a/c6996 (C), dmd/c7924 (D), and trpa/c7677 (E).
Figure 2—figure supplement 2
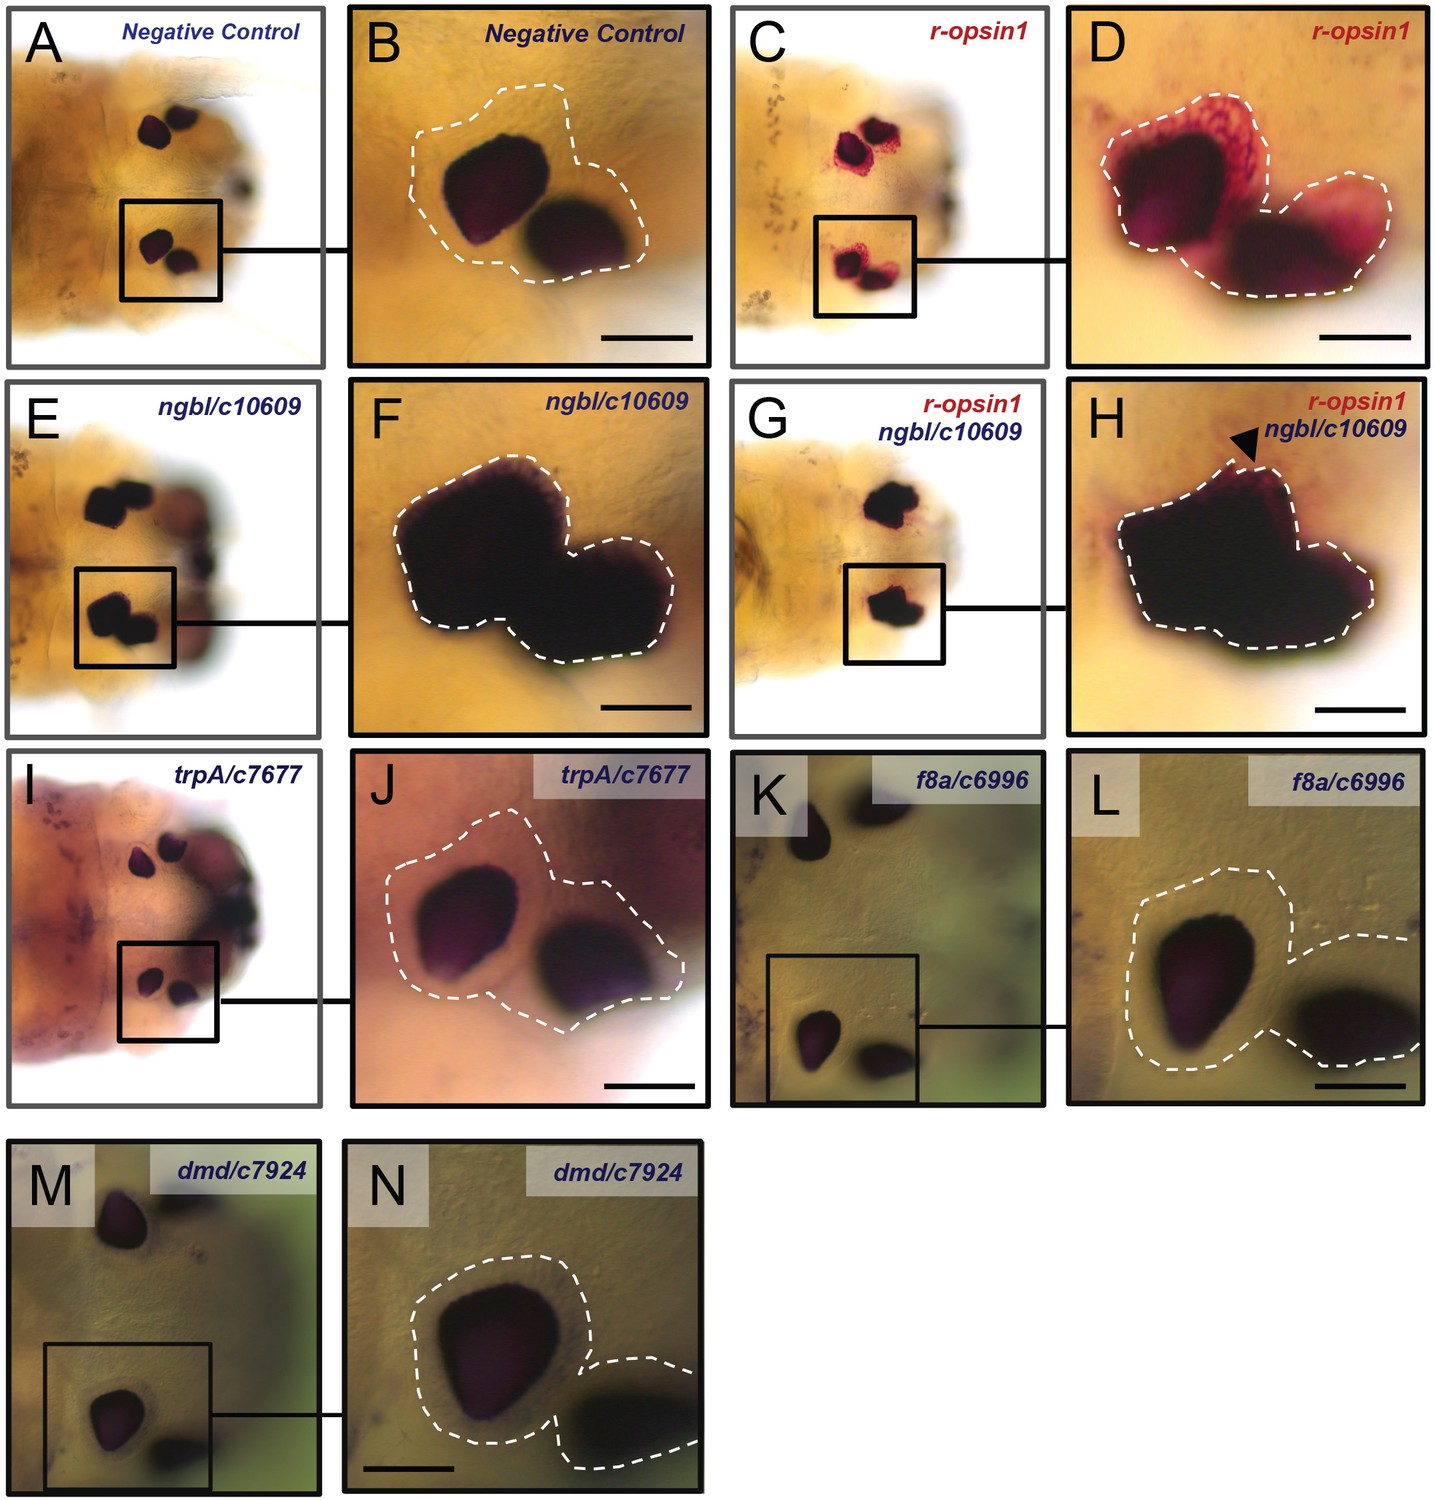
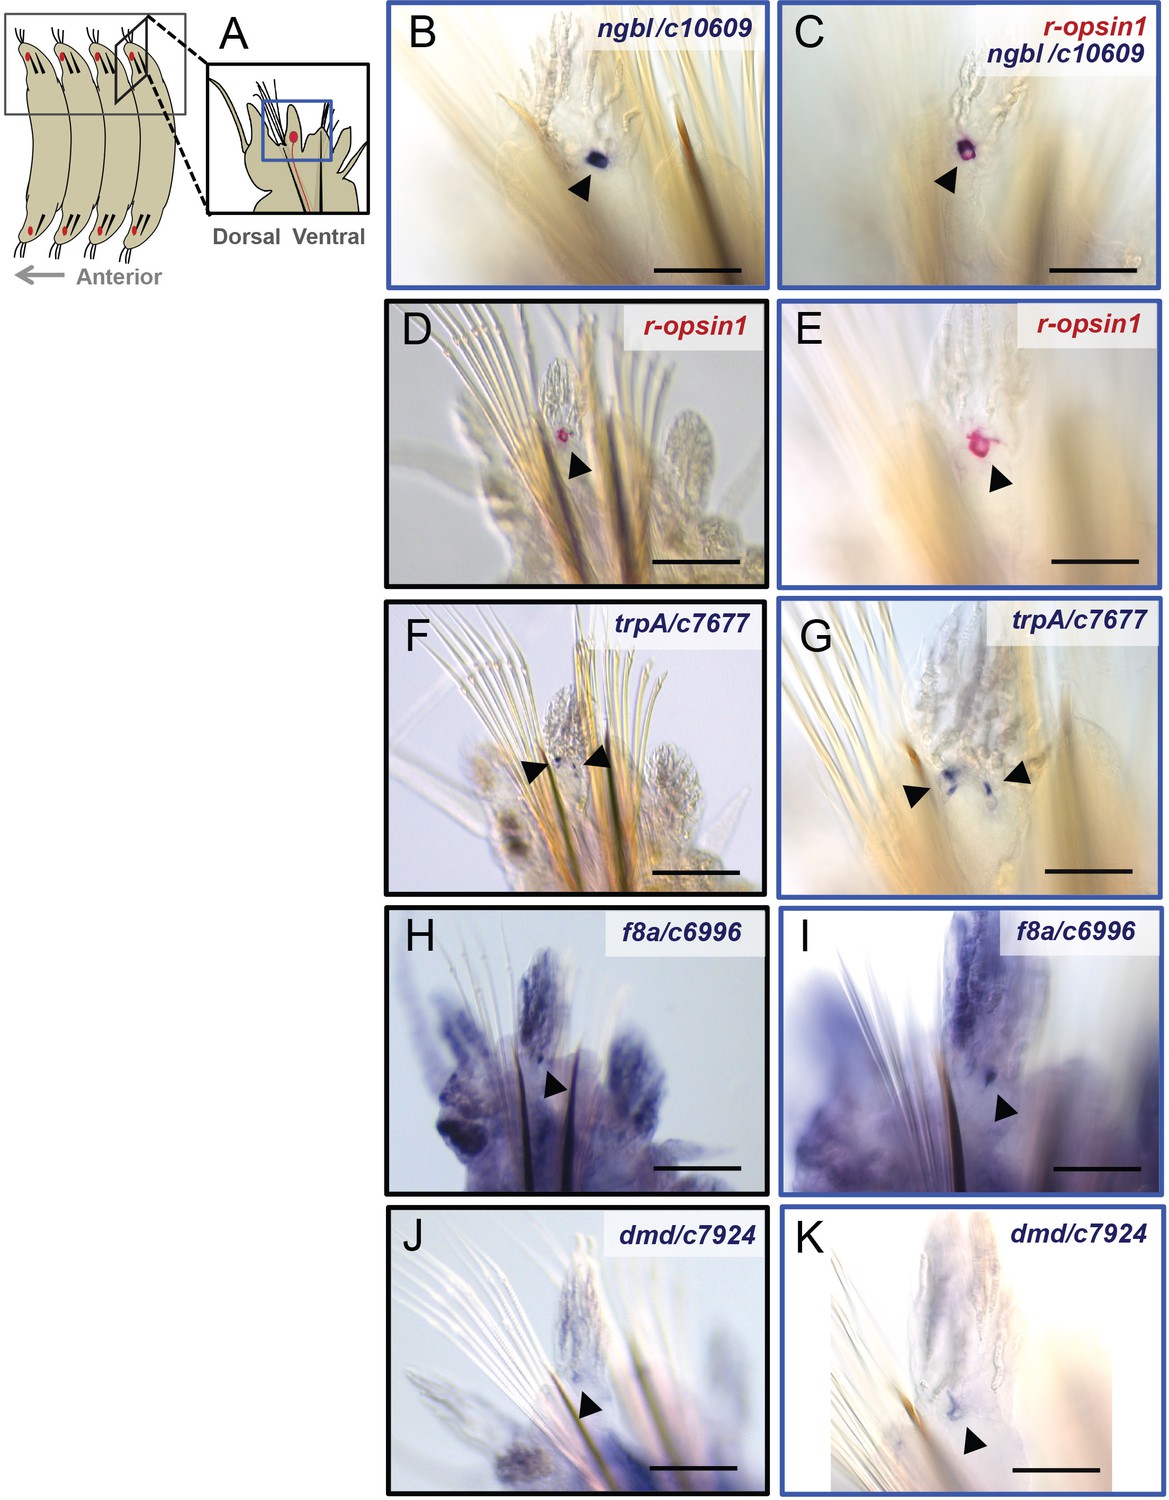
Validation of selected genes from the differential enrichment analysis (head).
Low-magnification images (A, C, E, G, I, K, M) and high-magnification images (B, D, F, H, J, L, N) of single-color (A–F, I–N) or double-color (G, H) whole-mount in situ hybridization experiments using the following probes: a sense probe (A, B) showing no staining in the eyes; a probe against r-ospin1 (C, D, G, H, red staining) showing expression in the eye photoreceptors (EPs); a probe against ngbl/c10609 (E–H, blue staining) showing expression in the eyes that overlaps with the expression of r-opsin1 (arrowhead in H); probes against trpA/c7677 (I, J, blue staining), f8a/c6996 (K, L, blue staining), and dmd/c7924 (M, N, blue staining) showing no detectable expression in the eyes. The white broken line in (B, D, F, H, J, L, N) demarcates the region of the EP cells (see 'Analysis and validation of differentially expressed genes'). All scale bars: 50 µm.
Figure 2—figure supplement 3
Validation of selected genes of the differential enrichment analysis (trunk).
(A) Scheme showing the position of the trunk r-opsin1-expressing (TRE) cells in the trunk. (B–K) Low-magnification images (D, F, H, J) and high-magnification images (B, C, E, G, I, K) of trunk whole-mount in situ hybridization (WMISH) (D–K) and double-WMISH (B, C) using the following probes: a probe against r-opsin1 (C–E, red staining), showing expression in the TRE cell (arrowheads); a probe against ngbl/c10609 (B, C, blue staining), showing expression in the TRE cell overlapping with the expression of r-opsin1 (C); a probe against trpA/c7677 (F, G, blue staining), showing expression in several spots (arrowheads) in the location of the TRE (Figure 3D, E); probes against f8a/c6996 (H, I, blue staining) and dmd/c7924 (J, K, blue staining) showing expression in a single spot in a location consistent with the TRE cell. Scale bars in (D, E, H, J): 100 µm. Scale bars in (B, C, E, G, I, K): 40 µm.
Figure 3 with 1 supplement
Trunk r-opsin1-expressing (TRE) cells also share a mechanosensory signature.
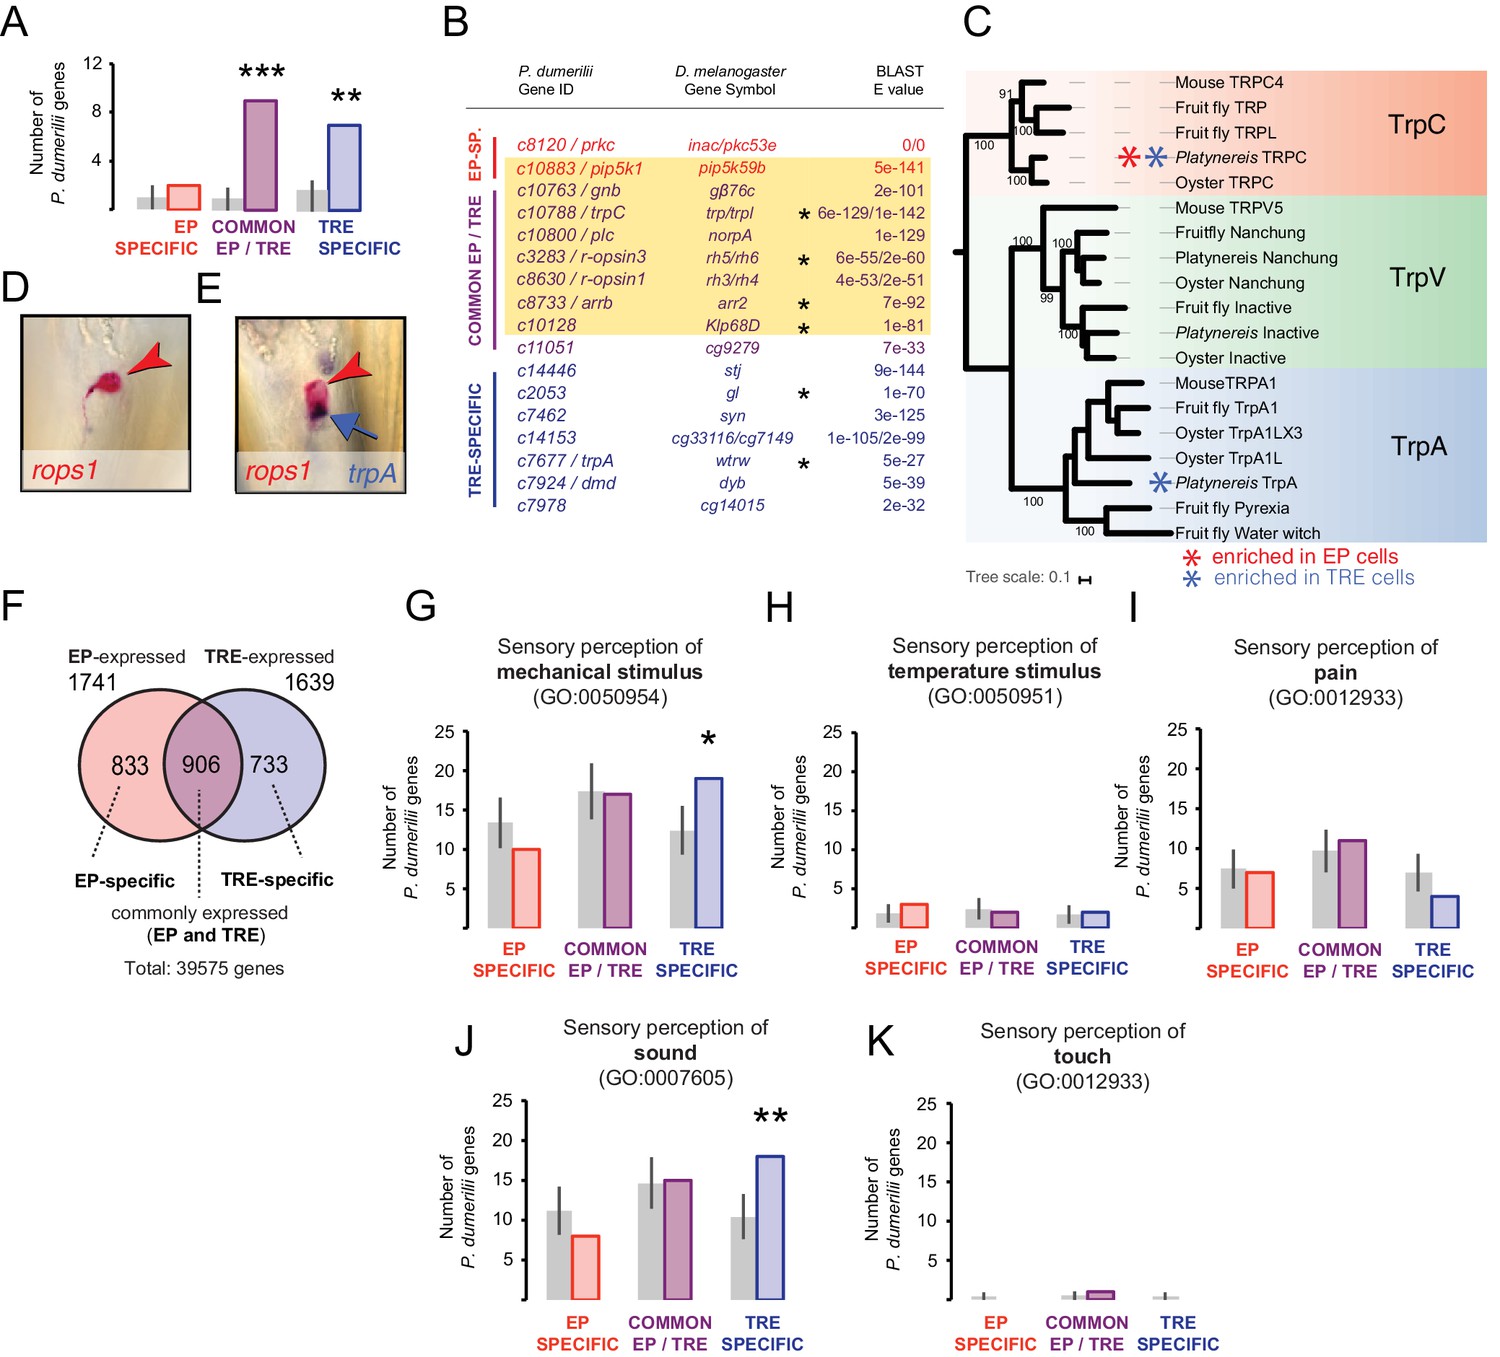
(A, B) Comparison of P. dumerilii eye photoreceptor (EP)- and TRE-enriched genes with D. melanogaster Johnston organ (JO)-enriched genes. For comparison with D. melanogaster EP-enriched genes, see Figure 3—figure supplement 1, Figure 3—source data 1. (A) Number of P. dumerilii genes specifically enriched in EP cells (EP-specific, red), enriched in EP and TRE cells (common EP- and TRE-enriched, purple), or specifically enriched in TRE cells (TRE-specific, blue) overlapping with D. melanogaster JO-enriched genes. Gray bars show the average number (± standard deviation) of TRE-specific, common EP- and TRE-enriched or TRE-specific P. dumerilii genes overlapping with randomly selected sets of D. melanogaster genes. **p<0.01; ***p<10−4. (B) List of the overlapping genes indicated in (A). Each gene in the ‘P. dumerilii Gene ID’ column indicates the best P. dumerilii BLAST hit of the listed D. melanogaster gene. The yellow shading indicates genes that are part of the D. melanogaster phototransduction pathway. Asterisks indicate genes relevant for auditory JO function (Senthilan et al., 2012). (C) Molecular phylogeny of Transient receptor potential channel (Trp) orthologs showing the assignment of the joint EP/TRE-enriched TRPC channel, and the Platynereis TrpA ortholog expressed in the TRE cells. For sequence identifiers see Supplementary file 3. (D, E) Specific co-expression of Platynereis r-opsin1 (D, E, red; red arrowheads) and trpA (E, purple; blue arrow) in TRE cells, reflecting one of various TRE markers shared with mechanosensory cells (see B); caudal views, distal to the top. (F) Number of genes expressed in EP and/or TRE cells. (G–K) Number of EP-specific (red), common EP-/TRE-expressed (purple), or TRE-specific (blue) P. dumerilii genes overlapping with Mus musculus genes involved in sensory perception of mechanical stimulus (G), sensory perception of temperature stimulus (H), sensory perception of pain (I), sensory perception of sound (J), or sensory perception of touch (K). For identity of overlapping genes indicated in (G), see Figure 3—source data 2. For list of overlapping genes indicated in (J), see Figure 3—source data 2 (yellow shading). Gray bars show the average number (± standard deviation) of TRE-specific, common EP-/TRE-enriched, or TRE-specific P. dumerilii genes overlapping with randomly-selected sets of M. musculus genes. * p<0.05; ** p<0.01.
-
Figure 3—source data 1
List of the overlapping genes identified in the comparison of P. dumerilii eye photoreceptor (EP-) and trunk r-opsin1-expressing (TRE)-enriched genes with D. melanogaster EP-enriched genes.
Best P. dumerilii BLAST hits of the corresponding D. melanogaster genes (middle column), as described in detail in Materials and methods. The yellow shading indicates genes that are part of the D. melanogaster phototransduction pathway.
- https://cdn.elifesciences.org/articles/66144/elife-66144-fig3-data1-v2.pdf
-
Figure 3—source data 2
List of the overlapping genes indicated in Figure 3G.
Each gene in the ‘P. dumerilii Gene ID’ column indicates the best P. dumerilii BLAST hit to the corresponding M. musculus. Gene symbols in the middle column, as described in detail in Materials and methods. The yellow shading indicates genes that are involved in the sensory perception of sound (Figure 3J).
- https://cdn.elifesciences.org/articles/66144/elife-66144-fig3-data2-v2.pdf
Figure 3—figure supplement 1
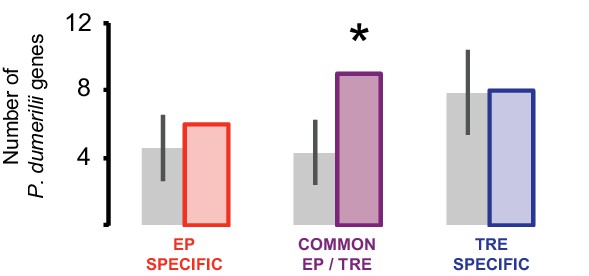
Comparison of P. dumerilii eye photoreceptor (EP-) and trunk r-opsin1-expressing (TRE)-enriched genes with D. melanogaster EP-enriched genes.
Number of EP-specific (red), common EP- and TRE-enriched (purple), or TRE-specific cells (blue)P. dumerilii genes overlapping with D. melanogaster EP-enriched genes. Gray bars show the average number (± standard deviation) of TRE-specific, common EP- and TRE-enriched, or TRE-specific P. dumerilii genes overlapping with randomly selected sets of D. melanogaster genes. *p<0.05.
Figure 4 with 4 supplements
Expression of nompc and pkd2.1 in trunk r-opsin1-expressing (TRE) cells of trunk regenerates.
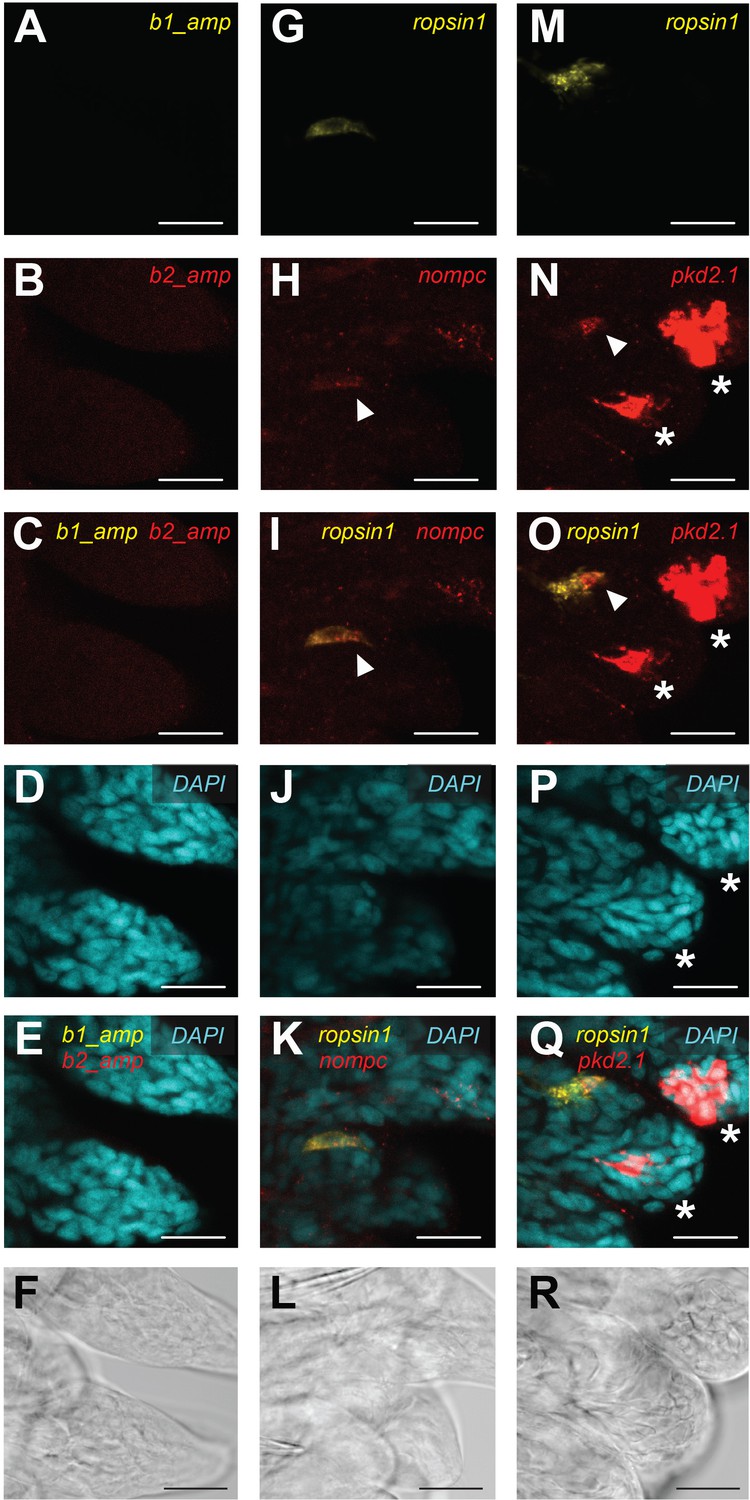
Hybridization chain reaction (HCR) confocal microscope images of Platynereis trunk regenerates showing background fluorescence by the fluorescently labeled HCR amplifier hairpins b1 and b2 (A–F) or the HCR fluorescence signal in samples exposed to a b1-coupled r-opsin1 probe and a b2-coupled nompc probe (G–L) or a b1-coupled r-opsin1 probe and a b2-coupled pkd2.1 probe (M–R). (A, G, M) HCR signal (Alexa Fluor 546 fluorescence) from the b1 amplifier hairpins, not associated to any probe (A), or associated to a r-opsin1 probe (G, M). (B, H, N) HCR signal (Alexa Fluor 647 fluorescence) from the b2 amplifier hairpins, not associated to any probe (B), or associated to a nompc probe (H) or a pkd2.1 probe (N). The arrowheads in (H) and (N) indicate, respectively, the nompc and pkd2.1 that overlap with the r-opsin1 signal. The asterisks in (N) indicate strong pkd2.1 expression in the tips of the developing parapodia, consistent with the overview image shown in Figure 4—figure supplement 3. (C, I, O) Overlap of HCR signals from the b1 and b2 amplifier hairpins in (A) and (B), (G) and (H), or (M) and (N), respectively. Arrowheads in (I) and (O) indicate the same position as in (H) and (N), respectively. The asterisks in (O) indicate the same positions as in (N). (D, J, P) Fluorescence signal generated by the DAPI counterstain. The asterisks in (P) indicate the same positions as in (N) and (O). (E, K, Q) Overlap of HCR signals from the b1 amplifier hairpins, b2 amplifier hairpins, and DAPI counterstain in (A, B, D), (G, H, J), or (M, N, P), respectively. The asterisks in (Q) indicate the same positions as in (N, O, P). (F, L, R) Transmitted light (T-PMT) corresponding to the same field of view as in (A–E), (G–K), and (M–Q), respectively. Scale bars: 20 µm.
Figure 4—figure supplement 1
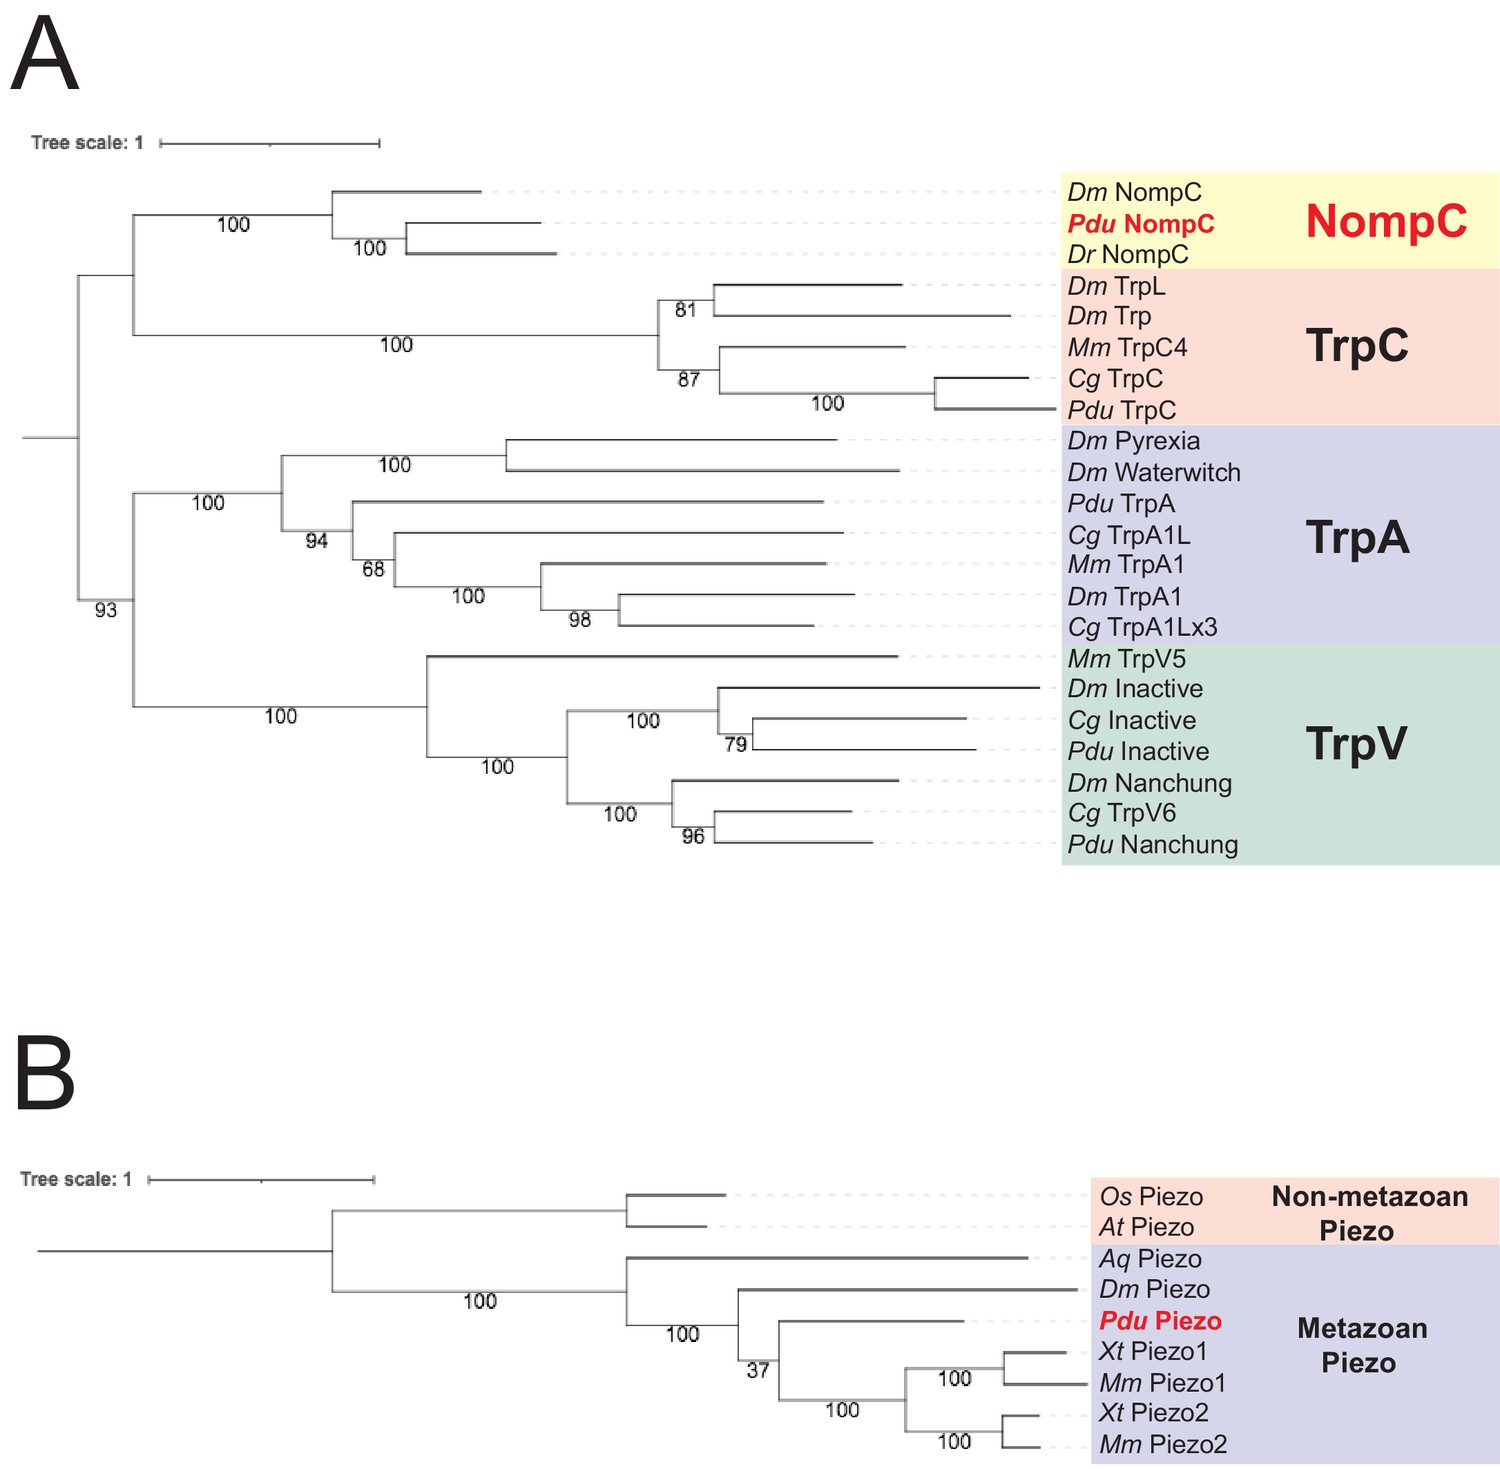
Molecular phylogeny identifies Platynereis dumerilii NompC and Piezo orthologs.
(A) Phylogenetic tree including proteins encoded by nompc and related genes. Dm: Drosophila melanogaster; Pdu: Platynereis dumerilii; Dr: Danio rerio; Mm: Mus musculus; Cg: Crassostre gigas. Yellow background: NompC proteins; pale-red background: TrpC proteins; violet background: TrpA proteins; green background: TrpV proteins. (B) Phylogenetic tree including the proteins encoded by piezo genes. Os: Oryza sativa; At: Arabidopsis thaliana; Aq: Amphimedon queenslandica; Dm: Drosophila melanogaster; Pdu: Platynereis dumerilii; Xt: Xenopus tropicalis; Mm: Mus musculus. Pale-red background: non-metazoan Piezo proteins; violet background: metazoan Piezo proteins. For sequence identifiers see Supplementary file 3.
Figure 4—figure supplement 2
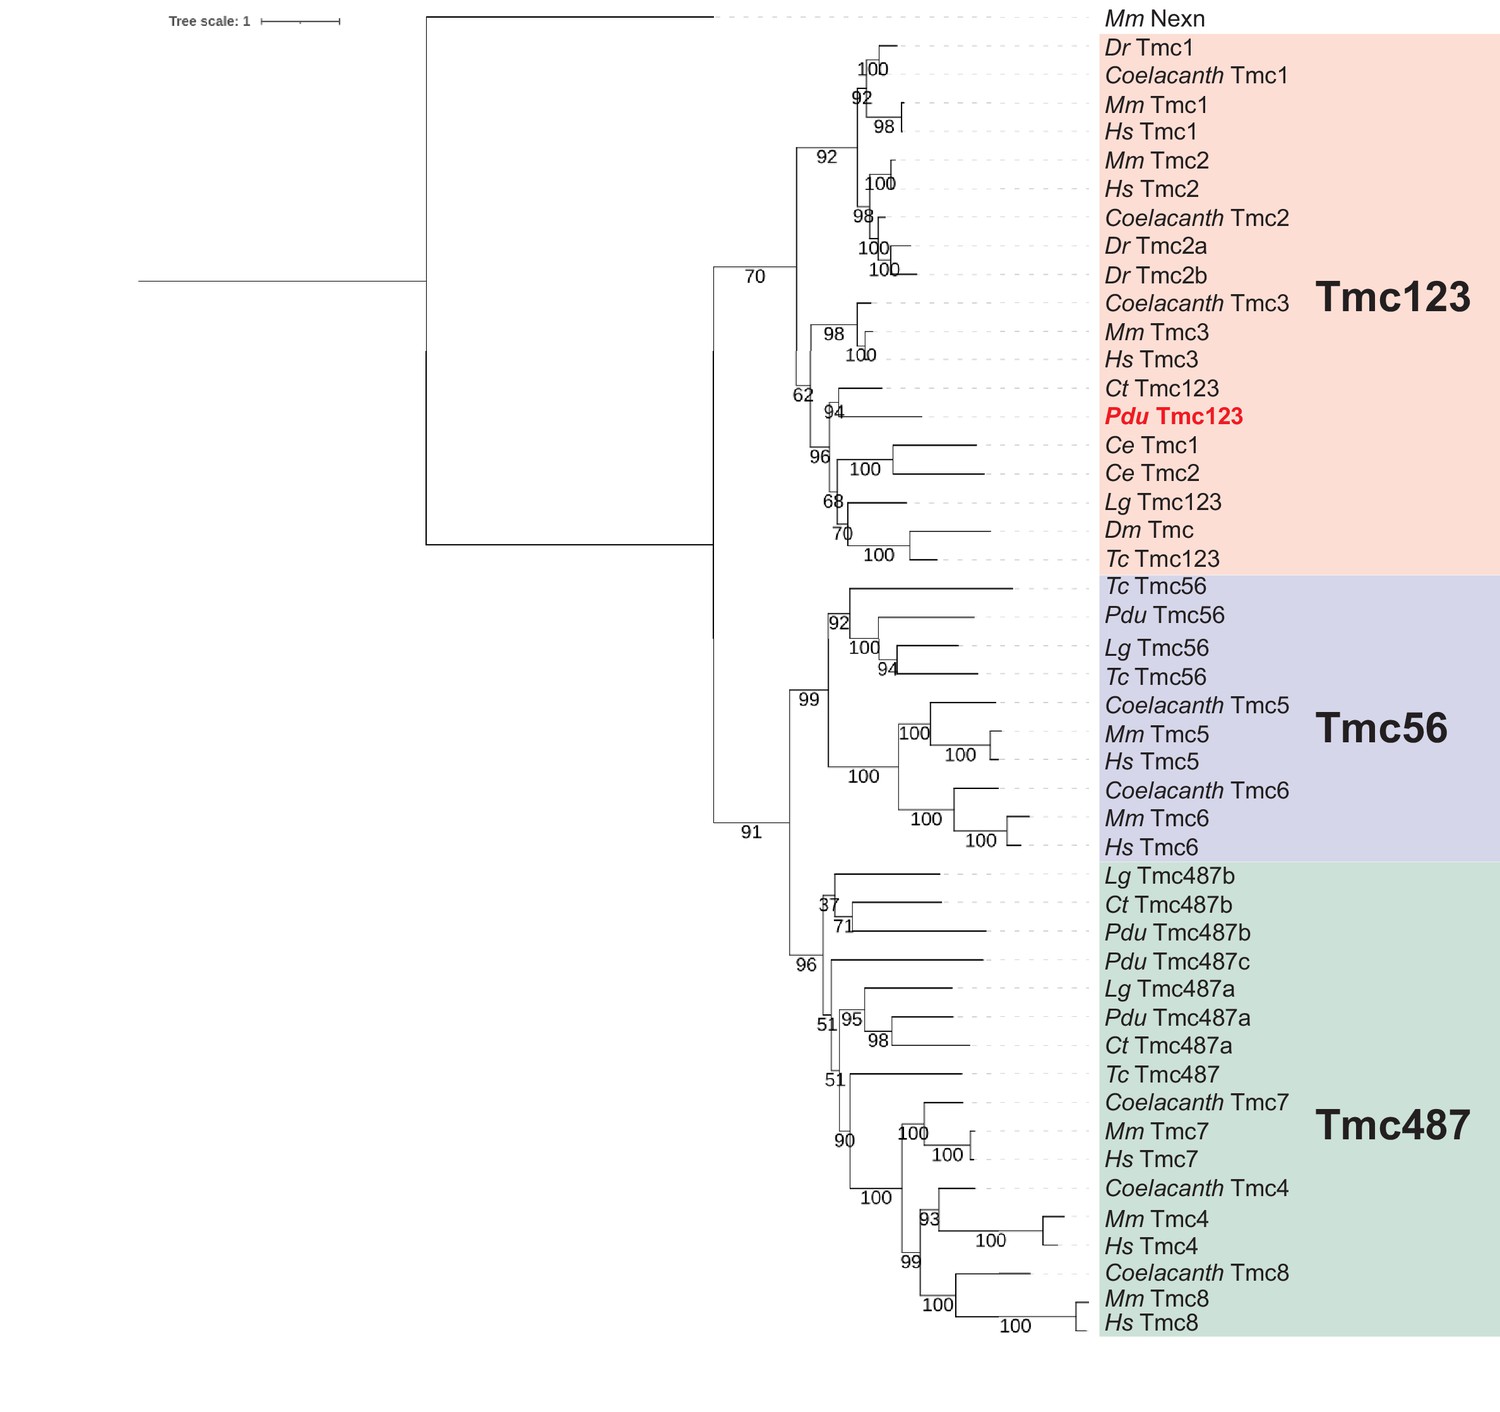
Molecular phylogeny identifies a Platynereis dumerilii Tmc123 ortholog.
Phylogenetic tree including proteins encoded by genes of the tmc gene family and related genes. Mm: Mus musculus; Dr: Danio rerio; Hs: Homo sapiens; Ct: Capitella teleta; Pdu: Platynereis dumerilii; Ce: Caenorhabditis elegans; Lg: Lottia gigantea; Dm: Drosophila melanogaster; Tc: Tribolium castaneum. Pale-red background: Tmc1/Tmc2/Tmc3 proteins; violet background: Tmc5/Tmc6 proteins; green background: Tmc4/Tmc8/Tmc7 proteins. For sequence identifiers see Supplementary file 3.
Figure 4—figure supplement 3
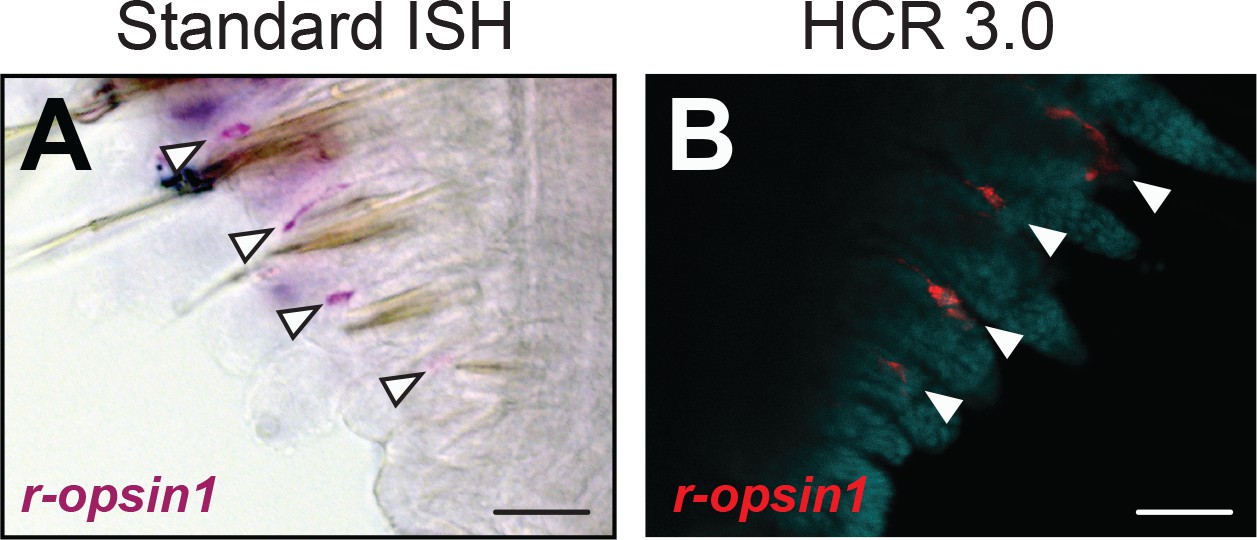
Validation of the hybridization chain reaction (HCR) 3.0 technique in Platynereis dumerilii trunk regenerates.
(A) Standard in situ hybridization (ISH) microscope image of a Platynereis trunk regenerate showing expression of r-opsin1 in a single location in each regenerating parapodium, consistent with the expected location of the trunk r-opsin1-expressing (TRE) cells in regenerating parapodia. Arrowheads indicate the r-opsin1-expressing cells. (B) HCR confocal microscope image (Alexa Fluor 546 fluorescence) of a Platynereis trunk regenerate exposed to a b1-coupled r-opsin1 probe, showing that the HCR 3.0 technique accurately reproduces the r-opsin1 expression pattern determined by the well-established standard ISH. The arrowheads indicate the r-opsin1-expressing cells. Scale bars: 50 µm.
Figure 4—figure supplement 4

Overview expression pattern of nompc, piezo, and pkd2.1 in Platynereis trunk regenerates.
Hybridization chain reaction (HCR) confocal microscope images of Platynereis trunk regenerates showing background fluorescence by the fluorescently labeled HCR amplifier hairpin b2 (A, E) or the HCR fluorescence signal in samples exposed to a b2-coupled nompc probe (B, F), piezo probe (C, G), or pkd2.1 probe (D, H). (A–D) Z projections of HCR signal (Alexa Fluor 546 fluorescence) confocal z-sacans from b2 amplifier hairpins, not associated to any probe (A), or associated to a nompc probe (B), piezo probe (C), or pkd2.1 probe (D). The arrowheads in (B) and (D) indicate some of the locations with HCR signal within the forming parapodia. The asterisks in (D) indicate high expression level at the tips of the forming parapodia. (E–H) Fluorescence signal generated by the DAPI counterstain. The asterisks in (H) indicate the same positions as in (D). Scale bars: 50 µm.
Figure 5 with 1 supplement
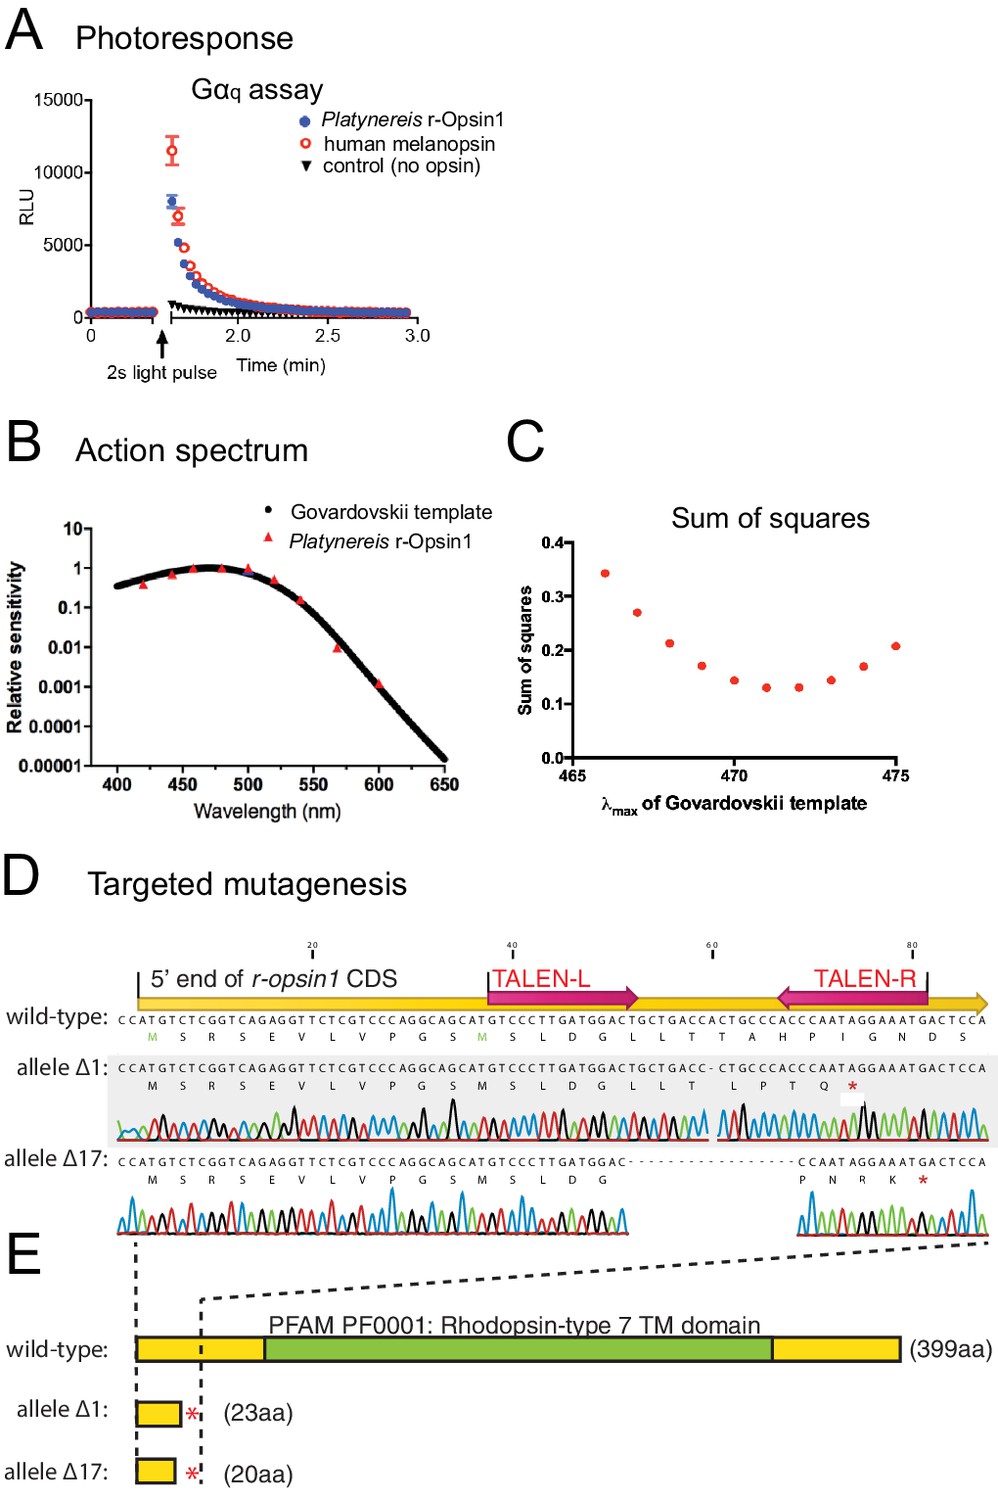
Action spectrum and targeted deletion of Platynereis r-Opsin1, a Gαq-coupled blue light photosensor.
(A) Gαq bioassay, showing an increase in luminescent reporter signal for calcium increase after 2 s white light exposure in cells transfected with Platynereis r-opsin1. The increase in luminescent reporter signal is similar as when cells are transfected with the positive control human melanopsin. n = 3 independent experiments in all cases. For Gαs and Gαi/o assays, see Figure 5—figure supplement 1A, B. (B) Action spectrum of r-Opsin1 (based on light spectra and irradiance response curves shown in Figure 5—figure supplement 1C–F), fit with a Govardovskii curve visual template obtained with a λmax of 471 nm. (C) Plotted sum of squares between action spectra and Govardovskii templates at varying λmax, revealing a minimum for λmax of 471 nm. (D) Targeted mutagenesis of Platynereis r-opsin1. Nucleotide alignment between the 5′ ends of the wild-type (top) and mutant alleles for r-opsin1. In the wild-type sequence, positions of the coding sequence (yellow), and of the TALE nuclease binding sites (red arrows) are indicated. Allele Δ1 contains a single-nucleotide deletion, allele Δ17 lacks 17 nucleotides; both lead to premature stop codons (marked as red asterisks in the corresponding translations). (E) A comparison of the encoded proteins (protein lengths indicated in brackets) reveals that alleles Δ1 and Δ17 lack the complete 7-transmembrane domain (green, PFAM domain PF0001) including the critical lysine residue for retinal binding, strongly predicting the alleles as null alleles.
Figure 5—figure supplement 1
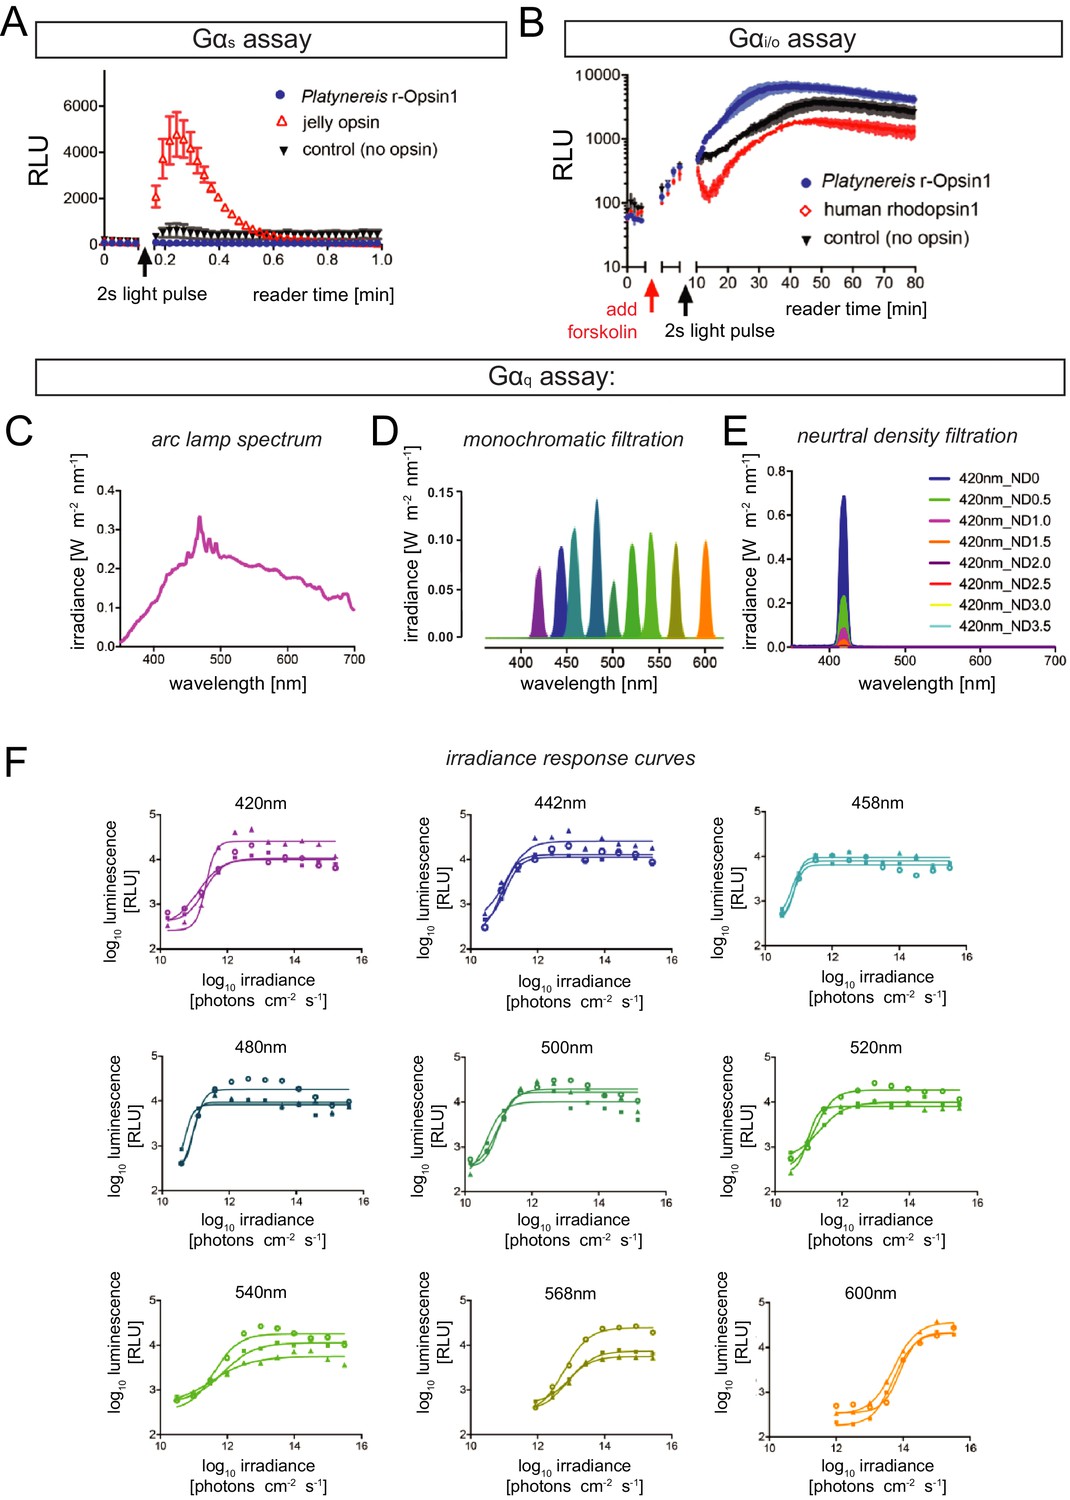
Signaling properties of Platynereis r-Opsin1.
(A) In contrast to reporter cells transfected with a jellyfish opsin construct (red; Bailes et al., 2012), no detectable luminescence increase is observed after a 30 s white light pulse in cells transfected with P. dumerilii r-opsin1 (blue), similar to non-transfected controls (black), indicating that P. dumerilii r-Opsin1 does not activate Gαs. (B) Similarly, while human rhodopsin 1 transfection (red; Bailes et al., 2012) makes reporter cells susceptible to a 2 s white light pulse (reduction in cAMP concentration in cells pre-exposed to Forskolin), untransfected reporter cells (black) or cells transfected with P. dumerilii r-opsin1 (blue) do not appear to activate Gαi/o in P. dumerilii. In (A, B), x axes indicate plate reader time (interrupted by light exposure). Reporters were HEK293 cells transfected with pcDNA5/FRT/TO Glo22F. (C–F) Light spectra and irradiance response curves for the Gαq assay presented in Figure 5. (C) Spectrum of the Arc lamp white light used for all G-protein selectivity assays. (D) Monochromatic light produced from the broad-spectrum Arc lamp light using bandpass filters. (E) Example (at 420 nm) for the effect of neutral density filters on generating different irradiance levels for test in the irradiance response assays.(F) r-Opsin1 irradiance dose–response curves for the Gαq assay shown in Figure 5; panels show the respective wavelength, and the luminescence responses correlated with tested irradiance levels. Respective luminescence values are plotted in relation to the baseline with minimal signal elicited with no light exposure (0% response – no light signal) and the maximum response evoked from that plate (100% response). Each irradiance response curve was fitted with sigmoidal dose–response curve to derive the 50% maximal response used to calculate graphs represented in Figure 5B, C. n = 3 independent experiments in all cases.
Figure 6 with 3 supplements
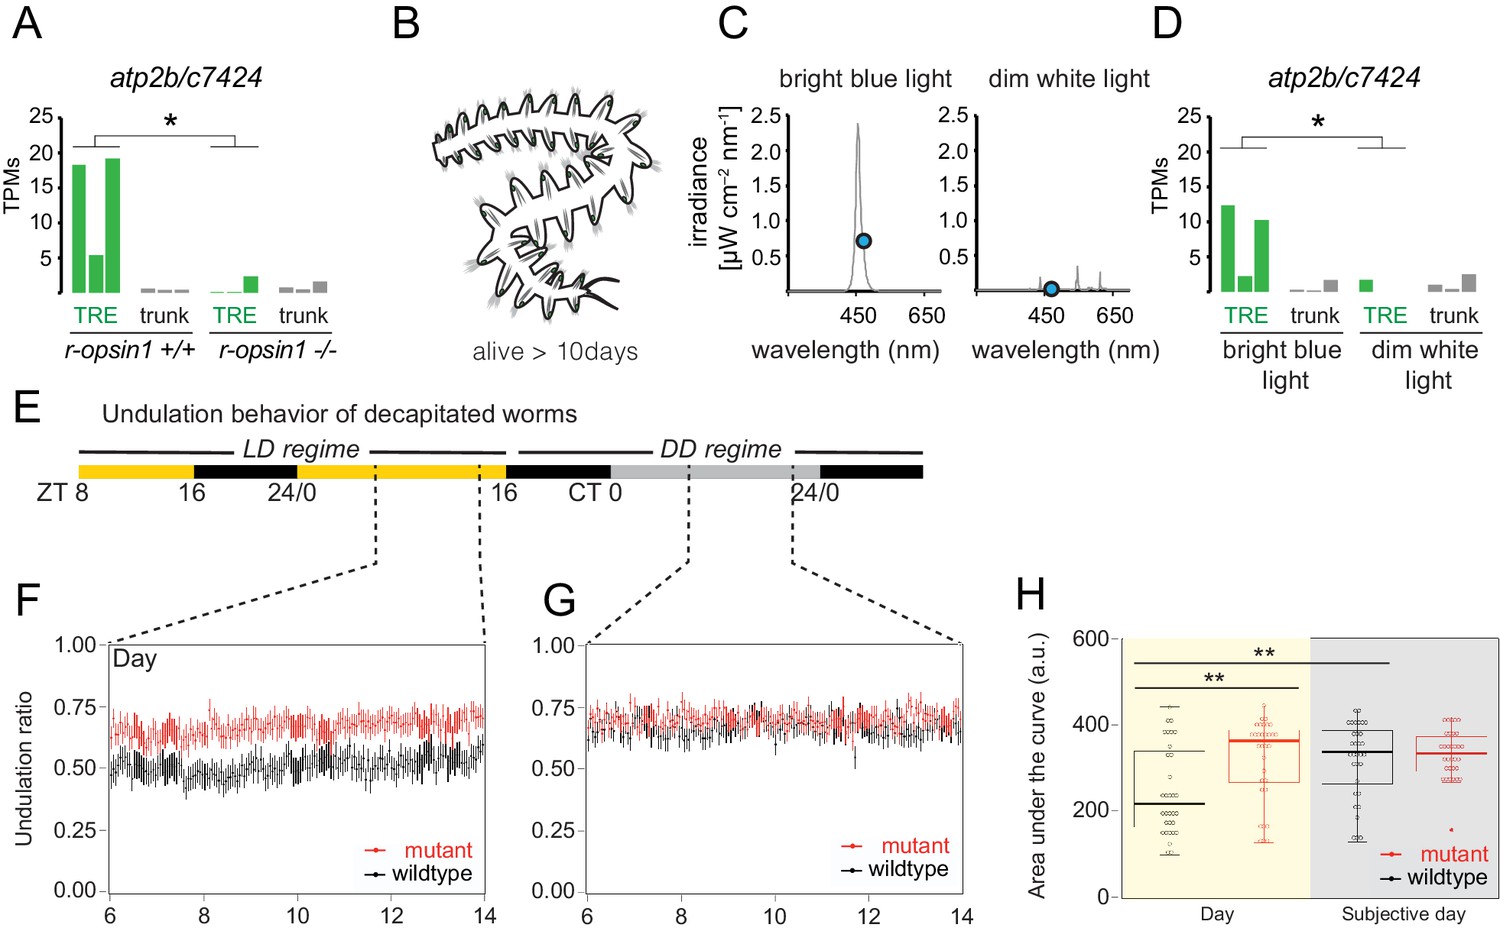
r-opsin1 mediates blue light modulation of trunk r-opsin1-expressing (TRE) signature and undulation behavior.
(A) atp2b/c7424 expression levels (in transcripts per million reads [TPMs]) in individual replicates of r-opsin1+/+ and r-opsin1-/- worms cultured for 3–5 days in bright blue light. For Atp2b2 phylogeny, see Figure 6—figure supplement 1. (B) Scheme of decapitated worm trunks as used in experiments (D–H) that survive for up to 14 days. (C) Spectral profile of bright blue and dim white light. The blue dot indicates the irradiance at 471 nm (λmax of P. dumerilii r-Opsin1). (D) atp2b/c7424 expression levels (in TPMs) in individual replicates of decapitated worms cultured for 3–5 days in bright blue light or dim white light. (E–H) Undulation behavior of decapitated worms. (E) Light regime. Black portions of the horizontal bar indicate ‘night’ (light off), yellow portions indicate ‘day’ (light on), and gray portions indicate ‘subjective day’ (light off during ‘day’ period). ZT: zeitgeber time; CT: circadian time. (F, G) Undulation ratio during ‘day’ (F) and ‘subjective day’ (G). Each black (red) point represents the mean of all wild-type (mutant) worms within a 3 min window, and vertical bars represent the standard error of the mean (n = 32 for each genotype, distributed among three independent experiments). For reliability tests of the algorithm used to detect undulation behavior, see Figure 6—figure supplement 3. (H) Area under the curve obtained from the undulation ratios shown in (F) (yellow background; ‘Day’) and (G) (gray background; ‘Subjective day’). Circles indicate data corresponding to individual worms. Boxplots indicate the median (thick horizontal line), the 50% quantile (box), and 100% quantile (error bars). Filled circle indicates an outlier (as determined by the boxplot function of the ggplot R package). *p-value<0.05; **p-value<0.01 (Wilcoxon rank-sum and signed-rank tests). For behavioral responses to strong light of r-opsin+/+ and r-opsin-/- trunks, see Figure 6—figure supplement 2.
Figure 6—figure supplement 1
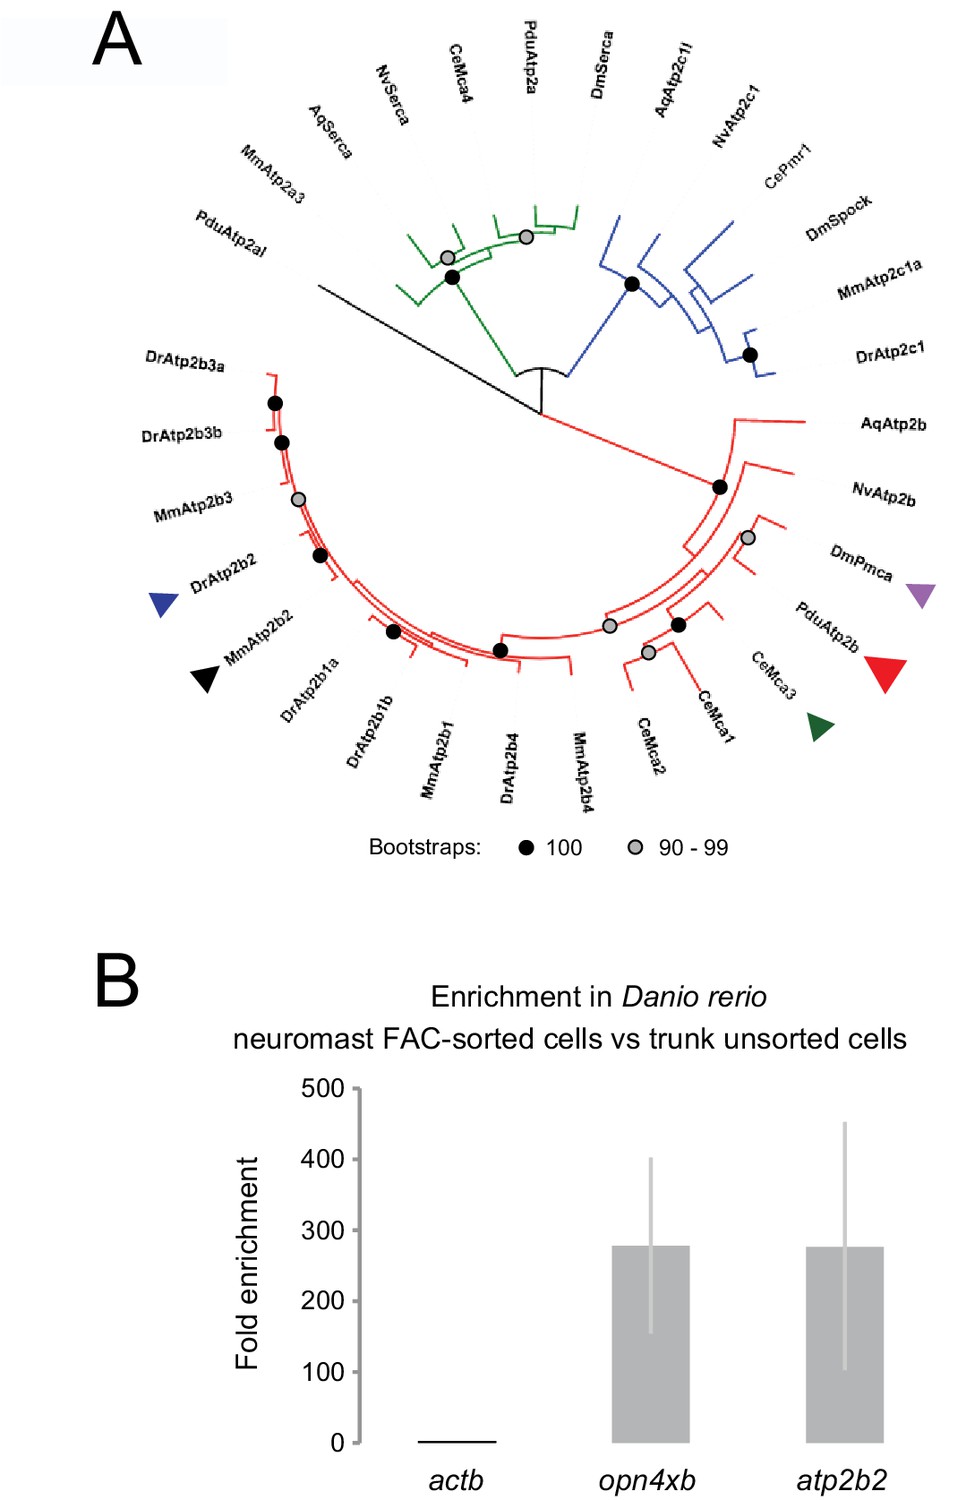
Atp2b2 phylogeny and enrichment of atp2b2 in zebrafish neuromasts.
(A) Phylogenetic tree including Atp2b2 and related genes. Mm: Mus musculus; Dr: Danio rerio; Dm: Drosophila melanogaster; Ce: Caenorhabditis elegans; Pdu: Platynereis dumerilii; Nv: Nematostella vectensis; Aq: Amphimedon queenslandica. Red clade: Atp2b protein family; green clade: Atp2a protein family; blue clade: Atp2c protein family. Arrowheads indicate proteins encoded by genes mentioned in the article: black: mouse Atp2b2; dark blue: zebrafish Atp2b2; Violet: Drosophila Pmca; green: C. elegans Mca-3; red: Platynereis Atp2b. For sequence identifiers see Supplementary file 3. (B) Bar plots indicate fold enrichment of actb, opn4xb, and atp2b2 mRNA expression (measured by quantitative PCR) in neuromast cells (FAC-sorted from fish trunks) as compared to unsorted cells from the same fish trunks. Enrichment values were normalized to actb levels. As opn4xb (previously known as opn4x2) has been shown to be specifically expressed in the neuromasts of the lateral line within the trunk of the fish (Backfisch et al., 2013), the enrichment of opn4xb confirms the correct isolation of neuromasts cells. *p-value<0.05 (Student’s t-test).
Figure 6—figure supplement 2
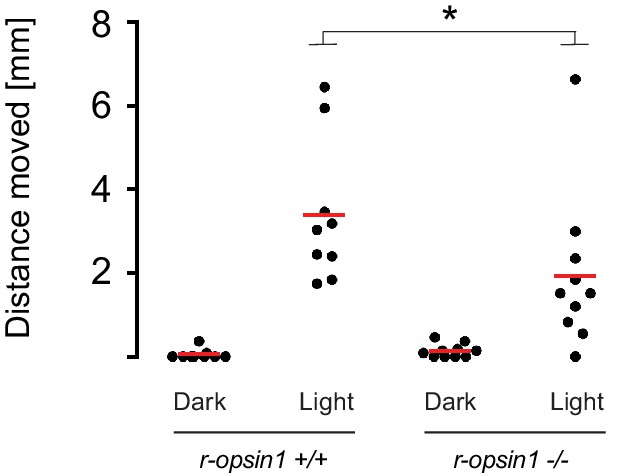
Net avoidance crawling distance of decapitated r-opsin+/+ and r-opsin-/- worms in response to strong light.
Dot plot showing the distance moved (in mm) by worms exposed to a bright light pulse (‘Light’) or not exposed (‘Dark’). *p-value<0.05 (Wilcoxon rank-sum test).
Figure 6—figure supplement 3
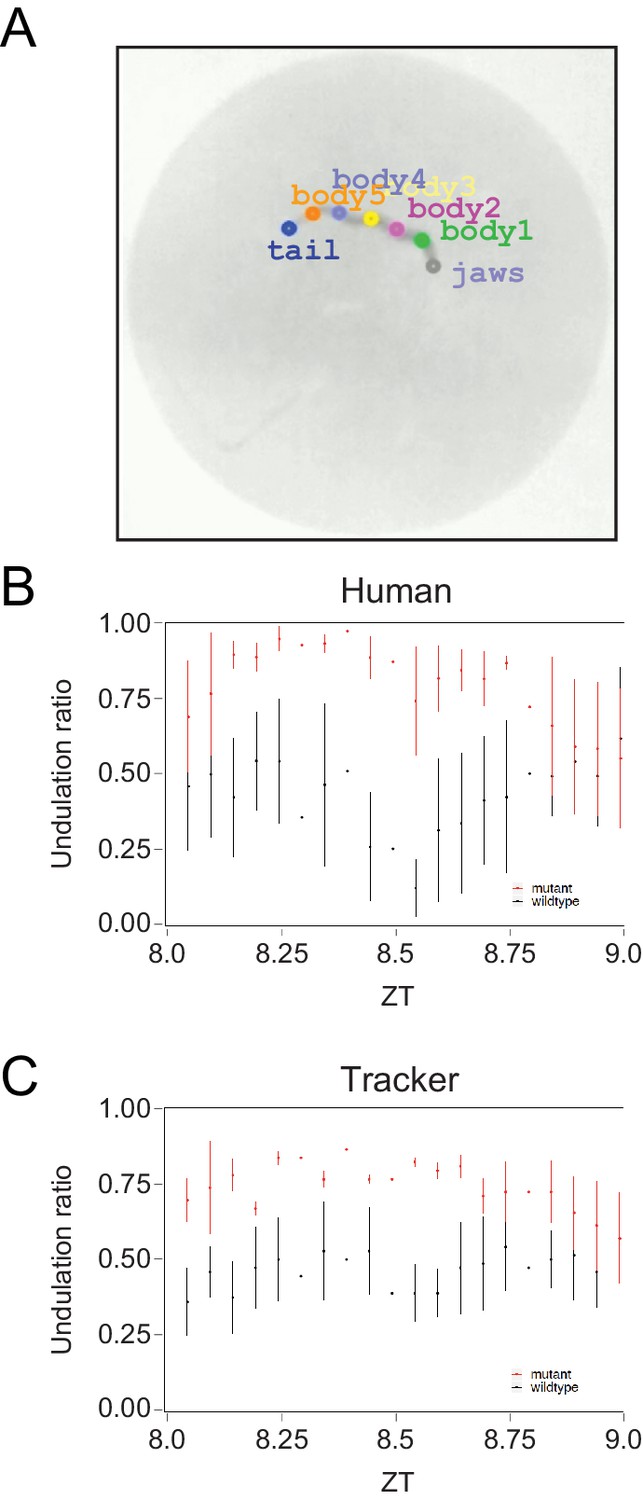
Benchmarking the algorithm used to detect undulation behavior.
(A) Behavior arena of an individual worm showing the key points detected by the automatized tracker along the worm: jaws (‘jaws’), five points along the trunk (‘body1–5’), and tail (‘tail’). (B, C) Undulation ratio of wild-type (black) and mutant (red) worms as determined by a human observer (B) or by the automatized tracker (C). Each point represents the mean of all wild-type or mutant worms within a 3 min window, and vertical bars represent the standard error of the mean (n = 4 for each genotype).
Additional files
-
Supplementary file 1
Synopsis of validated genes identified in the transcriptome profiling.
- https://cdn.elifesciences.org/articles/66144/elife-66144-supp1-v2.docx
-
Supplementary file 2
Sequence identifiers of Platynereis genes analyzed in this study.
- https://cdn.elifesciences.org/articles/66144/elife-66144-supp2-v2.docx
-
Supplementary file 3
Sequence identifiers of protein sequences used for phylogenetic trees.
- https://cdn.elifesciences.org/articles/66144/elife-66144-supp3-v2.xlsx
-
Transparent reporting form
- https://cdn.elifesciences.org/articles/66144/elife-66144-transrepform-v2.docx
Download links
A two-part list of links to download the article, or parts of the article, in various formats.
Downloads (link to download the article as PDF)
Open citations (links to open the citations from this article in various online reference manager services)
Cite this article (links to download the citations from this article in formats compatible with various reference manager tools)
Characterization of cephalic and non-cephalic sensory cell types provides insight into joint photo- and mechanoreceptor evolution
eLife 10:e66144.
https://doi.org/10.7554/eLife.66144


