Separable pupillary signatures of perception and action during perceptual multistability
- Michigan State University, Department of Psychology, United States
- Michigan State University, Neuroscience Program, United States
- Zurich Center for Neuroeconomics, Department of Economics, University of Zurich, Switzerland
- Vrije Universiteit Amsterdam, Netherlands
- Spinoza Centre for Neuroimaging, Royal Academy of Sciences, Netherlands
Figures
Figure 1
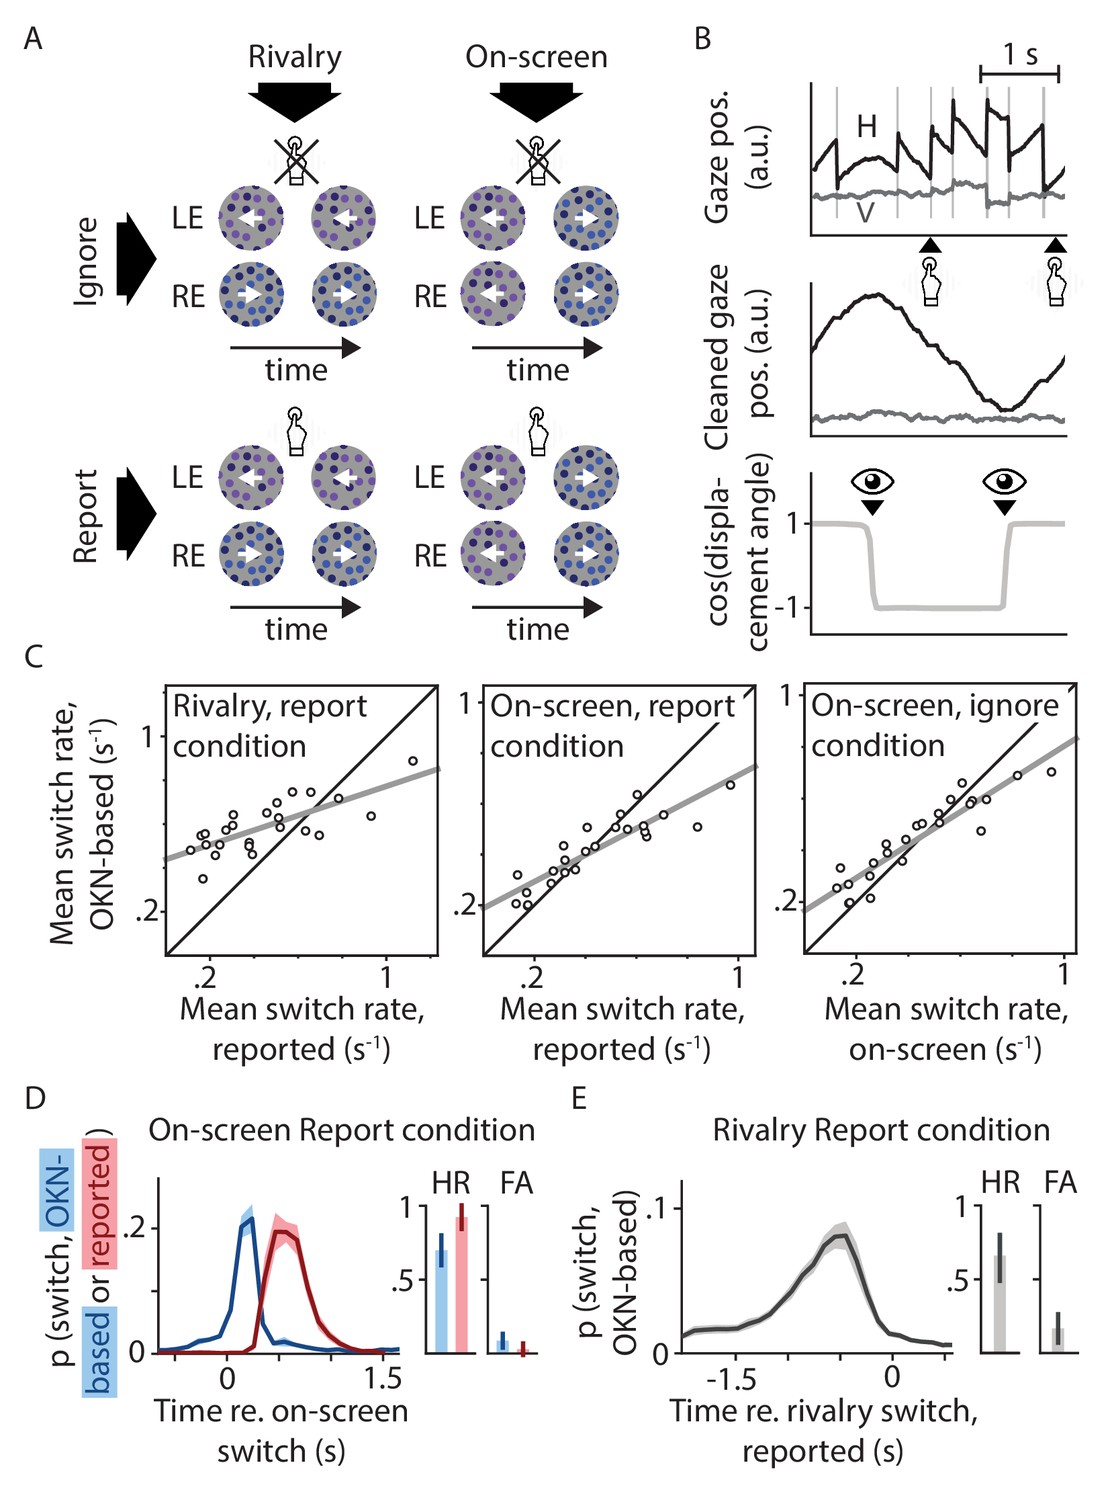
Experimental design and behavioral validation.
(A) Our two-by-two factorial design included both binocular rivalry and on-screen replay, and both conditions where switches in perception were behaviorally relevant and ones in which they were not. (B) Perceptual switch moments in all conditions were identified based on reflexive eye movements (OKN) in response to the moving stimulus. (C) The per-observer numbers of switches identified using this method correlated strongly with the numbers of switches estimated based on manual report or on-screen switch events. Pearson's r values from left to right: 0.75, 0.89, and 0.92; all p<0.0001. (D and E) There was a tight correspondence between the timing of perceptual switches as estimated using these three methods, such that the area under each curve within the 1.5 s period with the bulk of the probability mass (hit rate; HR) was several times higher than the area under each curve across the surrounding 1.5 s (false alarm rate; FA; see Materials and methods for details).
Figure 2
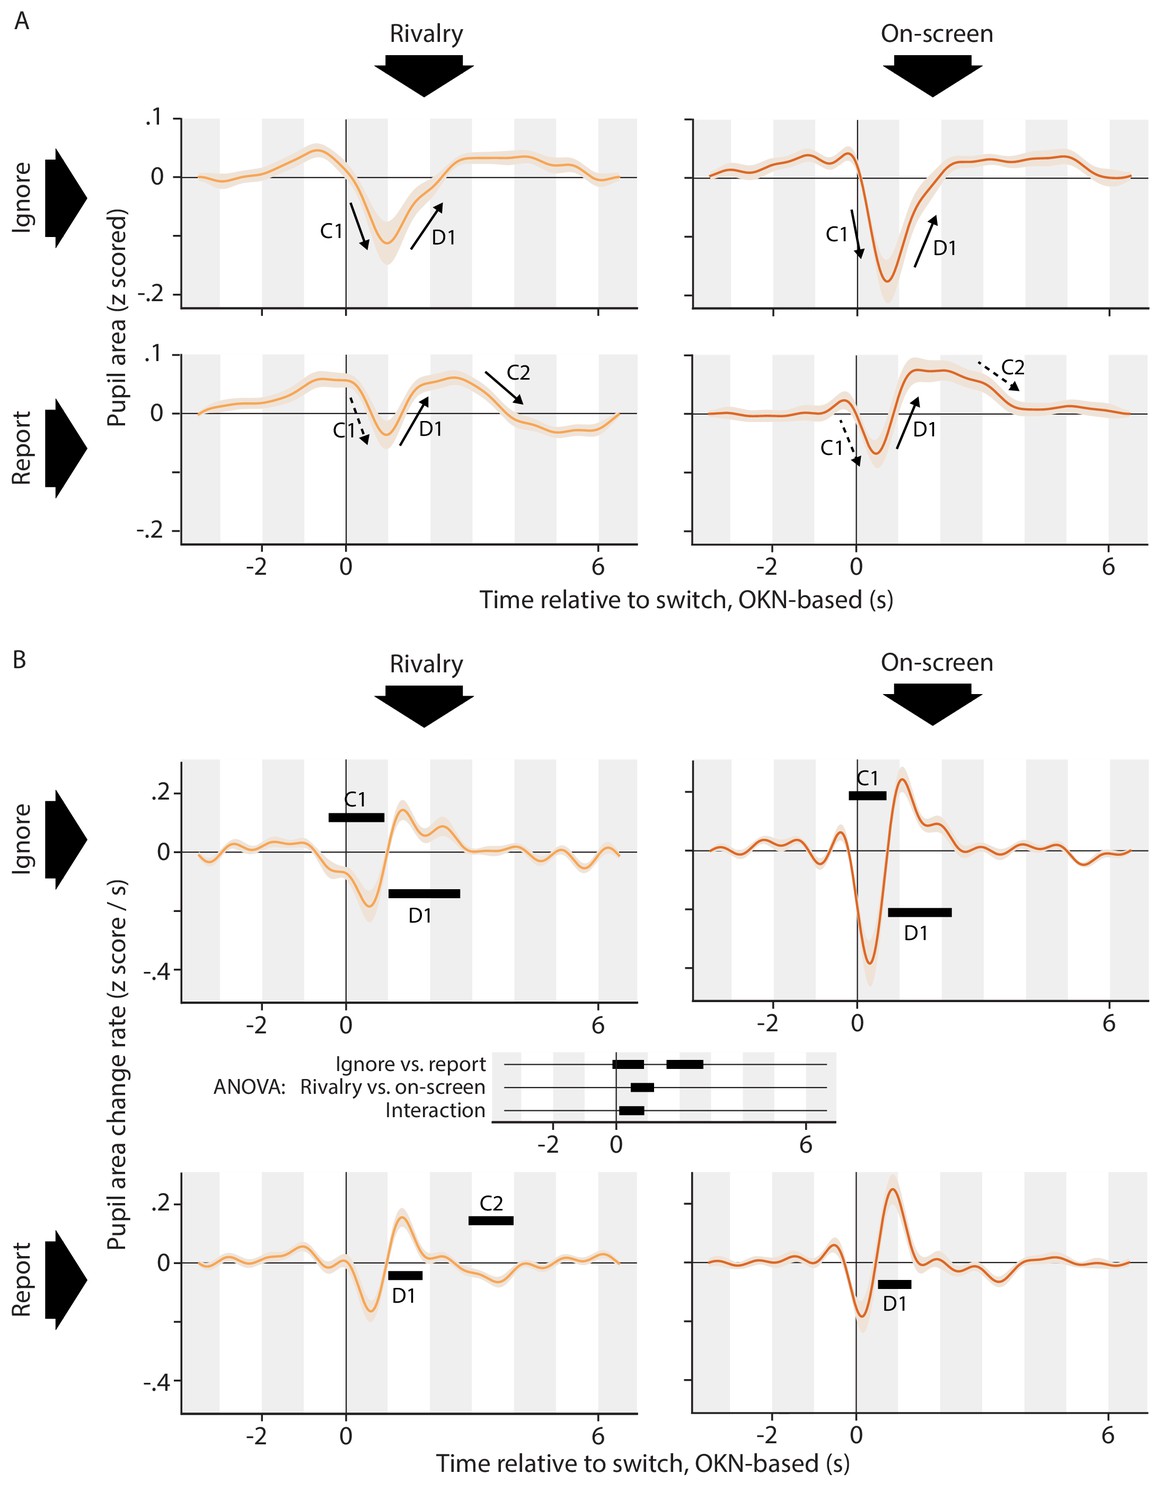
Pupil responses time locked to the perceptual switch.
(A) Pupil area as a function of time around the moment of the perceptual switch for all four conditions. (B) Rate of pupil size change on the same time axis. Black bars within each plot of panel B show time periods during which this rate differs from zero (cluster-level p<0.01). At the center of panel B, between the plots, is a time axis that shows the results of a repeated-measures ANOVA comparing the four conditions, with black bars indicating significant differences (cluster-level p<0.01). All conditions are associated with an initial constriction (C1; significant only in the Ignore conditions) and subsequent dilation (D1; significant in all conditions). Only in the Report conditions does that dilation go substantially pass baseline, to be followed by a second constriction back to baseline (C2; significant in one condition). Consistent with the idea of a more dilation-dominated response in the Report conditions, the pupil change rates reach a lower negative extreme in the Ignore conditions as compared to the Report conditions, yet not as a high a positive extreme. Responses are qualitatively similar between the Rivalry and On-screen conditions, but more pronounced in the latter conditions. This is again borne out by examining the extremes: change rates in the On-screen conditions reach both a lower minimum and a higher maximum. Negative extremes: −0.18 z-score/s (Rivalry Ignore), −0.16 z-score/s (Rivalry Report), −0.38 z-score/s (On-screen Ignore), −0.18 z-score /s (On-screen Report). Positive extremes: 0.14 z-score/s (Rivalry Ignore), 0.16 z-score/s (Rivalry Report), 0.24 z-score/s (On-screen Ignore), 0.25 z-score /s (On-screen Report). All confidence intervals, both in this plot and elsewhere in the paper, show across-observer standard errors of the sample mean.
Figure 3
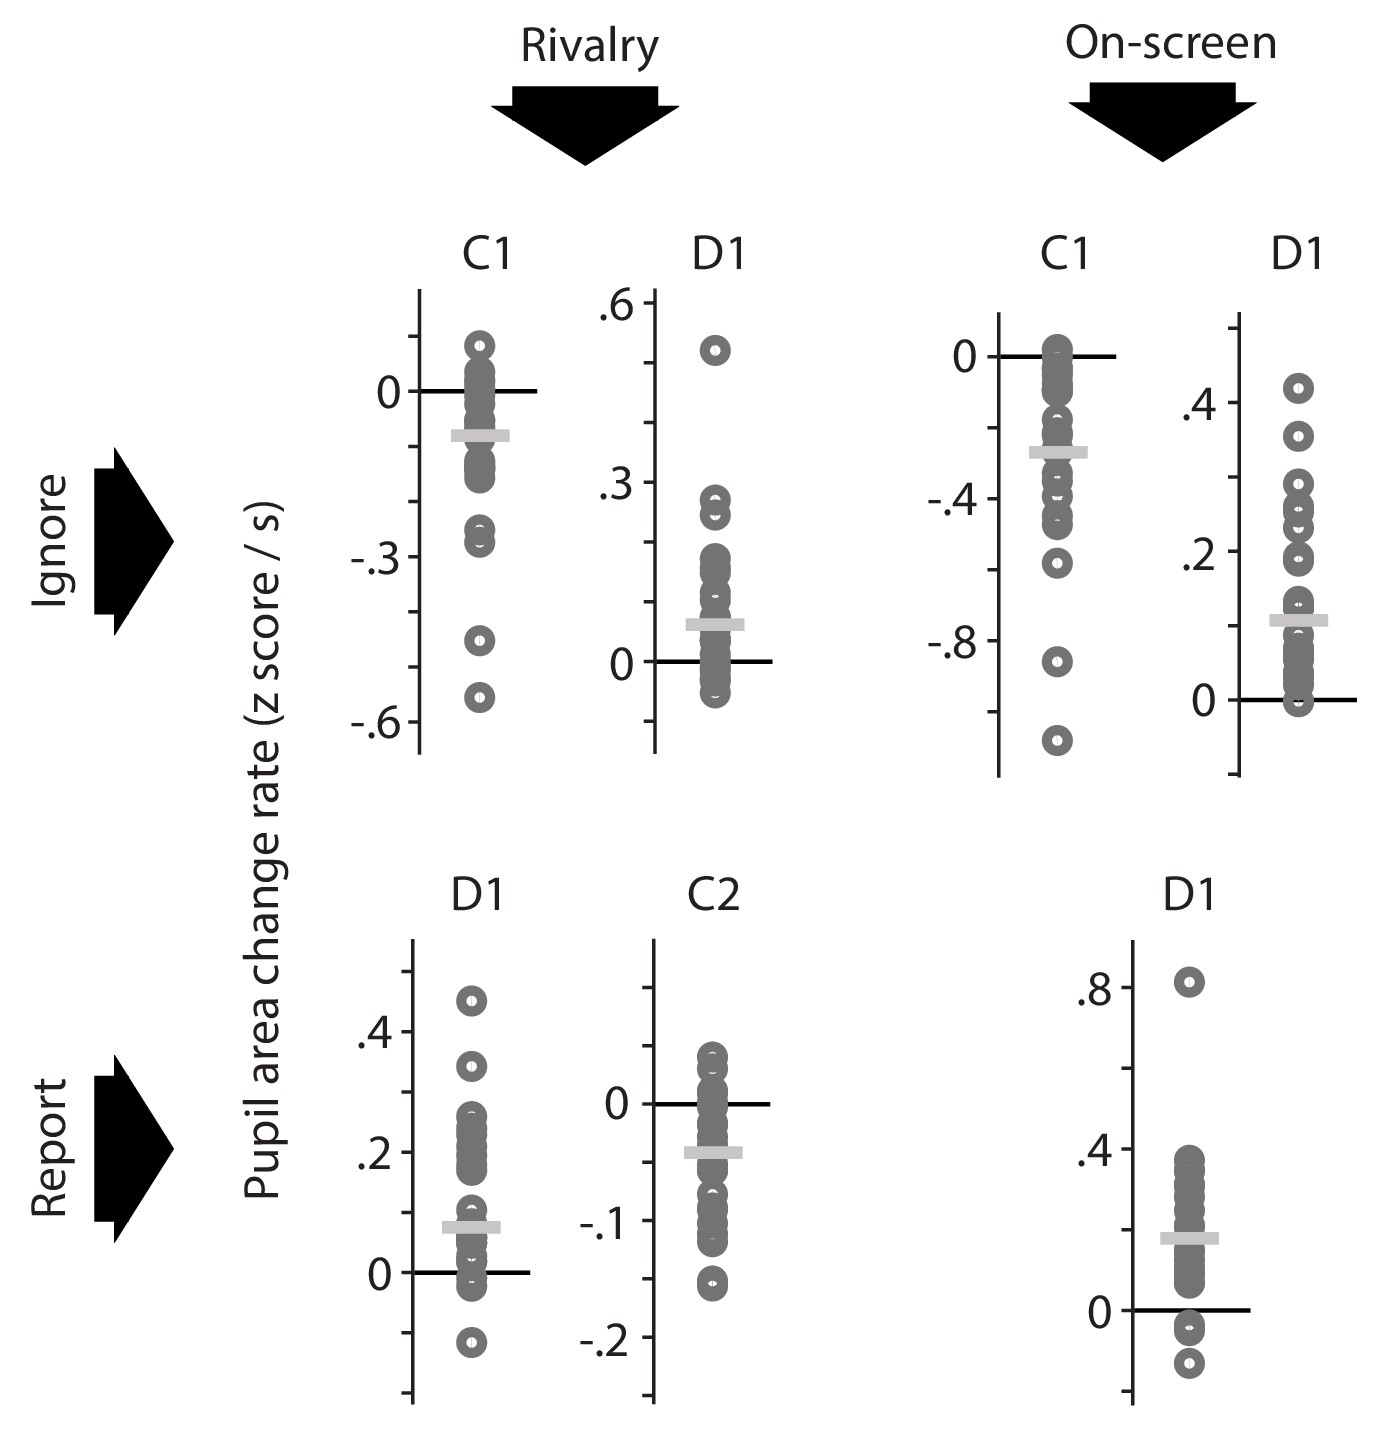
Per-observer summary data corresponding to the effects marked as significant (based on across-observer statistics) in the plots of Figure 2B.
For each time period during which the pupil area change rate differs significantly from 0, as marked in Figure 2B, this figure shows the average pupil area change rate of each individual observer (dark gray circles) as well as the median of those per-observer averages (light gray horizontal lines). For each of the time intervals, the majority of individual observers numerically show an effect in the same direction as the across-observer average, which indicates that across-observer significance here arises from data patterns that are fairly consistent across observers rather than being carried by a select number of outliers.
Figure 4
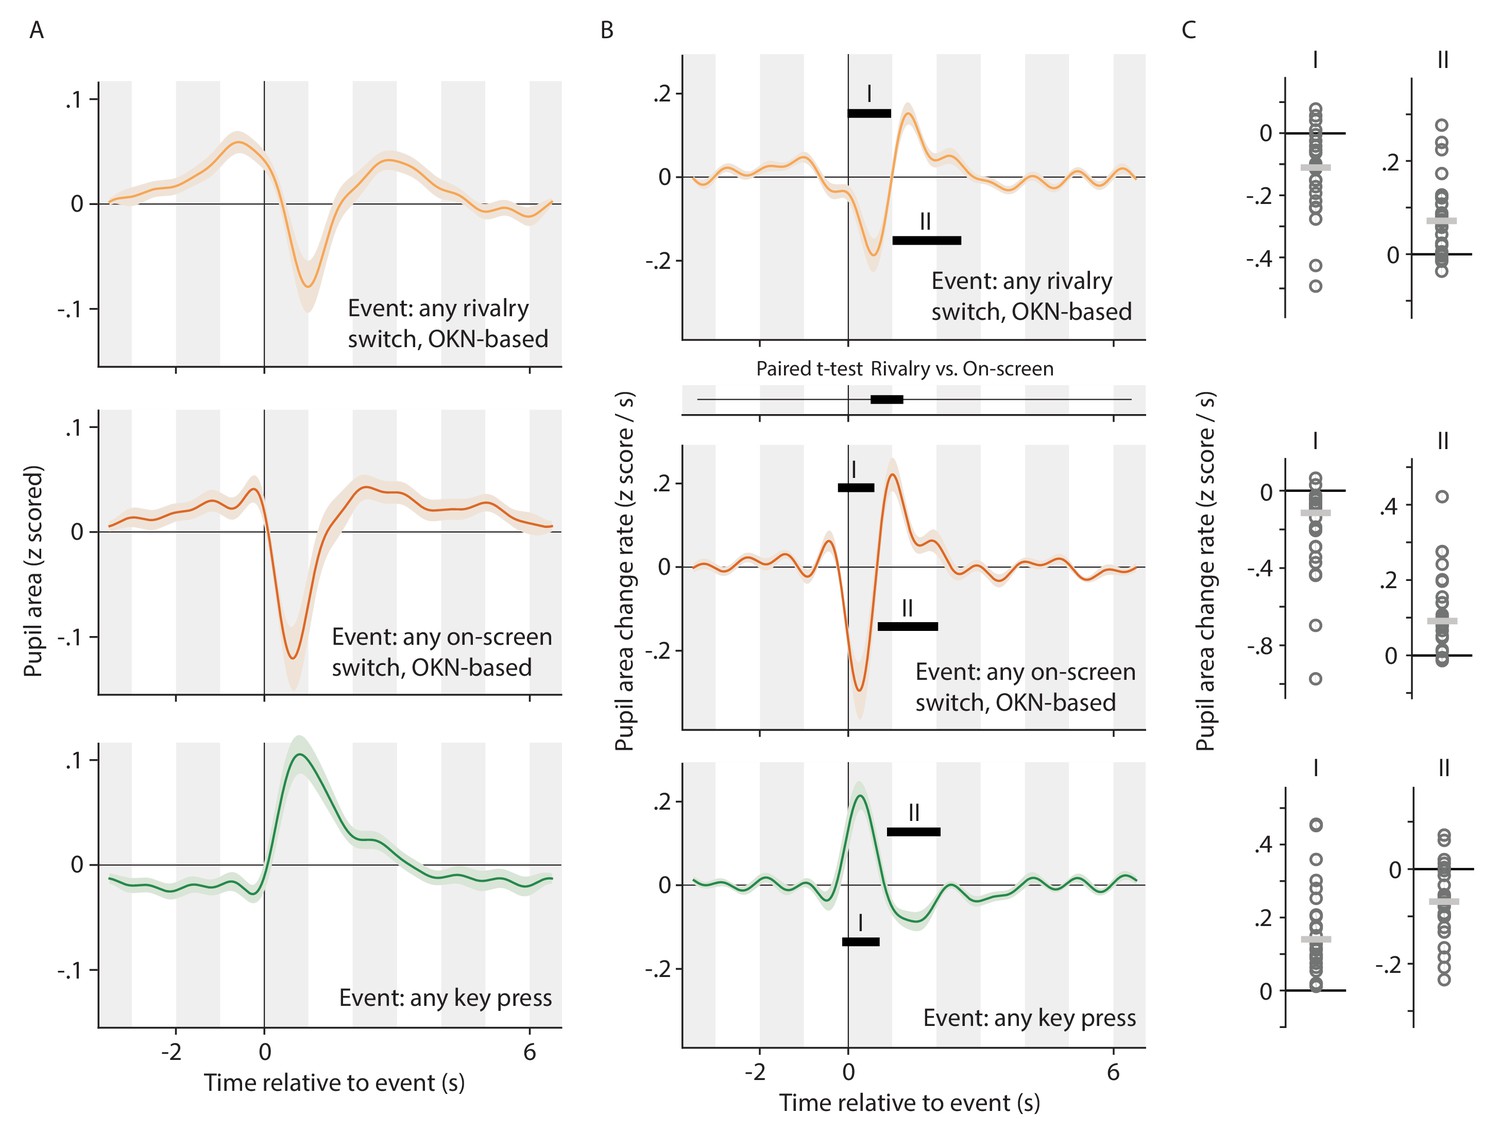
Alternative analysis of the data underlying Figure 2, now concatenating pupil signals across conditions, and regressing key press events and (rivalry or on-screen) switch events separately.
This allows the pupil response associated with switches to be teased apart from the pupil response associated with key presses, even in the data from the Report conditions where the two consistently overlap. All plotting conventions in panels A and B are as in Figure 2, but the time axis between the top and center plot of column B now shows the results of a paired t-test. All plotting conventions in panel C are as in Figure 3.
Figure 5
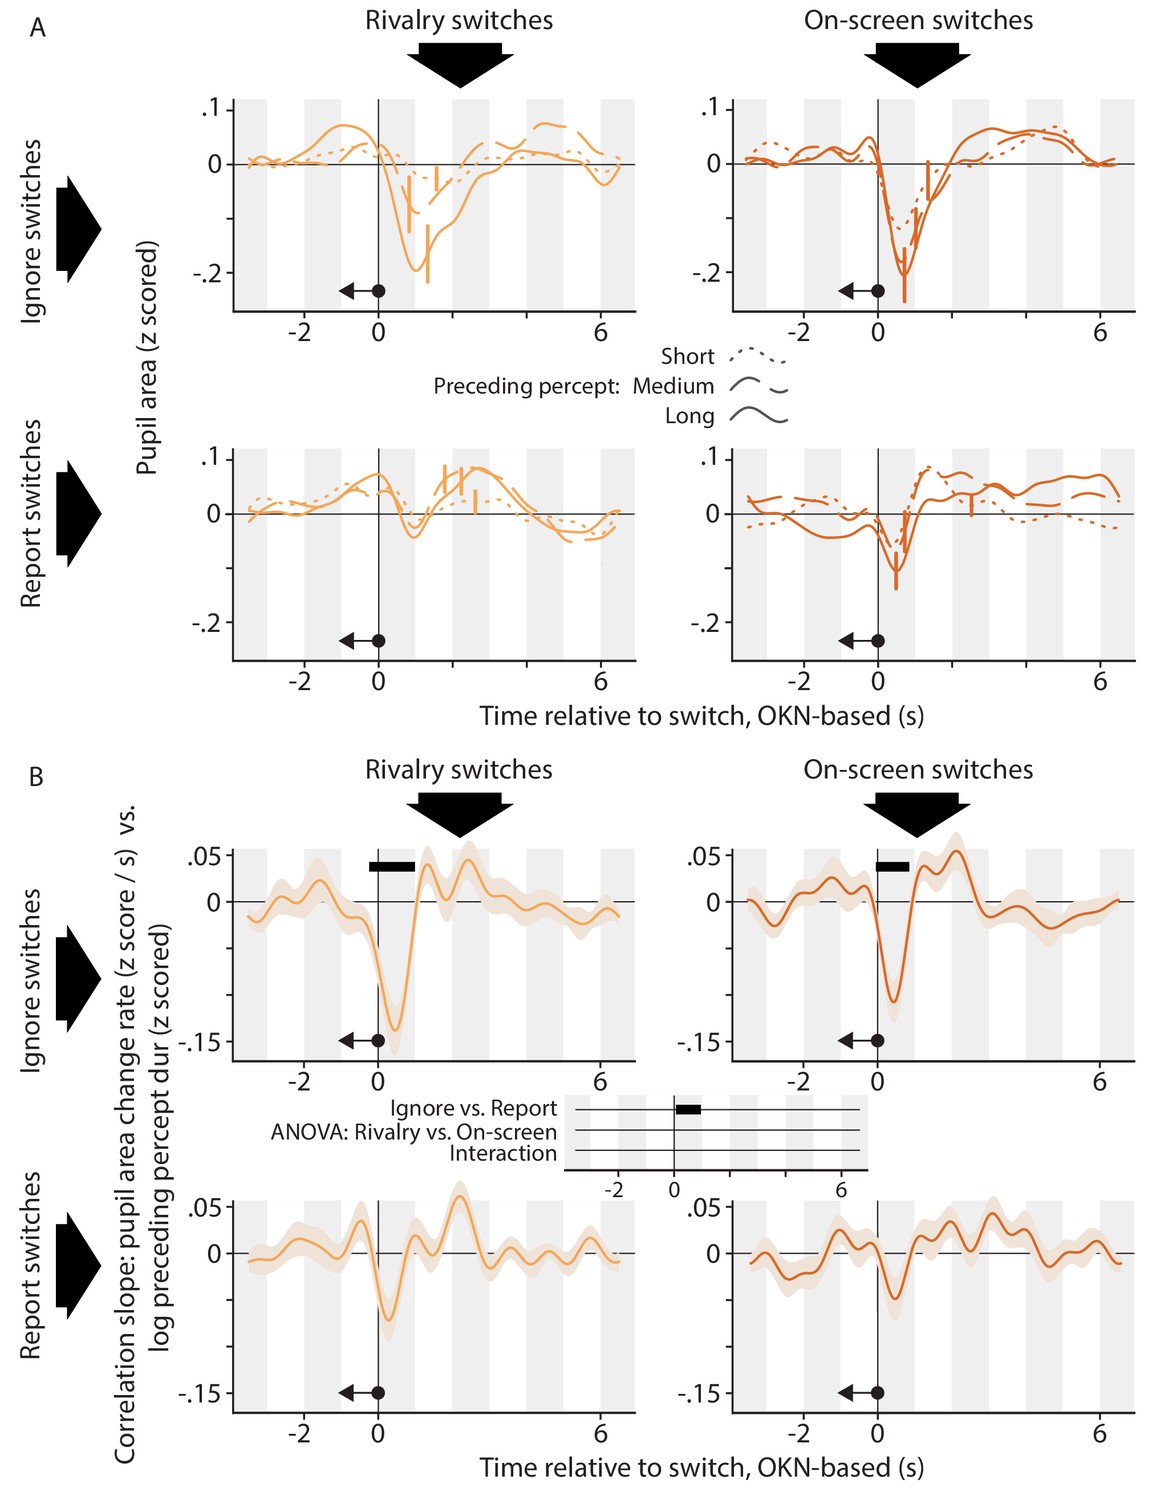
The relation between the pupil response associated with a perceptual switch and the duration of the perceptual dominance duration that preceded that switch.
(A) Each plot shows, for a different condition, pupil size surrounding the moment of a perceptual switch, separated out into three equal-sized groups of perceptual switches on the basis of the preceding dominance duration (dotted curves: short; dashed curves: medium; solid curves: long). (B) Each plot shows, for a different condition, how the rate of pupil size change correlates, per time point in the interval that surrounds perceptual switches, with the duration of the preceding dominance duration. We performed inferential statistics only on the data of panel B; not A. All plotting conventions are as in Figures 2 and 4.
Figure 6

The relation between the pupil response associated with a perceptual switch and the duration of the perceptual dominance duration that follows that switch.
The organization of this figure is identical to that of Figure 5.
Appendix 1—figure 1
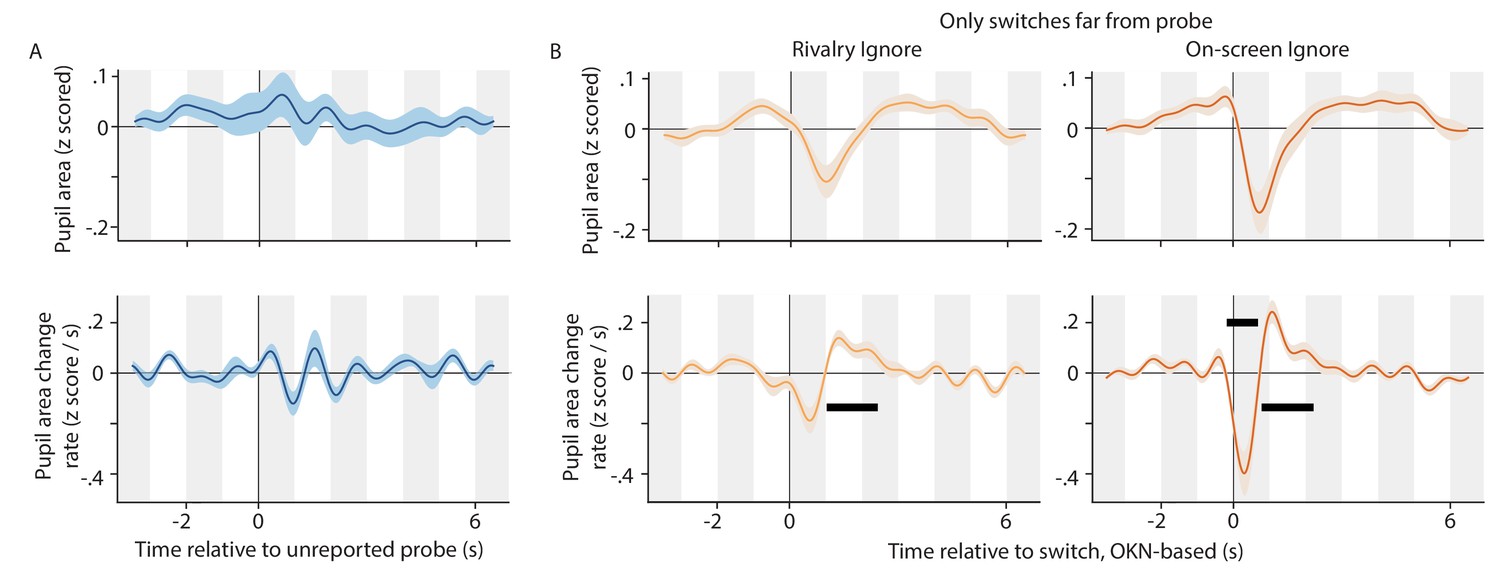
The impact of dot size probes on pupil size.
(A) Pupil area (top) and pupil area change rate (bottom) during the time period surrounding unreported dot size probes. The pupil change rate is not significant at any point in this period. (B) The switch related pupil response during the Ignore conditions, using only switches that were at least 1.5 s removed from the nearest dot size probe.
Appendix 1—figure 2
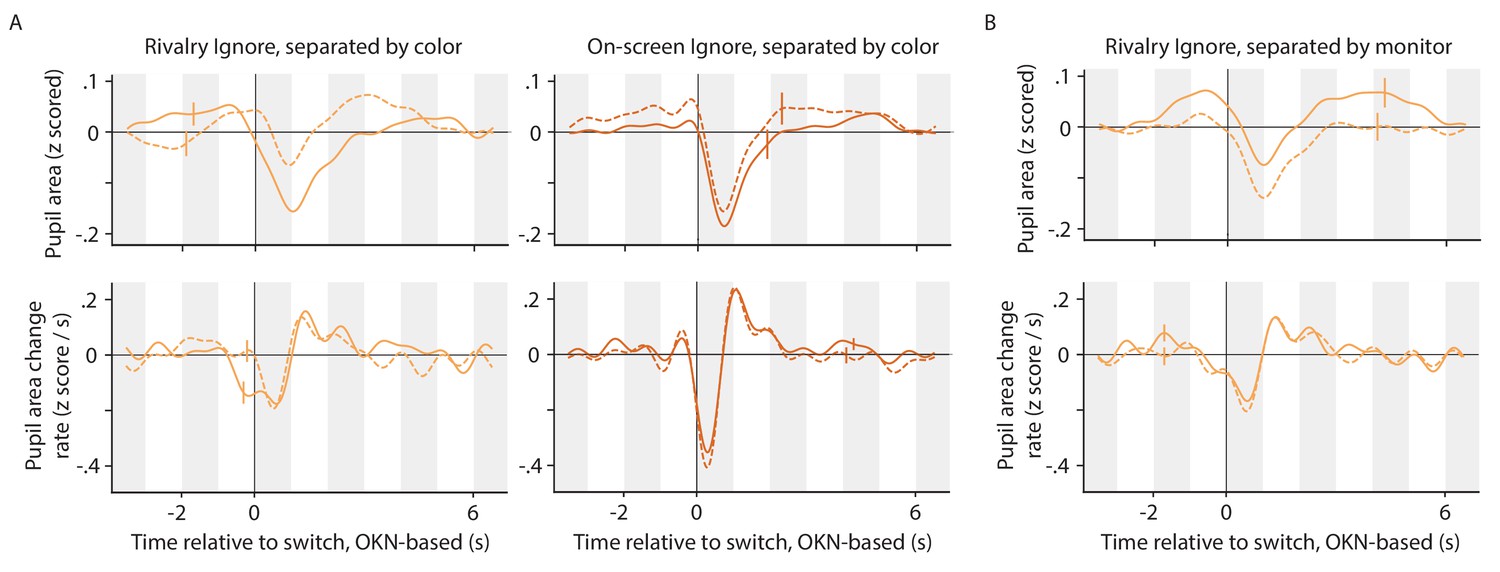
Switch-related pupil responses for switches in various 'directions'.
(A) Switch-related pupil responses in both Ignore conditions, separated by the color/motion direction of the (perceived) stimulus following the switch (motion direction was yoked to color in our experiment). Within each plot each line corresponds to one of the two colors. (B) Switch-related pupil responses in the Rivalry Ignore condition, separated by the eye/monitor associated with the perceived stimulus following the switch.
Appendix 1—figure 3
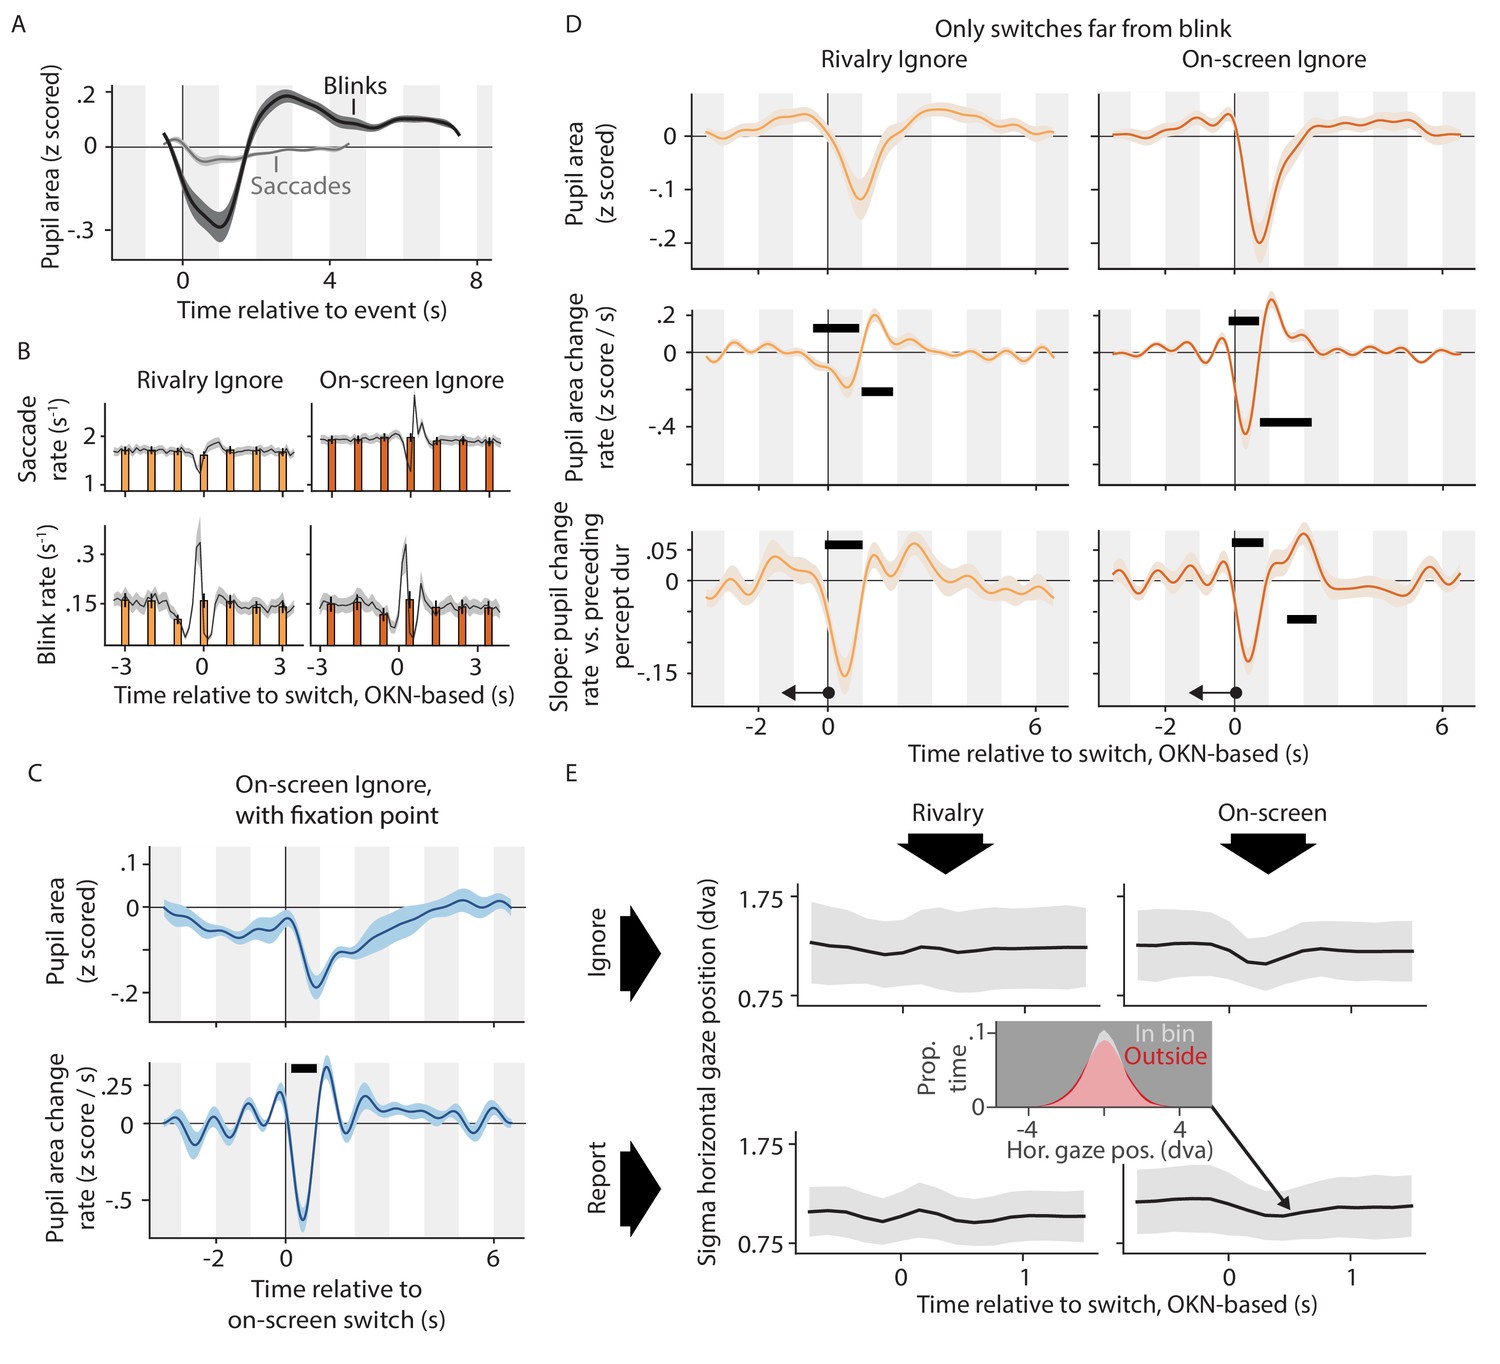
The role of blinks and saccades in shaping switch-related pupil responses.
(A) All linear models underlying the main text figures included designated regressors for blink events and saccade events. Pupil response shapes linked to those events are shown here for one of those models (these results are highly similar across the various models). (B) Saccade rate (top plots) and blink rate (bottom plots) during the time period around the perceptual switch in two of our conditions, assessed both at a fine time scale (black curves and gray confidence intervals) and at a coarse scale of 1 s per bin (bar charts). (C) Pupil response near the moment of on-screen switches in a variant of the On-screen, ignore condition in which we removed a circular region (radius: 0.72 dva) from the center of the stimulus and included a binocular fixation point in the middle, instead. (D) Re-analysis of the main dataset for two conditions, now focusing exclusively on switches that are at least 1.5 s removed from the closest eye blink. Both the switch-related pupil response (top and center plots) and its dependence on the previous percept duration (bottom plots) are similar to the main result, obtained using switches irrespective of nearby blinks (main text Figures 2 and 5). (E) The width of the horizontal gaze position distribution as a function of time relative to perceptual switches. For each time point each plot shows the width of the distribution of all on-screen gaze positions recorded within a 200 ms window centered on that time point relative to a perceptual switch. The inset shows, for one such time point, the distribution of gaze positions recorded within this window (in gray) and the distribution of gaze positions recorded outside of the window (in red; pink is the area of overlap). For the analysis of figure E we took the average gaze position across an entire 60 s trial to correspond to the center of the screen. This is because our experiment design was optimized for assessing pupil size and gaze direction change (i.e. OKN); not for assessing absolute gaze direction. In particular, our drift correction procedure at the start of each trial had a rather large tolerance for absolute gaze errors, in order not to interrupt the experiment with additional calibration procedures (see main text Materials and methods, section Stimulus and task). Unless otherwise stated, all conventions in this figure are the same as those introduced in main text Figures 2, 4, 5 and 6.
Appendix 1—figure 4
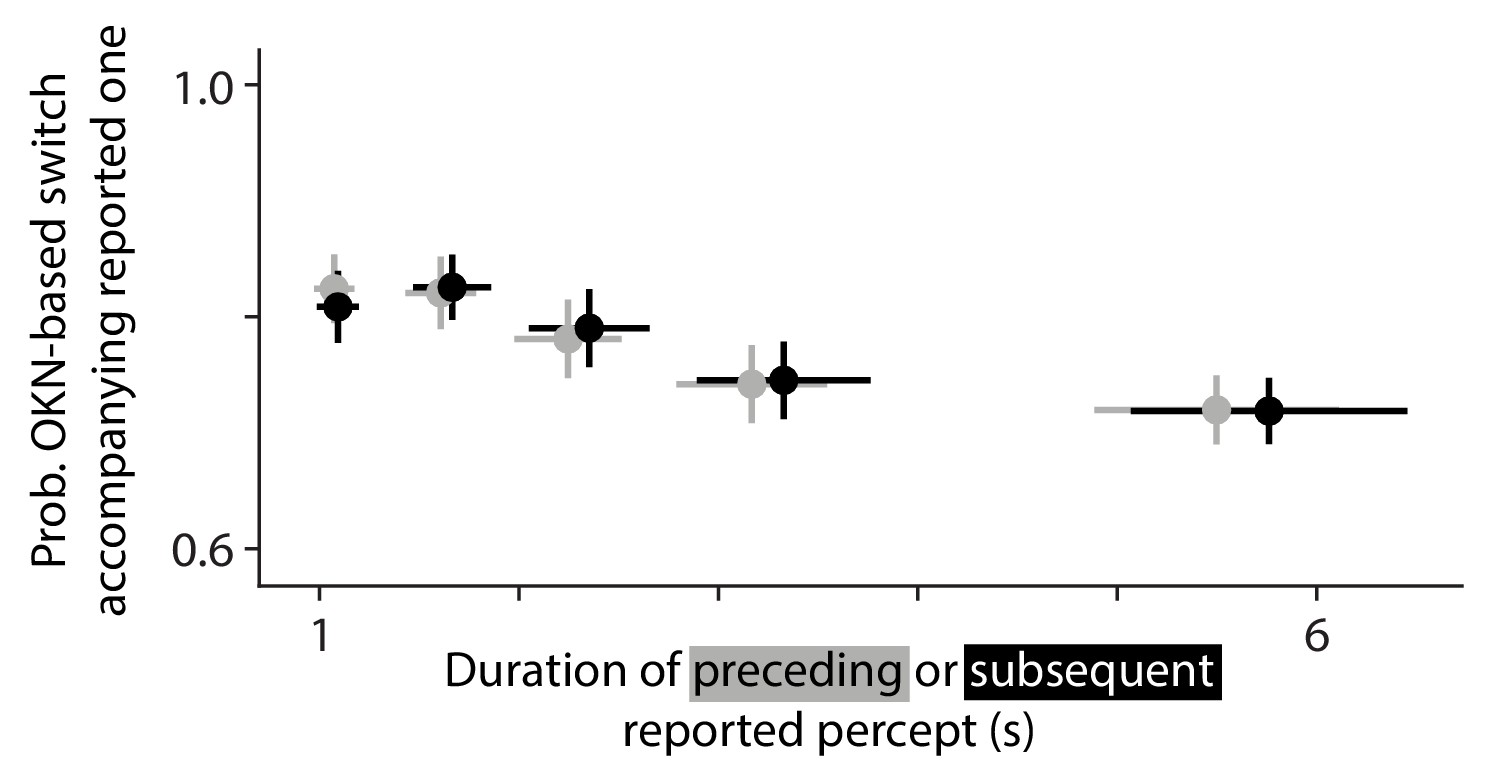
How performance of the OKN-based switch detection algorithm depends on flanking percept durations.
Here, we investigated whether the reported percept duration that precedes (gray) or follows (black) a given reported switch, affects the probability that that reported switch is accompanied by a switch marked by the OKN-based algorithm. Across five percentiles of these flanking percept durations the probability is relatively stable at about 75%, and it decreases slightly for key press reports that terminate, or initiate, relatively long percepts.
Appendix 1—figure 5
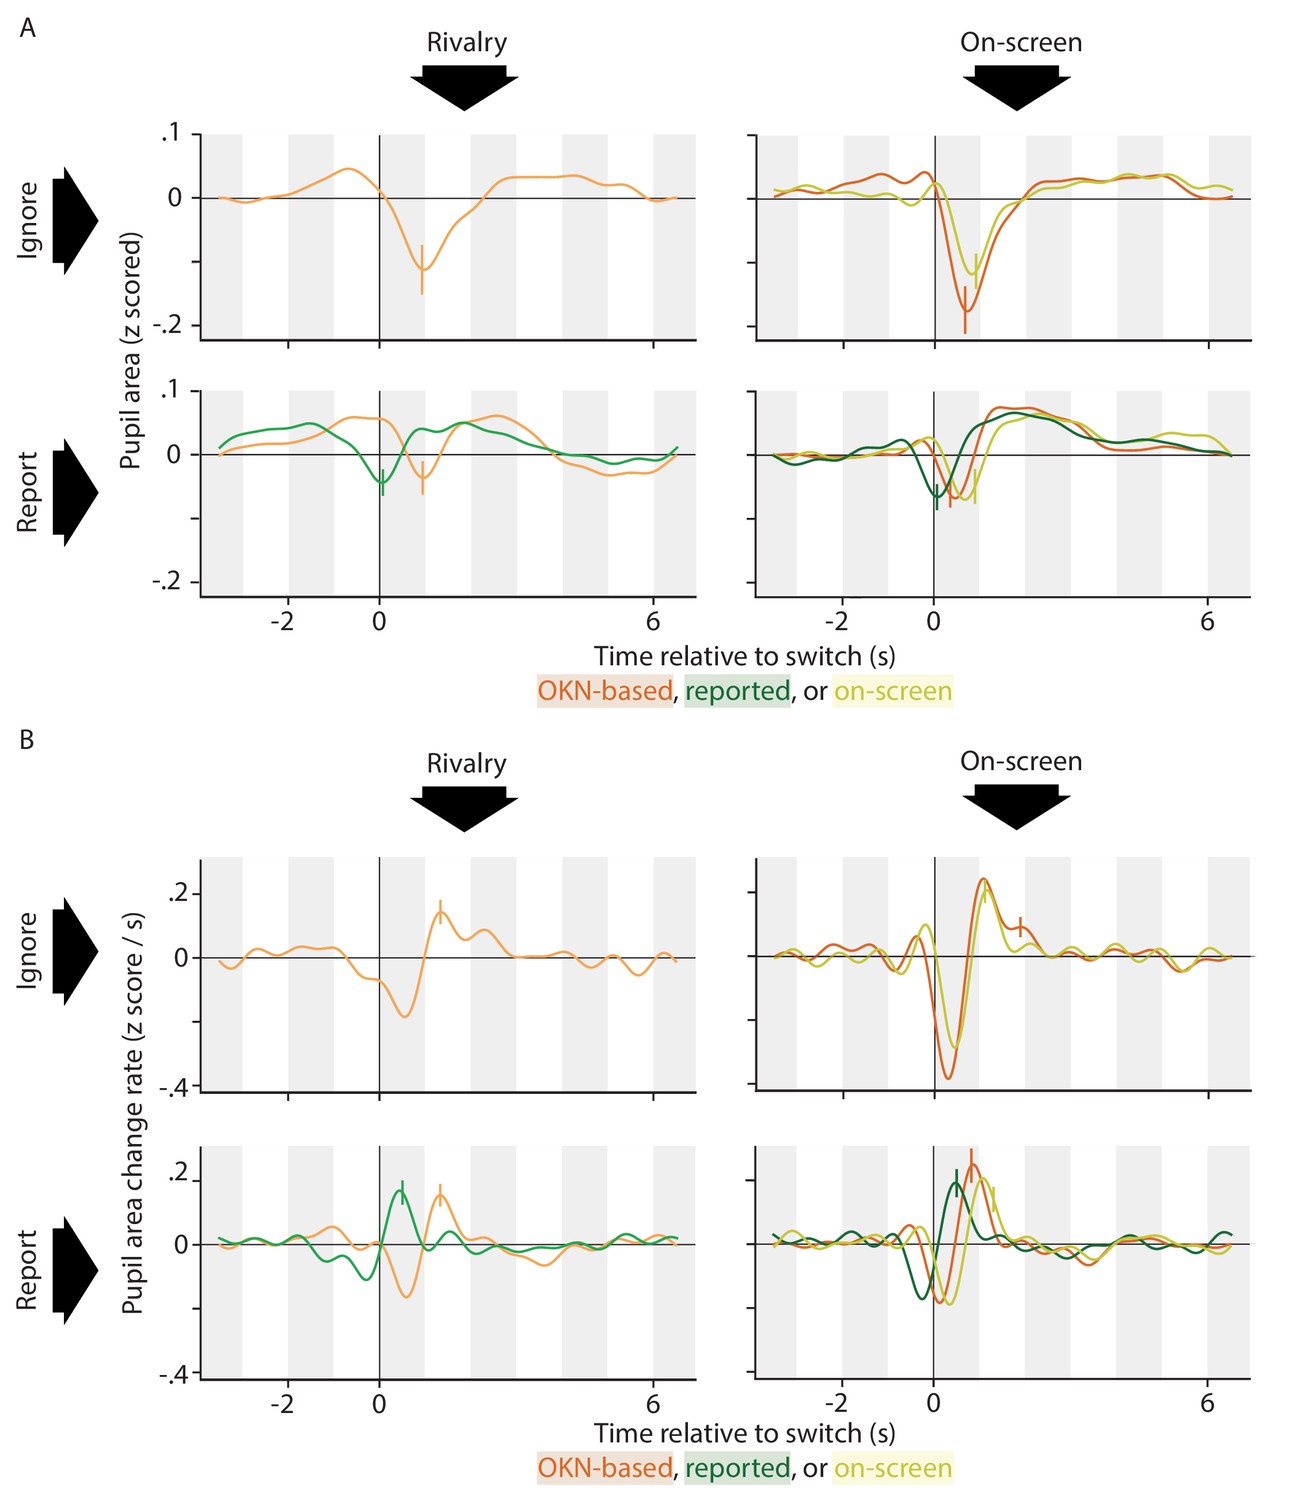
Switch-related pupil responses (both pupil area, top, and pupil area change rate, bottom) estimated while using three different methods for identifying perceptual switches.
Although the OKN-based method is the only one that is available in all conditions, the match with the other two methods (based on manual report, and based on on-screen events) is good in those conditions where those other methods apply. The only marked difference between methods is a temporal shift in the estimated pupil response curves, in agreement with the fact that on-screen switches happen first, followed a little later by a reversal in OKN direction, and yet later by a key press response.
Appendix 1—figure 6

The per-observer pupil response curves that underlie the across-observer average curves of main text Figure 2A.
Each panel corresponds to one of the included observers, and the four curves within each panel correspond to the four conditions (see legend on top).
Appendix 1—figure 7
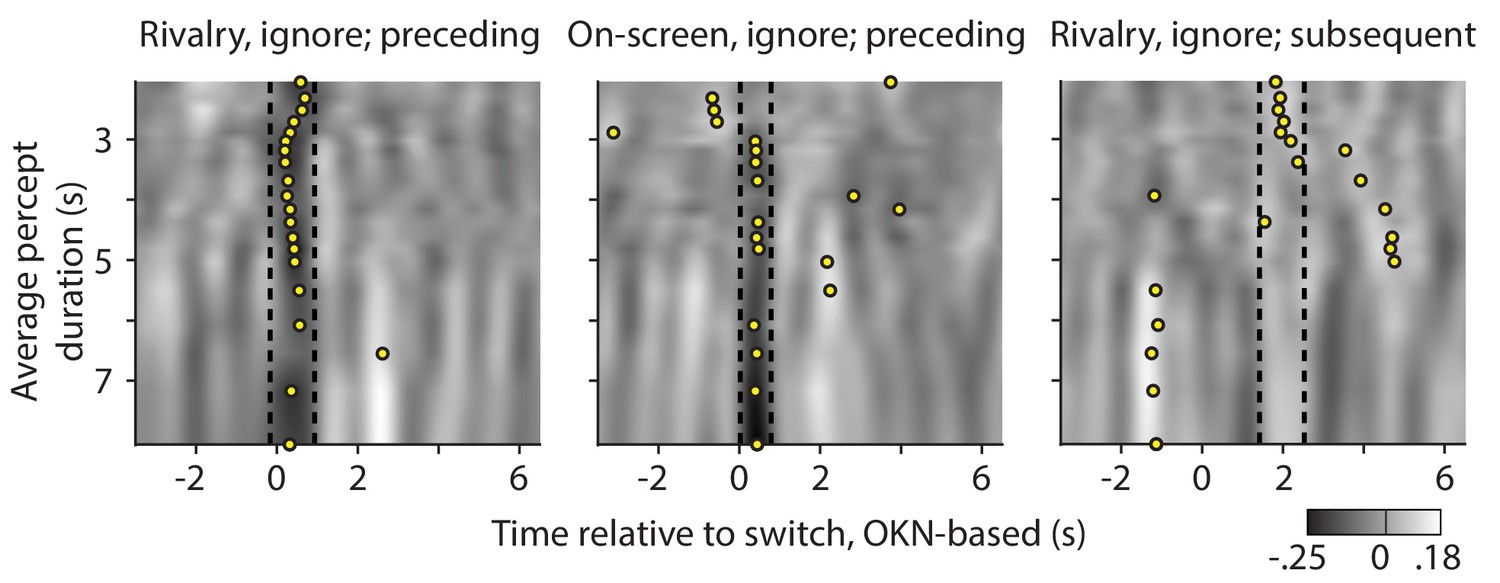
Re-analysis of the significant correlations between pupil response, and preceding (left and center plot) or subsequent (right plot) dominance duration, now separated out as a function of the observer's average percept duration.
Gray values quantify correlations between pupil change rate (z-scored area per second) and preceding or subsequent percept duration (z-scored); correlations that are also shown, but averaged across all observers, in main text Figures 5 and 6. Here the correlations are averaged per groups of five observers, sorted by their average percept duration along the y-axes. Dashed lines delineate the time periods within which the average across all observers is significantly different from zero (periods that are marked by black bars in main text Figures 5 and 6). For each group of five, a yellow disk indicates the middle of the time period at which the five-person average reaches its most extreme value, after smoothing this five-person average by averaging within a sliding window as wide as the interval delineated by the dashed lines.
Appendix 1—figure 8
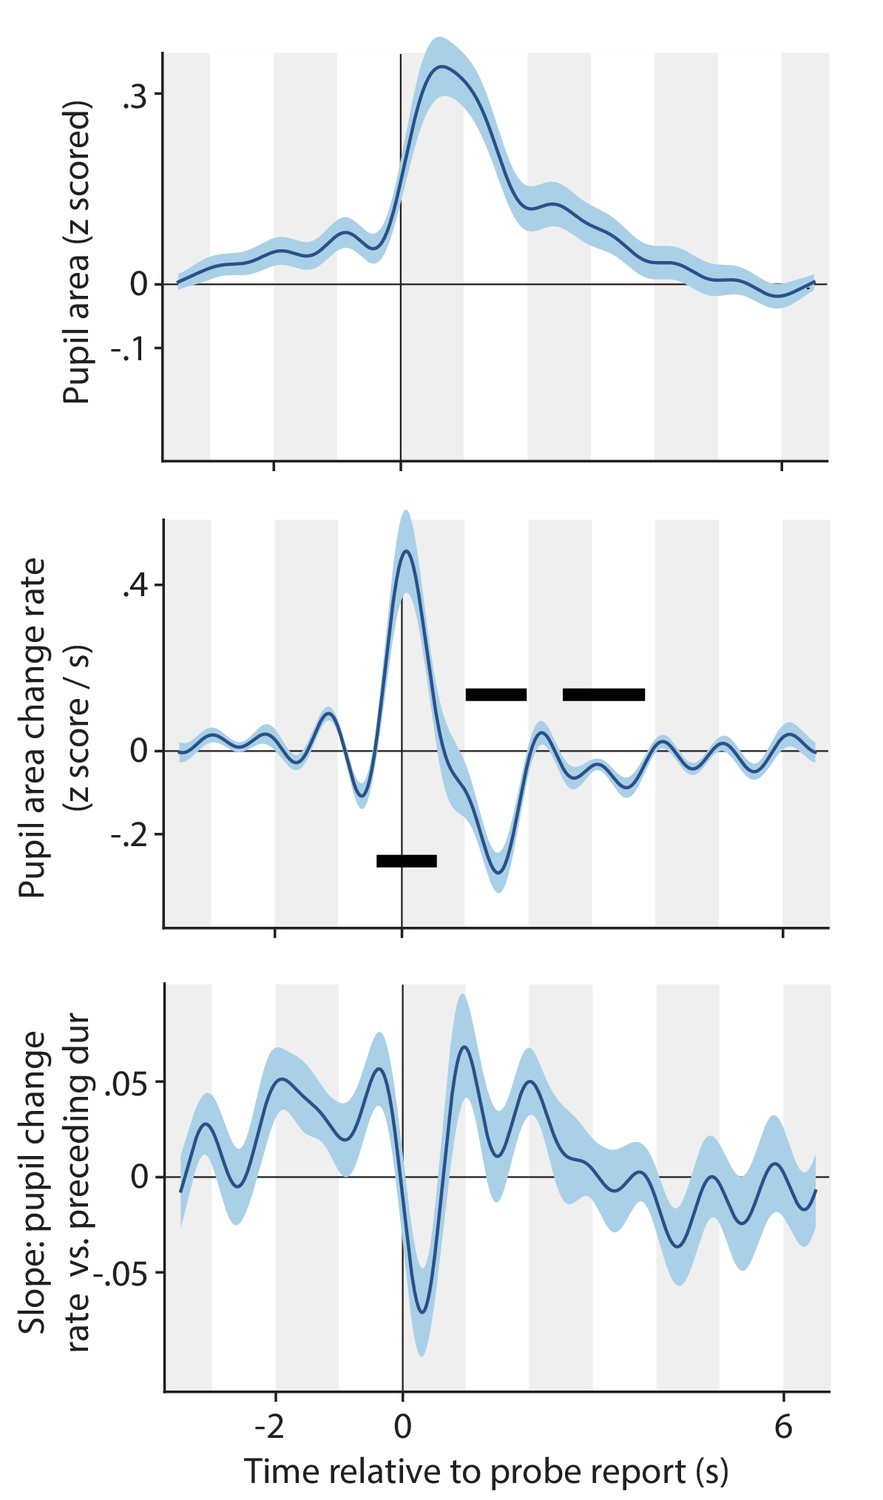
Pupil response associated with key presses in response to dot size probes in the Ignore conditions (both conditions combined).
Pupil size (top panel) and pupil change rate (center panel) around the time of key press events reporting a dot size probe. Bottom: correlation between pupil change rate (z-scored area per second) and the amount of time passed since the previous key press (z-scored). All plotting conventions are the same as those introduced in main text Figures 2, 4, 5 and 6.
Appendix 1—figure 9
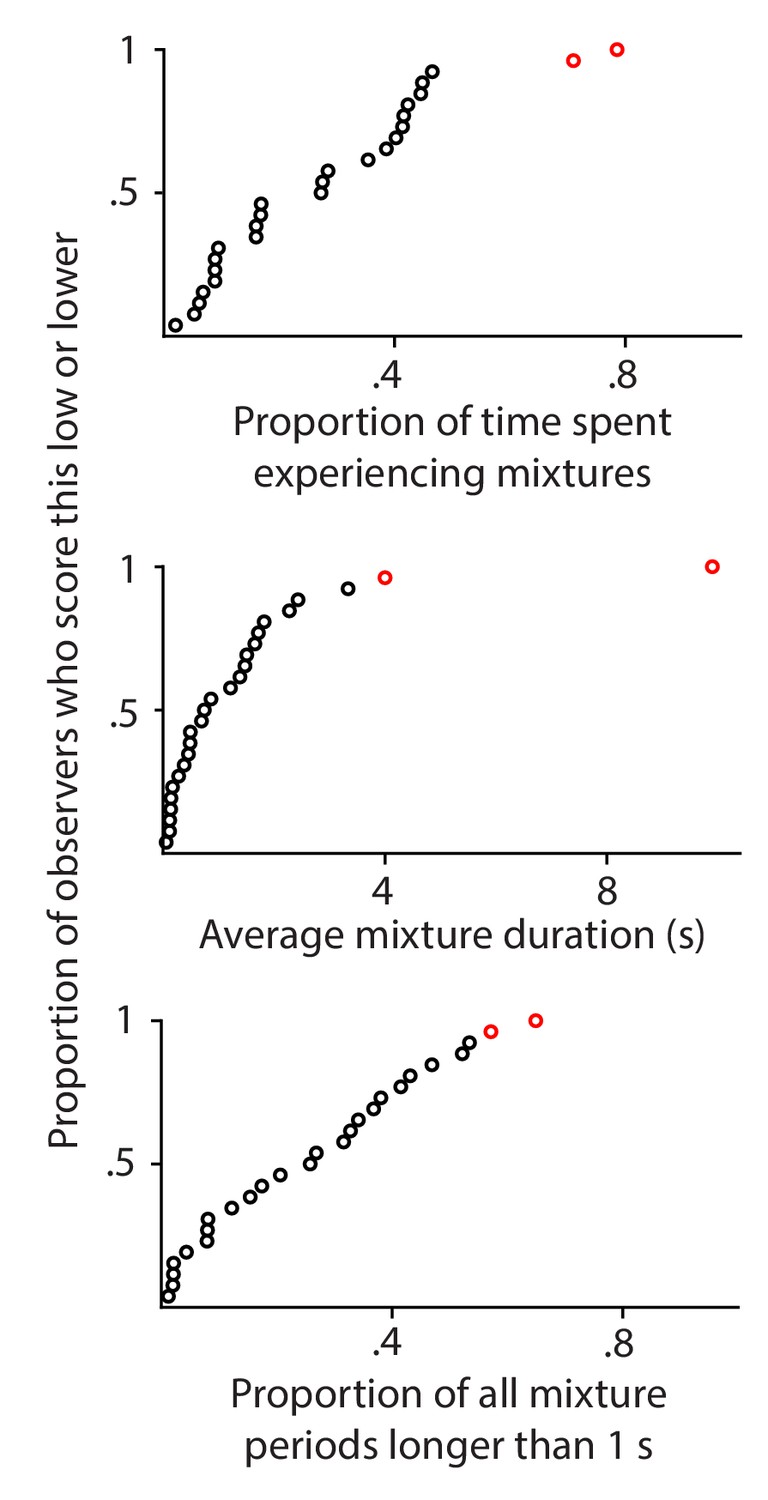
Perceptual mixtures: percepts that feature parts of both eyes' images.
Each plot uses a different measure to quantify the reported prevalence of perceptual mixtures for individual observers. Each disk corresponds to one observer. Data from the two observers that are indicated in red here were not included in the analyses for any of the other figures in this paper, because those observers scored high on all three indices of the prevalence of perceptual mixtures.
Additional files
Download links
A two-part list of links to download the article, or parts of the article, in various formats.
Downloads (link to download the article as PDF)
Open citations (links to open the citations from this article in various online reference manager services)
Cite this article (links to download the citations from this article in formats compatible with various reference manager tools)
Separable pupillary signatures of perception and action during perceptual multistability
eLife 10:e66161.
https://doi.org/10.7554/eLife.66161


